Sustained NPY signaling enables AgRP neurons to drive feeding
- University of California, San Francisco, United States
Figures
Figure 1 with 2 supplements
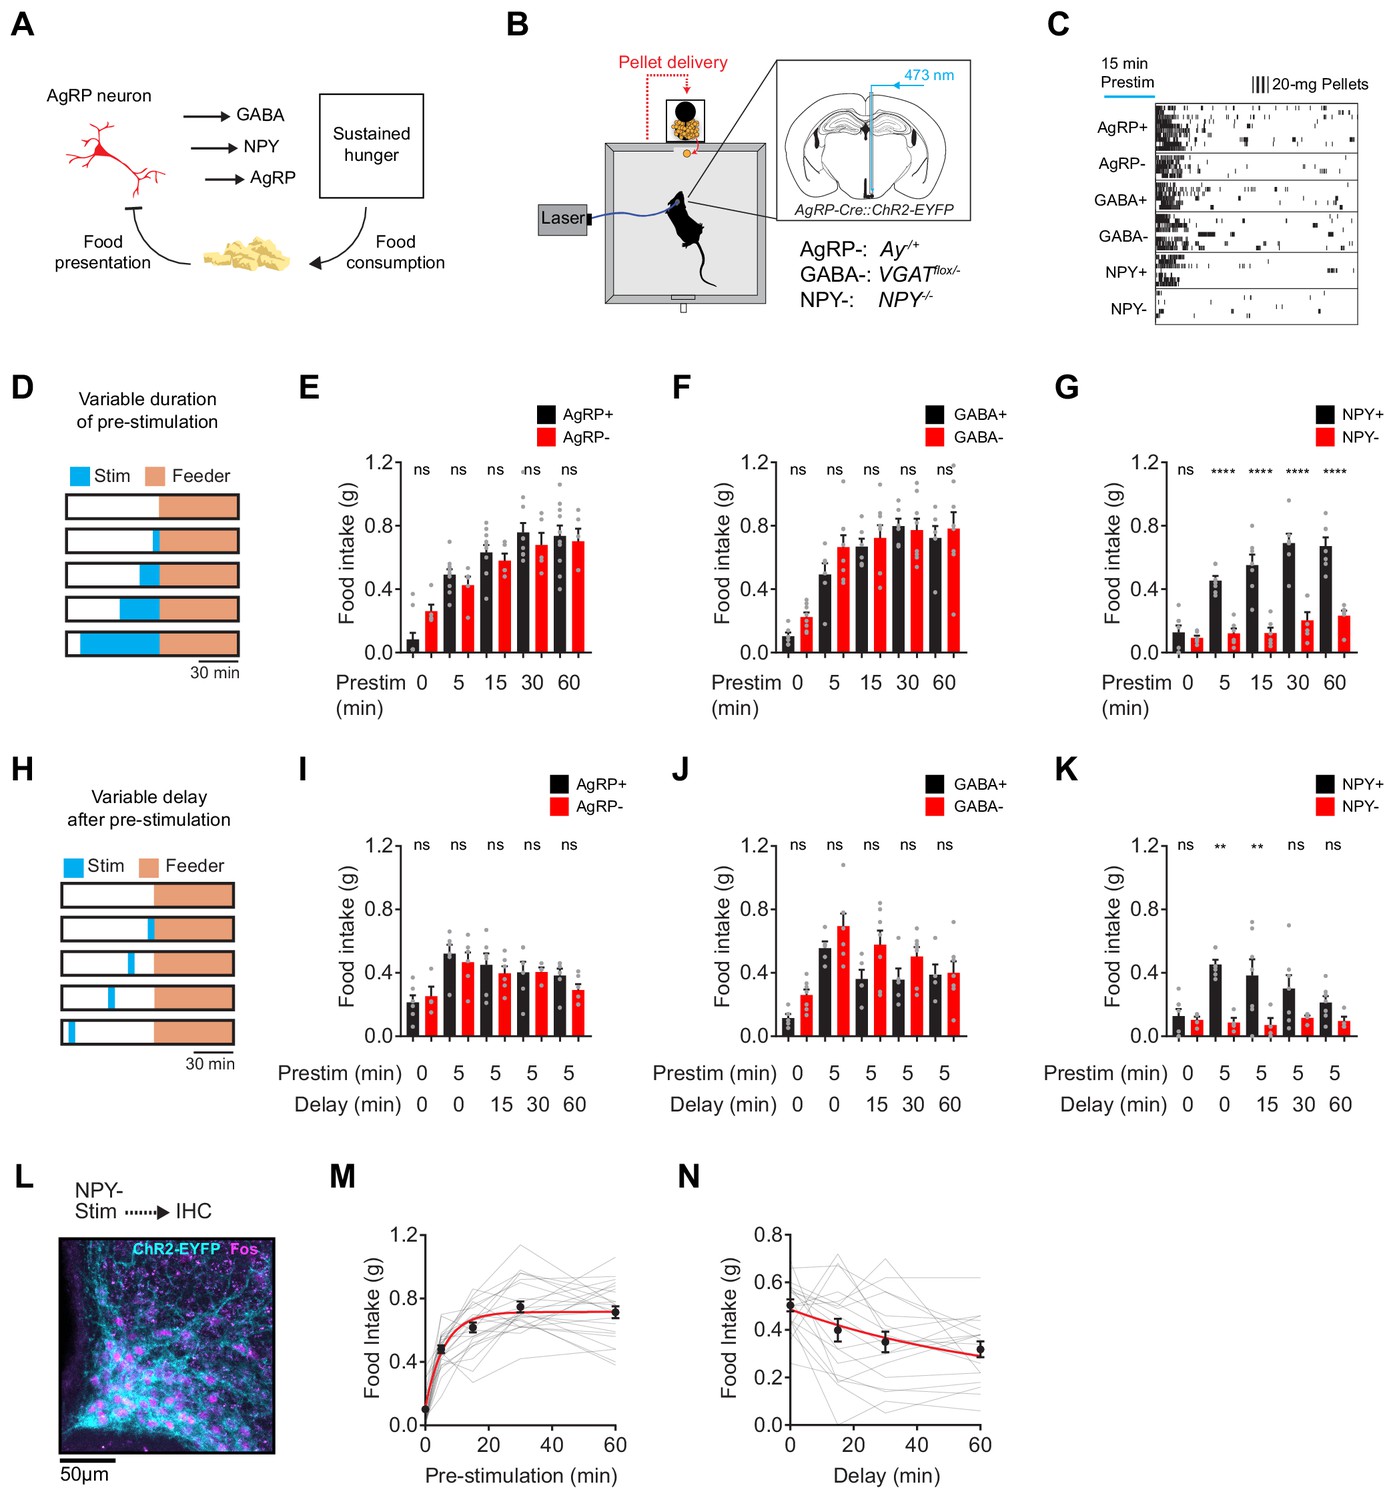
NPY is uniquely required for sustained hunger driven by AgRP neurons.
(a) AgRP neurons are rapidly inhibited by food presentation but nevertheless promote food intake through a sustained hunger signal. (b) System for measuring food intake in response to activation of AgRP neurons in animals with blockade of signaling through AgRP, GABA or NPY (indicated as -) or littermate controls (indicated as +). (c) Raster plot showing pellet consumption of mice with different genotypes in response to pre-stimulation of AgRP neurons (15 min). Each row shows a representative trial from an individual mouse. (d) Feeding behavior paradigm with variable pre-stimulation lengths (blue). (e-g) Food intake (1 hr) following pre-stimulation of variable lengths. Genotypes: AgRP+ (black; N = 10) and AgRP- (red; N = 5) (e), GABA+ (black; N = 6) and GABA- (red; N = 8) (f), and NPY+ (black; N = 7) and NPY- (red; N = 6) (g). (h) Feeding behavior paradigm with variable delay length inserted between the end of pre-stimulation and start of food availability. (i-k) Food intake (1 hr) following pre-stimulation (5 min) and delay of varying lengths. Genotypes: AgRP+ (black; N = 6) and AgRP- (red; N = 6) (i), GABA+ (black; N = 5) and GABA- (red; N = 7) (j), and NPY+ (black; N = 7) and NPY- (red; N = 4) (k). (l) Image of ARC from NPY- mice that received laser stimulation (30 min) in the absence of food before perfusion. Sample was stained for ChR2-EYFP (cyan) and Fos (magenta). (m) Logarithmic growth model of relationship between food intake and pre-stimulation duration (N = 23 mice). (n) Exponential decay model of the relationship between food intake and delay length (N = 18 mice). Error bars in e-g, i-k, m and n represent mean ± SEM. Holm-Sidak multiple comparisons test was used to report adjusted P-values in e-g and i-k. *p<0.05, **p<0.01, ***p<0.001, ****p<0.0001 or ns (not significant) compares adjacent control (black) and experimental (red) group with same pre-stimulation protocol.
Figure 1—figure supplement 1
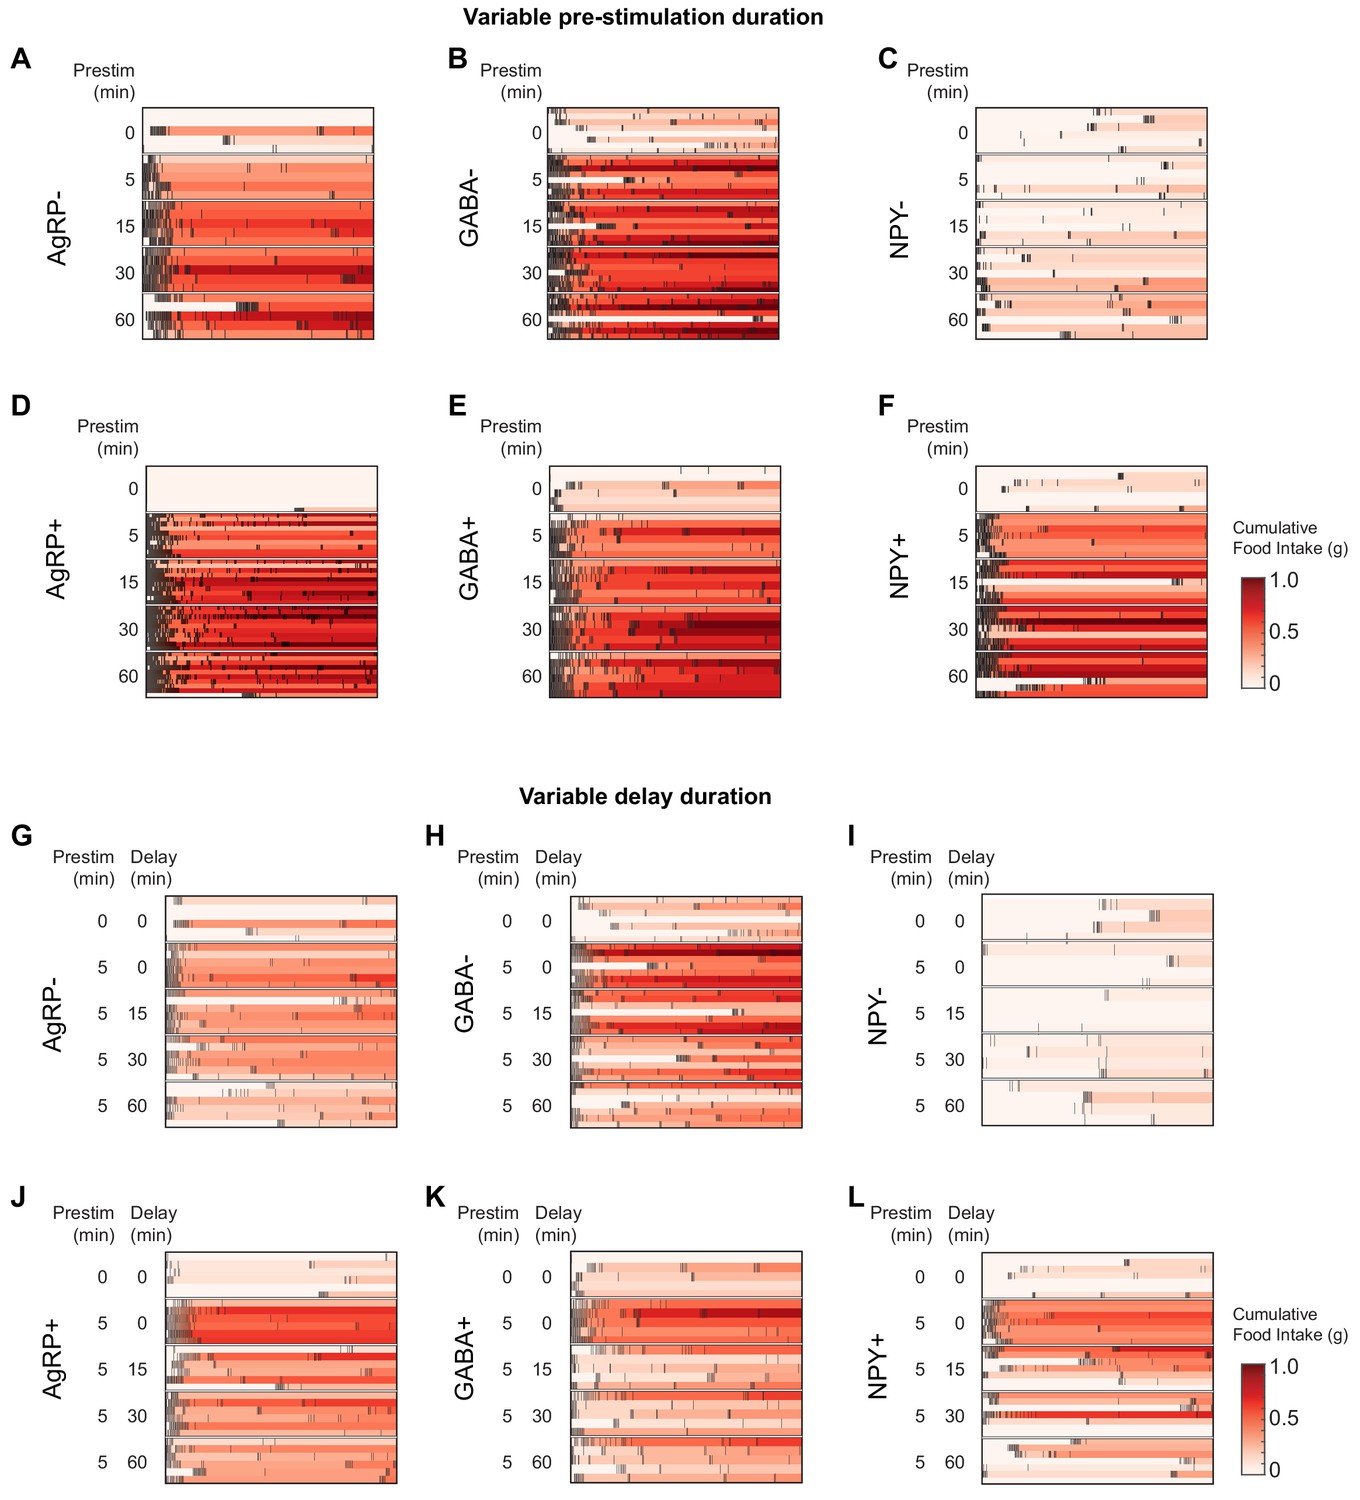
Temporal pattern of pellet consumption in response to different pre-stimulation protocols.
(a–f) Raster plot of pellet intake (1 hr) by AgRP- (a), AgRP+ (d), GABA- (b), GABA+ (e), NPY- (c) and NPY+ (f) mice in response to pre-stimulation of variable length. Red color indicates cumulative food consumption at each time point. (g–l) Raster plot of pellet intake (1 hr) by AgRP- (g), AgRP+ (j), GABA- (h), GABA+ (k), NPY- (i) and NPY+ (l) mice in response to pre-stimulation (5 min) followed by a delay of variable length.
Figure 1—figure supplement 2
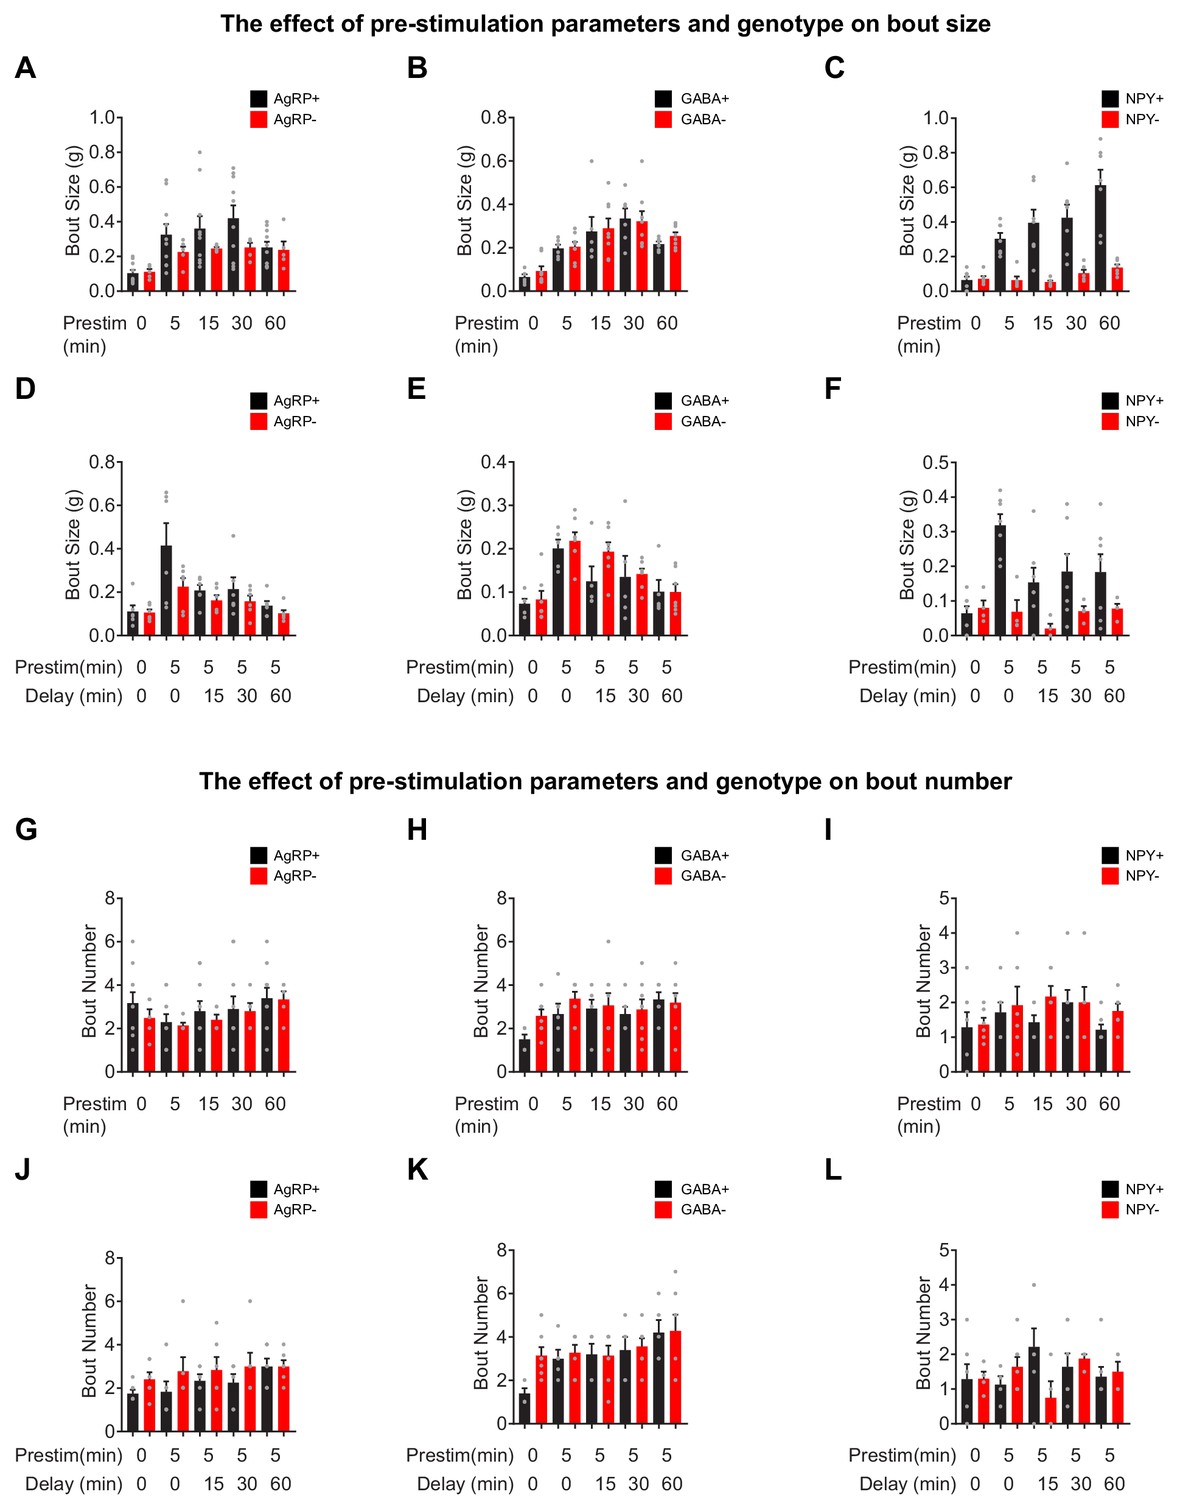
Bout analysis of food intake in response to pre-stimulation a-c.
Bout size for food intake (1 hr) by AgRP+ (N = 10) and AgRP- (N = 5) (a), GABA+ (N = 6) and GABA- (N = 8) (b), and NPY+ (N = 7) and NPY- (N = 6) (c) mice in response to pre-stimulation of variable length. (d–f) Bout size for food intake (1 hr) by AgRP+ (N = 6) and AgRP- (N = 6) (d), GABA+ (N = 5) and GABA- (N = 7) (e), and NPY+ (N = 7) and NPY- (N = 4) (f) mice in response to pre-stimulation followed by a delay of variable length. (g–i) Bout number for food intake (1 hr) by AgRP+ (N = 10) and AgRP- (N = 5) (g), GABA+ (N = 6) and GABA- (N = 8) (h), and NPY+ (N = 7) and NPY- (N = 6) (i) mice in response to pre-stimulation of variable length. (j–l) Bout size for food intake (1 hr) by AgRP+ (N = 6) and AgRP- (N = 6) (j), GABA+ (N = 5) and GABA- (N = 7) (k), and NPY+ (N = 7) and NPY- (N = 4) (l) mice in response to pre-stimulation (5 min) followed by a delay of variable length.
Figure 2
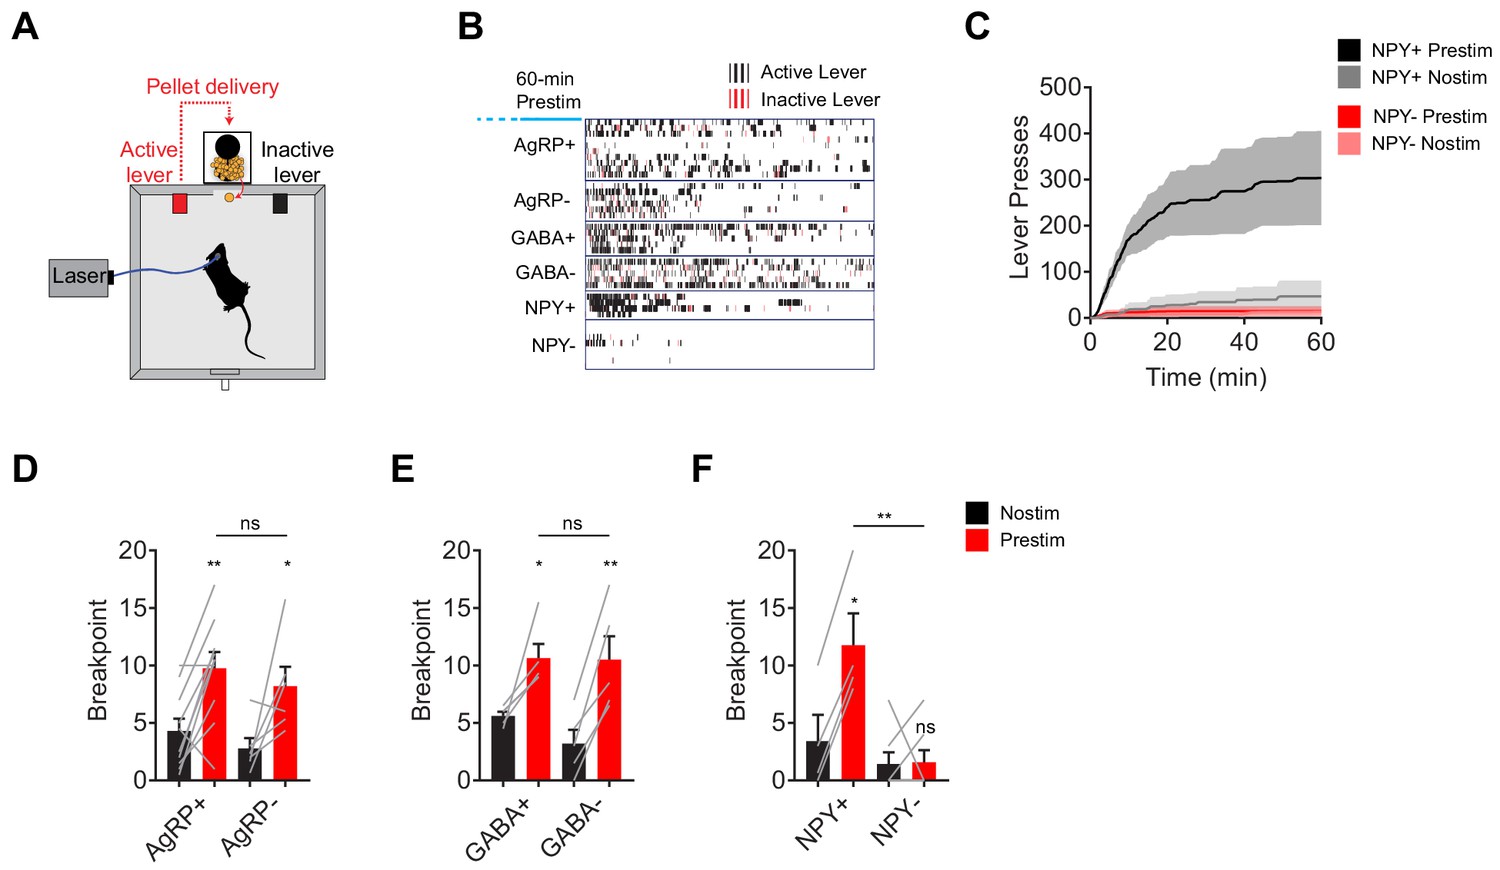
NPY, but not GABA or AgRP, is required for the sustained effect of AgRP neuron stimulation on appetitive behavior.
(a) Schematic for progressive ratio three tasks, in which each successive pellet of food requires the mouse to press the lever three more times than the previous pellet. (b) Raster plot showing active (black) and inactive (red) lever presses of mice of different genotypes following pre-stimulation of AgRP neurons (1 hr). (c) Cumulative number of lever presses for NPY+ (N = 4) and NPY- (N = 7) mice in response to pre-stimulation or no stimulation of AgRP neurons. d-f, Breakpoint of AgRP+ (N = 10) and AgRP- (N = 6) (d), GABA+ (N = 5) and GABA- (N = 5) (e), and NPY+ (N = 4) and NPY- (N = 7) (f) mice in progressive ratio three after pre-stimulation (red) or no stimulation (black). Filled area in c and error bars in d-f represents mean ± SEM. Holm-Sidak multiple comparisons test was used to report adjusted P-value in d-f. *p<0.05, **p<0.01, or ns (not significant) compares adjacent control (black) and experimental (red) group with same pre-stimulation protocol, or compares pairs of groups that are indicated by horizontal lines above.
Figure 3
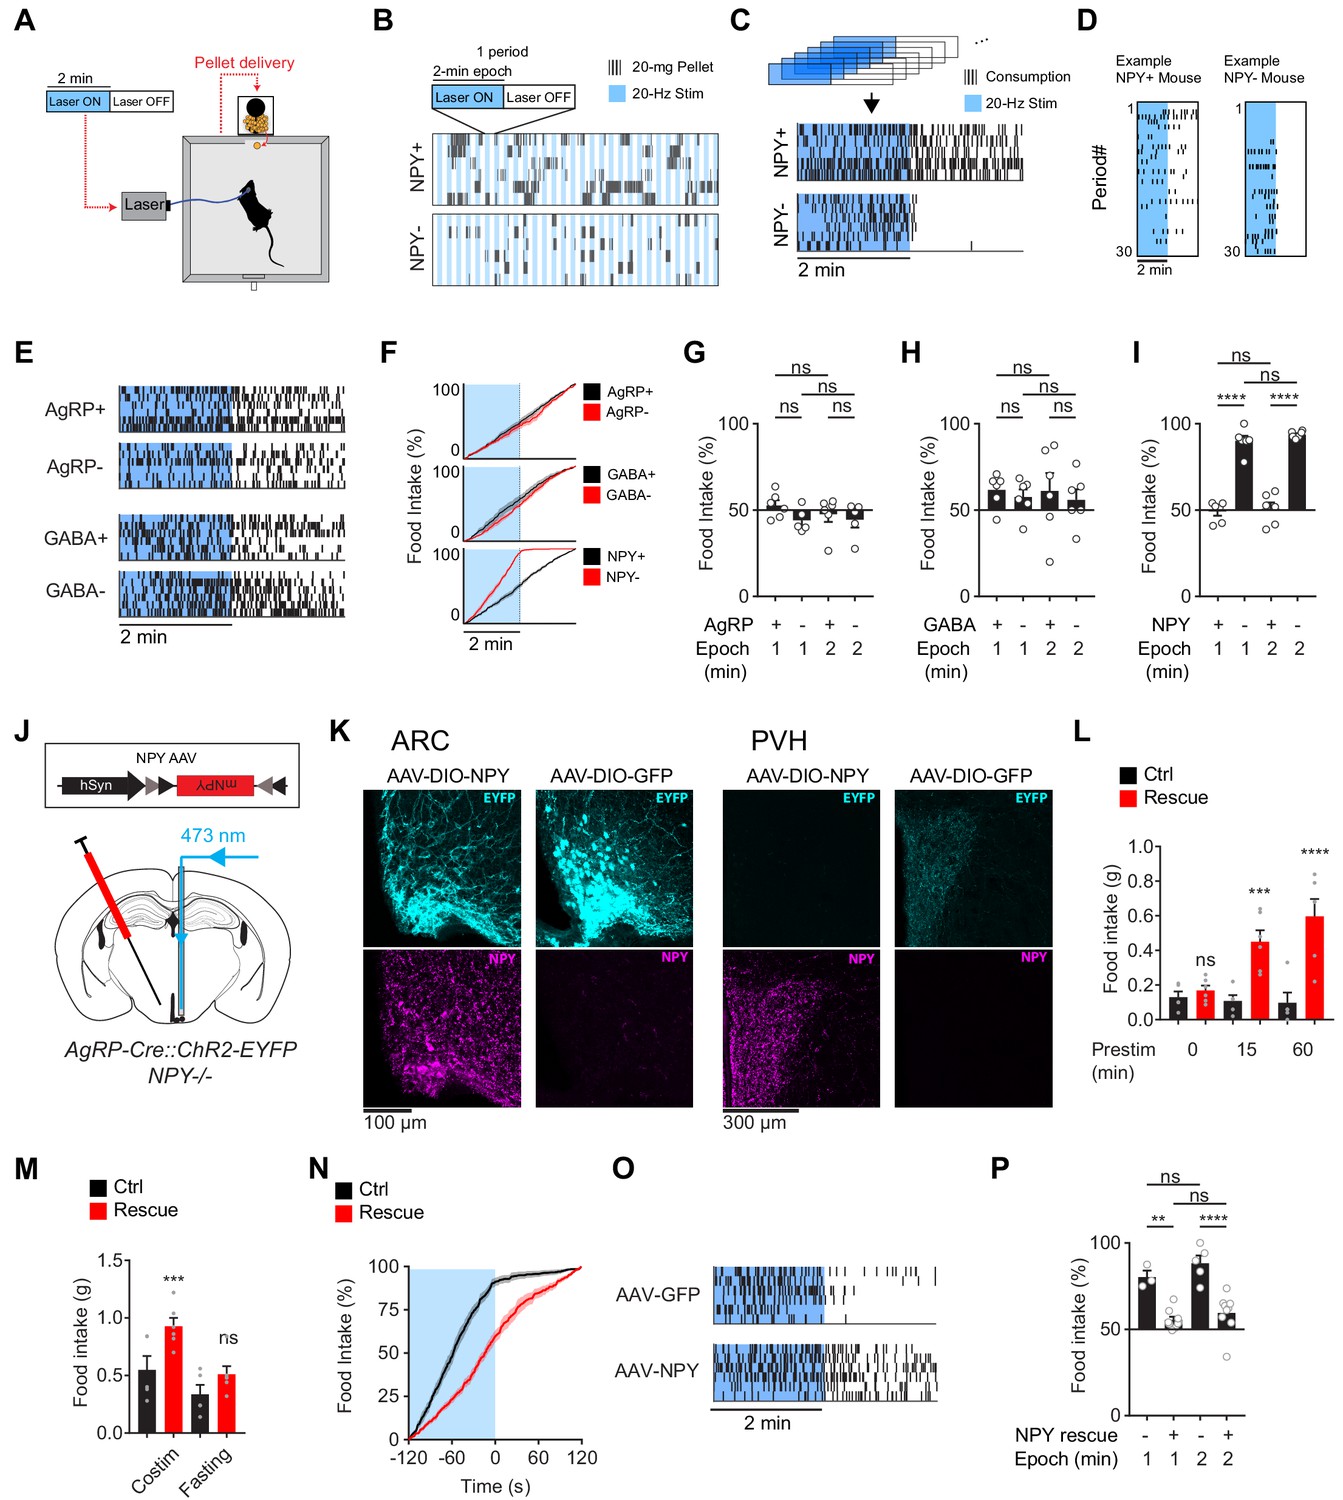
The requirement for NPY is rescued by reexpression of NPY in AgRP neurons.
(a) Experimental setup for optogenetic stimulation with alternating laser ON and OFF epochs. (b) Pattern of pellet consumption for NPY +and NPY- mice in response to alternating laser ON and OFF epochs (2 min each). Each pair of laser ON and OFF epochs (period) is 4 min and the entire trial is 2 hr. Each row is a representative trial from an individual mouse. (c) Superimposed raster plots showing total pellet consumption of NPY+ and NPY- mice in relationship to the onset and offset of opto-stimulation for a 2 hr trial. Each row is a representative trial from an individual mouse. Raster plots were generated by superimposing the pellet consumption pattern from all periods of a trial. (d) Example of the temporal pattern of pellet consumption for a single NPY+ and NPY- mouse with successive periods of a single trial arranged vertically. (e) Superimposed raster plots of total pellet consumption across a 2 hr trial by AgRP+, AgRP-, GABA+, and GABA- mice in relationship to opto-stimulation pattern. (f) Cumulative pellet consumption by AgRP+ (N = 6), AgRP- (N = 5), GABA+ (N = 6), GABA- (N = 6), NPY+ (N = 5) and NPY- (N = 6) mice in relationship to opto-stimulation pattern. g-i, Percentage of food intake that occurs during the laser ON epochs of an intermittent stimulation trial by AgRP+ (N = 6) and AgRP- (N = 5) (g), GABA+ (N = 6) and GABA- (N = 6) (h), and NPY+ (N = 5) and NPY- (N = 6) (i) mice. (j) Schematic for the rescue of NPY expression selectively in AgRP neurons. (k) Expression of EYFP (cyan) and NPY (magenta) in ARC (left) and PVH (right) of NPY- animals with or without NPY re-expression. Note that ChR2-EYFP is dim but visible in PVH of AAV-NPY injected animals. (l) Food intake (1 hr) by NPY rescue (red; N = 6) and control (black; N = 5) mice in response to different pre-stimulation protocols. (m) Food intake (1 hr) by NPY rescue (red; N = 6) and control (black; N = 5) groups in response to co-stimulation and overnight fasting (n) Cumulative pellet consumption by NPY rescue (N = 9) and control (N = 6) mice in relation to laser ON and OFF epochs. (o) Superimposed raster plots showing pellet consumption by NPY rescue and control mice in relation to the laser ON and OFF periods of a 2 hr trial. (p) Percentage of food intake by NPY rescue (N = 9) and control (N = 6) mice that occurs during the laser ON period. Filled area in f and n, error bars in g-i, l-m, and p represent mean ± SEM. Holm-Sidak multiple comparisons test was used to report adjusted P-values in g-i, l-m, and p. *p<0.05, **p<0.01, ***p<0.001, ****p<0.0001 or ns (not significant) compares adjacent control (black) and experimental (red) groups with same treatment, or compares pairs of groups indicated by the horizontal lines above.
Figure 4 with 1 supplement
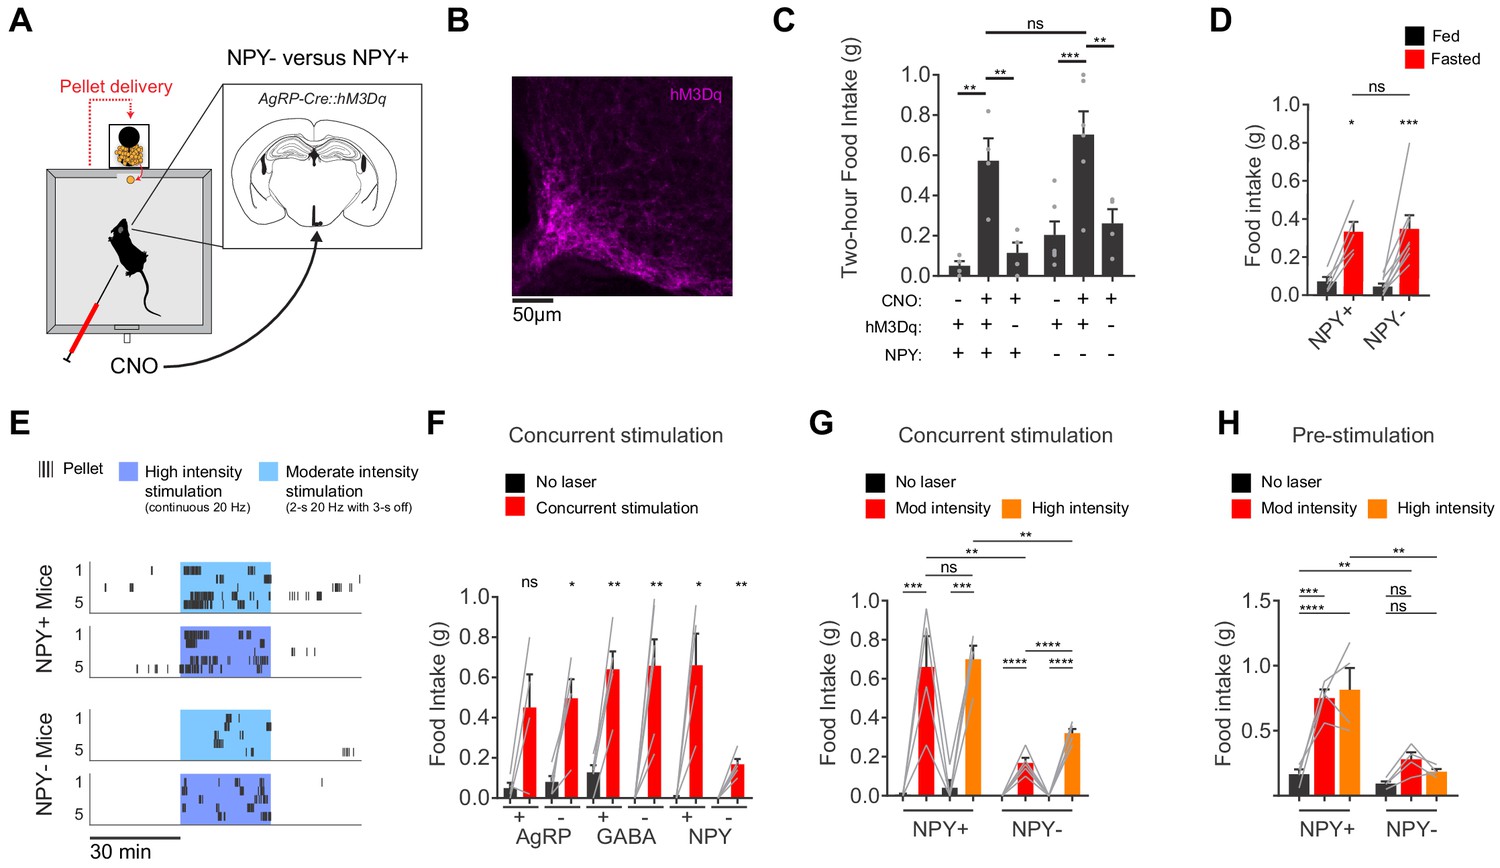
AgRP neurons show variable responses to concurrent stimulation in the absence of NPY.
(a) Schematic for measurement of food intake during chemogenetic stimulation of AgRP neurons. (b) Expression of hM3Dq in AgRP neurons. Sample was stained for the HA tag on hM3Dq (magenta). (c) Food intake (2 hr) for NPY+ (hM3Dq+ N = 4; hM3Dq- N = 4) and NPY- (hM3Dq+ N = 6; hM3Dq- N = 4) mice following chemogenetic stimulation (CNO, 0.3 mg/kg) or control treatment. (d) Food intake (1 hr) for NPY+ (N = 5) and NPY- (N = 8) mice after overnight fasting. (e) Raster plot showing temporal pattern of pellet (20 mg) consumption by NPY- and NPY +mice in response to concurrent stimulation at high intensity (20 Hz, continuous) or moderate intensity (20 Hz, interleaved with 2 s ON/3 s OFF). (f) Food intake (30 min) for AgRP+ (N = 4) and AgRP- (N = 5), GABA+ (N = 5) and GABA- (N = 6), and NPY+ (N = 4) and NPY- (N = 5) mice in response to no stimulation (black) and concurrent stimulation (red; moderate-intensity). (g) Food intake (30 min) for NPY+ (N = 4) and NPY- (N = 5) mice in response to no stimulation (black), moderate intensity concurrent stimulation (red) and high intensity concurrent stimulation (orange). (h) Food intake (60 min) for NPY+ (N = 4) and NPY- (N = 4) mice in response to no stimulation (black), moderate intensity pre-stimulation (red) and high intensity pre-stimulation (orange). Error bars in c-e and g-j represent mean ± SEM. Holm-Sidak multiple comparisons test was used to report adjusted P-values in c-d and f-h. *p<0.05, **p<0.01, ***p<0.001, ****p<0.0001 or ns (not significant). Black lines denote the pairs that are being compared. In f, adjacent control (black) and experimental (red) groups subject to the same pre-stimulation protocol are compared.
Figure 4—figure supplement 1
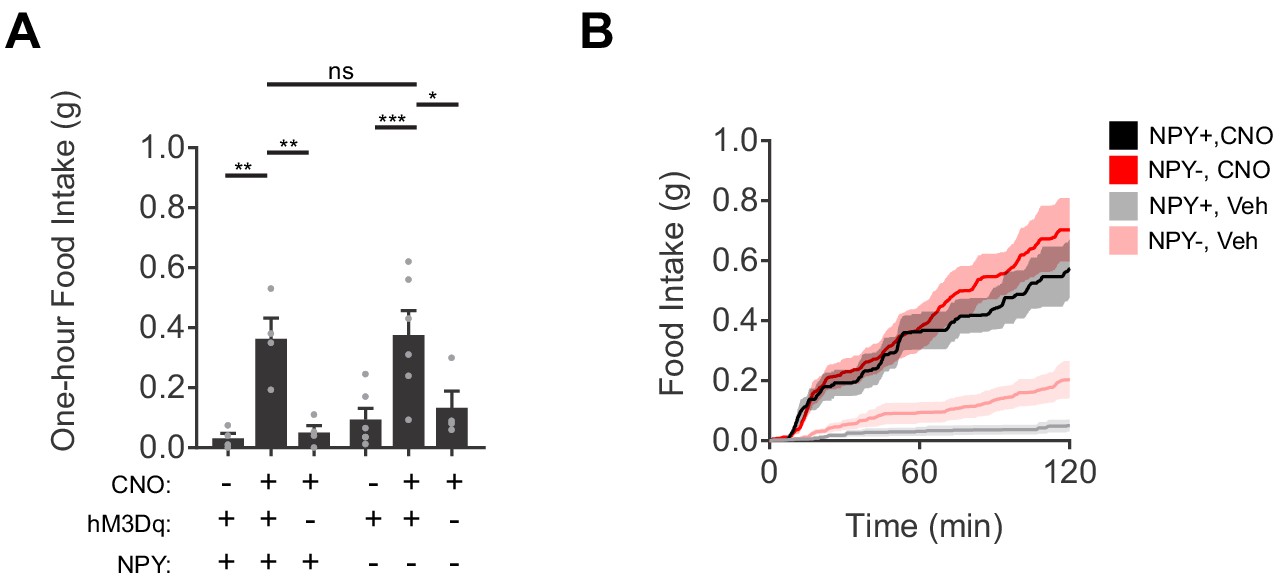
Chemogenetic activation of AgRP neurons induces feeding in mice with or without NPY.
(a) Food intake (1 hr) for NPY+ (hM3Dq+ N = 4; hM3Dq- N = 4) and NPY- (hM3Dq+ N = 6; hM3Dq- N = 4) mice following chemogenetic stimulation (CNO, 0.3 mg/kg) or control treatment. (b) Cumulative distribution function of food intake for NPY+ and NPY- mice in response to CNO mediated stimulation of AgRP neurons or control treatment (NPY+ N = 4; NPY- N = 6). Holm-Sidak multiple comparisons test was used to report adjusted P-values in (c-d) and (f-h). *p<0.05, **p<0.01, ***p<0.001, ****p<0.0001 or ns (not significant). In b, thick lines represent averaged data and shaded area denote SEM.
Tables
Key resources table
| Reagent type (species) or resource | Designation | Source or reference | Identifiers | Additional information |
|---|---|---|---|---|
| Genetic reagent (Mus musculus) | B6; Agrptm1(cre)Lowl/J | Jackson Labs Stock | #012899 | |
| Genetic reagent (Mus musculus) | B6; 129S-Gt(ROSA)26Sortm32(CAG-COP4*H134R/EYFP)Hze/J; | Jackson Labs Stock | #012569 | |
| Genetic reagent (Mus musculus) | B6; Tg (CAG-CHRM3,-mCitrine)1Ute/J | Jackson Labs Stock | #026220 | |
| Genetic reagent (Mus musculus) | B6; Cg-Ay/J | Jackson Labs Stock | #000021 | |
| Genetic reagent (Mus musculus) | Slc32a1tm1Lowl/J | Jackson Labs Stock | #012897 | |
| Genetic reagent (Mus musculus) | 129S-Npytm1Rpa/J | Jackson Labs Stock | #004545 | |
| Antibody | anti-NPY (rabbit monoclonal) | Cell Signaling | 11976 | (1:1000) dilution |
| Recombinant DNA reagent | pAAV-EF1a-DIO-NPY | this paper | NA | plasmid with AAV backbone to express NPY in the presence of Cre recombinase |
Additional files
-
Transparent reporting form
- https://doi.org/10.7554/eLife.46348.015
Download links
A two-part list of links to download the article, or parts of the article, in various formats.
Downloads (link to download the article as PDF)
Open citations (links to open the citations from this article in various online reference manager services)
Cite this article (links to download the citations from this article in formats compatible with various reference manager tools)
Sustained NPY signaling enables AgRP neurons to drive feeding
eLife 8:e46348.
https://doi.org/10.7554/eLife.46348


