Merging organoid and organ-on-a-chip technology to generate complex multi-layer tissue models in a human retina-on-a-chip platform
- Eberhard Karls University Tübingen, Germany
- Fraunhofer Institute for Interfacial Engineering and Biotechnology IGB, Germany
- Natural and Medical Sciences Institute (NMI), Germany
- Cardiovascular Research Laboratories, David Geffen School of Medicine, United States
Figures
Figure 1
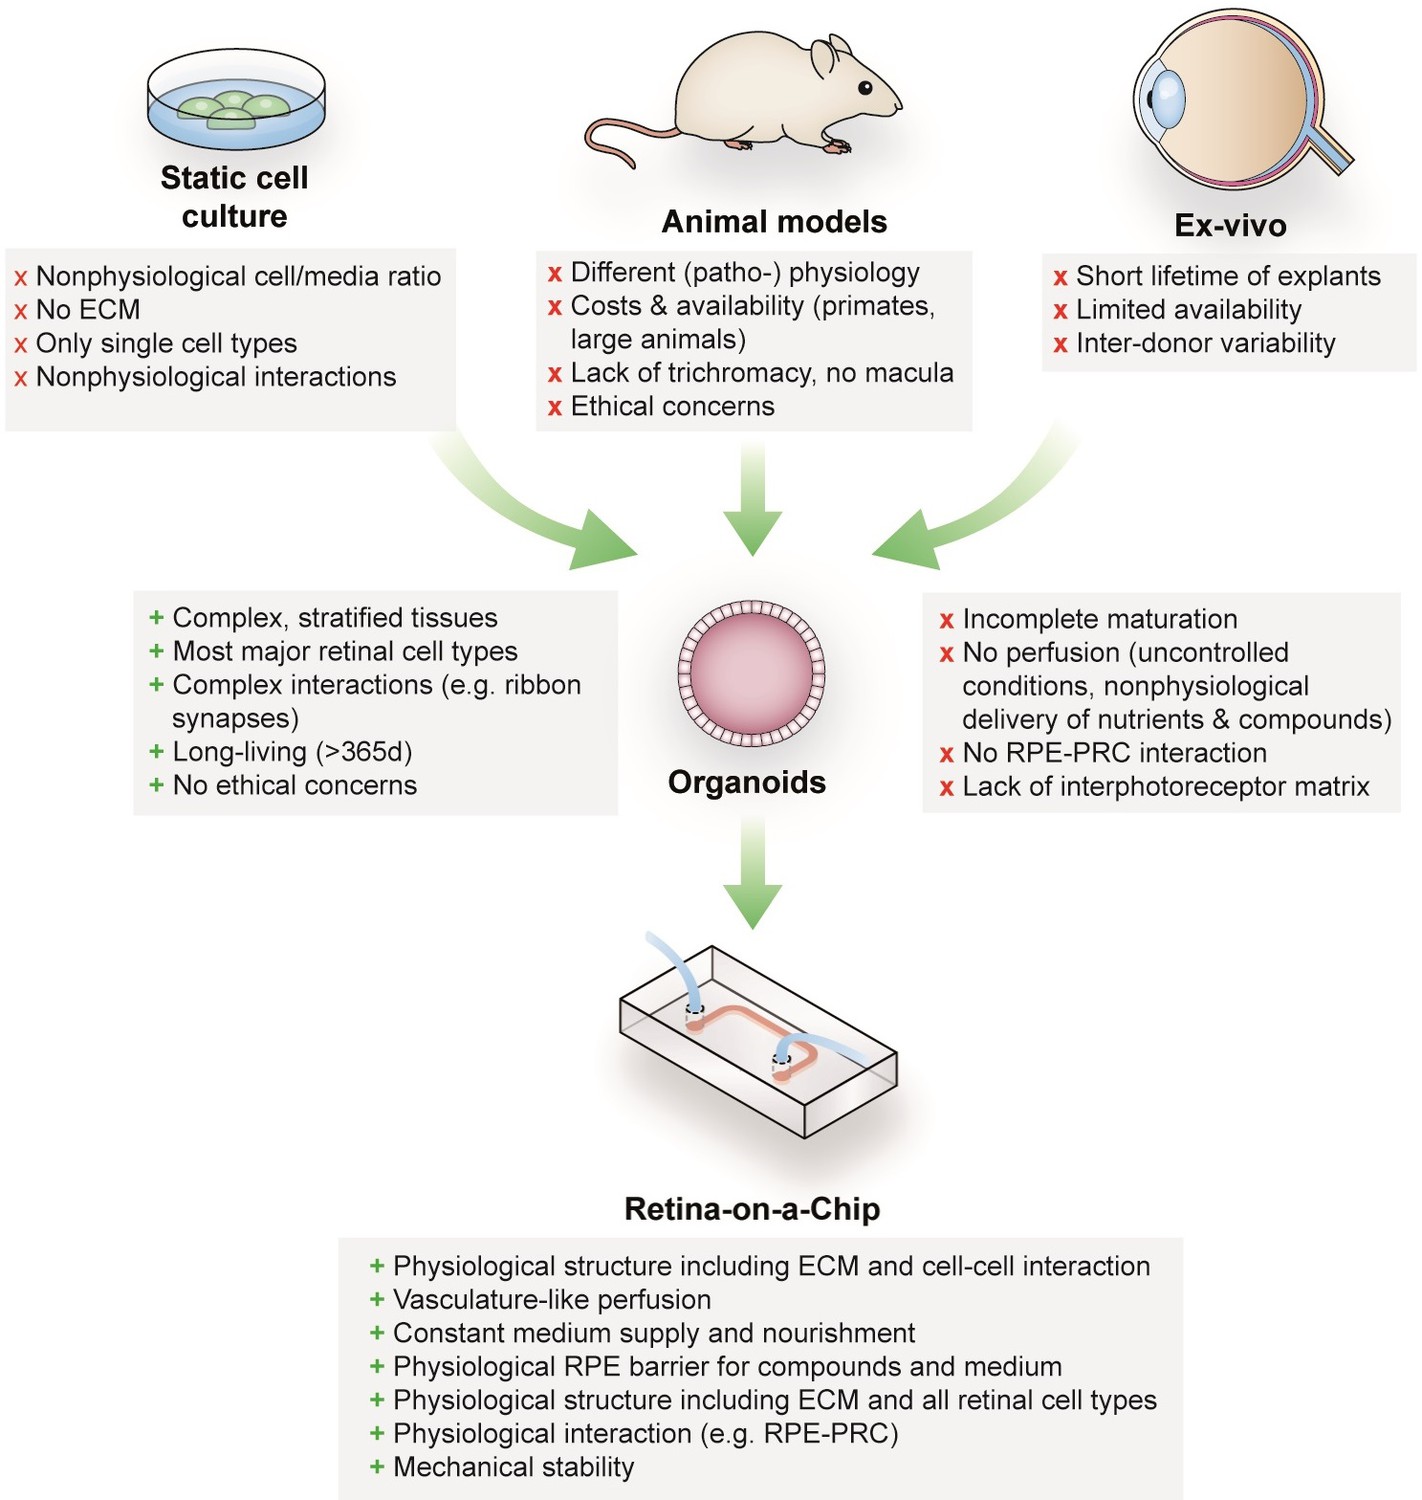
Advantages and limitations of retinal models for drug development and mechanistic research.
https://doi.org/10.7554/eLife.46188.002
Figure 2 with 1 supplement

Characterization of retinal organoids.
(a) Brightfield image of a day 180 RO in dish culture. (b) Magnified area of a) highlighting inner and outer segment-like structures. (c) Day 180 ROs cryosectioned and immunostained for the rod marker rhodopsin (red), the outer segment marker ROM1 (green) and phalloidin (white) visualizing the outer limiting membrane. (d) Day 180 ROs sectioned and immunostained for the rod marker rhodopsin (red) and the outer segment marker ROM1 (green). (e) Day 180 ROs sectioned and immunostained for the rod marker rhodopsin (green) and for PNA lectin (red). (f) 3D visualization of whole-mount staining of day 180 RO stained for rhodopsin (red) and ROM1 (green). Bars indicate a) 250 µm b) 50 µm c) 100 µm d-f) 20 µm. Blue: DAPI.
Figure 2—figure supplement 1
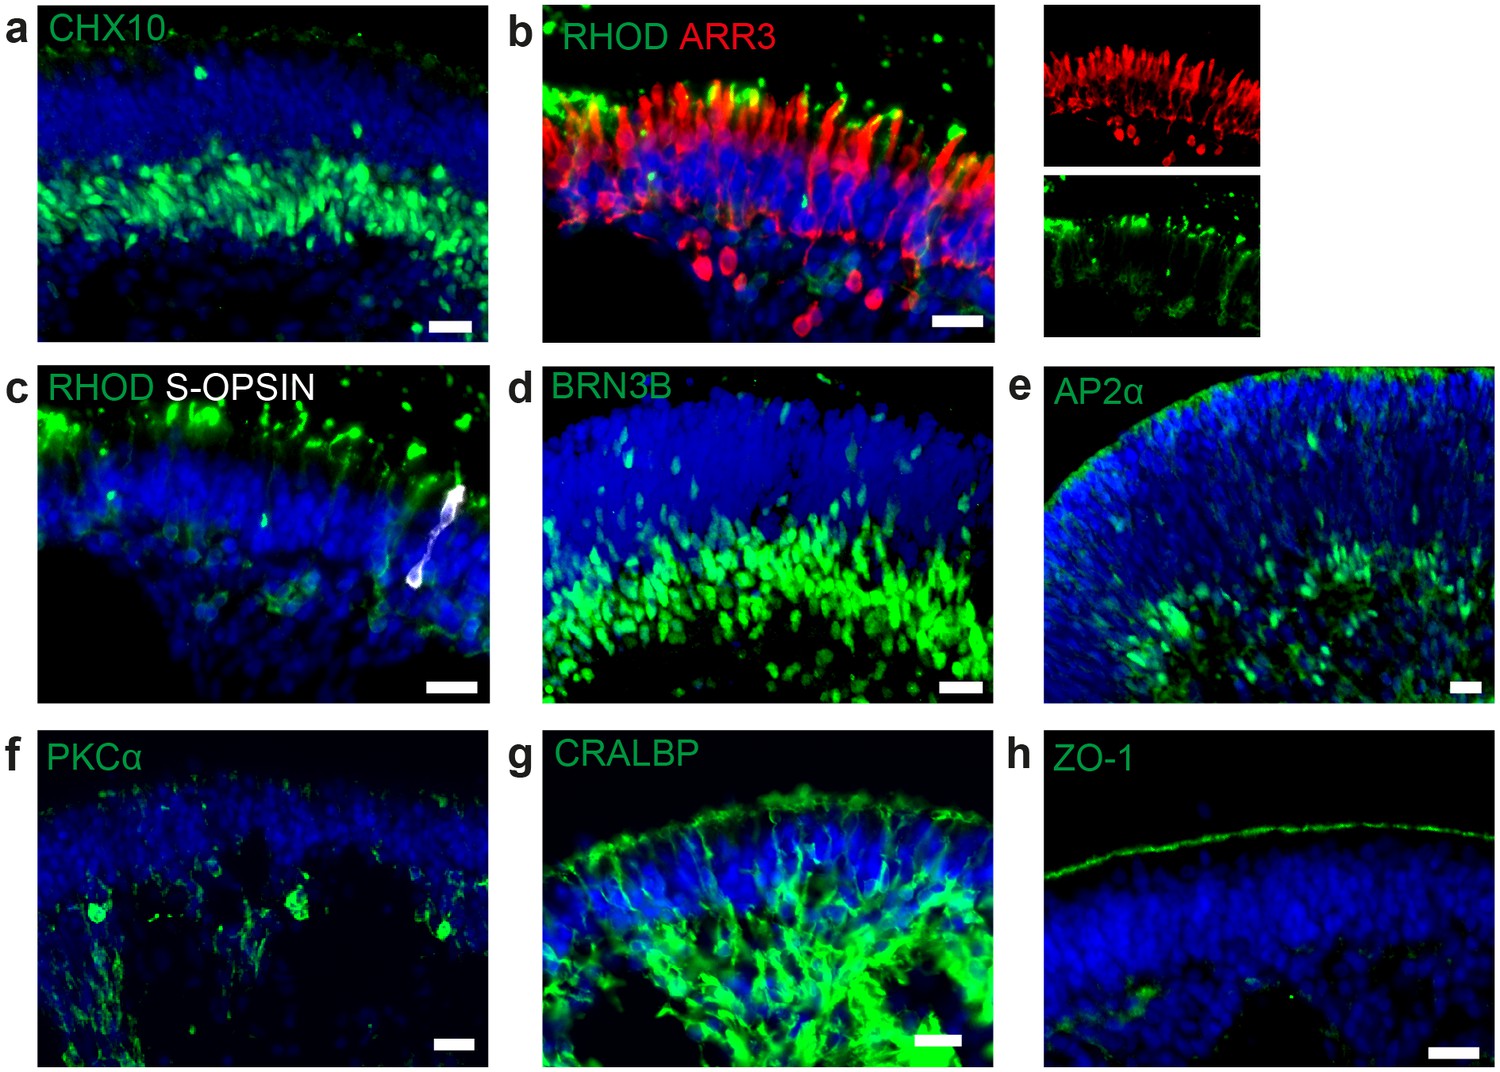
Cell types in dish cultured hiPSC-derived retinal organoids.
(a) d190 RO stained for the neural retina marker CHX10 (green). (b) d260 RO stained for rod marker rhodopsin (green) and cone marker arrestin 3 (ARR3, red) (c) d260 RO stained for rod marker rhodopsin (green) and s-cone marker s-opsin (white). (d) d42 RO stained for ganglion cell marker BRN3B (green). (e) RO stained for amacrine marker AP2α (green). (f) d260 RO stained for bipolar cell marker PKCα (green). (g) d260 RO stained for Müller glia marker CRALBP (green) (h) d260 RO stained for OLM marker ZO-1 (green). Scale bars: a-h) 20 µm. Blue: DAPI.
Figure 3 with 1 supplement
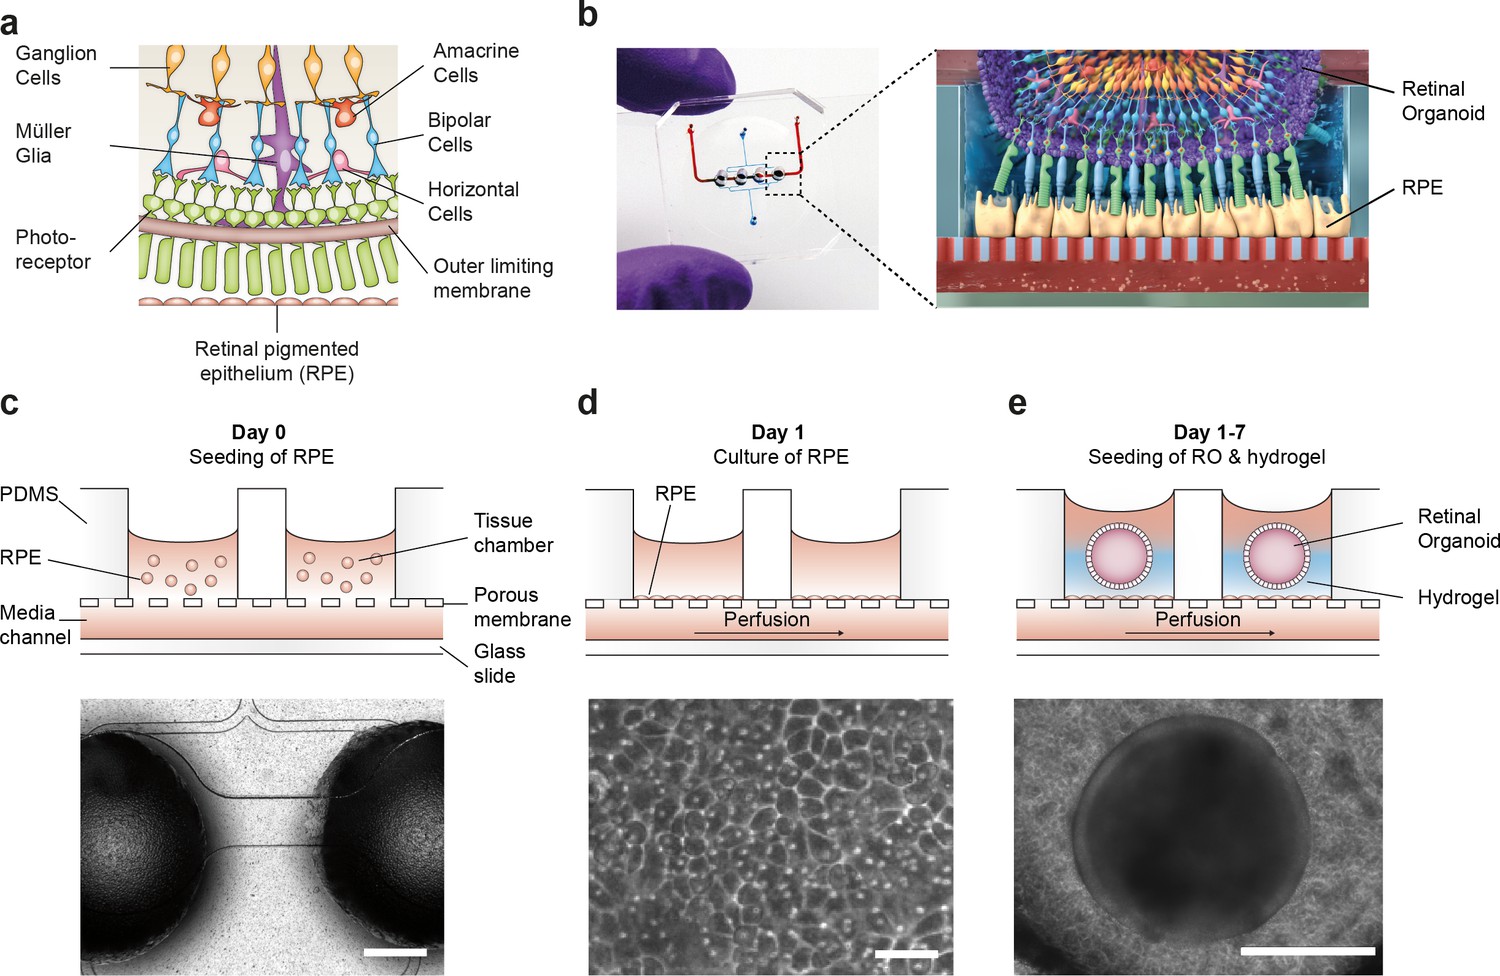
Microfluidic RoC.
(a) Schematic representation of the human retinal composition and cell types in vivo. (b) Photo (left) of the RoC and (right) representation of the RO photoreceptor and RPE interaction. (c) RPE cells are seeded into the device, (d) forming a densely packed monolayer after 24 hr of culture. (e) ROs and the hyaluronic acid-based hydrogel are directly loaded from the top into the well and onto the RPE. Bars indicate (c) 500 µm, (d) 80 µm, (e) 400 µm.
Figure 3—figure supplement 1
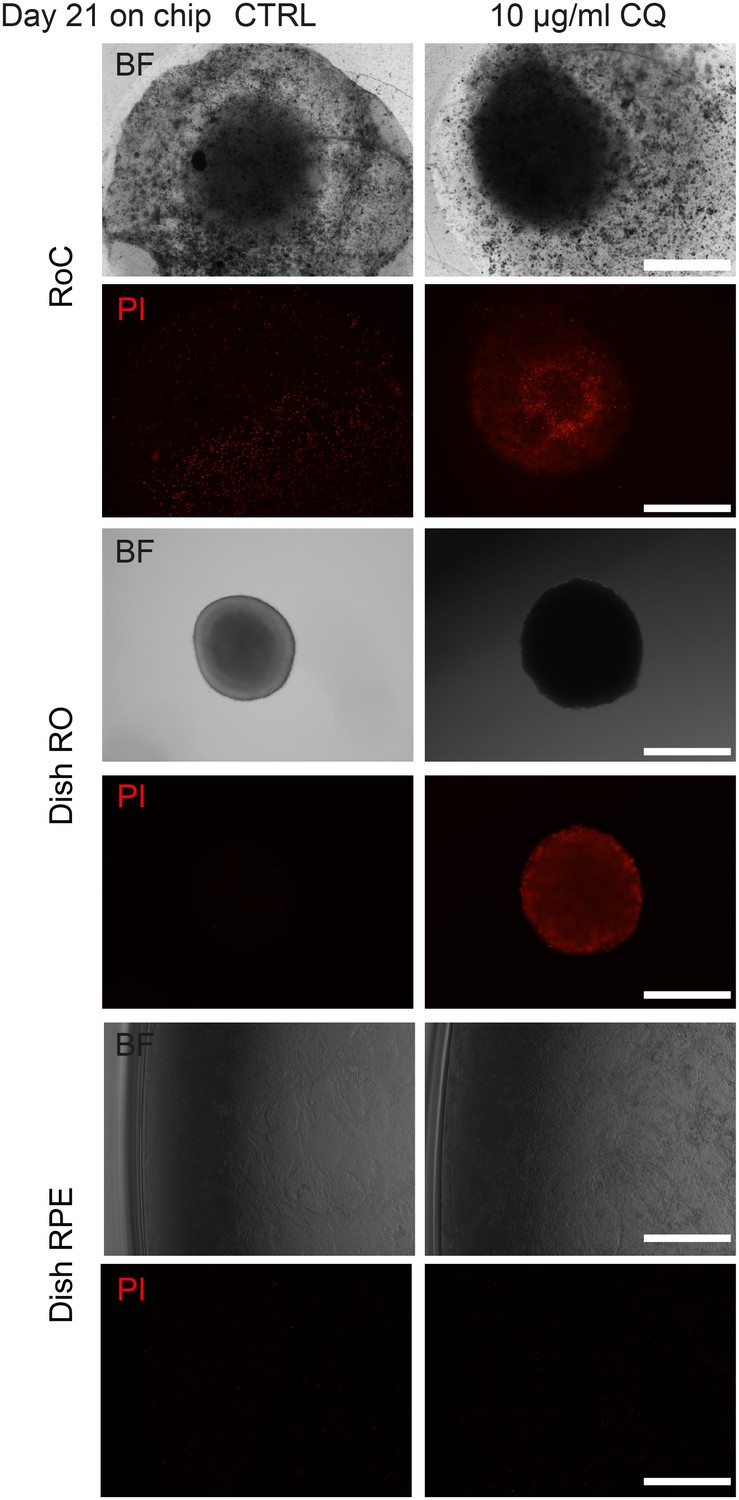
Long-term culture of RoC.
Representative bright-field and propidium idiode images of day 176 RO cultured in the RoC with RPE over 21 days. RoC were either untreated (CTRL) or treated with 10 µg/ml Chloroquine (as a positive control for the viability assessment). On day 21, RoC were stained with prodidium iodide (PI) (red, cell death). As controls experiments, organoids and RPE of the same differentiation as used in the RoC were cultured in dishes for the same period. Scale bars: 500 µm.
Figure 4 with 1 supplement

Specific marker expression and polarization of retinal pigment epithelial cells in the RoC.
(a-d) Evaluation of RPE cells cultured for 14 days in the RoC by immunostaining of relevant RPE markers: a) RPE cells stained for MITF (green), (b) PAX6 (green), (c) ZO-1 (green) and (d) Melanoma gp100 (green), ZO-1 (red). (e) Electron microscopic image of polarized RPE cells. RPE cells display apical microvilli (top row) and a basal membrane (bottom row). (f) Apical microvilli formation is shown using confocal microscopy (orthogonal view of a z-stack) and immunohistochemical staining for ezrin (green). (g) Fluorescent quantification of VEGF-A secretion using ELISA comparing medium collected from a basal and apical channel in a specialized version of the RoC (n = 3 chips). Bars indicate a-d) (left) 50 µm, e) 2 µm, f) 20 µm. Blue: DAPI. Error Bars: S.E.M. p=p value (Two-sided student’s t-test).
-
Figure 4—source data 1
Source data for Figure 4a.
- https://doi.org/10.7554/eLife.46188.010
Figure 4—figure supplement 1
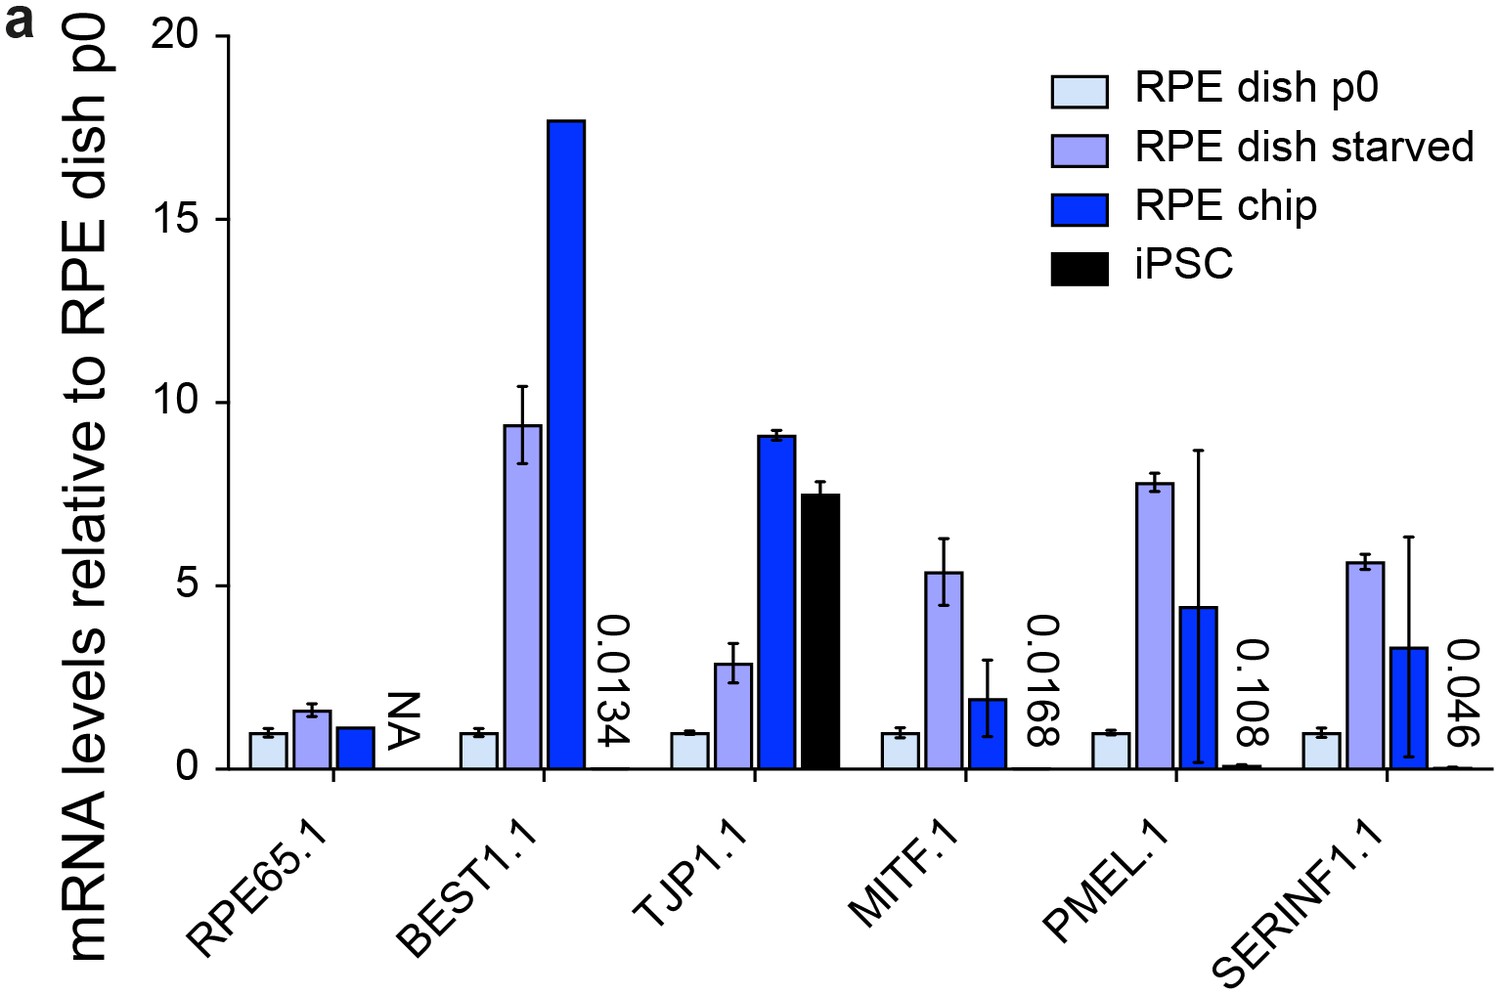
Characterization of dish and chip cultured human iPSC-derived RPE.
(a) Chip cultured hiPSC-RPE immunostained for RPE markers ZO-1, RPE65 and MITF in green. (b) mRNA analysis of i) dish cultured hiPSC-RPE p0, ii) after starvation for 14 days, iii) of hiPSC-RPE inside the chip and iv) respective hiPSCs. Data were normalized to dish p0 culture expression. Scale bars: a) 40 µm. Blue: DAPI. Error bars: S.E.M.
-
Figure 4—figure supplement 1—source data 1
Source data for Figure 4—figure supplement 1a.
- https://doi.org/10.7554/eLife.46188.009
Figure 5 with 1 supplement
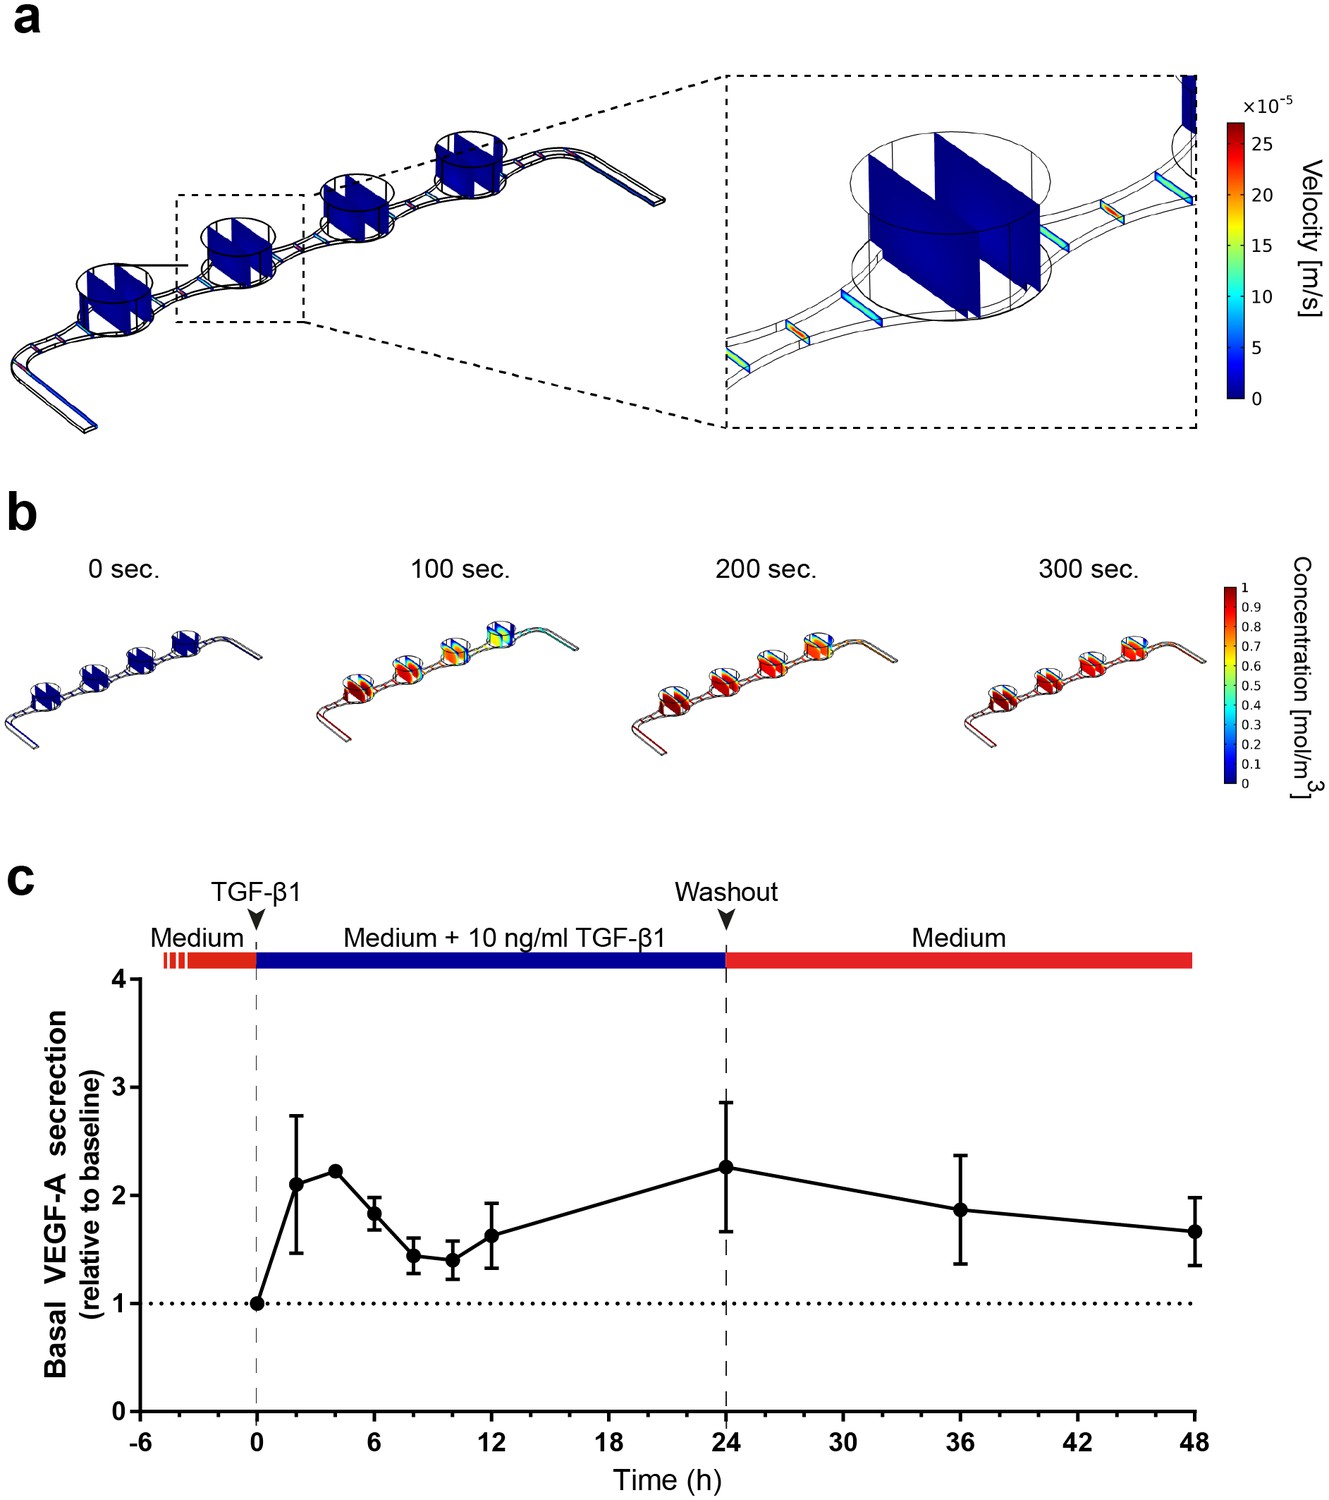
Precisely controllable delivery of stimulants and time-resolved secretion kinetics.
(a-b) Analysis of the free and porous media flow and the transport of diluted species in the RoC: (a) Convective flow is confined to the vasculature-like media compartments and (b) compounds are delivered rapidly into the tissue chambers via diffusion. (c) Time-resolved monitoring of the secretion of VEGF-A before and after media supplemented with 10 ng/ml TGF-β1 was injected into RoCs (n = 3). After 24 hr, TGF-β1 was washed out using a normal medium. VEGF-A secretion in individual RoCs was normalized to the baseline secretion at 0 hr. Error bars: S.E.M.
-
Figure 5—source data 1
Source data for Figure 5c.
- https://doi.org/10.7554/eLife.46188.013
Figure 5—figure supplement 1
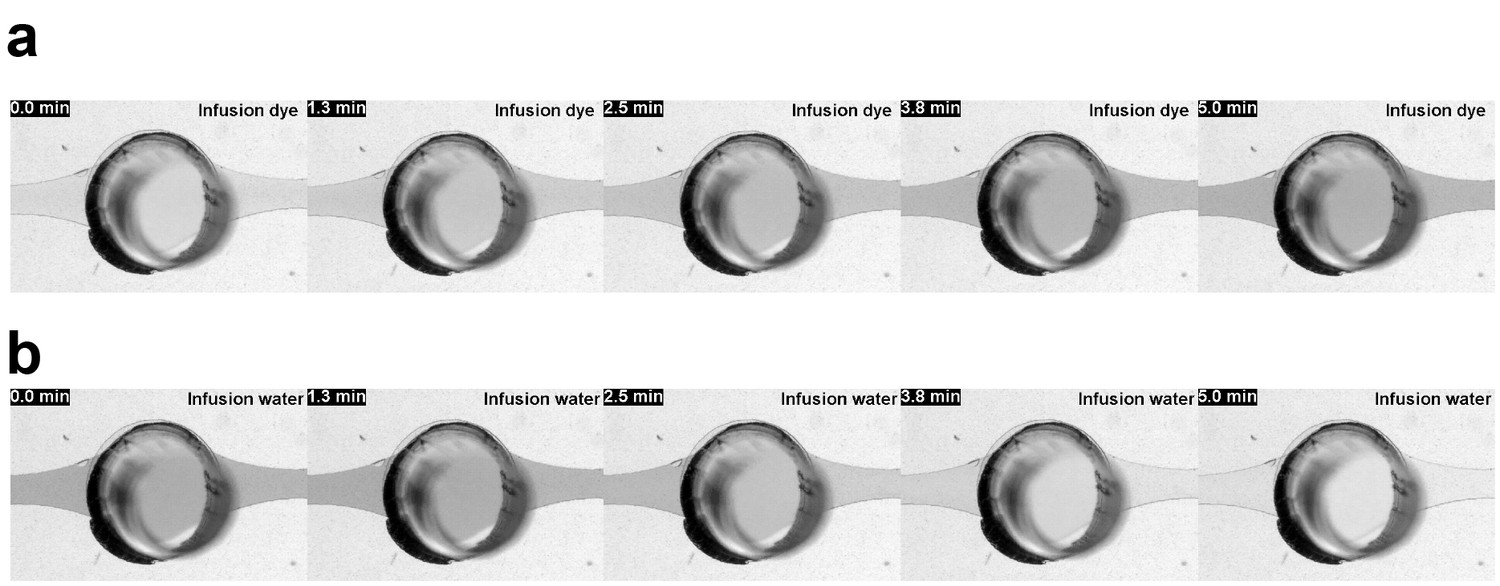
Perfusion-enabled precisely controllable injection and washout.
Bright field images from VS1 and VS2 depicting (a) the switch in media conditions by infusion of a colored liquid into a RoC previously perfused with color-less liquid and (b) the switch back to color-less liquid; flow rate 20 µl/hr; min = minutes after infusion start.
Figure 6 with 2 supplements

RO-RPE interaction enhances the outer segment number at the connection site.
(a) For live-cell observation of RoCs, hiPSC-RPE was labeled with a pJG-IRBP-GFP viral vector prior co-culture (green); hiPSC-derived RO-RPCs were labeled with PNA lectin Alexa Fluor 568 (red). RO-RPE interaction site is illustrated as an orthogonal view (b) Orthogonal view of RO (Day 181) and RPE co-cultured for 7 days in the RoC and subsequently stained in situ for rhodopsin (green) and phalloidin (red). c) Distance between GFP-labeled RPE and PNA lectin-stained segment tips in a) was assessed by measurement using orthogonal images (n = 12 chip compartments). (d) Representative cryosection from 7 days co-cultured day 260 ROs and hiPSC-RPE. Sections were immunostained with ROM1 (green; outer segment marker), phalloidin (white; cytoskeleton) and rhodopsin (red; rods). (e) Electron microscopic image of a day 190 organoid facing RPE cultured in the RoC. (f) Representative electron microscopic images of inner and outer segments on the surface of day 181 ROs cultured for 7 days in f1) the RoC, f2) the RoC without RPE and f3) dish-cultured ROs. Black arrows indicate outer segments identified by stack formation. (g) Exemplary high magnification image of an outer segment-like structure containing organized membrane disks found in day 181 ROs cultured for 7 days in the RoC with RPE. (h) Number of segments/100 µm RO circumference comparing RoC, RoC without RPE and dish cultured RO. In the RoC, only the RPE facing side was analyzed (n = 3 RoC, 4 RoC w/o RPE and 3 dish cultured ROs were analyzed). Bars indicate (a-b) 40 µm, (d) 40 µm, (e-f) 5 µm, (g) 1 µm. Blue: DAPI. IS = inner segment, OS = outer segment. Error Bars: S.E.M. *p-value<0.05.
-
Figure 6—source data 1
Source data for Figure 6c.
- https://doi.org/10.7554/eLife.46188.019
-
Figure 6—source data 2
Source data for Figure 6h.
- https://doi.org/10.7554/eLife.46188.020
Figure 6—figure supplement 1
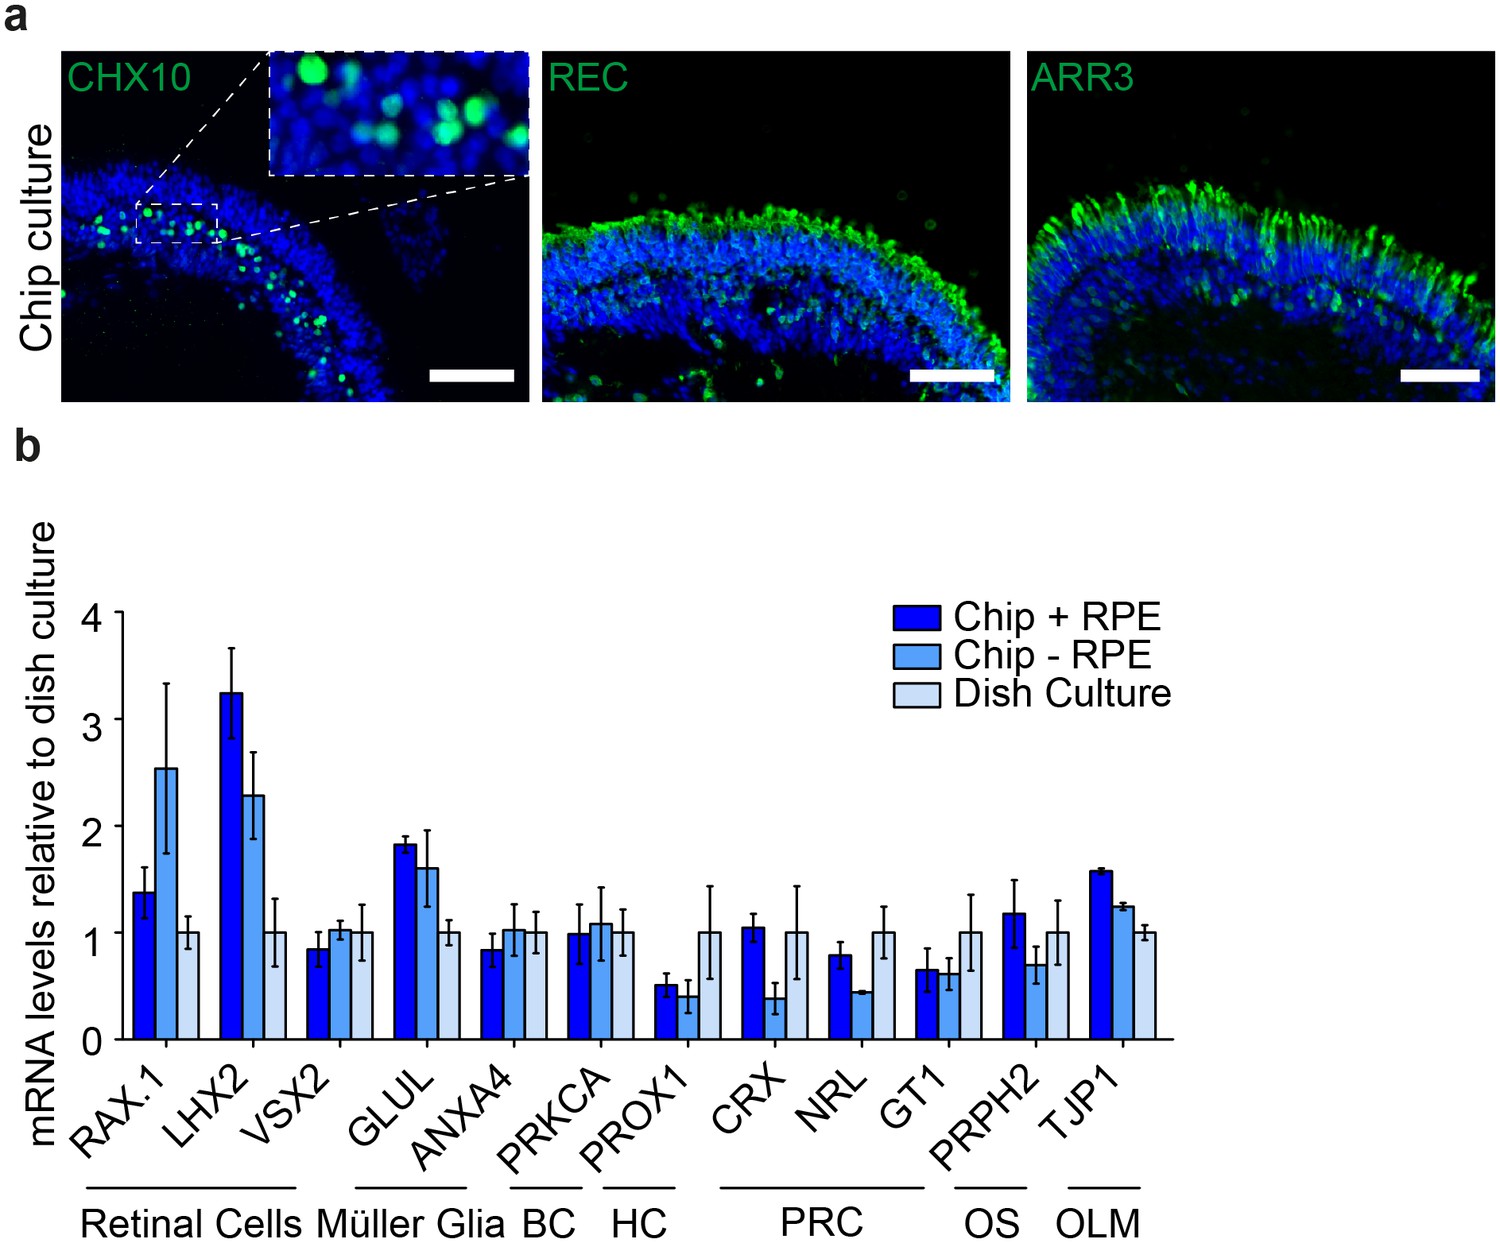
Comparison of dish and chip cultured human iPSC-derived retinal organoids.
(a) After 7 days of chip-culture, d190 RO inside the RoC showed preserved markers for retinal cells. a1) CHX10 (green) a2) recoverin (REC, green) a3) arrestin3 (ARR3, green). (a) mRNA expression from d190 organoids with and without RPE culture for 3 days inside the RoC were comparable to respective classically dish cultured organoids. Scale bars: a) 80 µm. Blue: DAPI. Error bars: S.E.M.
-
Figure 6—figure supplement 1—source data 1
Source data for Figure 6—figure supplement 1b.
- https://doi.org/10.7554/eLife.46188.021
Figure 6—figure supplement 2

Comparison of cell death in RO cultured in the RoC or dish.
(a) RO in the retina chip (upper lane) in comparison to dish culture (lower lane) labeled with the dead cell marker TUNEL. Arrows indicate exemplary positive signals. Scale bars: 40 µm. Blue: DAPI.
Figure 7 with 2 supplements
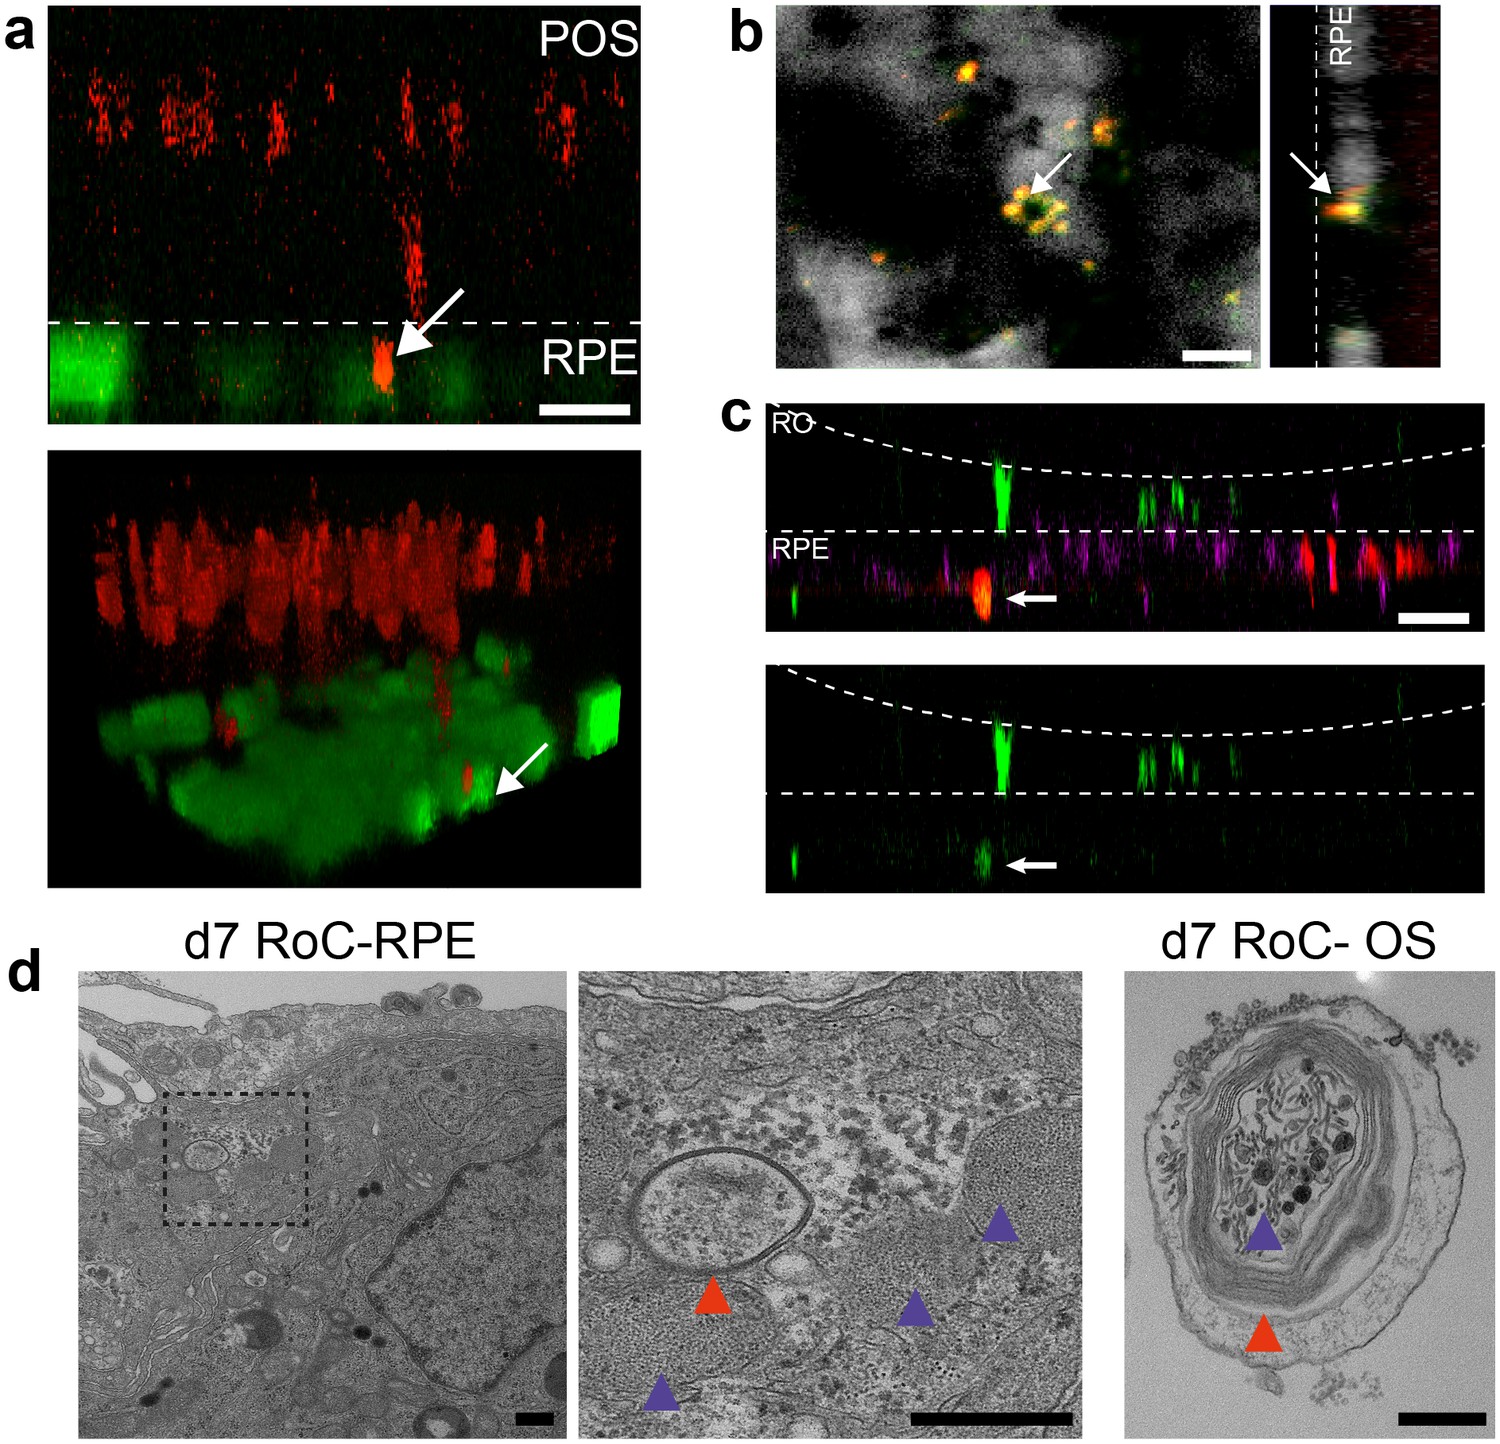
Interaction of RO and RPE in the RoC displays phagocytosis of outer segment-like structures.
(a) Orthogonal view (x-z projection) and 3D reconstruction (bottom) of live-cell-monitored ROs and RPE at day 1 of RoC (RoC) culture. RO (red) and RPE (green) marked as described in Figure 6a. Arrow indicates PNA lectin stained photoreceptor segment fragment internalization by RPE cells. (b) Samples, as described in a) stained with rhodopsin antibody (red) and PNA lectin (green). RPE (white). Arrows indicate PNA lectin-marked fragments which perfectly co-localize with rhodopsin. The left image shows a top-view; right image an orthogonal y-z projection (c) Immunofluorescence imaging of RoC (ROs at day 190 of differentiation). Previously to the chip culture, RPE cells were labeled with an early endosome-GFP construct (red). Chips were thereafter immunostained for rhodopsin (green). (d) Electron microscopic images of day 7 RoC. d1) shows RPE situated underneath the RO. d2) magnification of d1) as indicated by the dotted black square. d3) Outer segment-like structure in a day 7 RoC. Red and blue arrows indicate segment-disk structures within the RPE (d2) and the corresponding structures found in an RO outer segment (d3). Scale bars: (a) 10 µm, (b) 10 µm, (c) 50 µm, (d) 500 nm Blue: DAPI.
Figure 7—figure supplement 1
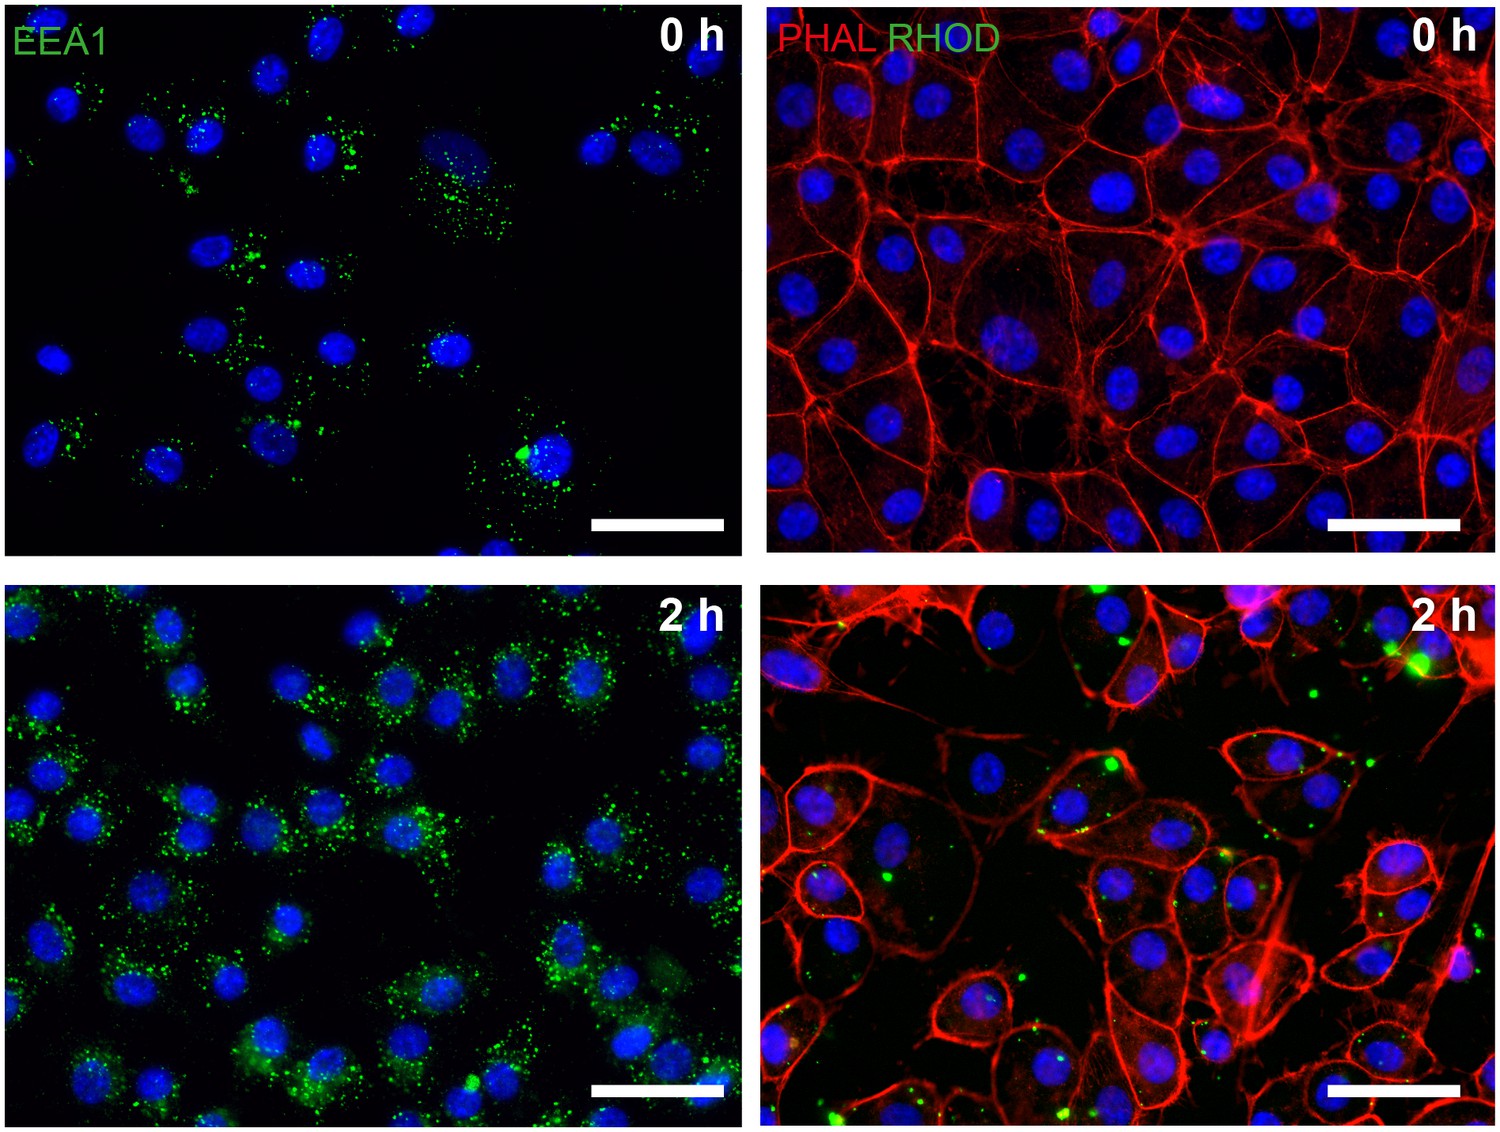
Phagocytosis assay in dish cultured hiPSC-derived RPE.
hiPSC-RPE were incubated with bovine photoreceptor outer segments (POS) and after 2 hr stained positive for endosomal marker EEA1 (green, left panel) and rhodopsin (RHOD, green, right panel). Scale bars: 40 µm. Blue: DAPI.
Figure 7—figure supplement 2
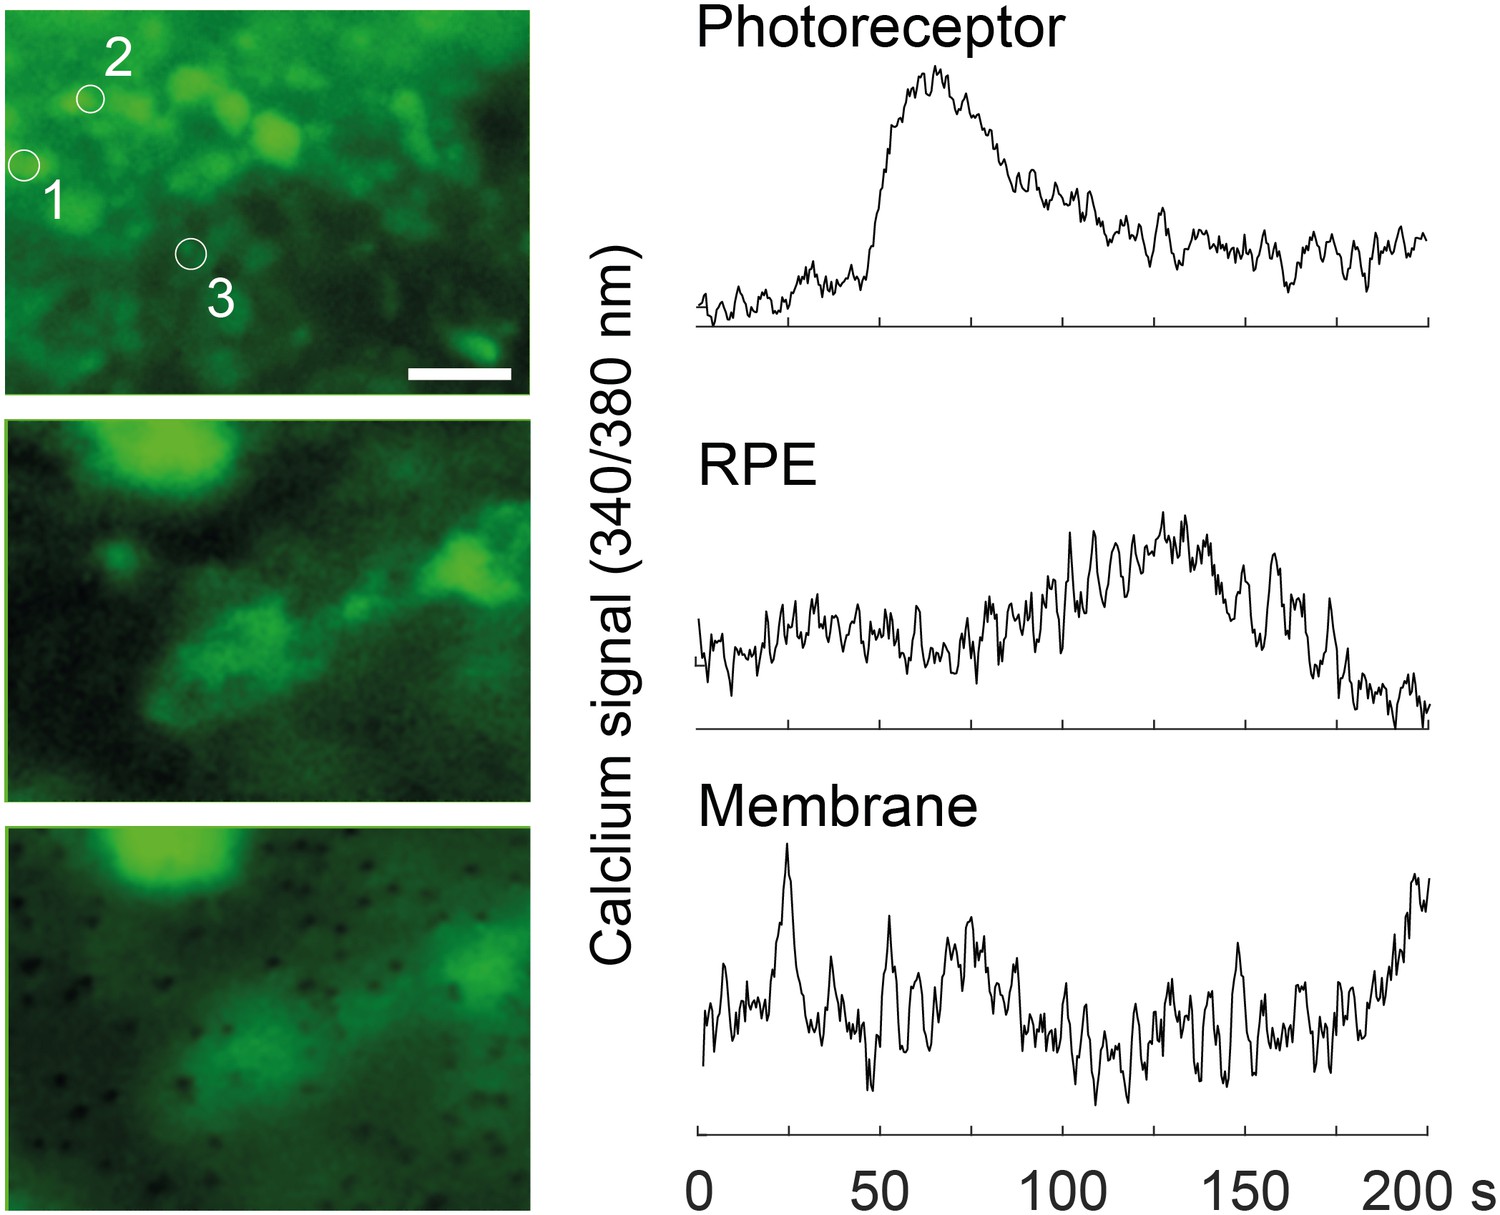
Calcium-imaging in the RoC (at 370 nm) with ratiometric calcium indicator dye Fura-2.
Outer rim of the RO at the photoreceptor layer (top), deeper focal plane at the RPE layer (middle, encircled) and the focal plane at the membrane layer, visualizing the RPE contacting the membrane. Scale bar: 10 µm.
Figure 8 with 1 supplement
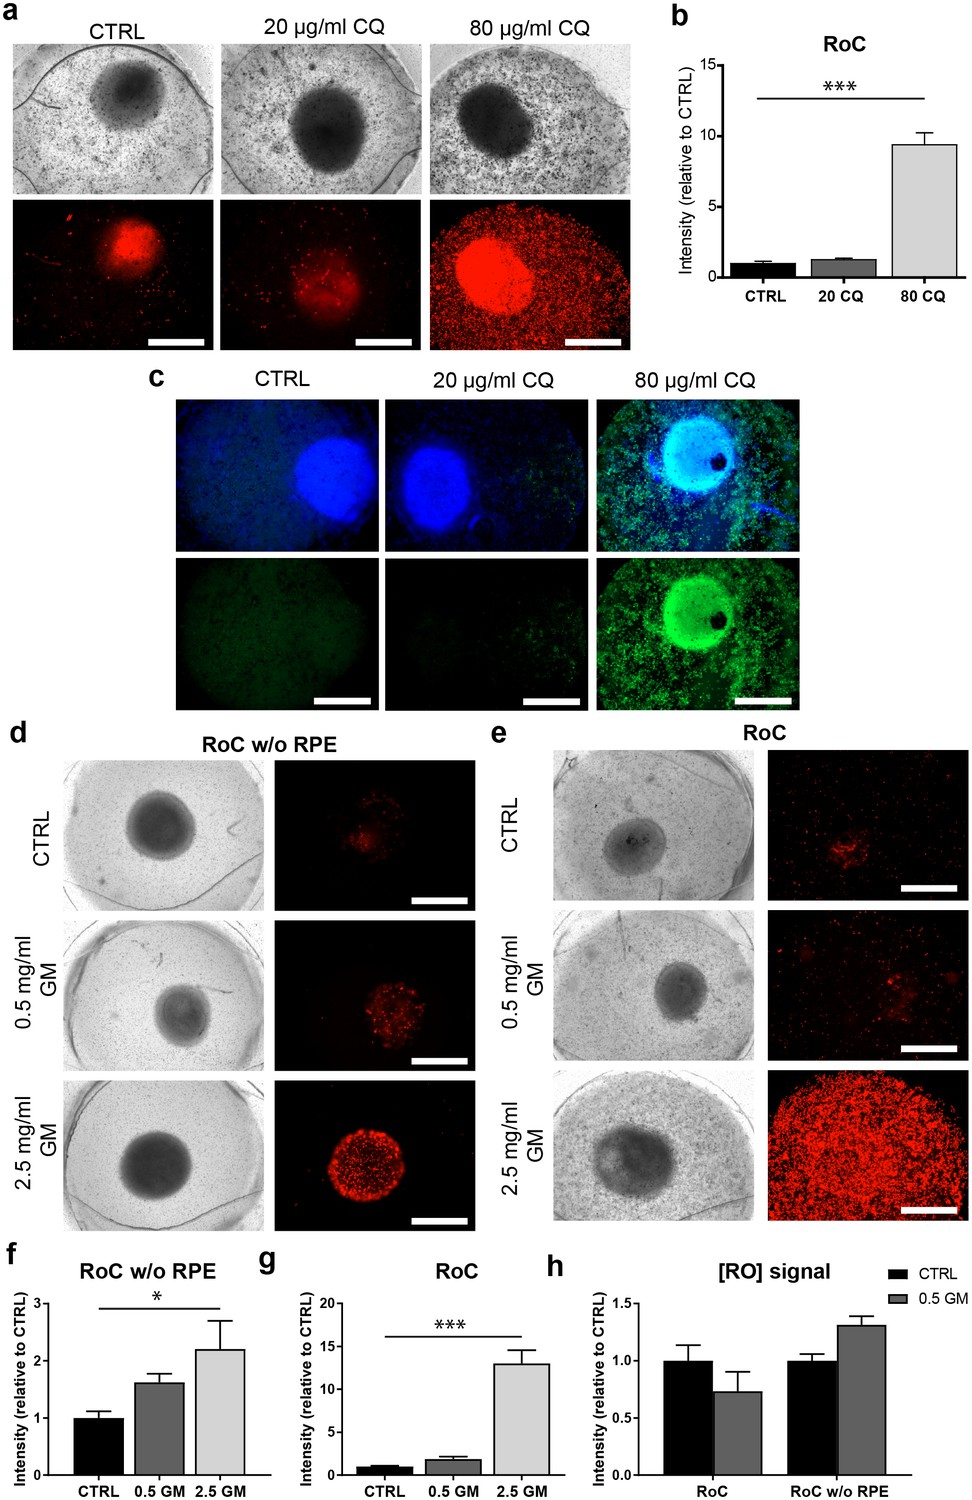
The RoC as a pharmacological testing platform.
(a) Representative bright-field and fluorescence images of day 243–260 RO cultured in the RoC with RPE on day three after treatment with chloroquine (CQ). RoC were either not treated with chloroquine as control (CTRL), treated with 20 µg/ml CQ or treated with 80 µg/ml CQ for 3 days. On day 3, chips were stained with propidium iodide (PI) (red; cell death). (b) Quantification of fluorescence intensities of PI staining, relative to controls (n = 6–11 chip compartments in three independent experiments). (c) Immunostaining with LAMP2 (green, lysosomes) and HOECHST (blue) after 3 days of drug testing of untreated RoCs (CTRL) and RoCs treated with 20 µg/ml CQ or 80 µg/ml CQ. (d) Representative bright-field and fluorescence images of day 202 RO cultured in the RoC without RPE. Cells were treated for 6 days with 0.5 mg/ml gentamicin, 2.5 mg/ml gentamicin or H2O (CTRL). On day 6, RoCs were stained with propidium iodide (PI) (red, cell death). (e) Representative bright-field and fluorescence images of day 202 RO cultured in the RoC. Cells were treated for six days with 0.5 mg/ml gentamicin, 2.5 mg/ml gentamicin or H2O (CTRL). On day 6, RoCs were stained with propidium iodide (PI) (red, cell death). (f) Quantification of fluorescence intensities of the PI signal of RO chip compartments without RPE relative to controls (n = 3 chip compartments per conditions). (g) Quantification of fluorescence intensities of the PI signal in the co-culture RoC relative to controls (n = 9 chips compartments per condition). (h) Comparison of the fluorescence intensities of PI staining of RO cultured in the RoC with (left bars) and without RPE (right bars) treated for 6 days with gentamicin (0.5 mg/ml) relative to their individual controls (CTRL). CQ = Chloroquine, GM = Gentamicin. HOECHST (blue; nuclei). Scale bars: 500 µm. Error bars: S.E.M. *p<0.05, ***p<0.001.
-
Figure 8—source data 1
Source data for Figure 8b.
- https://doi.org/10.7554/eLife.46188.027
-
Figure 8—source data 2
Source data for Figure 8f.
- https://doi.org/10.7554/eLife.46188.028
-
Figure 8—source data 3
Source data for Figure 8g.
- https://doi.org/10.7554/eLife.46188.029
-
Figure 8—source data 4
Source data for Figure 8h.
- https://doi.org/10.7554/eLife.46188.030
Figure 8—figure supplement 1
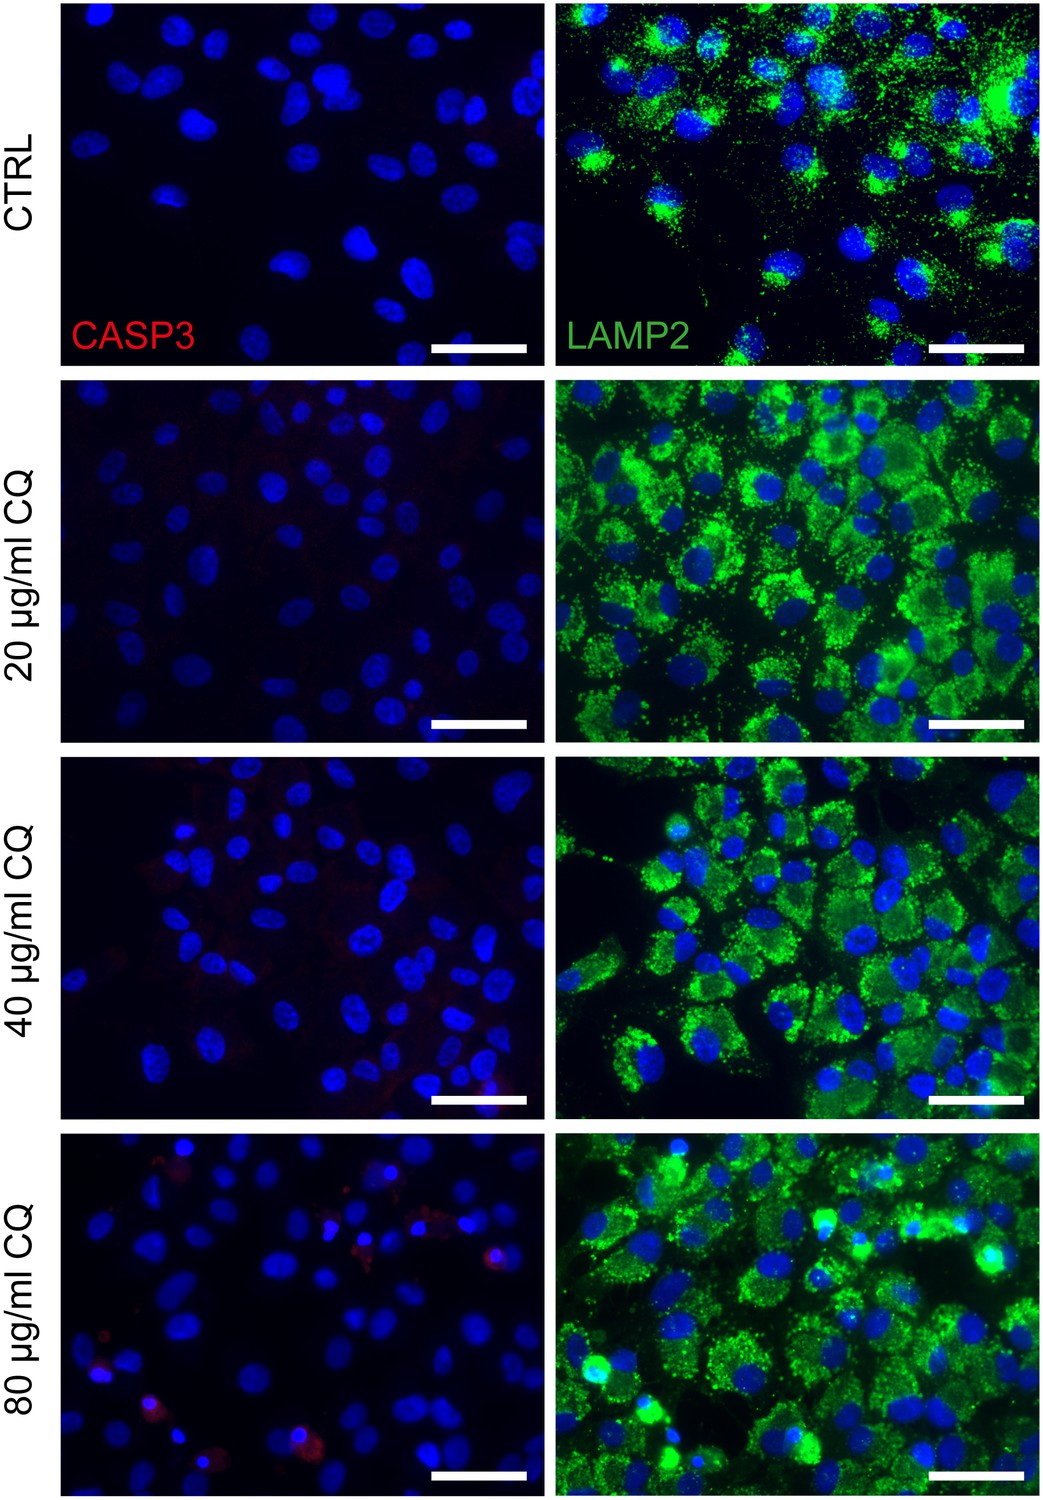
Chloroquine applied on dish cultured hiPSC-RPE.
Treatment of hiPSC-derived RPE grown on cover slips with 20, 40 or 80 µg/ml chloroquine for 24 hr and immunostaining against cleaved-caspase 3 (CASP3, red) and LAMP2 (green) a) Scale bars: 40 µm. Blue: DAPI.
Videos
Video 1
Bright field microscopy movie depicting the infusion of a colored liquid into a RoC previously perfused with color-less liquid (flow rate 20 µl/hr).
https://doi.org/10.7554/eLife.46188.014
Video 2
Bright field microscopy movie depicting the wash-out of the colored liquid via perfusion with color-less liquid (flow rate 20 µl/hr).
https://doi.org/10.7554/eLife.46188.015Tables
Key resources table
| Reagent type (species) or resource | Designation | Source or reference | Identifiers | Additional information |
|---|---|---|---|---|
| Antibody | Donkey anti-Mouse IgG Secondary Antibody Alexa Fluor 488, polyclonal | ThermoFisher Scientific | Cat.# R37114 RRID:AB_2556542 | IHC(1:1000) |
| Antibody | Donkey anti-Mouse IgG Secondary Antibody Alexa Fluor 568, polyclonal | ThermoFisher Scientific | Cat.# A10037 RRID:AB_2534013 | IHC(1:1000) |
| Antibody | Donkey anti-Mouse IgG Secondary Antibody Alexa Fluor 647, polyclonal | ThermoFisher Scientific | Cat.# A-31571 RRID:AB_162542 | IHC(1:1000) |
| Antibody | Donkey anti-Goat IgG Secondary Antibody Alexa Fluor 488, polyclonal | ThermoFisher Scientific | Cat.# A-11055 RRID:AB_2534102 | IHC(1:1000) |
| Antibody | Donkey anti-Goat IgG Secondary Antibody Alexa Fluor 568, polyclonal | ThermoFisher Scientific | Cat.# A-11057 RRID:AB_142581 | IHC(1:1000) |
| Antibody | Donkey anti-Goat IgG Secondary Antibody Alexa Fluor 647, polyclonal | ThermoFisher Scientific | Cat.# A-21447 RRID:AB_141844 | IHC(1:1000) |
| Antibody | Donkey anti-Rabbit IgG Secondary Antibody Alexa Fluor 488, polyclonal | ThermoFisher Scientific | Cat.# R37118 RRID:AB_2556546 | IHC(1:1000) |
| Antibody | Donkey anti-Rabbit IgG Secondary Antibody Alexa Fluor 568, polyclonal | ThermoFisher Scientific | Cat.# A10042 RRID:AB_2534017 | IHC(1:1000) |
| Antibody | Donkey anti-Rabbit IgG Secondary Antibody Alexa Fluor 647, polyclonal | ThermoFisher Scientific | Cat.# A-31573 RRID:AB_2536183 | IHC(1:1000) |
| Antibody | Mouse anti-AP2α, monoclonal | Santa Cruz Biotechnology | Cat.# sc-12726 RRID:AB_667767 | IHC(1:100) |
| Antibody | Goat anti-Arrestin 3(Cone Arrestin), polyclonal | Santa Cruz Biotechnology | Cat.# sc-54355 RRID:AB_2060084 | IHC(1:50) |
| Antibody | Goat anti-Brn-3b, polyclonal | Santa Cruz Biotechnology | Cat.# sc-31989 RRID:AB_2167523 | IHC(1:50) |
| Antibody | Goat anti-Chx10, polyclonal | Santa Cruz Biotechnology | Cat.# sc-21690 RRID:AB_2216006 | IHC(1:200) |
| Antibody | Mouse anti-CRALBP, monoclonal | Abcam | Cat.# ab15051 RRID:AB_2269474 | IHC(1:250) |
| Antibody | Mouse anti-EEA1, monoclonal | ThermoFisher Scientific | Cat.# 14-9114-80 RRID:AB_2572928 | IHC(1:500) |
| Antibody | Rabbit anti-Ezrin, polyclonal | Cell Signaling | Cat.# 3145S RRID:AB_2100309 | IHC(1:200) |
| Antibody | Mouse anti-LAMP2, monoclonal | Santa Cruz Biotechnology | Cat.# sc18822 RRID:AB_626858 | IHC(1:50) |
| Antibody | Mouse anti-Melanoma-gp100, monoclonal | Abcam | Cat.# ab787 RRID:AB_306146 | IHC(1:100) |
| Antibody | Mouse anti-MITF, monoclonal | Exalpha Biologicals | Cat.# X1405M | IHC(1:500) |
| Antibody | Rabbit anti-Pax-6, polyclonal | Covance | Cat.# PRB-278P-100 RRID:AB_291612 | IHC(1:100) |
| Antibody | Rabbit anti-PKCα, polyclonal | Santa Cruz Biotechnology | Cat.# sc-208 RRID:AB_2168668 | IHC(1:500) |
| Antibody | Mouse anti-Rhodopsin, monoclonal | Santa Cruz Biotechnology | Cat.# sc-57432 RRID:AB_785511 | IHC(1:200) |
| Antibody | Rabbit anti-ROM1, polyclonal | Proteintech | Cat.# 21984–1-AP | IHC(1:200) |
| Antibody | Mouse anti-RPE65, monoclonal | Abcam | Cat.# ab78036 RRID:AB_1566691 | IHC(1:100) |
| Antibody | Rabbit anti-Opsin, blue, polyclonal | Merck Millipore | Cat.# ab5407 RRID:AB_177457 | IHC(1:200) |
| Antibody | Rabbit ani-ZO-1, polyclonal | ThermoFisher Scientific | Cat.# 61–7300 RRID:AB_138452 | IHC(1:100) |
| Commercial assay or kit | TUNEL Assay (Click-iT TUNEL Alexa Fluor 488 Imaging Assay) | ThermoFisher Scientific | Cat.# C10245 | |
| Commercial assay or kit | CellLight Early Endosomes-GFP, BacMam 2.0 | ThermoFisher Scientific | Cat.# C10586 | |
| Commercial assay or kit | VEGF-A Human ELISA Kit | ThermoFisher Scientific | Cat. # BMS277-2 | |
| Chemical compound, drug | Alexa Fluor 647 Phalloidin | ThermoFisher Scientific | Cat.# A12379 | 1:500 |
| Chemical compound, drug | PNA lectin-Alexa Fluor 568 | ThermoFisher Scientific | Cat.# L32458 | 20 µg/ml |
| Chemical compound, drug | PNA lectin-Alexa Fluor 647 | ThermoFisher Scientific | Cat.# L32460 | 20 µg/ml |
| Chemical compound, drug | Recombinant Human TGF-β1 | Peprotech | Cat.# 100–21 | |
| Chemical compound, drug | HOECHST 33342 | ThermoFisher Scientific | Cat.#H3570 | 1:2000 |
| Chemical compound, drug | Chloroquine | Sigma-Aldrich | Cat.#C6628 | |
| Chemical compound, drug | Gentamicin | Sigma-Aldrich | Cat.#G1397 | |
| Recombinat DNA reagent | pJG-IRPB-eGFP | Department of Biological Structure, University of Washington (https://faculty.washington.edu/tomreh/) | ||
| Software, algorithm | COMSOL Multiphysics | COMSOL Multiphysics | RRID:SCR_014767 | |
| Software, algorithm | Prism | GraphPad | RRID:SCR_002798 | |
| Software, algorithm | FIJI | RRID:SCR_002285 |
Additional files
-
Transparent reporting form
- https://doi.org/10.7554/eLife.46188.031
Download links
A two-part list of links to download the article, or parts of the article, in various formats.
Downloads (link to download the article as PDF)
Open citations (links to open the citations from this article in various online reference manager services)
Cite this article (links to download the citations from this article in formats compatible with various reference manager tools)
Merging organoid and organ-on-a-chip technology to generate complex multi-layer tissue models in a human retina-on-a-chip platform
eLife 8:e46188.
https://doi.org/10.7554/eLife.46188


