Francisella tularensis enters a double membraned compartment following cell-cell transfer
- Washington State University, United States
Figures
Figure 1 with 1 supplement

BMDMs acquire bacteria and cytosolic content from neighbouring cell via phagocytosis.
(A) Transmission electron microscopy of a donor and recipient BMDM. The less electron dense cell is the donor cell in this instance. The scale bar represents 5 μm. (B–E) Higher magnification images of the black box in panel A. Each panel is a sequential slice through the same region. The scale bar represents 500 nm. (F) A diagram of the synchronized transfer assay. Recipient cells are seeded onto a coverslip, inverted onto the infected cells and then the coverslip is removed to purify the recipient cells. (G) Representative confocal microscopy image of a recipient cell after bacterial transfer. This image indicates that bacteria and cytosolic content are both acquired together. The different images represent different combinations of stains and the complete overlay. F. tularensis (green), transferred cytosolic protein (Cell Trace Red) (red), LAMP-1 (white) and DAPI (blue). An example donor cells is depicted in Figure 1—figure supplement 1.
Figure 1—figure supplement 1
Representative image of a donor cell in cytosolic transfer assay.
A representative donor cell infected with F. tularensis (green) that was stained with cell trace red (red) for the cytosolic transfer assay. Wheat germ agglutinin (WGA) (white) denotes the plasma membrane and DAPI (blue) for the nucleus. These are the control cells for Figure 1G.
Figure 2
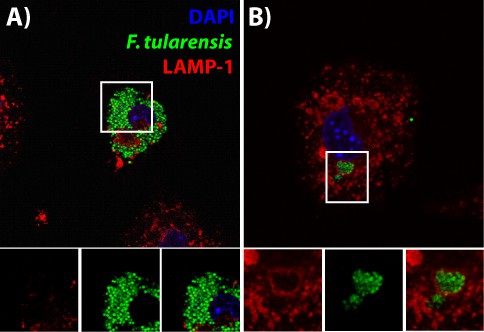
F. tularensis enters the endocytic pathway in recipient cells after cell-cell transfer.
(A) Representative image of F. tularensis (green) inside an EEA-1 (red) positive vacuole 10 min after synchronized cell-cell transfer. (B) Representative image of F. tularensis (green) inside a LAMP-1 (red) positive vacuole 1 hr after synchronized cell-cell transfer. (C–D) The percentage of cells with at least one bacterium enclosed inside of (C) EEA-1 or (D) LAMP-1 positive vacuoles. The black line represents a conventional infection where the BMDMs phagocytose extracellular bacteria. The blue line represents purified recipient BMDMs after bacterial transfer. From three independent experiments with 50 infected cells counted per experiment per time point. Student t-test. Mean ± standard deviation. *p<0.05, **p<0.01, ***p<0.001. ns- no statistical significance. No time points were significantly different for LAMP-1 co-localization.
Figure 3 with 1 supplement
The type VI secretion system is required for Francisella escape from the phagosome following cell-cell transfer.
(A) The percent of bacteria enclosed in a LAMP-1 positive vacuoles 3 hr after a synchronized infection with extracellular bacteria. These data represent the ability of the inducible type VI secretion system (T6SS) strain to escape the initial phagosome during a conventional infection under the inducible expression condition. (B) The percent of bacteria enclosed in LAMP-1 positive vacuoles after cell-cell transfer. Under conditions where the inducible strain is not producing the T6SS, the bacteria remain largely trapped while the wildtype strain continues to escape the phagosome over time. From three independent experiments with 50 infected cells counted per experiment per time point. Mean ± standard deviation. Panel A used a One-way Anova with Dunnett post-test. Panel B used a Student t-test to compare between time points. **p<0.01, ***p<0.001, ns – not significant.
Figure 3—figure supplement 1
The F. tularensis type VI secretion system is dispensable for intracellular growth following phagosomal escape.
Colony forming units of wildtype, the parent ΔdotU strain and the ΔdotU strain with dotU under an anhydrous tetracycline inducible promoter. Pre-induced indicates that the bacteria were only exposed to ATc in the overnight and not during or after inoculation of the BMDMs. This assay was performed three times in triplicate and the data represents the mean ± standard deviation. One-way ANOVA with Dunnett post-test. *p<0.05, **p<0.01, **p<0.001.
Figure 4
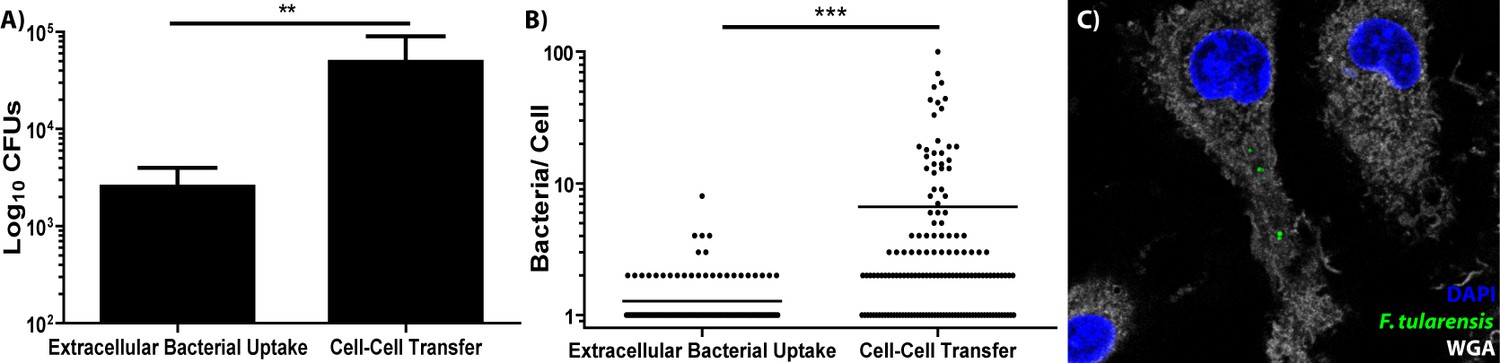
BMDMs acquire significantly more bacteria via bacterial transfer than phagocytosis of extracellular bacteria.
(A) Colony forming units of intracellular bacteria 2 hr after synchronized infection or purified recipient cells after synchronized cell-cell transfer. three independent experiments performed in triplicate. Mean ± standard deviation. (B) The number of bacteria per cell in either BMDMs infected with extracellular bacteria or recipient BMDMs infected via bacterial transfer 2 hr post inoculation. three independent experiments with 50 infected cells counted per sample per experiment. Each data point represents an infected cell. Bar represents the mean. (C) Representative image of a recipient BMDM. The bacteria are depicted in green, DAPI in blue and the plasma membrane (wheat germ agglutinin) in white. Student t-test. **p<0.01, ***p<0.0001.
Figure 5 with 6 supplements

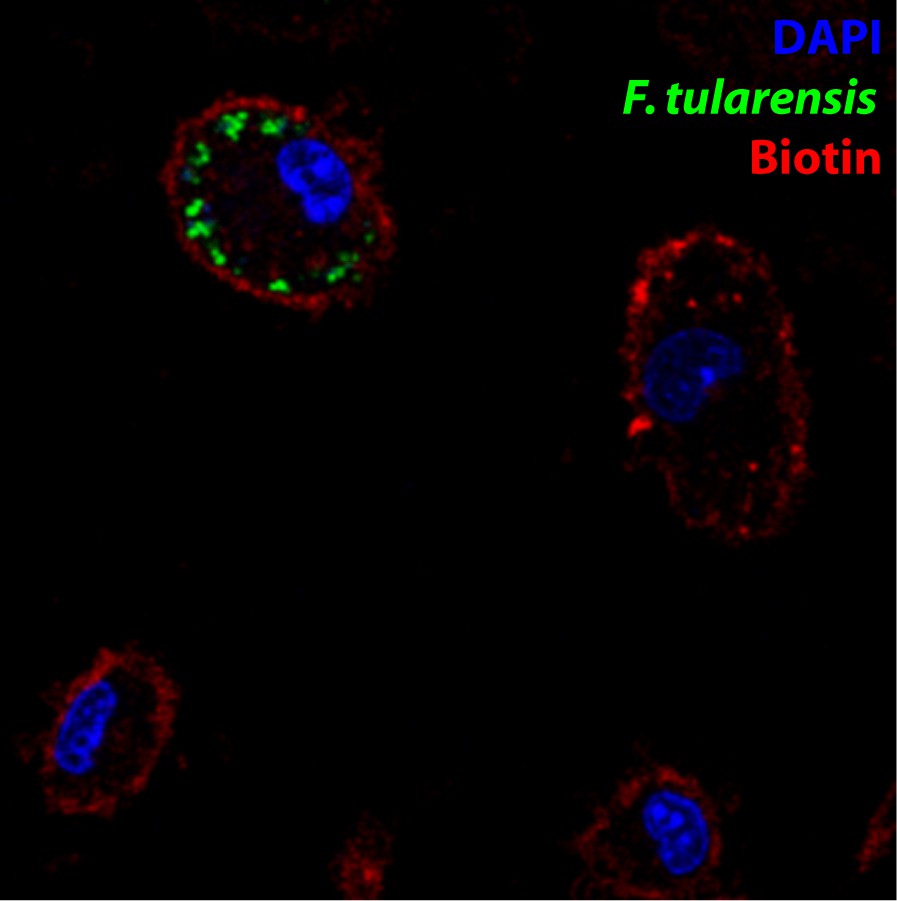
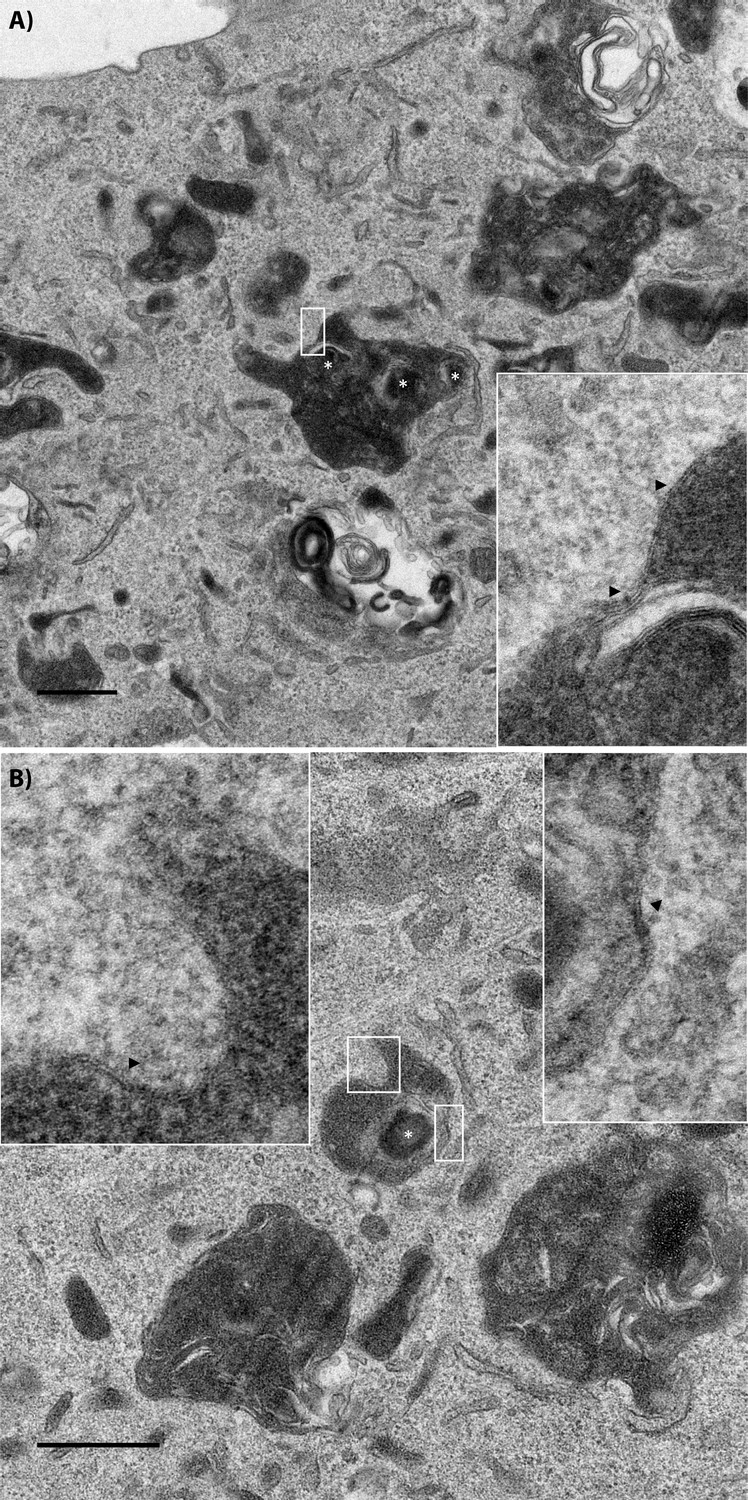
Following cell-cell transfer, Francisella is enclosed within a multi-membraned vacuole with one membrane originating from the donor plasma membrane.
(A) Representative image of a recipient cell following bacterial transfer. The plasma membrane of the initially infected donor cell was labelled with biotin and the purified recipient cells were permeabilized and stained with fluorescent streptavidin (red). (B) The same image as panel A without the wheat germ agglutinin staining for the plasma membrane. The images on the right are higher magnifications of the white box. An example donor cells is depicted in Figure 5—figure supplement 3 (C–D). Two representative transmission electron micrograph images of inducible T6SS bacteria inside of double membrane structures in purified recipient cells. The images on the right are higher magnifications of the boxed region for each respective image. Arrows denote double membranes, white stars denote bacteria. The scale bars are all 500 nm. Sequential slices and related structures in the same cell for Panel C are available in Figure 5—figure supplement 6.
Figure 5—figure supplement 1

Vacuoles containing several bacteria form following cell-cell transfer.
(A) The percent of LAMP-1 positive vacuoles containing the indicated number of F. tularensis bacteria. The white bars represent phagocytosis of extracellular bacteria in a conventional infection. (B) The percentage of vacuoles with three or more bacteria in the same LAMP-1 positive vacuole over time. three independent experiments with 50 infected cells analyzed per experiment per time point. Panel A is derived from a combination of all time points in panel B. Mean ±the standard deviation. Student t-test. ***p<0.001. There were no bacteria in the initial inoculum sample with 5 + bacteria in Panel A after 1200 cells were analyzed across three experiments. For that sample, # is meant to call attention to the vast difference between the samples since a t-test cannot be performed.
Figure 5—figure supplement 2
Formation of FCVs in the F. tularensis Schu S4 strain.
(A) A representative donor BMDM infected with Schu S4. (B) A representative recipient BMDM 2 hr after cell-cell transfer. The images below the panel are higher magnifications of the region in the white box.
Figure 5—figure supplement 3
Representative images of donor cells in membrane transfer assays.
A representative infected donor cell where proteins on the plasma membrane were biotinylated and stained with fluorescent streptavidin (red). These are the control cells for Figure 5A/B.
Figure 5—figure supplement 4
Transmission electron micrograph of a recipient BMDM that acquired wildtype bacteria.
Two examples of wildtype bacteria in FCVs inside of recipient cells. The insets are higher magnification images of the region denoted in the white boxes. Black arrows point to double membrane regions on the membrane. Wildtype bacteria are labelled with a white asterisk. The scale bar represents 500 nm for the low magnification image.
Figure 5—figure supplement 5
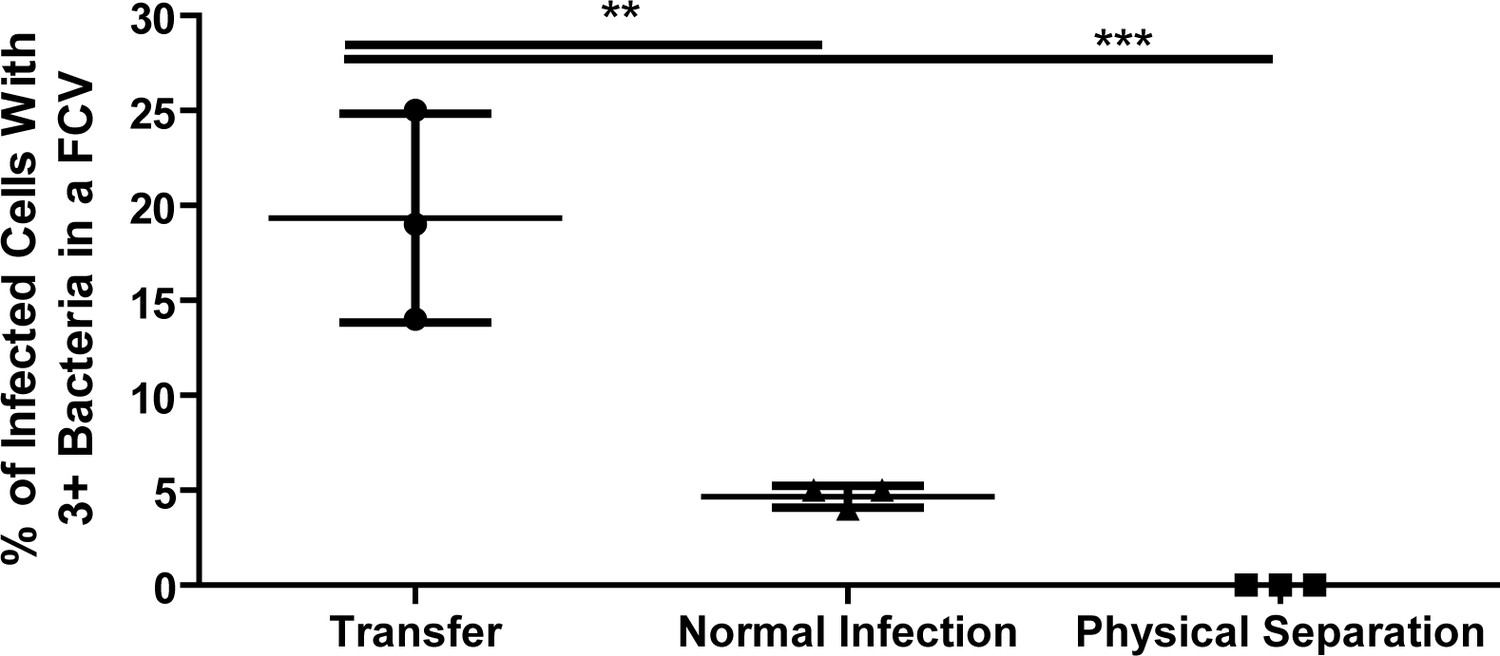
FCVs containing several bacteria require cell-cell contact.
The percent of infected cells that contained a LAMP-1 positive FCV with three or more bacteria in the same vacuole. The cell-cell transfer and physical separation (Transwell) samples were purified recipient cells exposed to donor cells for 30 min. The normal infection samples were BMDMs that had been infected with F. tularensis for 20 hr. Mean ± standard deviation. Each data point represents an experiment. three independent experiments with 100 infected cells (cell-cell transfer), 100 infected cells (normal infection) or 25 infected cells (physical separation) per experiment. One-way ANOVA with Dunnett post-test. **p<0.01, ***p<0.001.
Figure 5—figure supplement 6

Transmission electron micrograph of a recipient BMDM that acquired several bacteria.
(A) A low magnification of the recipient BMDM depicted in Figure 5. The scale bar represents 5 μm. (B) A higher magnification of the white box on the far right. This image depicts at least two bacteria in separate vacuoles within the recipient cell. (C) A higher magnification of the white box on the far left. (D) A series of sequential stacks of the white box in the middle. This large vacuole contains at least six bacteria acquired from the donor cell. The scale bars for panels B-D represent 500 nm. White asterisks denote F. tularensis bacteria. The first slice is the same image as Figure 5 Panel C.
Figure 6 with 1 supplement
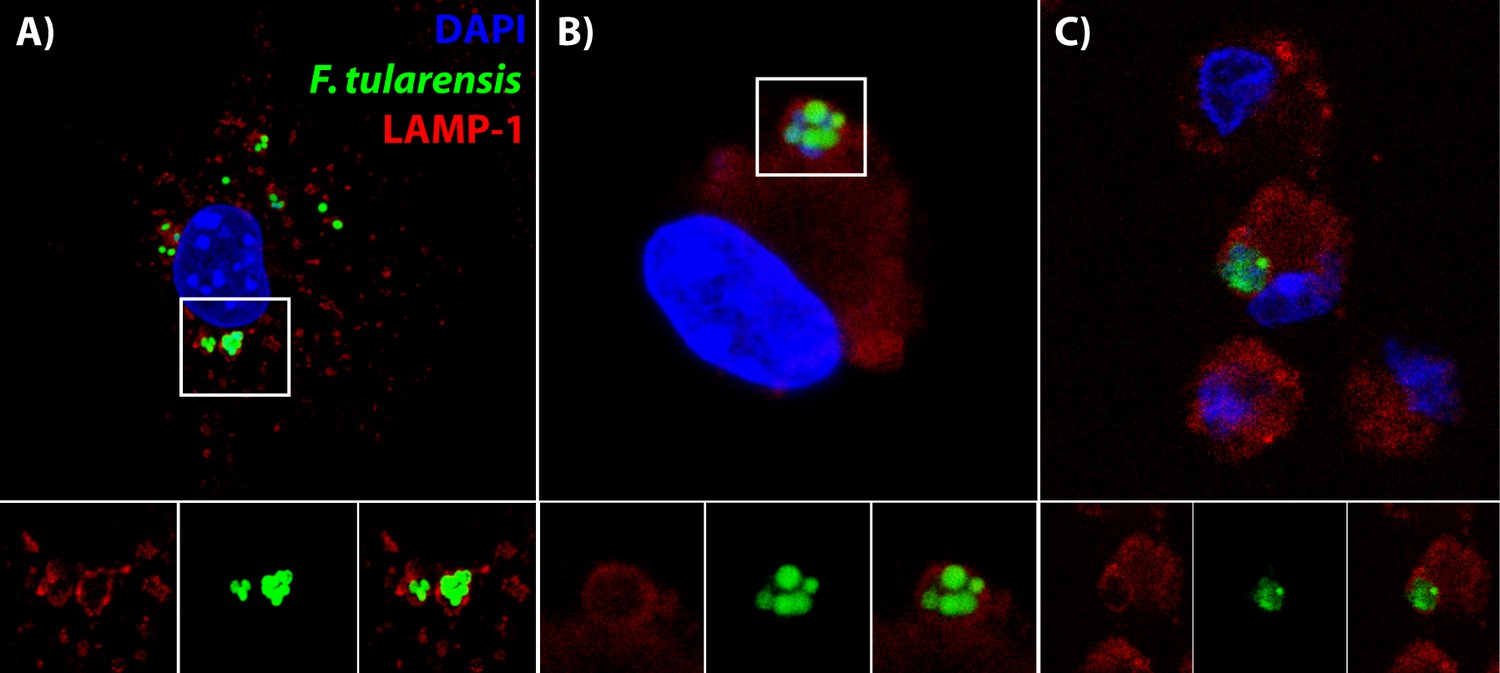
Bacteria are in distinctive vacuoles following cell-cell transfer in both BMDMs and lung cells ex vivo.
(A) Representative image of a LAMP-1 stained recipient BMDM following bacterial transfer. (B–C) Representative images of LAMP-1 stained lung cell ex vivo. Note the similarity in structures between the known recipient BMDM in Panel A and the adherent infected cells ex vivo. F. tularensis is depicted in green, LAMP-1 in red and DAPI in blue.
Figure 6—figure supplement 1
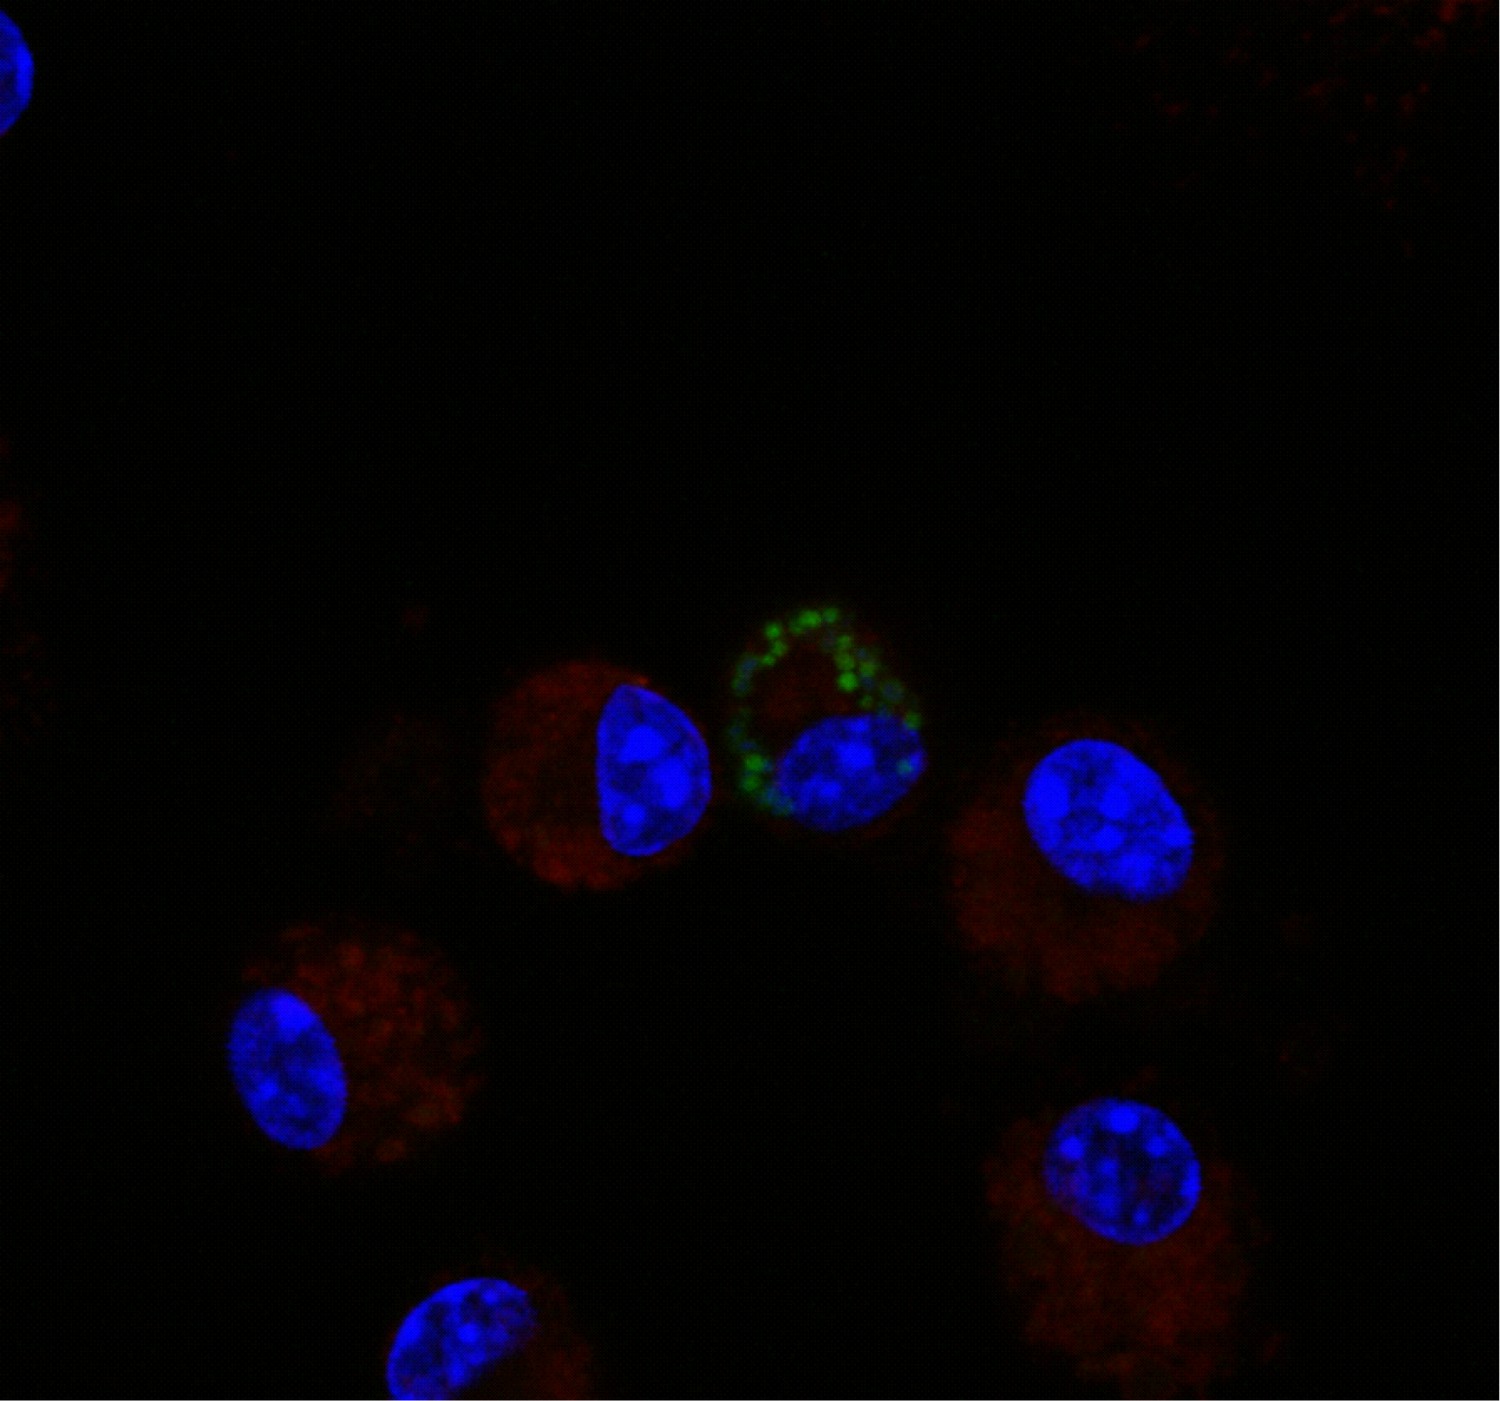
Example of donor cell in vivo.
An example of a donor cell in the in vivo transfer assay. This cell was identified as a donor based on the number of bacteria per cell, which indicated bacterial replication. These cells were excluded from our analysis.
Figure 7
Graphical Summary.
F. tularensis transfers between cells via phagocytosis of a small portion of a cell upon cell-cell contact, which we have termed merocytophagy. Following merocytophagy, the acquired cytosolic material enters a double membraned compartment. Each layer of membrane is derived from a different cell. When F. tularensis migrates between cells via merocytophagy, it escapes the vacuole using its type VI secretion system.
Tables
Key resources table
| Reagent type (species) or resource | Designation | Source or reference | Identifiers | Additional information |
|---|---|---|---|---|
| Antibody | EEA-1 (goat monoclonal) | Santa Cruz Biosciences | clone N19, catalog number sc-6415 | 1:50 dilution, permeabilized in 0.1% saponin, 2% FBS in humidifier at 37 degrees Celcius for 30 minutes. Cells cannot be fixed for longer than 7 minutes prior to staining. |
| Antibody | LAMP-1 (rat monoclonal) | Developmental Studies Hybridoma Bank | Clone 1D4B | 1:500 dilution after stock mixed with 50% glycerol, permeabilized in 0.1% saponin, 2% FBS in humidifier at 37 degrees Celcius for 30 minutes |
| Antibody | Anti-rat secondary (goat monoclonal) | ThermoFisher Scientific | catalog number 26-4826-82 | 1:500 dilution in0.1% saponin, 2% FBS in humidifier at 37 degrees Celcius |
| Antibody | Anti-goat secondary (donkey monoclonal) | ThermoFisher Scientific | catalog number PA1-28662 | 1:500 dilution in 0.1% saponin, 2% FBS in humidifier at 37 degrees Celcius |
| Strain, strain background (Mus musculus, female) | 6–10 week old female C57Bl/6J | Jackson Labs | catalog number 000664 | |
| Strain, strain background (Francisella tularensis, Live Vaccine Strain) | F. tularensis or LVS | CDC | ||
| Strain, strain background (Francisella tularensis, Schu S4) | F. tularensis Schu S4 | BEI Resources | ||
| Strain, strain background (Francisella tularensis, inducibleT6SS mutant) | T6SS mutant | this paper | F. tularensis strain with an in-frame, markerless deletion of FTL_0119 (dotU) that is complemented with a pEDL17 plasmid containing dotU under the tetracycline inducible promoter and GFP on a constitutive promoter | |
| Strain, strain background (Francisella tularensis, Empty Vector Control) | WT | this paper | wildtype LVS that is complemented with a pEDL17 plasmid containing a kanamycin resistance cassette under the tetracycline inducible promoter and GFP on a constitutive promoter | |
| Strain, strain background (Francisella tularensis, Empty Vector in ΔdotU) | ΔdotU | this paper | A FTL_0119 deletion in LVS that is complemented with a pEDL17 plasmid containing a kanamycin resistance cassette under the tetracycline inducible promoter and GFP on a constitutive promoter | |
| Chemical compound, drug | anhydrous tetracycline | Cayman Chemicals | catalog number100009542 |
Additional files
-
Transparent reporting form
- https://doi.org/10.7554/eLife.45252.018
Download links
A two-part list of links to download the article, or parts of the article, in various formats.
Downloads (link to download the article as PDF)
Open citations (links to open the citations from this article in various online reference manager services)
Cite this article (links to download the citations from this article in formats compatible with various reference manager tools)
Francisella tularensis enters a double membraned compartment following cell-cell transfer
eLife 8:e45252.
https://doi.org/10.7554/eLife.45252


