Parental vaccination to reduce measles immunity gaps in Italy
- Fondazione Bruno Kessler, Italy
- Bocconi University, Italy
- Northeastern University, United States
Figures
Figure 1
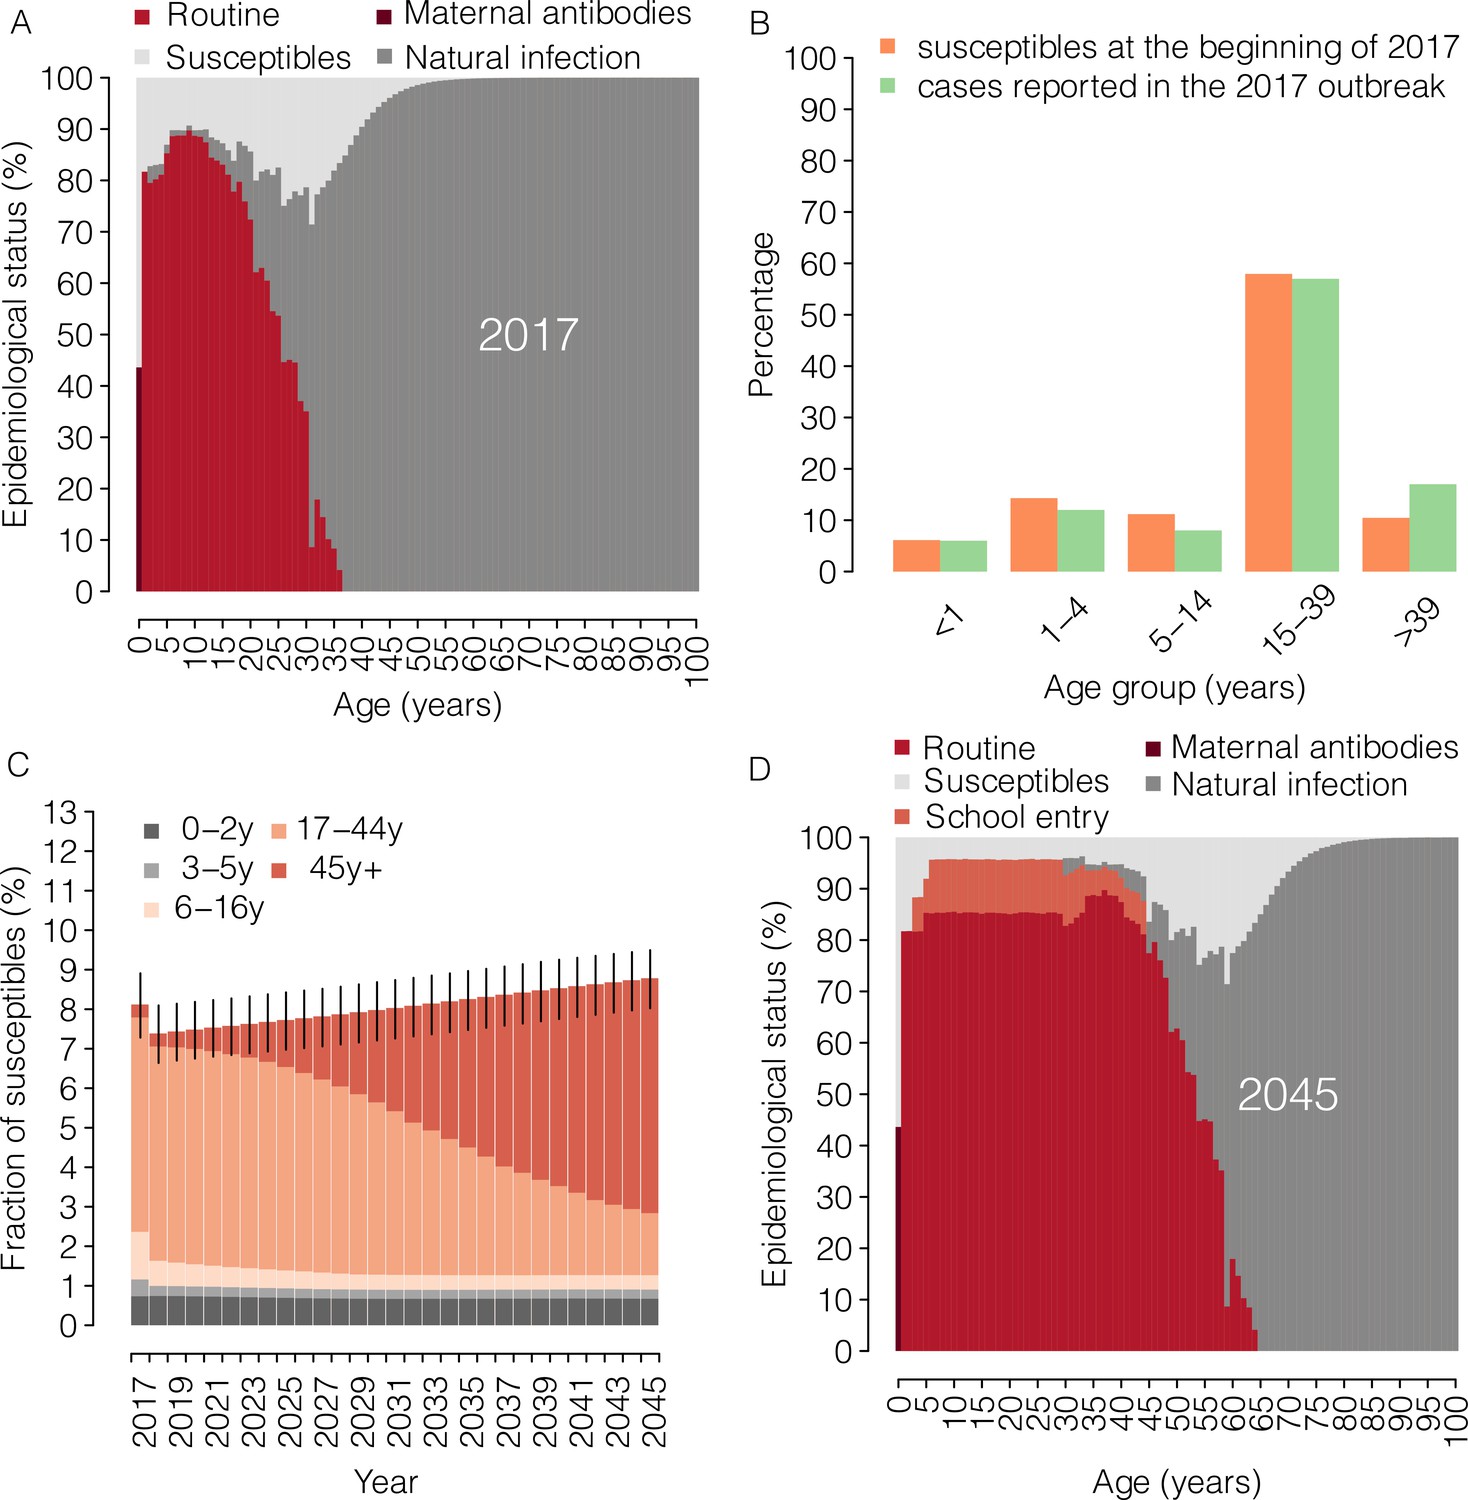
Measles epidemiology under the current program (2017–2045).
(A) Mean measles age-specific epidemiological status as estimated by Trentini et al. (2017) at the beginning of the year 2017. Shown for each age is the percentage of individuals who are susceptible to infection or protected against infection by immunity provided by maternal antibodies and by immunity acquired through natural infection or routine (first or second dose) vaccination. (B) The age distribution of susceptible individuals at the beginning of 2017, as simulated in our model (orange), and the age distribution of suspected measles cases reported during 2017 to the National Measles and Rubella Integrated Surveillance System (green) (Italian National Institute of Health, 2017). (C) Mean yearly fraction of susceptible individuals in Italy as estimated by the model for the period 2017–2045 under the ‘current’ vaccination program. Different colors correspond to different age groups; vertical bars represent 95% confidence intervals (CI) of model simulations. (D) Mean measles age-specific epidemiological status as obtained by the model for 2045 under the ‘current’ vaccination program. Shown for each age is the percentage of individuals who are susceptible to infection or protected against infection by maternal antibodies and by immunity acquired through natural infection, routine (first or second dose) vaccination or vaccination at school entry.
-
Figure 1—source data 1
Source data of Figure 1A.
- https://doi.org/10.7554/eLife.44942.004
-
Figure 1—source data 2
Source data of Figure 1B.
- https://doi.org/10.7554/eLife.44942.005
-
Figure 1—source data 3
Source data of Figure 1C.
- https://doi.org/10.7554/eLife.44942.006
-
Figure 1—source data 4
Source data of Figure 1D.
- https://doi.org/10.7554/eLife.44942.007
Figure 2
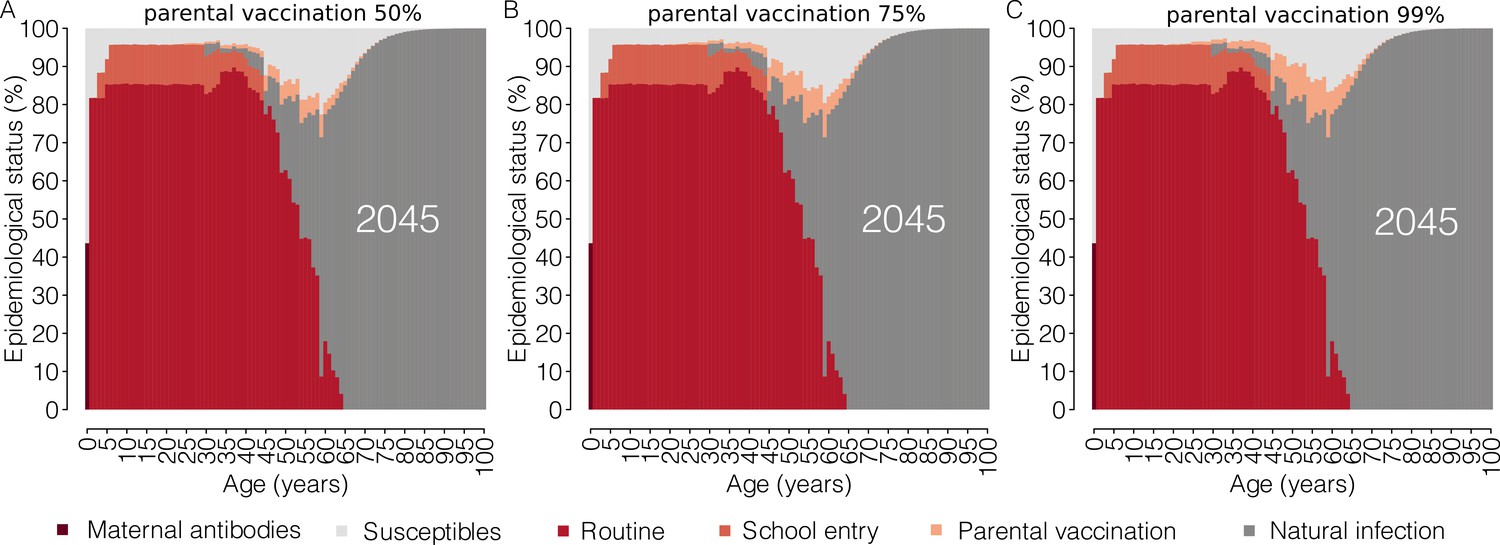
Impact of parental vaccination on the future age-specific immunity profiles.
Mean measles age-specific epidemiological status as estimated by the model for the year 2045 under different scenarios for the ‘parental vaccination’ program. Shown for each age is the percentage of individuals who are susceptible to infection or protected against infection by maternal antibodies and by immunity acquired through natural infection, routine (first or second dose) vaccination, vaccination at school entry or parental vaccination.
-
Figure 2—source data 1
Source data of Figure 2A.
- https://doi.org/10.7554/eLife.44942.009
-
Figure 2—source data 2
Source data of Figure 2B.
- https://doi.org/10.7554/eLife.44942.010
-
Figure 2—source data 3
Source data of Figure 2C.
- https://doi.org/10.7554/eLife.44942.011
Figure 3

Impact of parental vaccination on the proportion of measles-susceptible individuals.
Mean yearly fraction of susceptible individuals in the Italian population as estimated by the model for the period 2017–2045 under different scenarios for the ‘parental vaccination’ program. Different colors correspond to different age groups; vertical bars represent the 95% CI of the model simulations.
-
Figure 3—source data 1
Source data of Figure 3A.
- https://doi.org/10.7554/eLife.44942.013
-
Figure 3—source data 2
Source data of Figure 3B.
- https://doi.org/10.7554/eLife.44942.014
-
Figure 3—source data 3
Source data of Figure 3C.
- https://doi.org/10.7554/eLife.44942.015
Figure 4
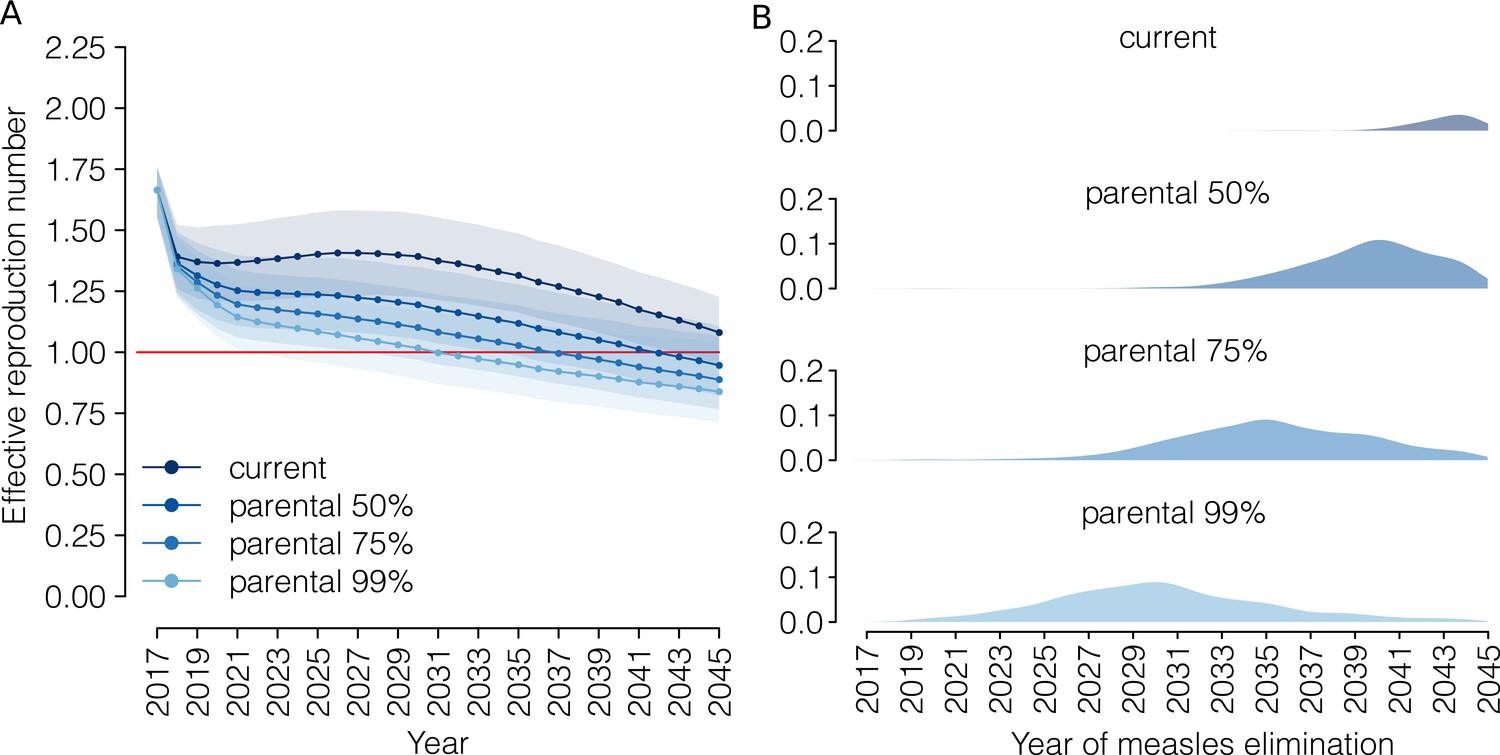
Progress towards measles elimination.
(A) Mean effective reproduction number over time, as estimated by the model under the ‘current’ vaccination program and under different coverage scenarios for the ‘parental vaccination’ program. Shaded areas represent the 95% CI associated with model estimates. The red line represents the measles elimination threshold; elimination is achieved when the effective reproductive number is smaller than 1. (B) Probability associated with different time at measles elimination, as obtained by 1000 model realizations under the ‘current’ vaccination program and under different coverage scenarios for the ‘parental vaccination’ program.
-
Figure 4—source data 1
Source data of Figure 4A.
- https://doi.org/10.7554/eLife.44942.017
-
Figure 4—source data 2
Source data of Figure 4B.
- https://doi.org/10.7554/eLife.44942.018
Appendix 1—figure 1
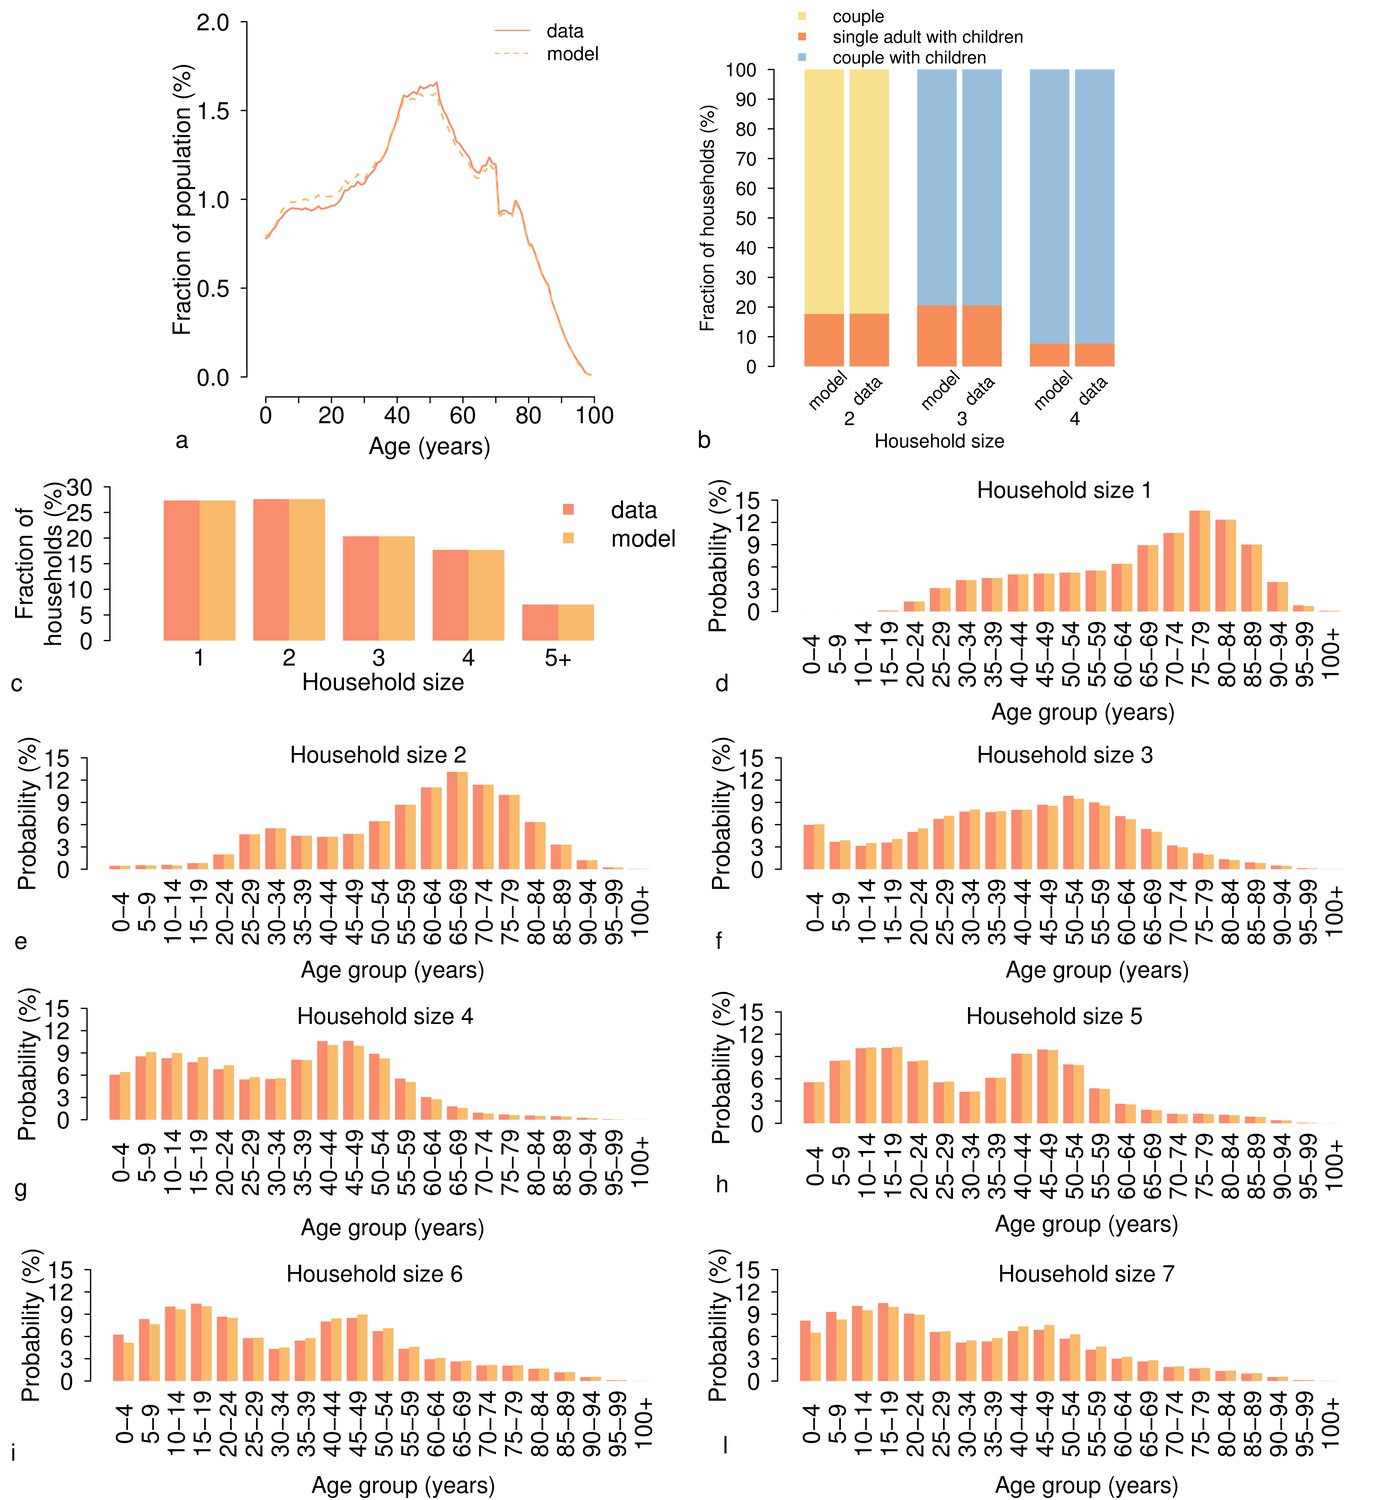
Age distribution and household structure of the Italian population in the year 2017.
(a) Age distribution of the Italian population as simulated by the model (dotted line) and as reported by the Italian National Institute of Statistics (solid line) for 2017 (Italian National Institute of Statistics, 2018). (b) Fraction of households of different type (%) as simulated by the model and as observed in the census data (Statistical Office of the European Commission, 2011) for different household sizes. (c) Fraction of households by size (%) as simulated by the model and as observed in census data (Statistical Office of the European Commission, 2011). (d-l) Age distribution of household members by household size h∈{1,…,7} as simulated by the model and as observed in census data (Statistical Office of the European Commission, 2011).
Appendix 1—figure 2
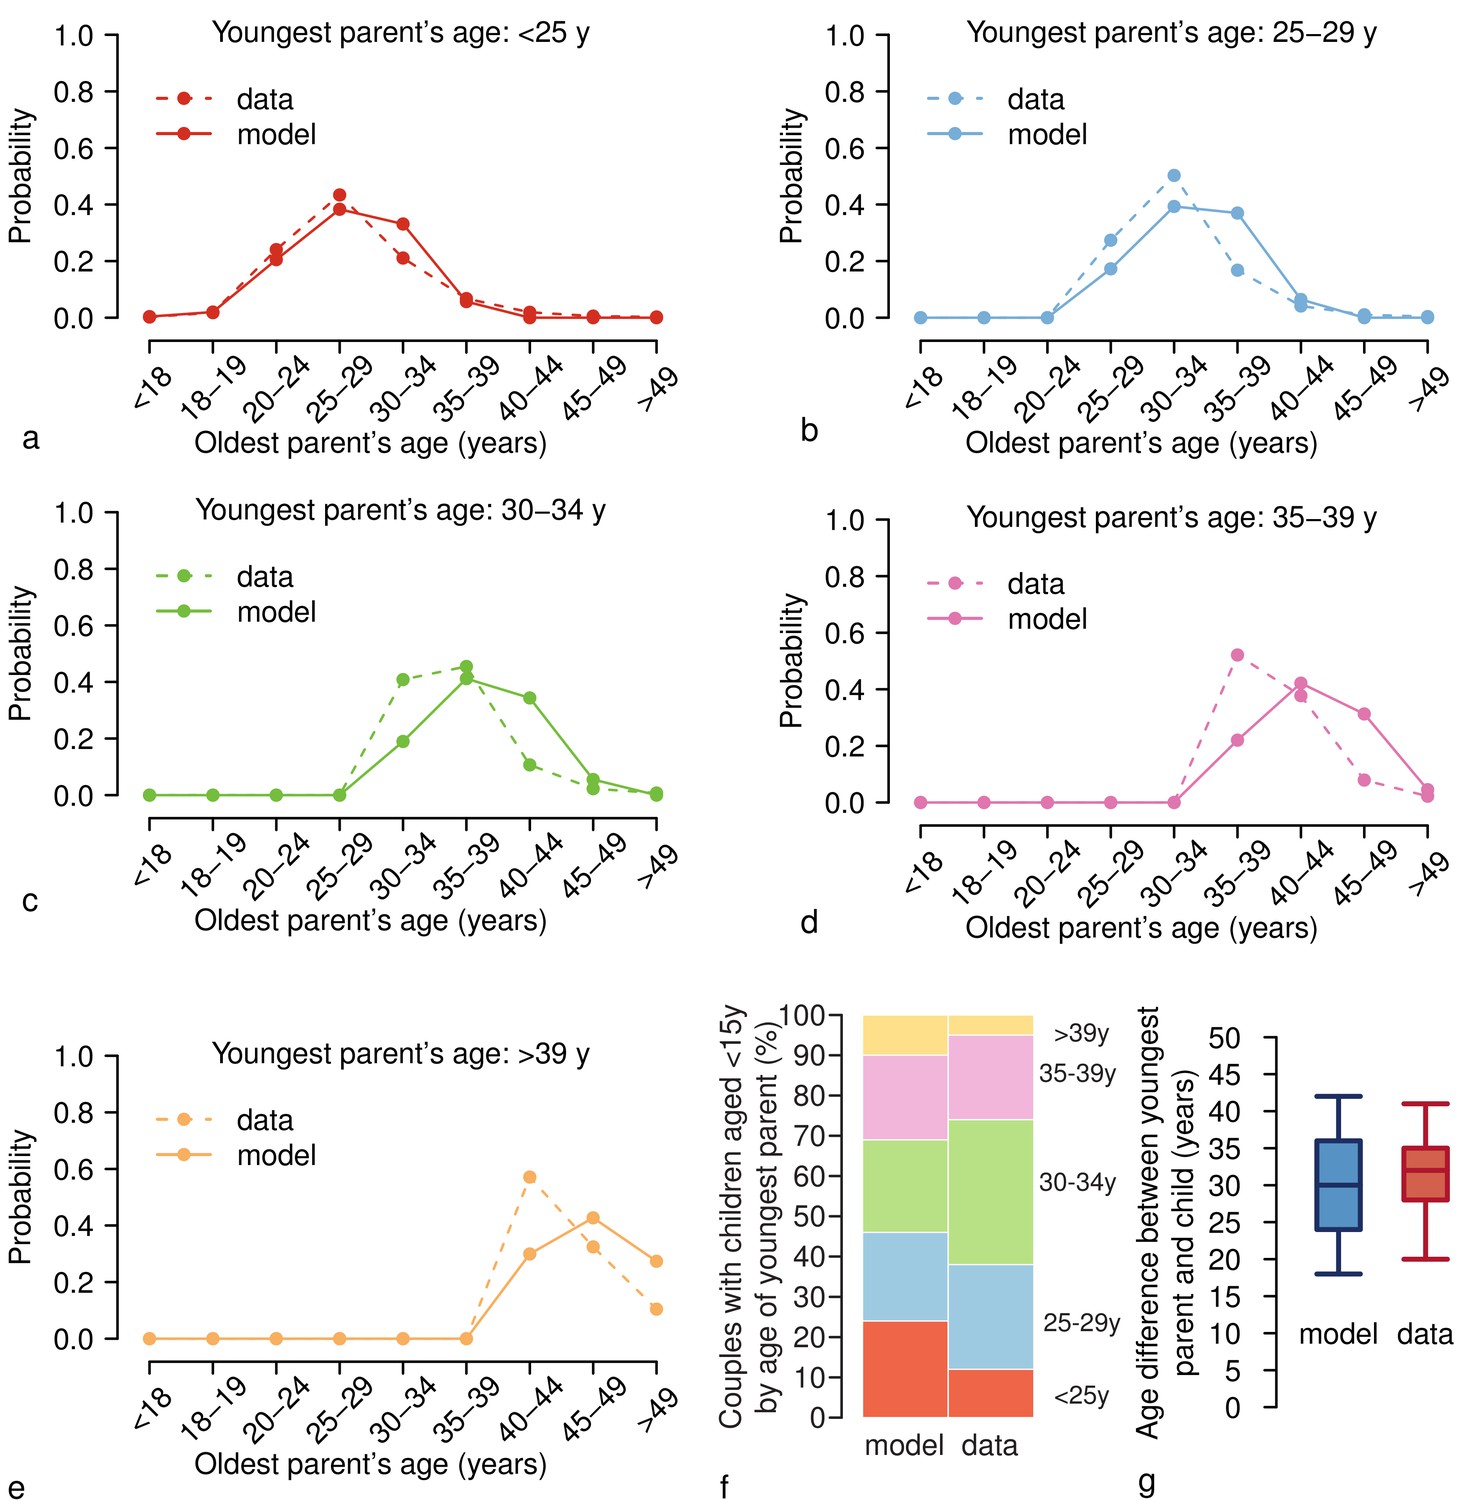
Age differences between household members.
(a) Age distribution of the oldest parent in households in which the youngest parent is less than 25 years old as simulated by the model (solid line) and as observed in the census data (dotted line) (Statistical Office of the European Commission, 2011). (b-e) As (a) but for households in which the youngest parent is aged (b) 25–29 years, (c) 30–34 years, (d) 35–39 years, and (e) > 39 years. (f) Simulated and observed fractions of couples (%) with children younger than 15 years disaggregated by age of the youngest parent. (g) Boxplots (percentiles: 2.5, 25, 50, 75, and 97.5) of the age difference between the youngest parents and their children as simulated by the model (blue) and as observed in the census data (red) (Statistical Office of the European Commission, 2011).
Appendix 1—figure 3
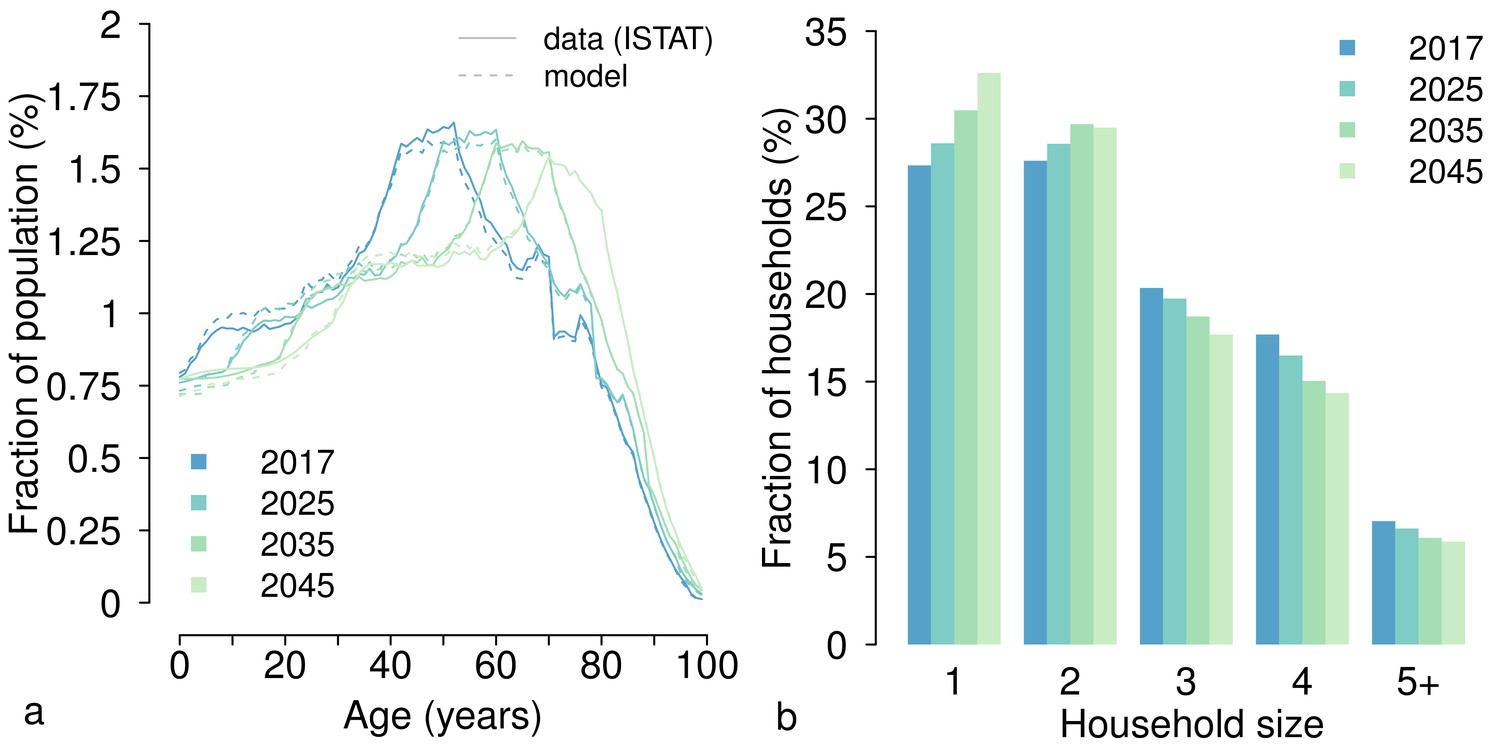
Age distribution of the Italian population and household size over the period 2017–2045.
(a) Age distribution of the Italian population in different years as estimated by the model (dotted lines) and according to the median demographic projections provided by the Italian National Institute of Statistics (Supplementary file 1) (Italian National Institute of Statistics, 2018). (b) Fraction of households by size (%) as obtained by the model for different years.
Appendix 1—figure 4
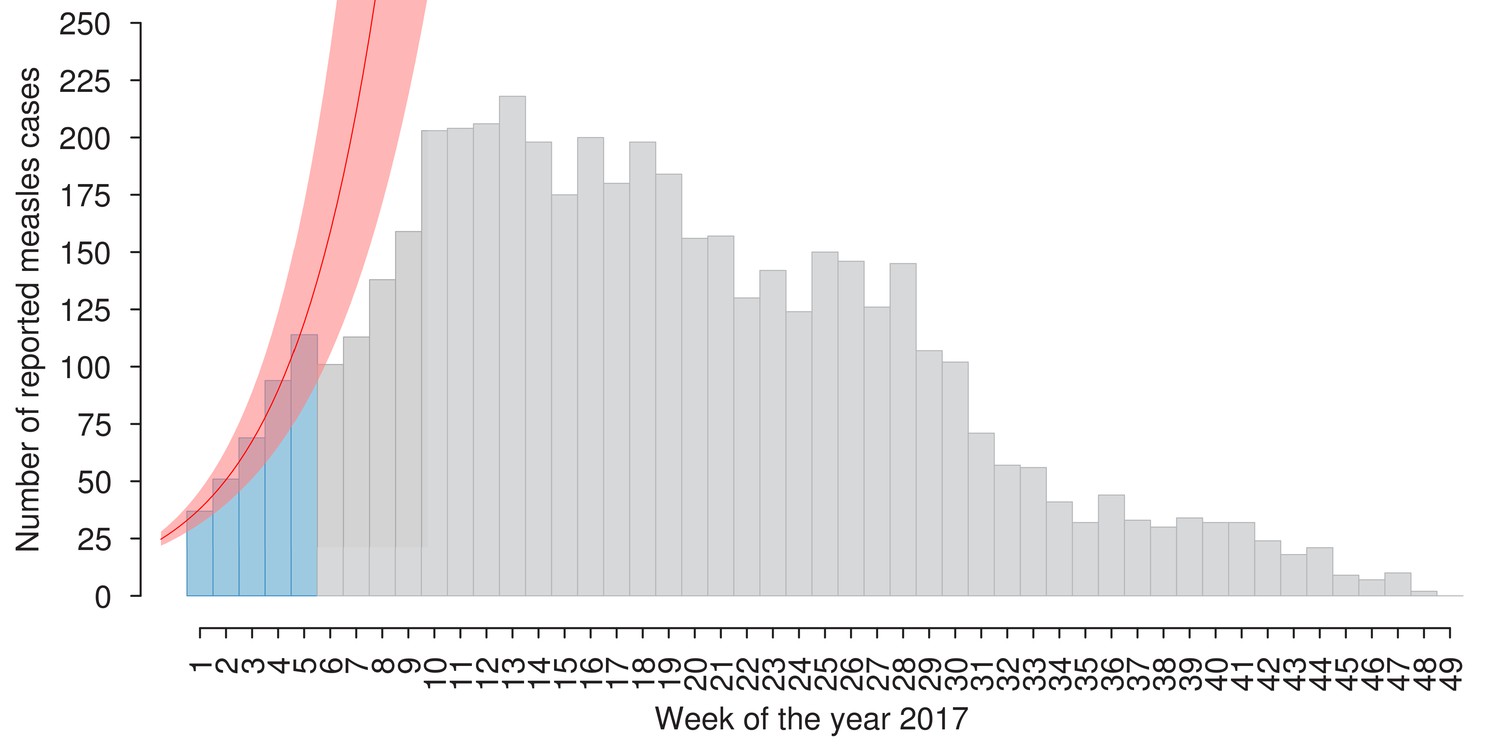
Number of new suspected measles cases per week as reported to the Italian National Health Institute in the year 2017 (light-blue and grey bars) (Italian National Institute of Health, 2017).
The exponential fit (mean and 95% CI) associated with the exponential growth rate r is shown in red. This curve was obtained by fitting a linear model to the logarithm of the number of weekly reported cases in the early epidemic phase (light-blue bars), when the fraction of susceptible individuals in the population is sufficient to sustain exponential growth (Chowell et al., 2004; Wallinga and Lipsitch, 2007; Mills et al., 2004). The time window of 5 weeks represents the largest duration during which the fit provided a coefficient of determination (R-square) larger than 0.99.
Appendix 1—figure 5
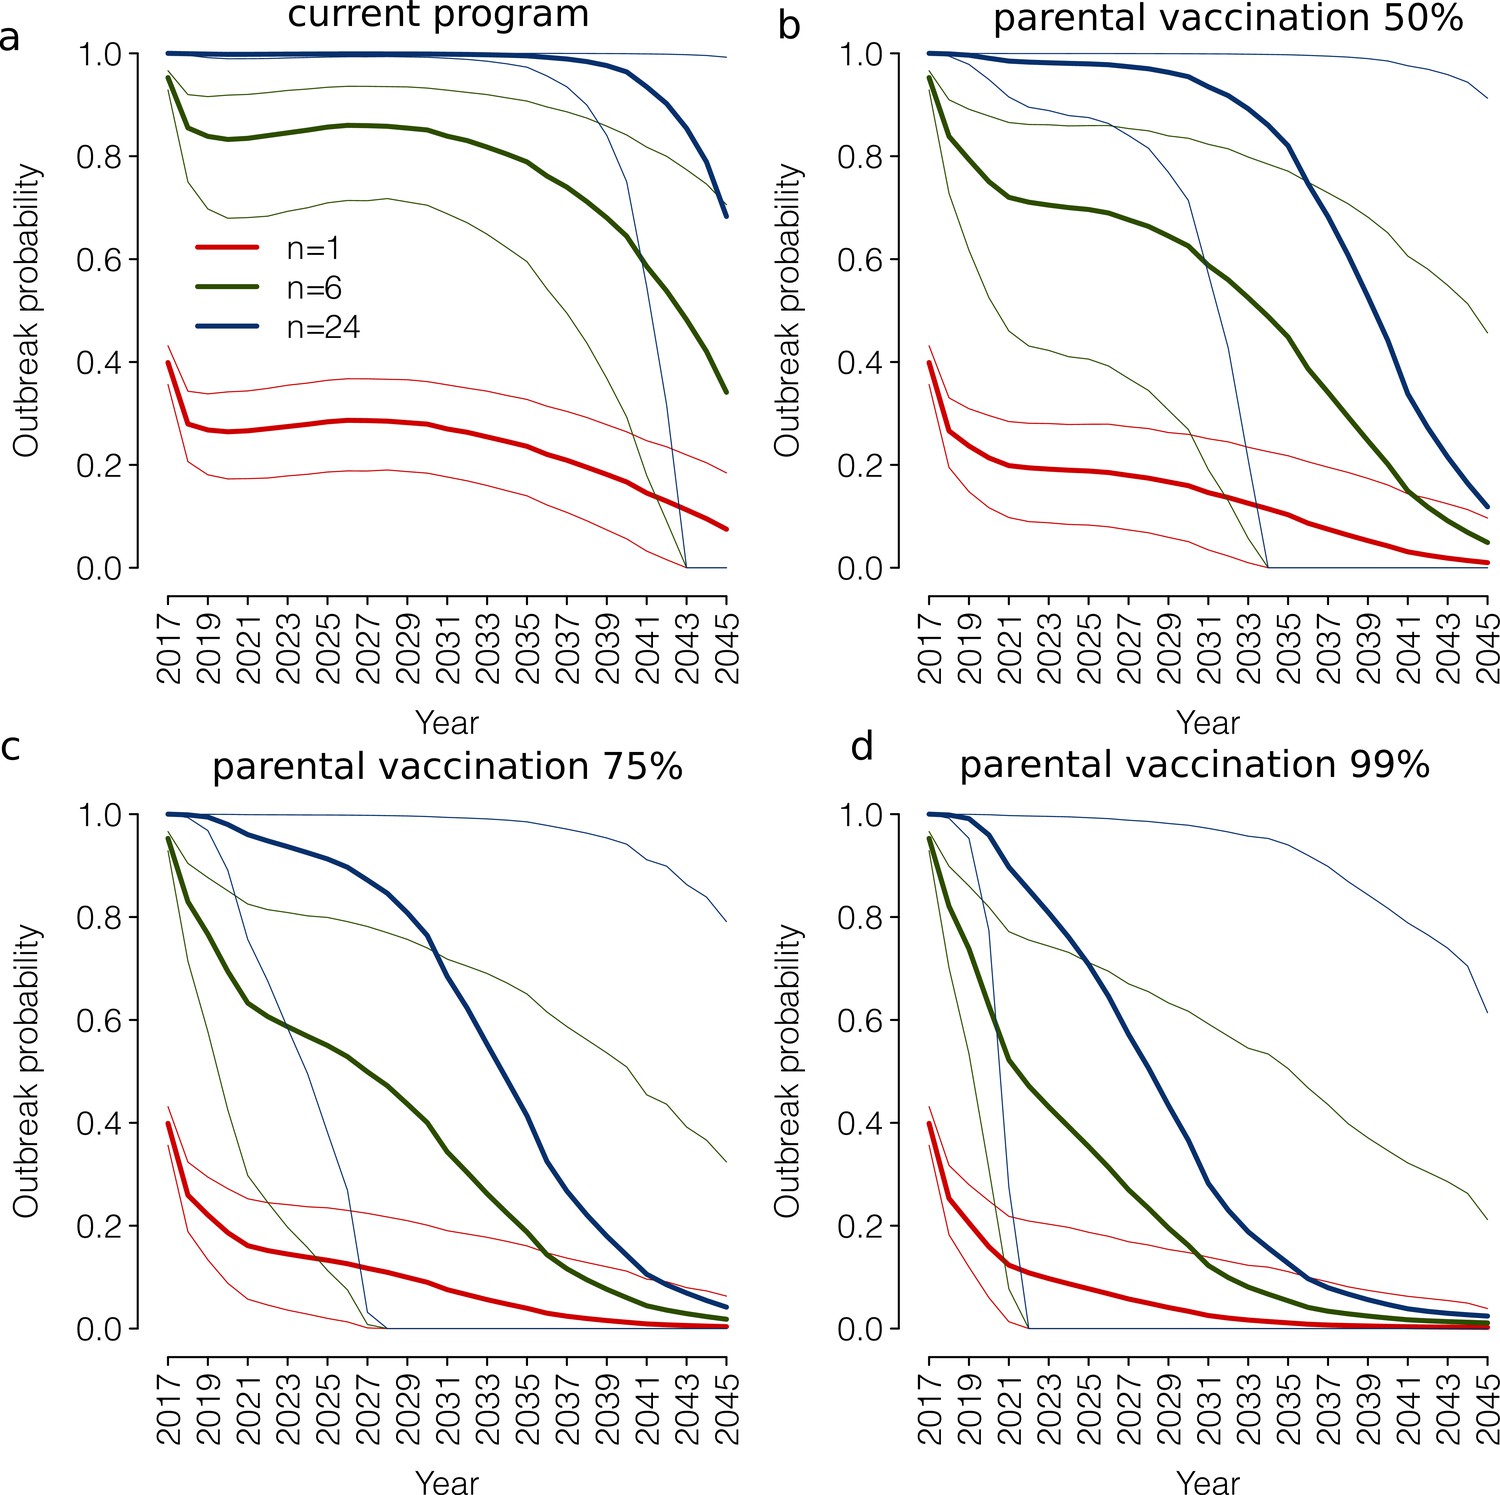
Outbreak probability under different assumptions relating to the number of imported cases over a year.
(a) Outbreak probability (mean, bold lines, and 95% CI, thin lines) associated to n=1, n=6, n=24 yearly imported measles cases as estimated by the model for the period 2017–2045 under the current program. (b) As (a) but under the parental vaccination program with 50% coverage. (c) As (a) but under the parental vaccination program with 75% coverage. (d) As (a) but under the parental vaccination program with 99% coverage.
Appendix 1—figure 6
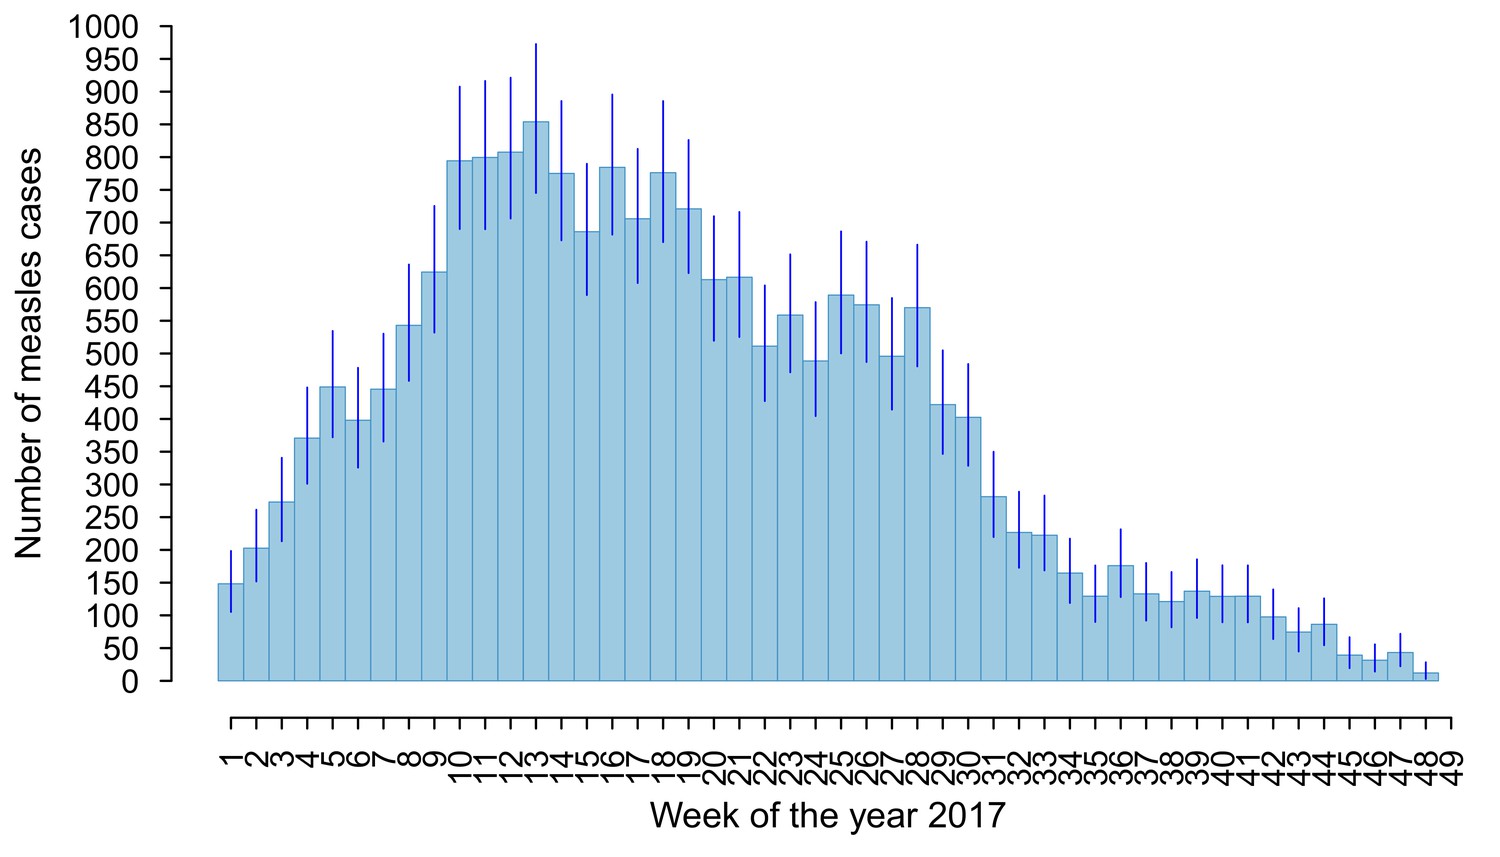
Weekly number of overall measles cases (mean and 95% CI) per week of the year 2017 as obtained when assuming a reporting rate of 25%.
https://doi.org/10.7554/eLife.44942.029
Appendix 1—figure 7
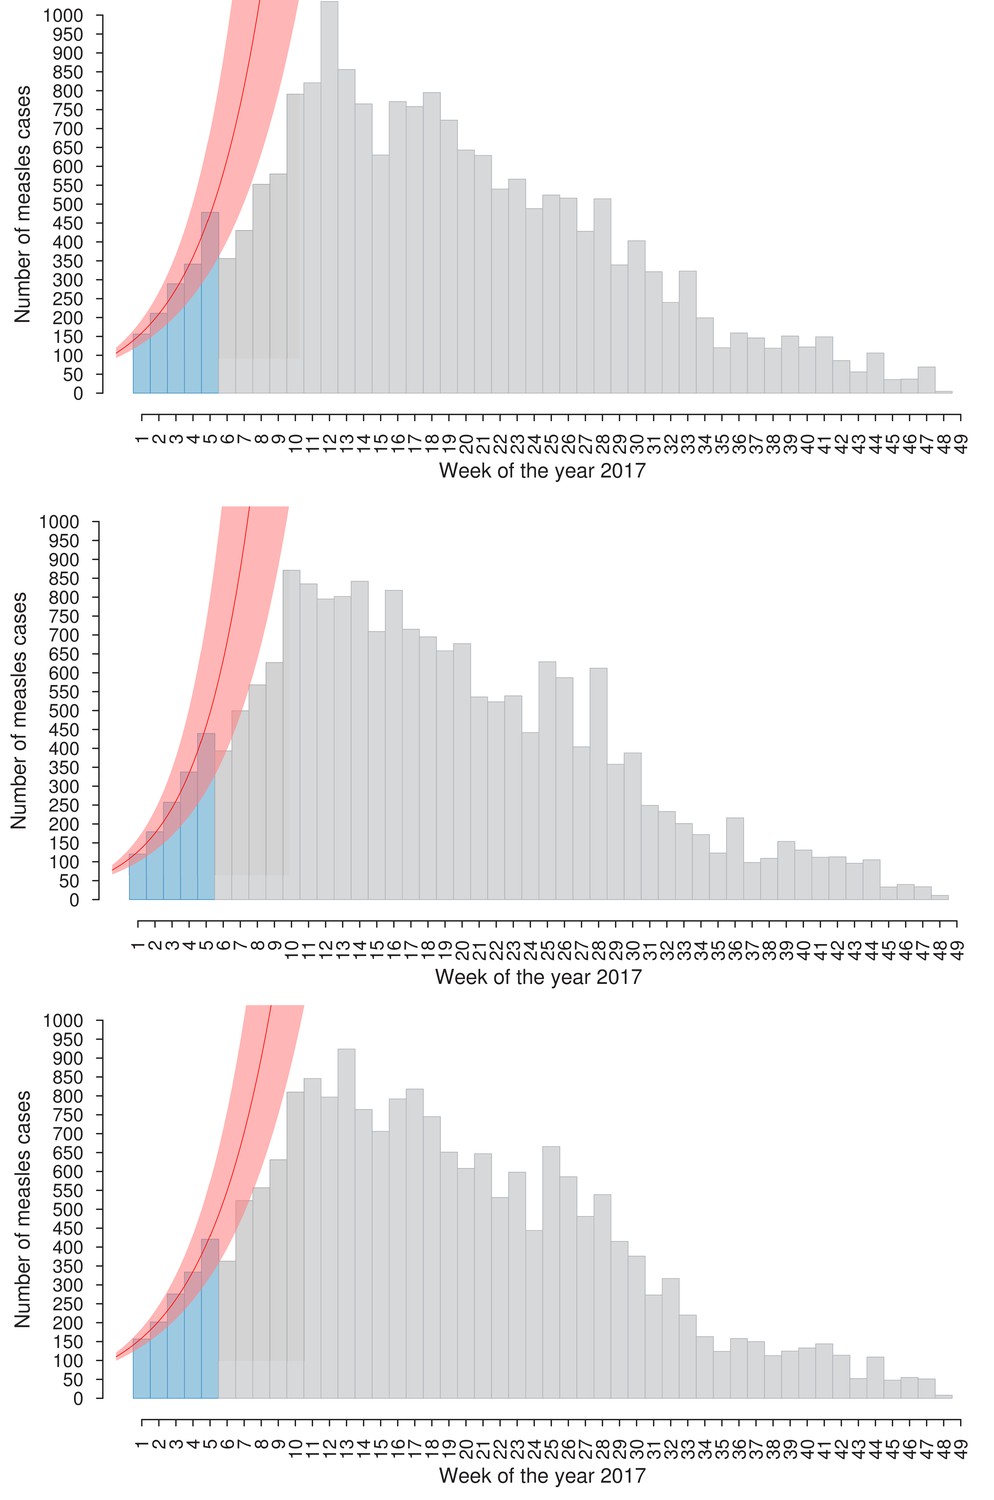
Three illustrative time series of measles cases obtained through the MCMC approach (light-blue and grey bars).
In red, the exponential fit (mean and 95% CI) associated with the exponential growth rate r is obtained by fitting a linear model to the logarithm of the estimated weekly cases in the early epidemic phase (defined by light-blue bars).
Appendix 1—figure 8
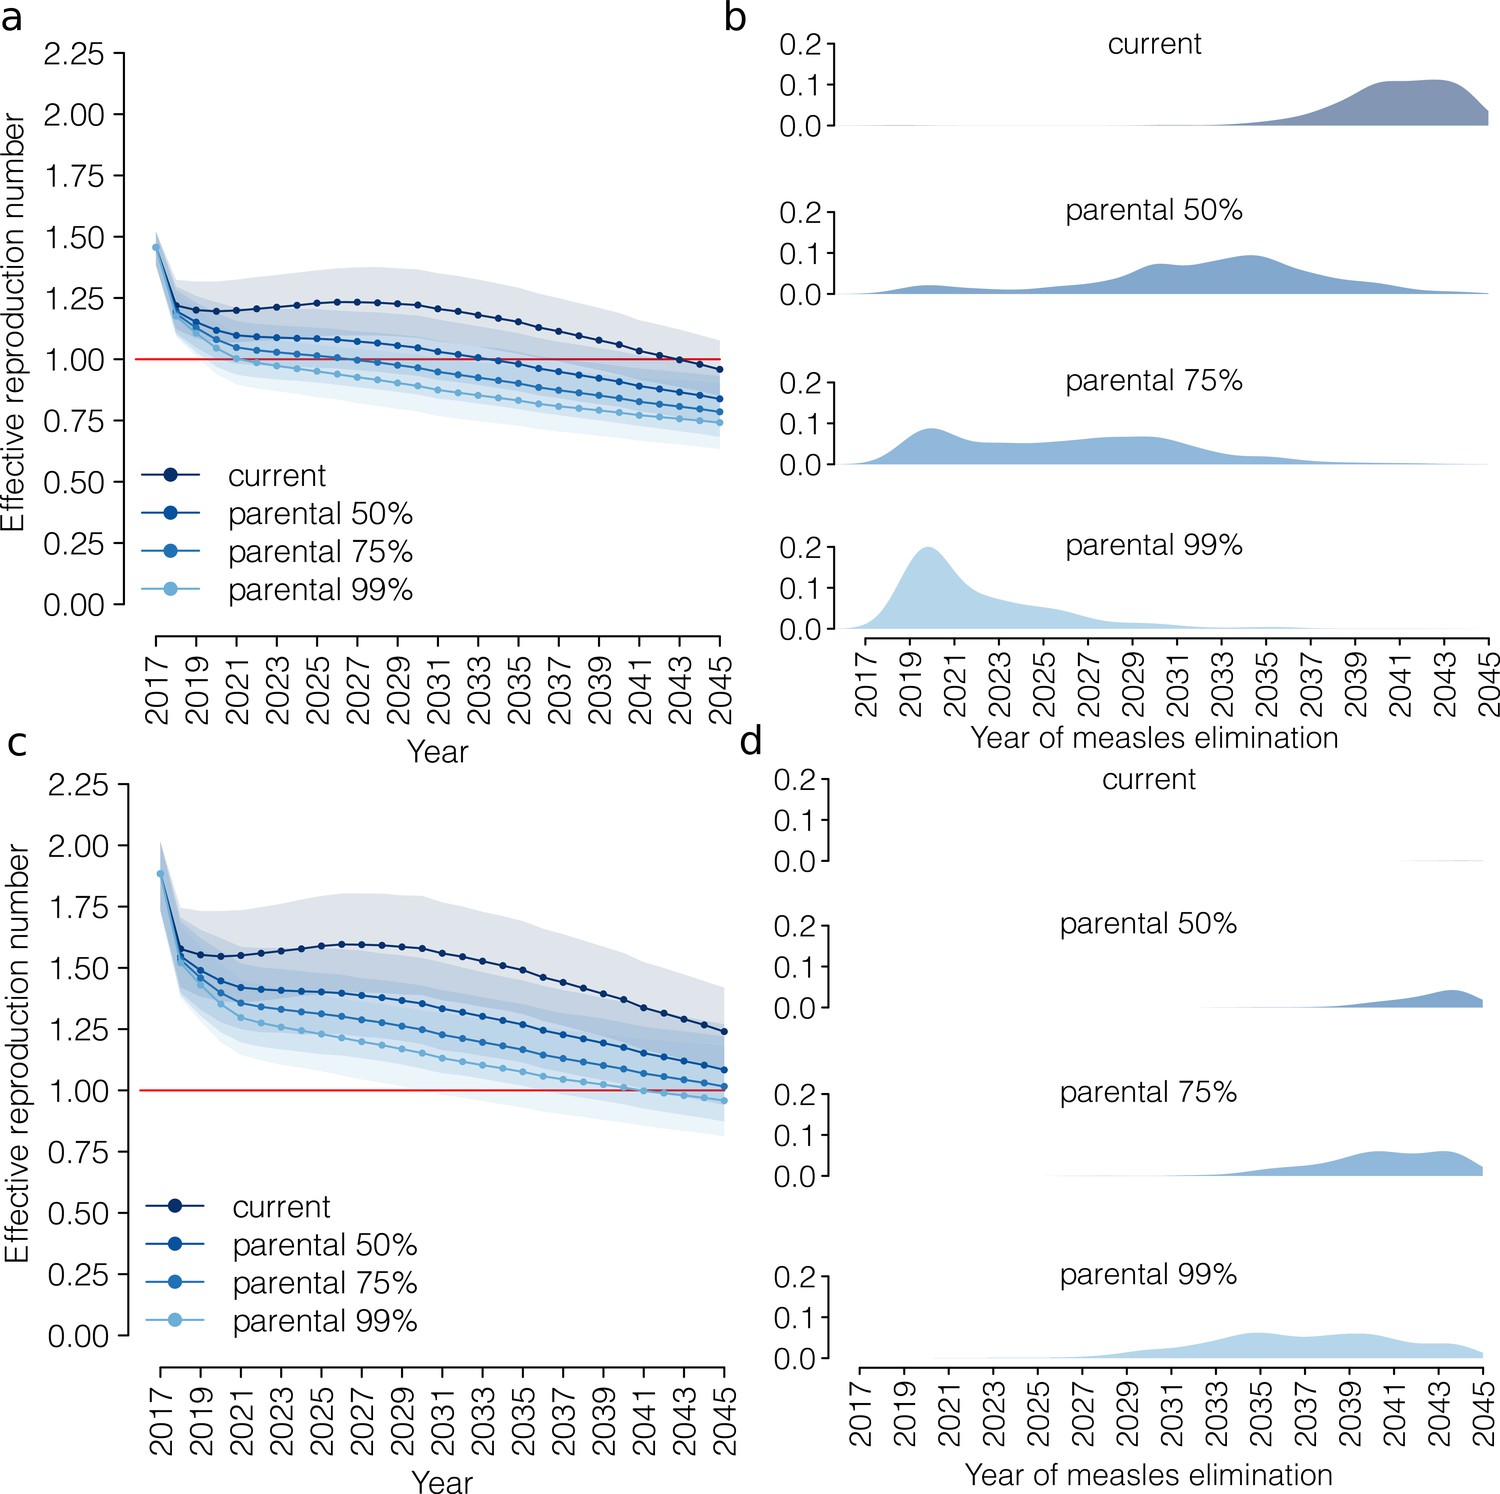
Future trends in measles elimination under different assumptions on the generation time.
(a) Mean effective reproduction number over time, as estimated by the model under the ‘current’ vaccination program and under different coverage scenarios for the ‘parental vaccination’ program when assuming a generation time lasting 10 days on average. Shaded areas represent 95% CI associated with model estimates. The red line represents the measles elimination threshold; elimination is achieved when the effective reproductive number is smaller than 1. (b) Probability associated with the different times of measles elimination, as obtained from 1000 model realizations under the ‘current’ vaccination program and under different coverage scenarios for the ‘parental vaccination’ when assuming a generation time lasting 10 days on average. (c) As (a) but when assuming a generation time lasting 18 days on average. (d) As (b) but when assuming a generation time lasting 18 days on average.
Appendix 1—figure 9
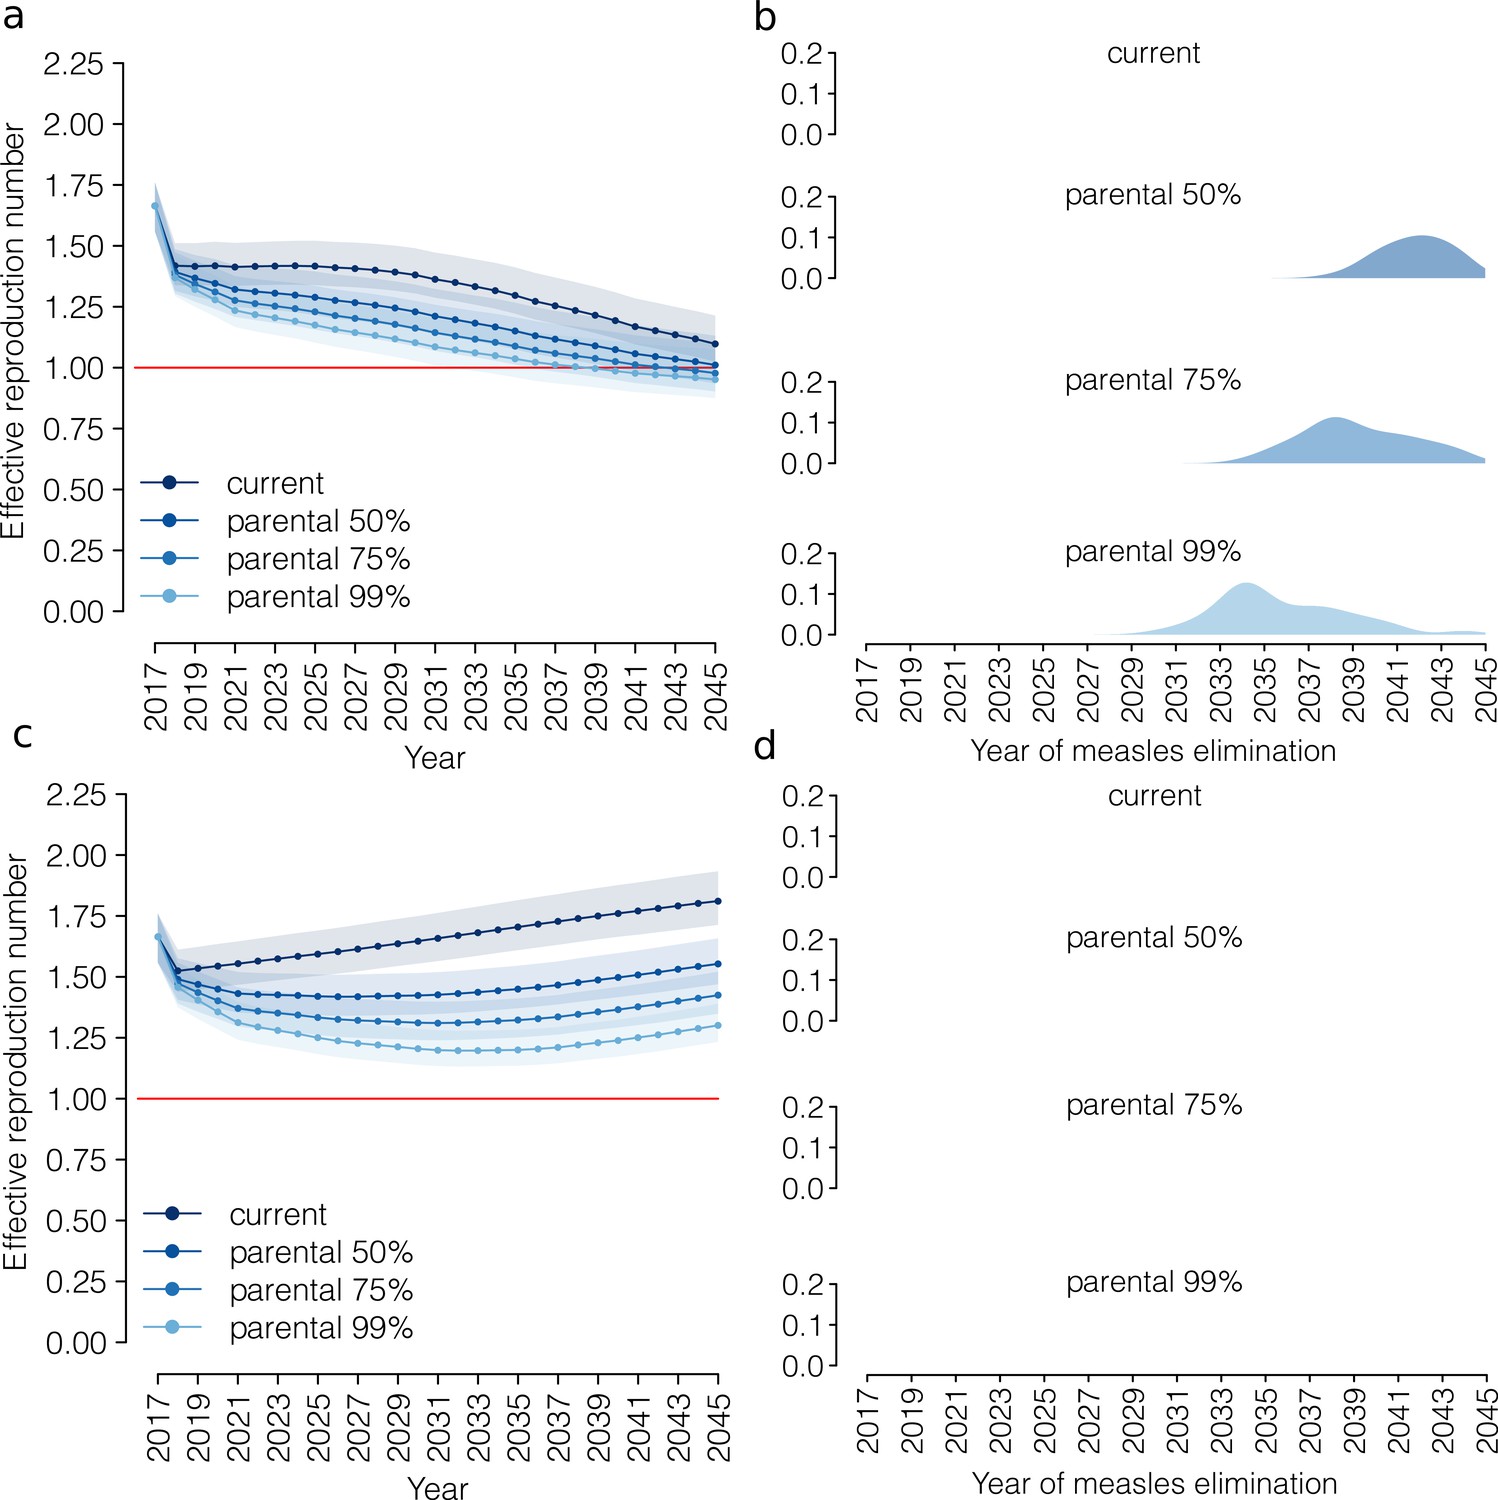
Future trends in measles elimination: population mixing.
(a) Mean effective reproduction number over time, as estimated by the model under the ‘current’ vaccination program and under different coverage scenarios for the ‘parental vaccination’ program when assuming contact matrices estimated by Fumanelli et al. (2012). Shaded areas represent 95% CI associated with model estimates. The red line represents the measles elimination threshold; elimination is achieved when the effective reproductive number is smaller than 1. (b) Probability associated with different time at measles elimination, as obtained from 1000 model realizations under the ‘current’ vaccination program and under different coverage scenarios for the ‘parental vaccination’ when assuming contact matrices as estimated by Fumanelli et al. (2012). (c) As (a) but when assuming homogeneous mixing in the population. (d) As (b) but when assuming homogeneous mixing in the population.
Appendix 1— figure 10
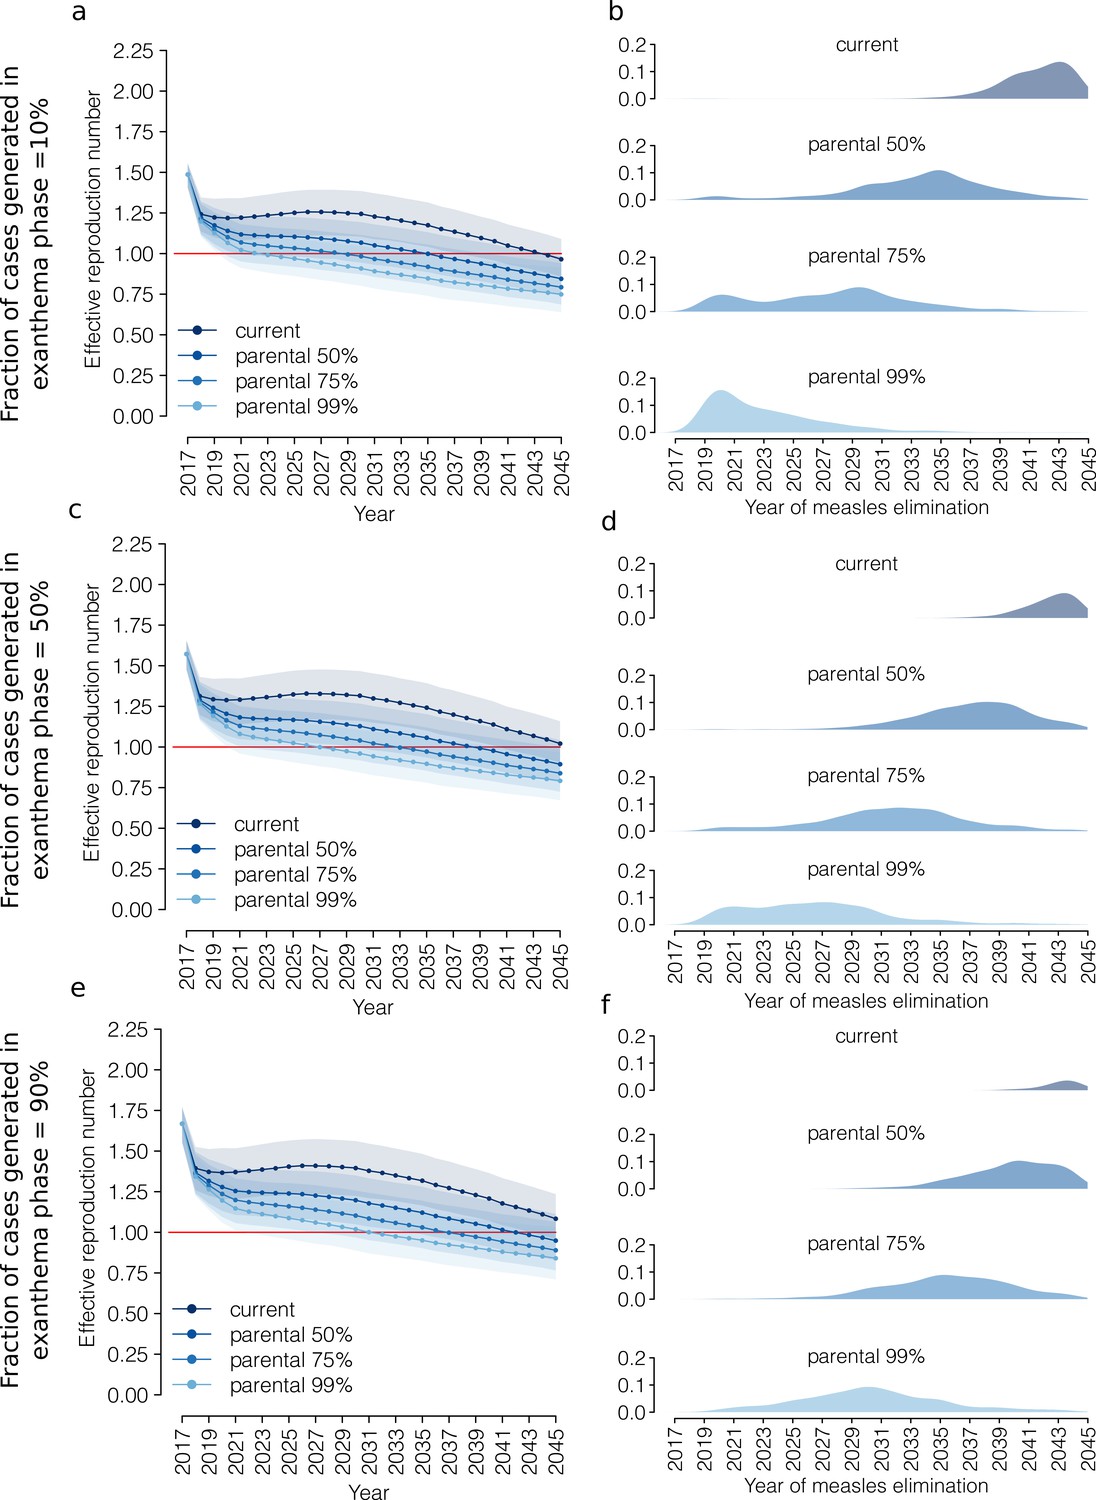
Future trends in measles elimination: prodromal and exanthema phases.
Left column: mean effective reproduction number over time, as estimated by the model under the 'current' vaccination program and under different coverage scenarios for the 'parental vaccination' program. Shaded areas represent the 95% CI associated with the model estimates. The red line represents the measles elimination threshold; elimination is achieved when the effective reproductive number is smaller than 1. Right column: probability associated with different time at measles elimination, as obtained from 1000 model realizations under the 'current' vaccination program and under different coverage scenarios for 'parental vaccination'. For each vaccination scenario, the effective reproduction number in the year 2017 was computed by accounting for two distinct infectivity phases, prodromal and exanthema, and by assuming that the latter contributes to a fraction k of secondary cases. Different rows correspond to different scenarios for the value of k: 10%, 50%, or 90%.
Appendix 1—figure 11
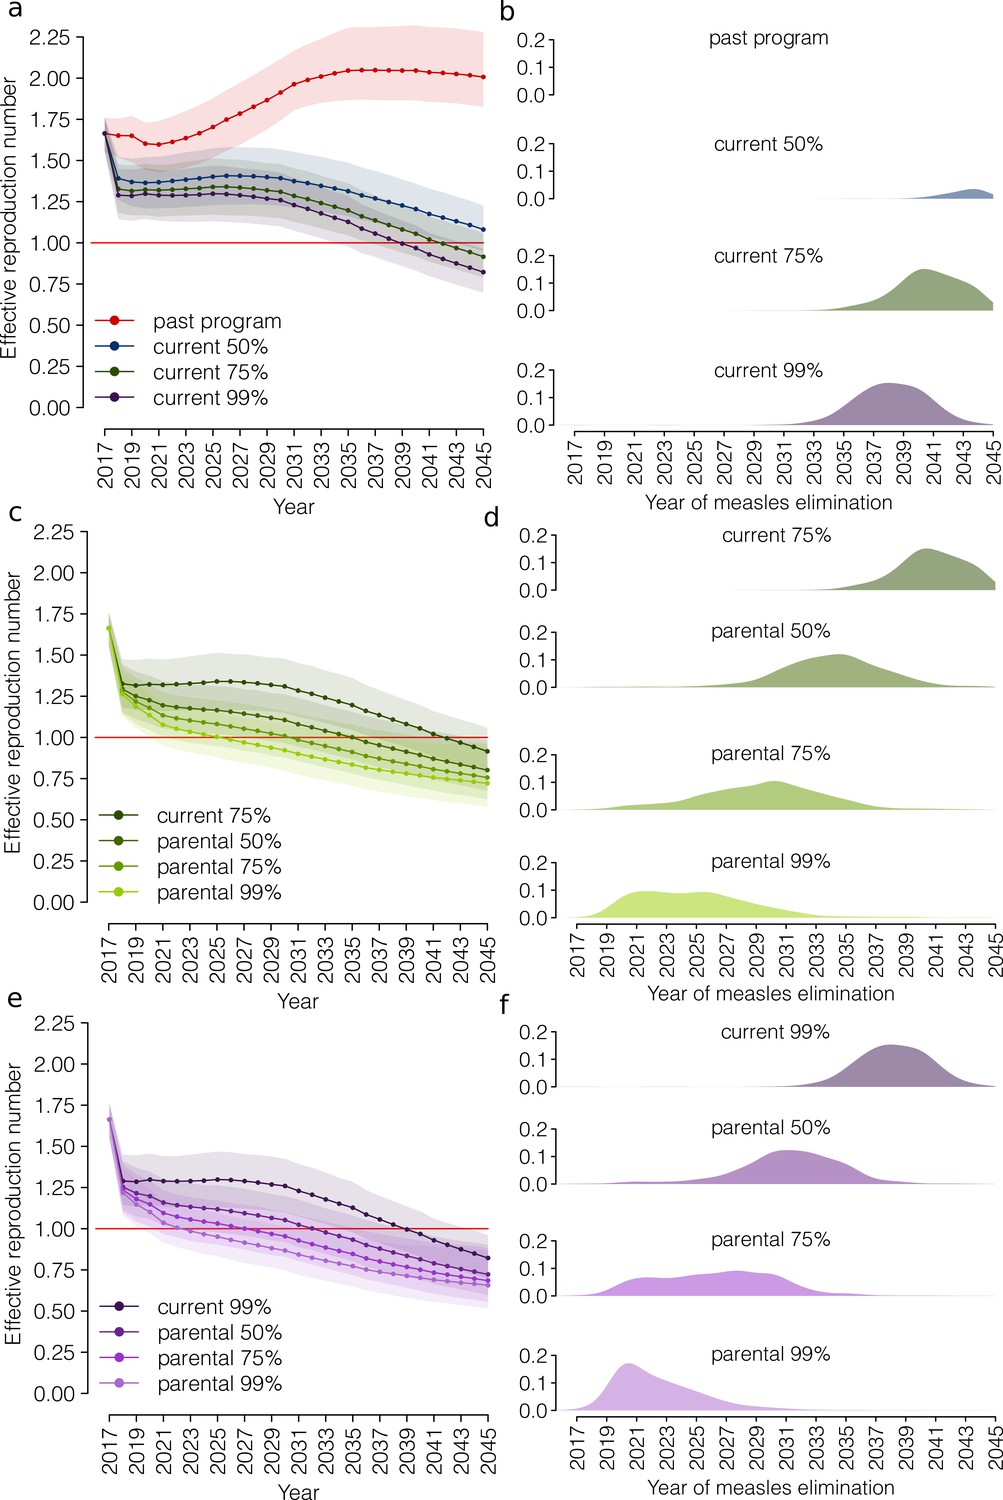
Future trends in measles elimination: different levels of vaccination coverage for the ‘current’ program.
(a) Mean effective reproduction number over time, as estimated by the model under different coverage scenarios for the ‘current’ vaccination program: 0% (vaccination program in place before 2017), 50% (baseline), 75% and 99%. Shaded areas represent the 95% CI associated with the model estimates. The red line represents the measles elimination threshold; elimination is achieved when the effective reproductive number is smaller than 1. (b) Probability associated with different times at measles elimination, as obtained from 1000 model realizations under different coverage scenarios for the ‘current’ vaccination program: 0%, 50% (baseline), 75% and 99%. (c) As (a) but as obtained under the ‘current’ vaccination program (coverage 75%) and under different coverage scenarios for ‘parental vaccination’. (d) As (b) but as obtained under the ‘current’ vaccination program (coverage 75%) and under different coverage scenarios for ‘parental vaccination’. (e) As (a) but as obtained under the ‘current’ vaccination program (coverage 99%) and under different coverage scenarios for ‘parental vaccination’. (f) As (b) but for as obtained under the ‘current’ vaccination program (coverage 99%) and under different coverage scenarios for ‘parental vaccination’.
Additional files
-
Source code 1
Code used to run model simulations (C programming language).
- https://doi.org/10.7554/eLife.44942.019
-
Supplementary file 1
Stochastic demographic projections of the age structure of the Italian population over the 2018–2045 period as provided by the Italian National Institute of Statistics (ISTAT).
- https://doi.org/10.7554/eLife.44942.020
-
Supplementary file 2
Bootstrapped contact matrices as obtained from random sampling of participants to the POLYMOD contact survey.
- https://doi.org/10.7554/eLife.44942.021
-
Transparent reporting form
- https://doi.org/10.7554/eLife.44942.022
Download links
A two-part list of links to download the article, or parts of the article, in various formats.
Downloads (link to download the article as PDF)
Open citations (links to open the citations from this article in various online reference manager services)
Cite this article (links to download the citations from this article in formats compatible with various reference manager tools)
Parental vaccination to reduce measles immunity gaps in Italy
eLife 8:e44942.
https://doi.org/10.7554/eLife.44942


