The complete structure of the human TFIIH core complex
- University of California, United States
- Lawrence Berkeley National Laboratory, United States
- Howard Hughes Medical Institute, University of California, United States
Figures
Figure 1 with 6 supplements
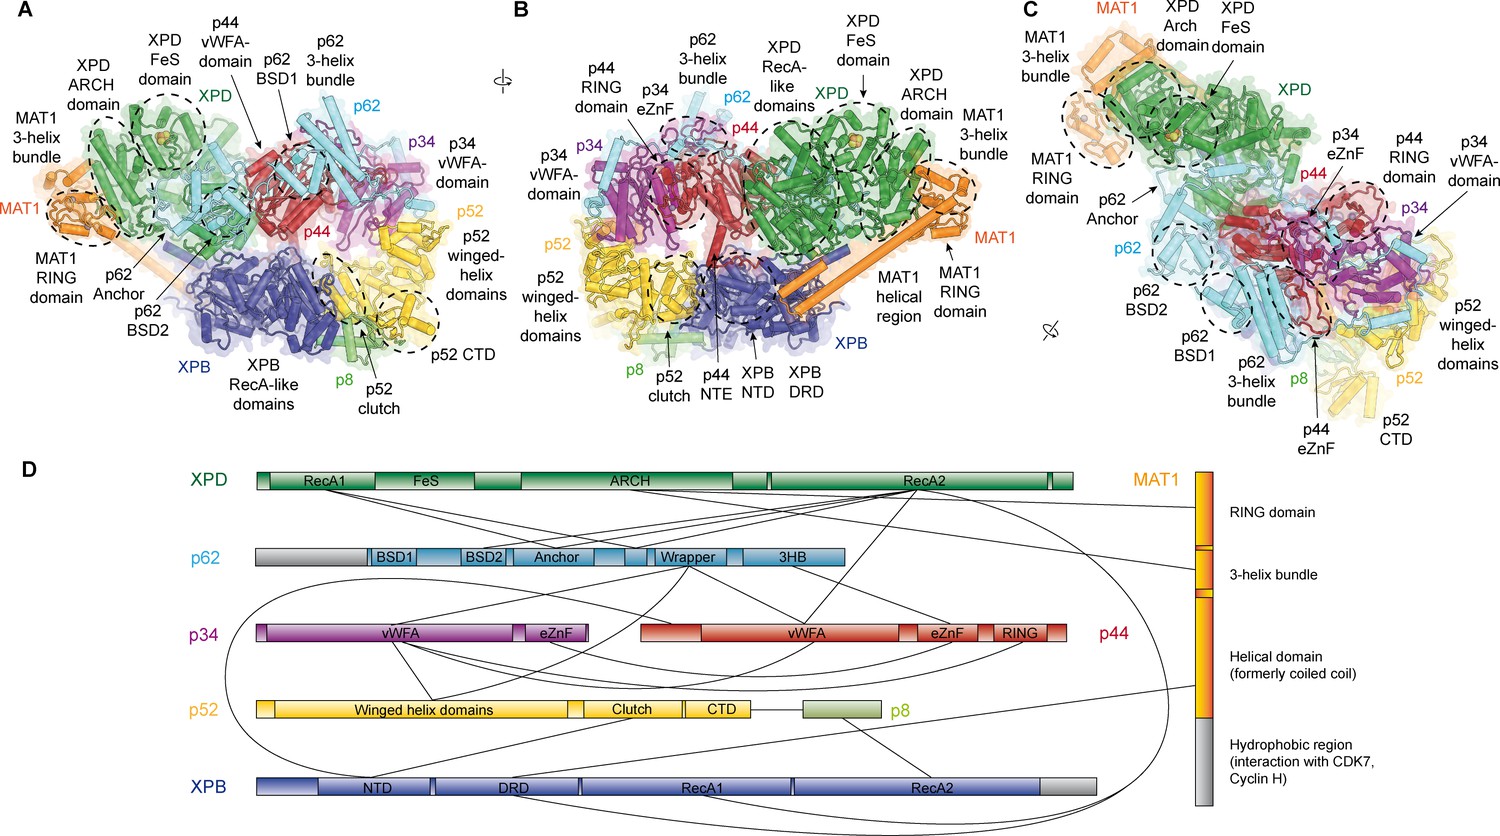
Structure of the TFIIH core complex.
(A, B, C) Three views of the structure of the TFIIH core complex and MAT1. Subunits are color-coded and labeled (in color); individual domains are labeled (in black) and circled if needed for clarity. (D) Domain-level protein-protein interaction network between the components of the TFIIH core complex and MAT1 derived from the interactions observed in our structure. Proteins are shown with the same colors as in A and major unmodeled regions are shown in grey. Abbreviations: CTD: C-terminal domain; DRD: DNA damage recognition domain; FeS: iron sulfur cluster domain; NTD: N-terminal domain; vWFA: von Willebrand Factor A.
Figure 1—figure supplement 1
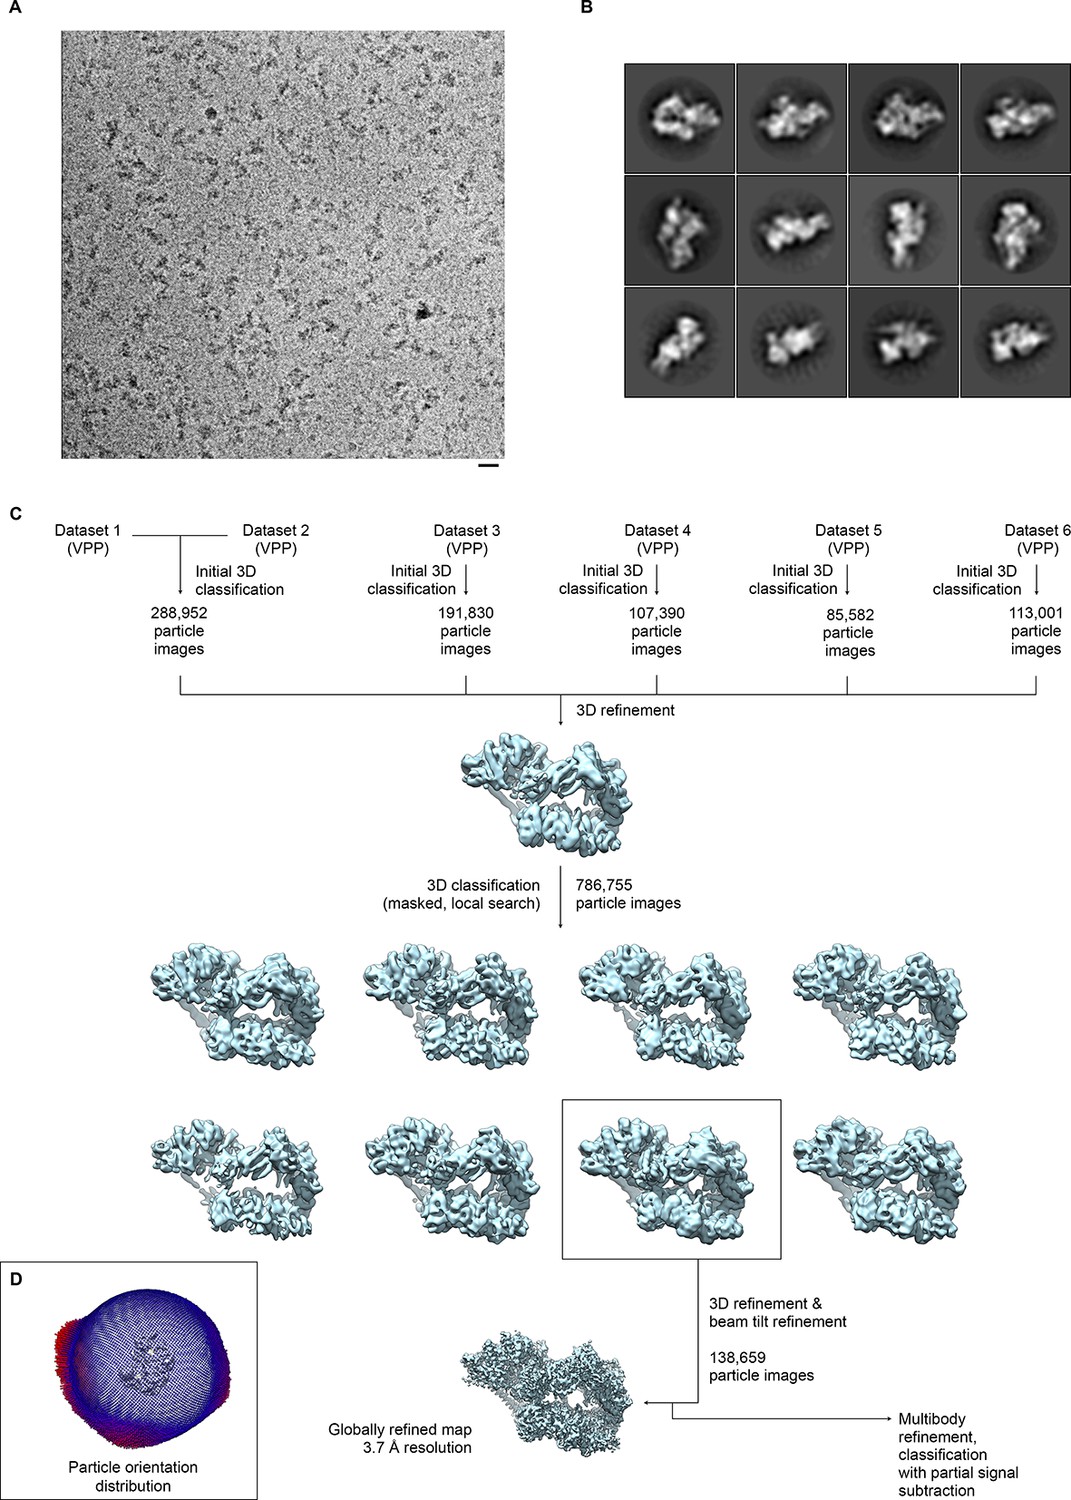
Sample micrograph, sample 2D classes, and data processing scheme for global reconstruction.
(A) Sample micrograph from dataset 2. TFIIH particles are clearly visible. Scale bar: 200 Å. (B) Sample 2D classes from dataset 2. Note that 2D classification was only used for initial characterization of the datasets, but not for subsequent data processing. (C) Data processing workflow. The datasets (DS) were initially processed individually, with the exception of DS6, where particles from DS4 were used to compensate for orientation bias, and DS1/DS2, which were joined for processing. Subsequently, the datasets were pooled and sub-classified. The best class was used for the final refinement to obtain a globally refined map at 3.7 Å resolution (see Figure 1—figure supplement 2). The classified VPP dataset was also used for further processing and classification of sub-regions (Figure 1—figure supplements 3–5). (D) Depiction of the orientation distribution of the particle images in the final reconstruction. As also evident from the 2D classes (C), the orientations populate mostly a zone that corresponds to particles adhering to the carbon support with long axis of the complex parallel to the support layer, and a range of orientations arising from rotation of the particles around that long axis.
Figure 1—figure supplement 2
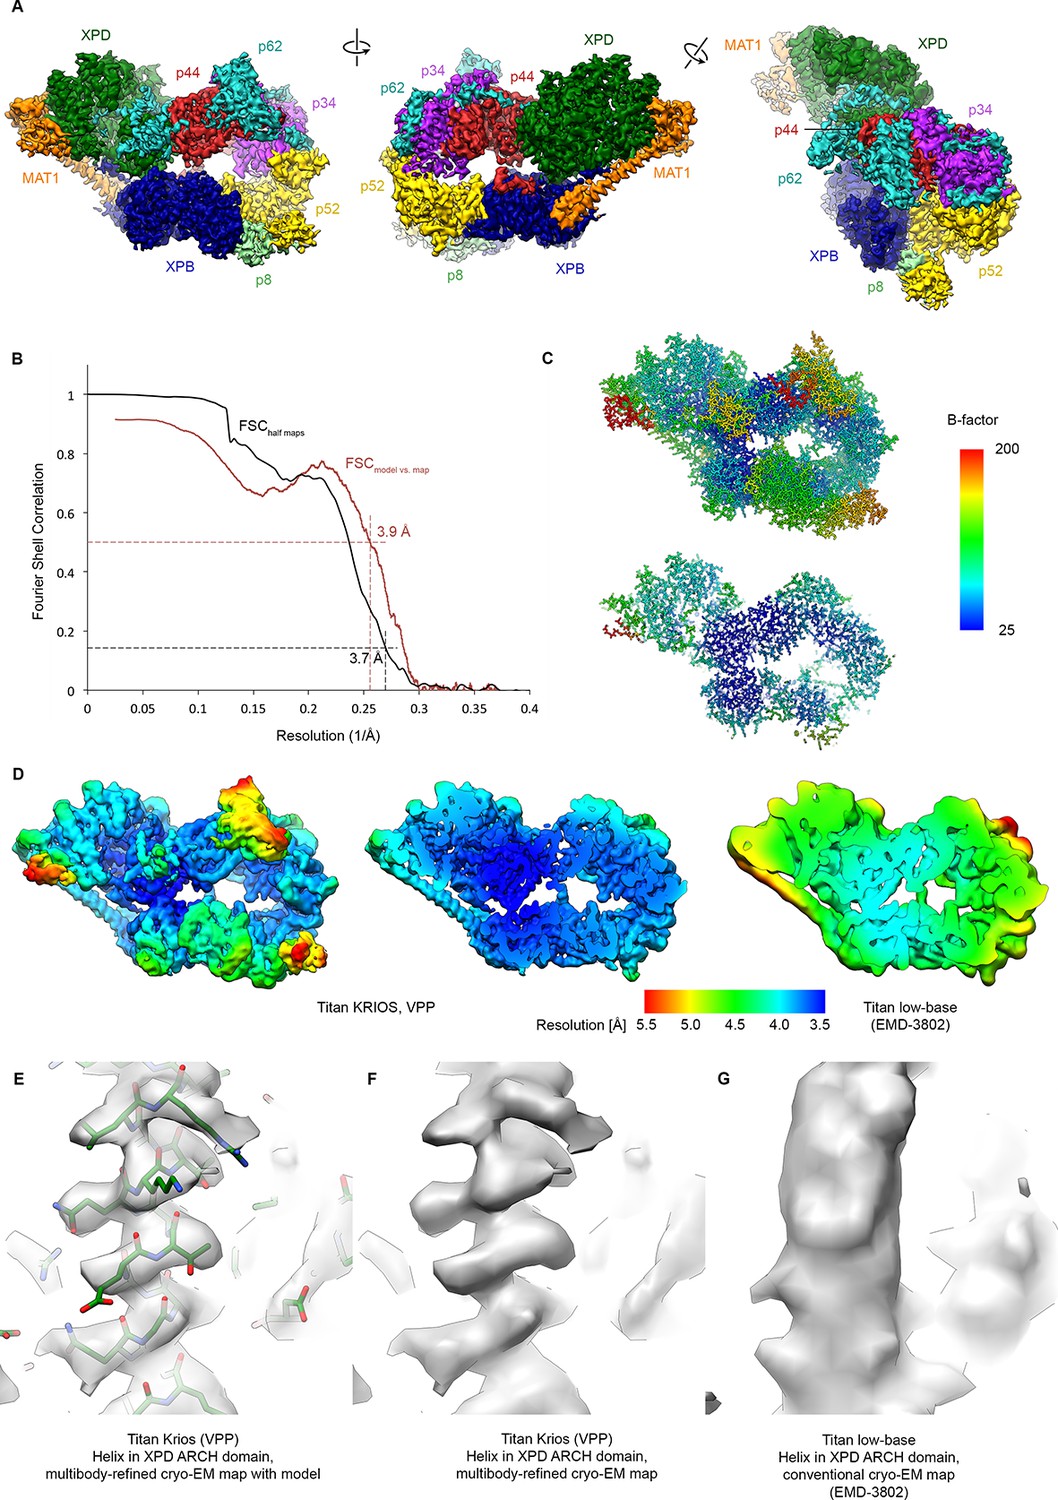
Resolution estimation, validation statistics, and quality of the density.
(A) Three views of the refined, sharpened, and low-pass filtered cryo-EM map of the TFIIH core complex. Protein subunits are color-coded and labeled. (B) Fourier shell correlation (FSC) curves. Black: FSC curve between cryo-EM half-maps. Red: FSC curve between map and refined model. The resolution at the appropriate thresholds (Rosenthal and Henderson, 2003; Scheres and Chen, 2012) is indicated. (C) B-factor distribution on the refined TFIIH coordinate model. (D) Local resolution estimation, computed by windowed FSC in RELION 3. (E, F, G) Comparison of the 3.6 Å multibody-refined cryo-EM map of the TFIIH core complex (E, F) with our previous 4.4 Å cryo-EM map (G) shows substantial improvements in map quality in the more peripheral and flexible regions of the complex (an α-helix from the XPD ARCH domain is shown).
Figure 1—figure supplement 3
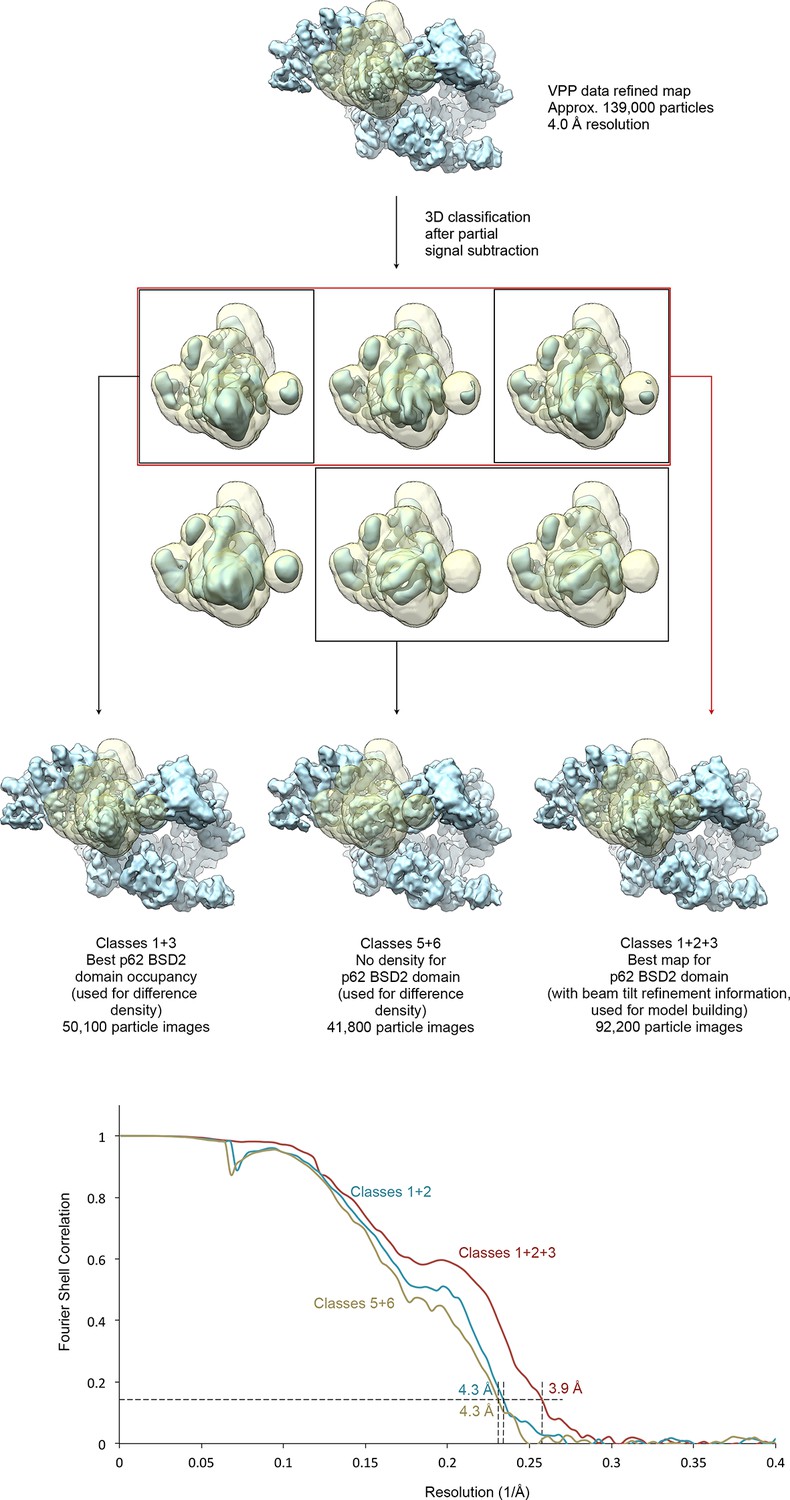
Focused classification of the p62 BSD2 domain.
(A) Focused classification for the p62 BSD2 domain and adjacent structural elements using the classified VPP dataset (indicated in Figure 1—figure supplement 1). Partial signal subtraction (Bai et al., 2015) and masking were used to focus the classification on the region of interest (mask shown in transparent yellow). Selected classes were refined using the selected but un-subtracted particle images because the region of interest is too small for efficient image alignment (Nguyen et al., 2016). (B) FSC curves for the three refined maps shown in (A), indicating resolution of 3.9–4.3 Å according to the FSC = 0.143 criterion (Rosenthal and Henderson, 2003).
Figure 1—figure supplement 4
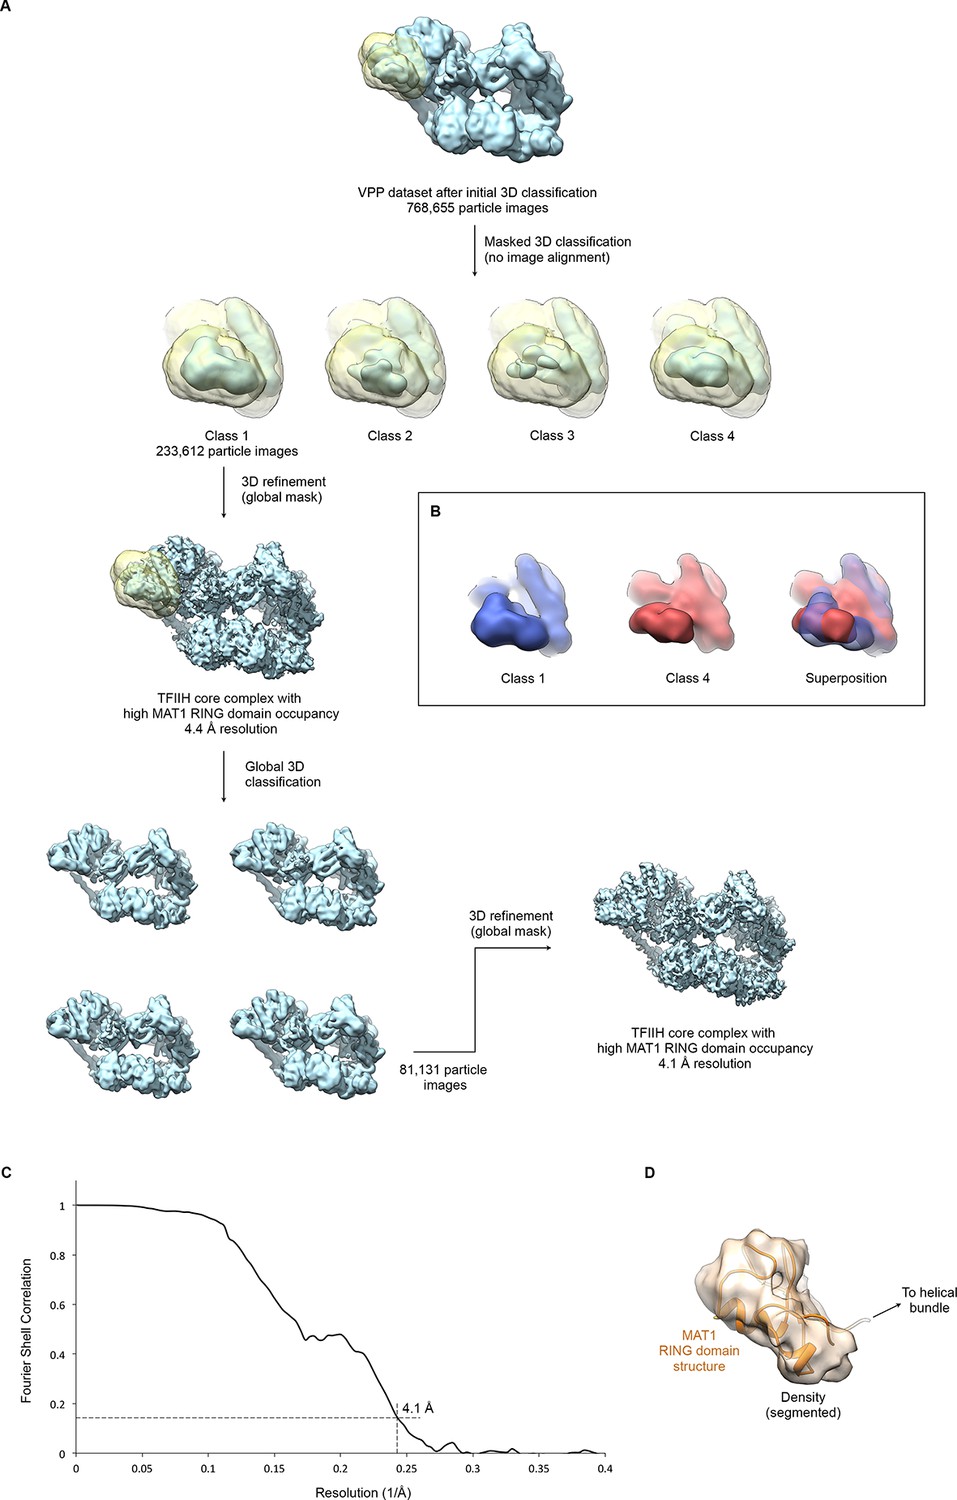
Focused classification and interpretation of the MAT1 RING domain density.
(A) The entire pool of pre-classified TFIIH particles from the VPP datasets was subjected to alignment-free focused 3D classification using a mask that covers the MAT1 RING domain and helical bundle. Signal subtraction was not required due to the peripheral location of the region in the complex and the orientation distribution of the particle images. After one round of additional global classification (to select for overall particle quality and conformation), the class showing the most highly occupied density for the MAT1 RING domain was refined to 4.1 Å resolution (using beam tilt values imported from the best-resolution refinement, Figure 1—figure supplement 1). (B) 3D classes differed not only in occupancy (i.e. classes 2 and 3 showed low occupancy and fragmented density for the MAT1 RING domain) but also in the orientation of the MAT1 RING domain, which is flexibly attached to the complex. Classes 1 and 4 are shown in different colors individually and superposed to highlight the different orientations of the MAT1 RING domain. (C) The FSC curve estimates a resolution of 4.1 Å for the refined map of TFIIH with high occupancy of the MAT1 RING domain. (D) Best fit of the structure of the MAT1 RING domain (Gervais et al., 2001) into the cryo-EM map, obtained using the FITMAP command in UCSF CHIMERA (Pettersen et al., 2004) with 100 independent initial placements before local optimization at 5 Å resolution. This fit shows the best correlation between model and map and additionally satisfies geometrical constraints imposed by the continuity of the peptide chain between the RING domain and the MAT1 helical bundle.
Figure 1—figure supplement 5
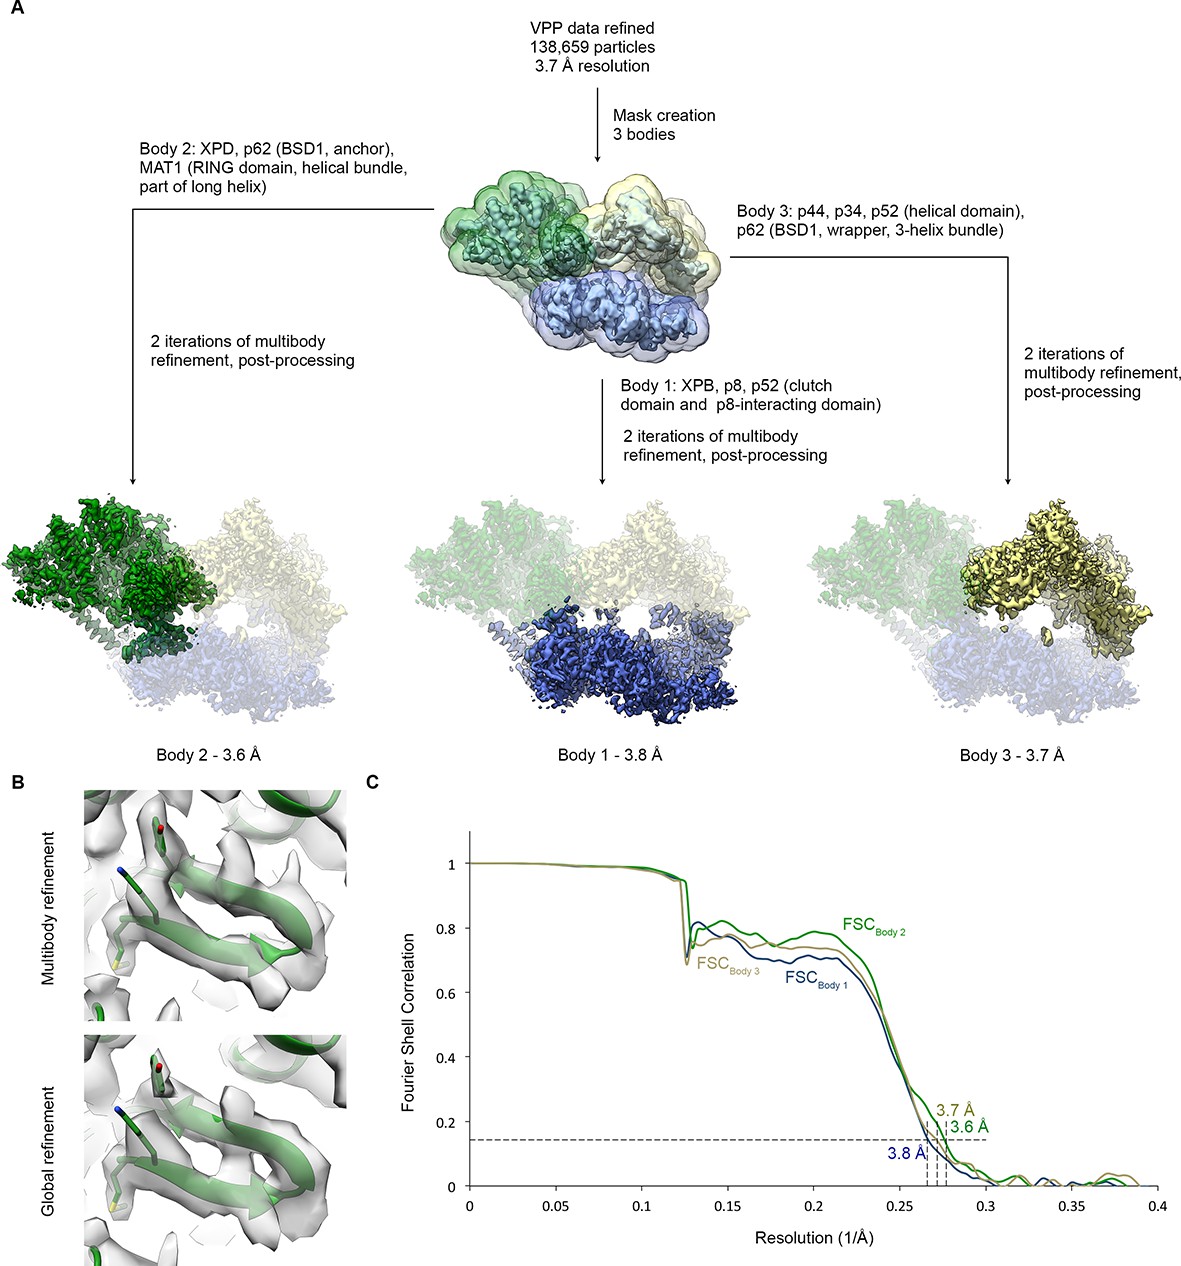
Multibody refinement.
(A) Schematic for multibody refinement (Nakane et al., 2018) of the classified VPP dataset (indicated in Figure 1—figure supplement 1). Three bodies were used and subjected to multibody refinement using the corresponding masks. (B) Example of the improvement of the cryo-EM density for the XPD N-terminus after multibody refinement (top) relative to the global refinement (bottom). (C) FSC curves for the refined bodies, indicating resolutions of 3.6–3.8 Å according to the FSC = 0.143 criterion (Rosenthal and Henderson, 2003).
Figure 1—figure supplement 6
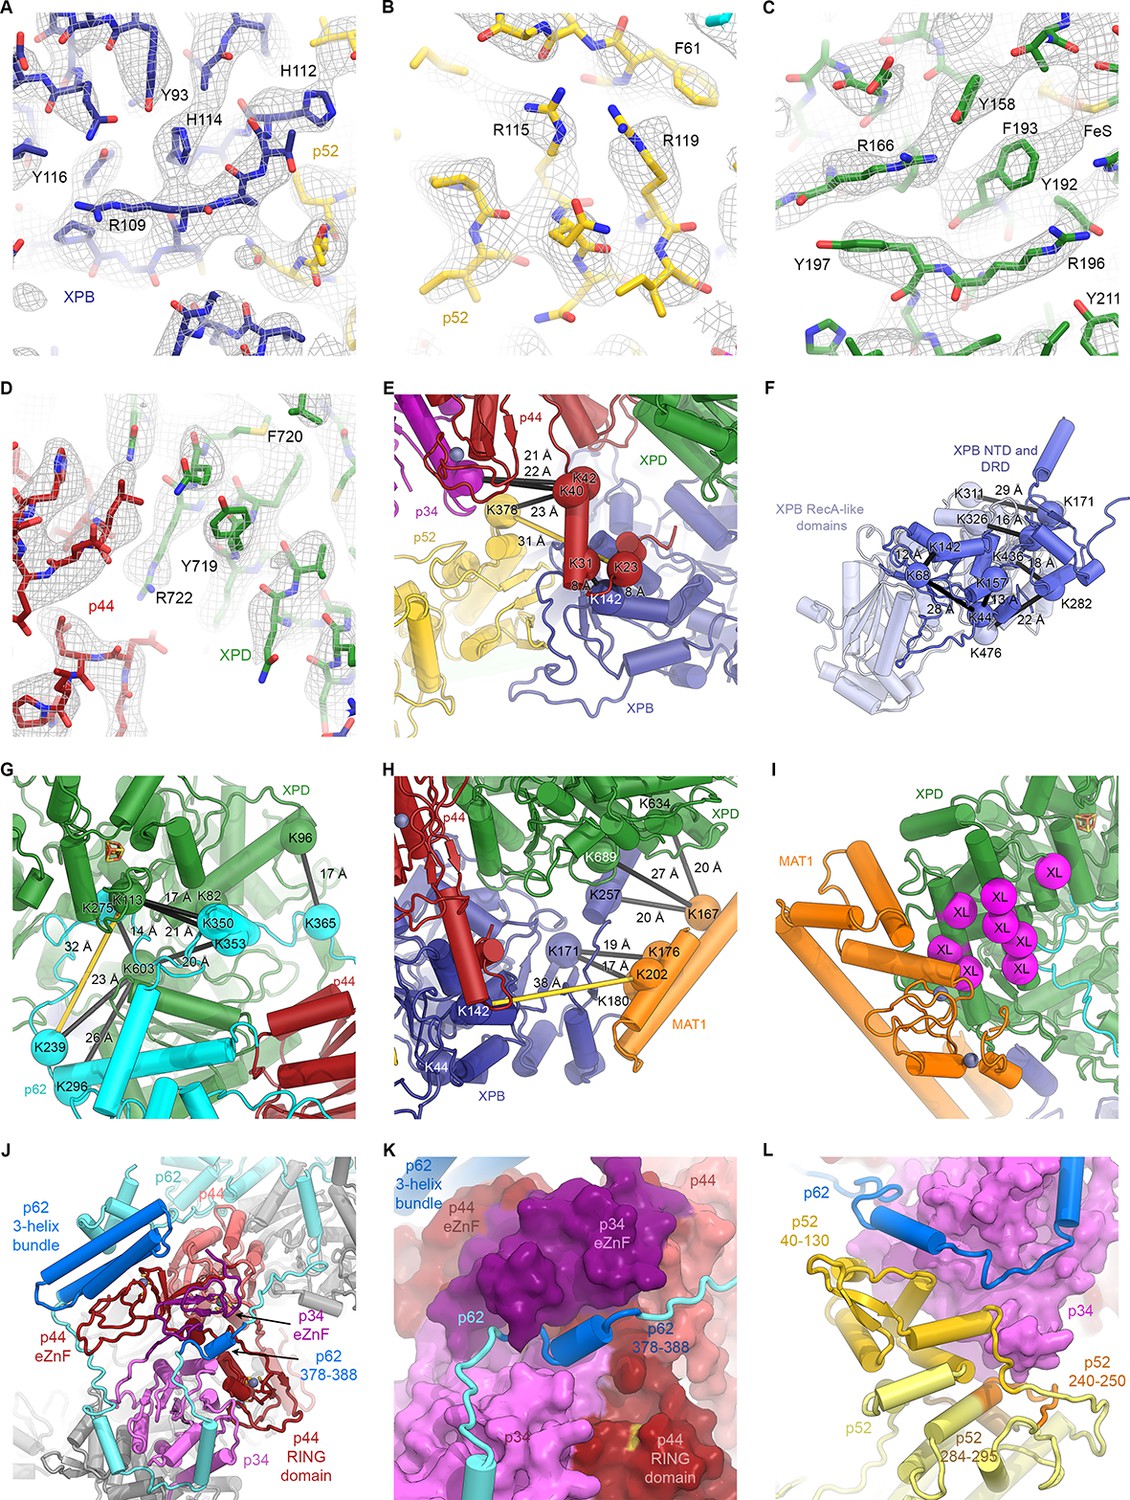
Detailed architecture of the TFIIH core complex.
(A–D) The refined coordinate model is shown in the 3.7 Å-resolution cryo-EM map or the 3.6 Å-resolution multi-body refined XPD map. Large side chains are indicated. (E–H) Mapping of CX-MS data (Luo et al., 2015) onto the atomic coordinate model. Crosslinked residues are shown as spheres, crosslinks as black lines (crosslinks > 30 Å apart as yellow lines). (E) Crosslinks between the p44 NTE and XPB, p52, and p34 confirm the tracing of the p44 NTE towards the XPB NTD. (F) Intramolecular crosslinks in XPB validate the tracing of the XPB NTD. (G) Crosslinks between p62 and XPD. Crosslinks between p62 and p44 are not shown (see Materials and methods and Supplementary file 4). (H) Crosslinks between MAT1 and XPB and XPD. One strong outlier connecting XPB K44 to the MAT1 helical bundle (>100 Å distance) is a likely false positive and is not shown. (I) Location of site-specific crosslinks between RAD3, the yeast XPD homolog (RAD3 residues carrying the crosslinker mapped onto the XPD structure and shown as purple spheres) and TFB3, the yeast MAT1 homolog (Warfield et al., 2016). (J) Interlocking zinc-binding domains of p44 and p34 mediate interactions between these proteins in the hinge region. The p62 C-terminal 3-helix bundle binds to the p44 eZnF domain. (K) Residues 378–388 of p62 are sandwiched between the zinc-binding domains of p34 and p44. (L) View of the p62-p52-p34 interaction region.
Figure 2 with 1 supplement
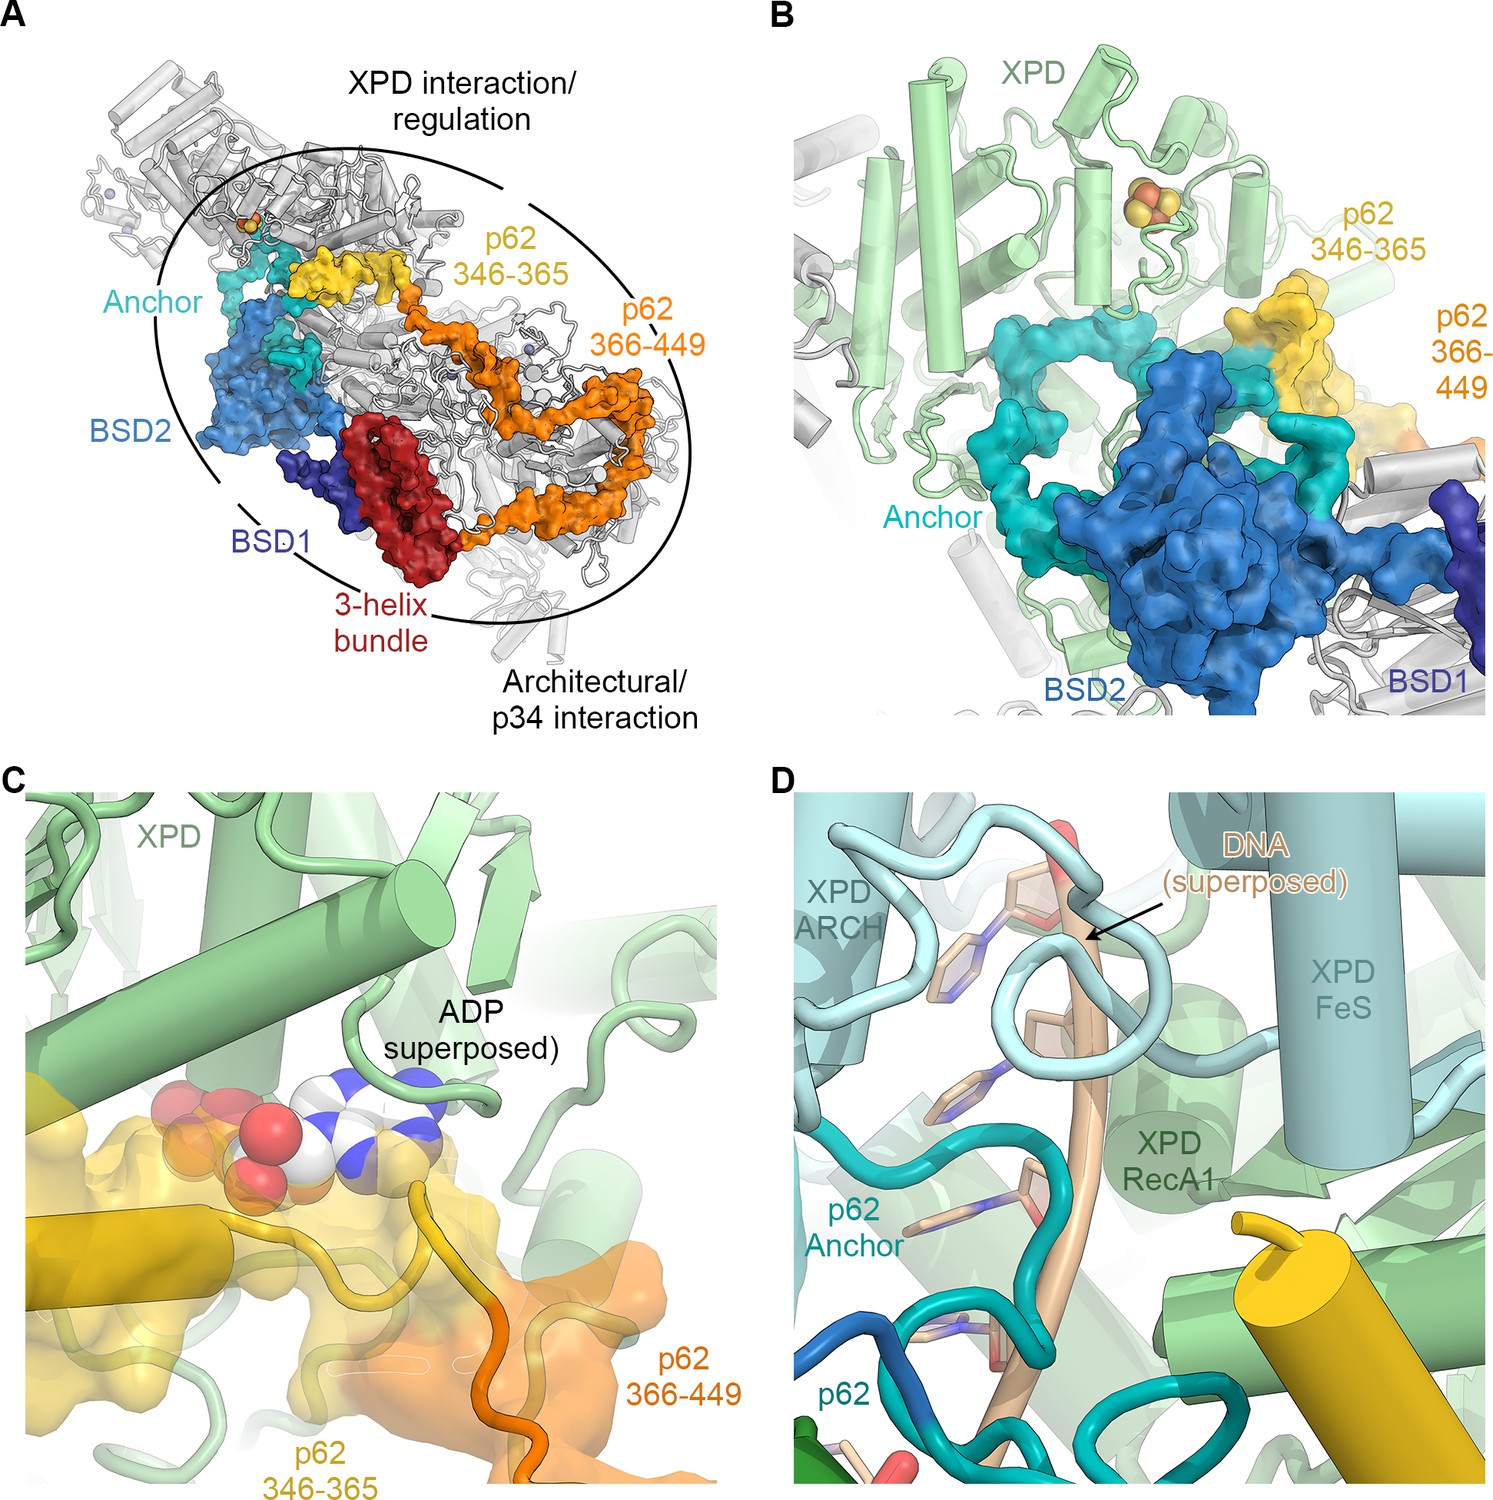
The structure of p62.
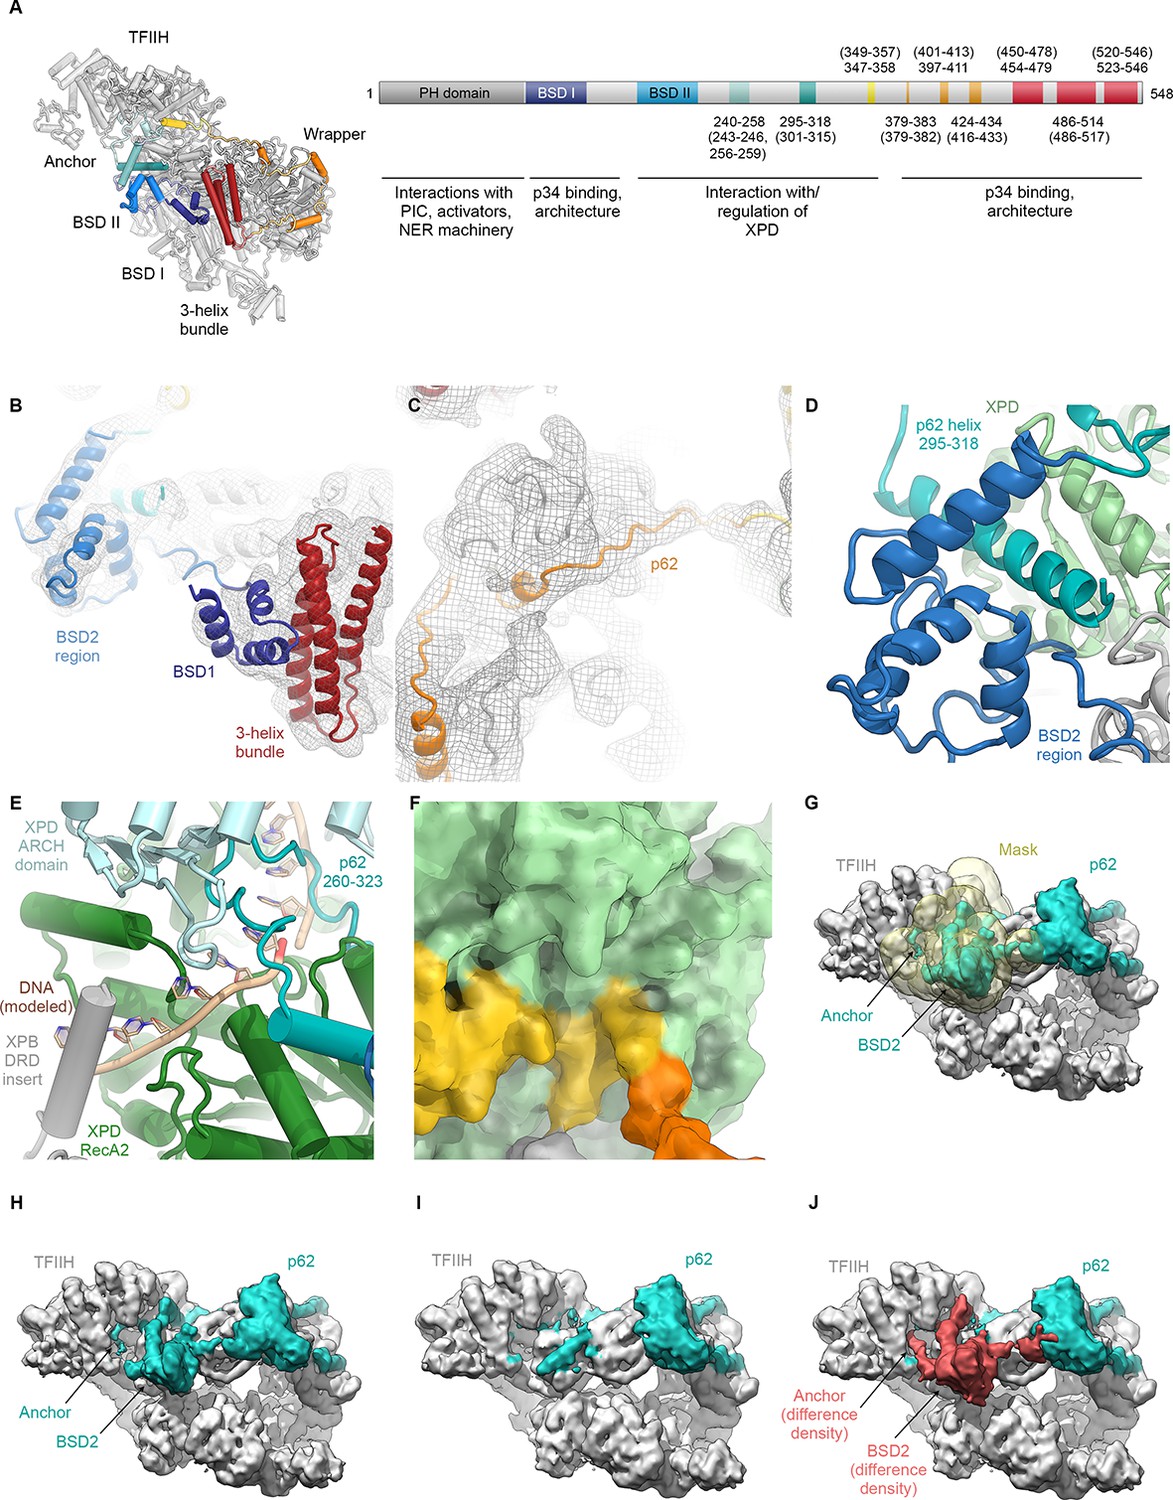
(A) View of the top surface of the TFIIH core complex; p62 is color-coded by structural region. (B) The BSD2 (blue) and XPD anchor segments (teal) of p62 (surface) interact with the region around the XPD substrate-binding cavity. (C) Residues 346–365 of p62 (yellow) approach the nucleotide-binding pocket of XPD. ADP superposed from the structure of the DinG helicase (Cheng and Wigley, 2018). (D) Superposition of DNA from the structure of the substrate-bound DinG helicase (Cheng and Wigley, 2018) shows that the positions of p62 and RecA1-bound DNA overlap.
Figure 2—figure supplement 1
Analysis of the structure of p62.
(A) p62 architecture and sequence assignment. Fitting of domains (see B), secondary structure prediction for α-helices (Kelley et al., 2015), helical segments of the cryo-EM map, and density for large side chains were used for initial assignment of the trace of p62. The final model shows good agreement of observed helical segments (residue numbers indicated) and secondary structure prediction for α-helices (residue numbers given in brackets). (B) Fitting of p62 BSD1 (PDB ID 2DII; blue) into the TFIIH cryo-EM map. Due to flexibility, the density in this region is weak and was low-pass filtered to 6 Å for interpretation and fitting. In agreement with previous results (Schilbach et al., 2017), this domain interacts with the p62 C-terminal three-helix bundle (purple), which in turn sits on the eZnF domain of p44 (Figure 1—figure supplement 6J), thereby explaining the importance of the latter region for functional TFIIH (Tremeau-Bravard et al., 2001). (C) Extended segments of the p62 chain were interpreted using the low-pass filtered map as described in (B) to maintain continuity of the cryo-EM density. (D) The p62 helix 295–317 is sandwiched between the BSD2 region of p62 and XPD RecA2, thereby bridging these two elements of TFIIH. (E) XPD-bound DNA was modeled by domain-wise superposition of the structure of the substrate-bound helicase DinG (Cheng and Wigley, 2018) onto the RecA-like domains of XPD. The presence of the p62 anchor near XPD RecA2 leads to steric hindrance with the DNA that would prevent binding. (F) Residues 346–361 of p62 block access to the XPD nucleotide-binding pocket. (G–J) Analysis of p62 (teal) conformational dynamics. (G) Particle images were sorted for p62 elements near XPD using signal-subtracted focused classification (mask shown in yellow; see Figure 1—figure supplement 3). (H) Refined class with p62 density near XPD. (I) Refined class without p62 density near XPD. (J) Difference density (red) between the densities shown in H, I. Both classes show intact particles, even in the absence of the p62 segment inserted into the XPD substrate binding cavity.
Figure 3 with 2 supplements
Structure and interactions of XPB.
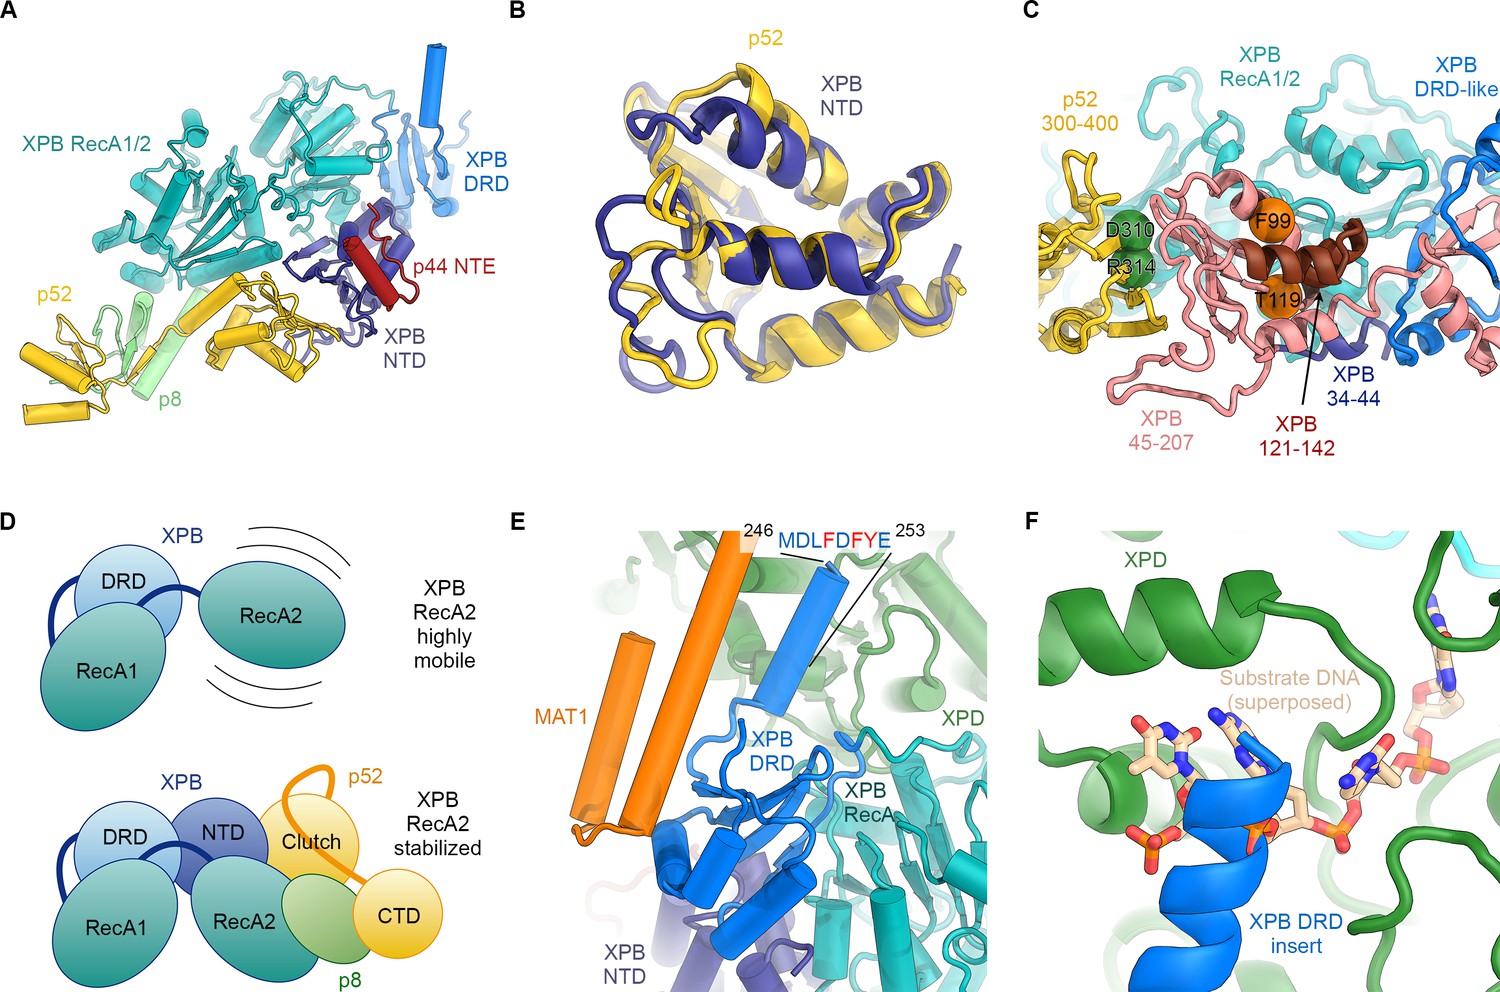
(A) Bottom lobe of TFIIH. XPB RecA1/2 teal, DRD blue, NTD dark blue, p52 yellow, p8 green, p44 NTE red. (B) Superposition of the XPB NTD and the p52 clutch domain. (C) Mapping of mutations on the XPB NTD and the p52 clutch domain; mutated regions are color-coded or shown as spheres (see text for details). (D) The combined interactions of the p52 clutch, the p8-p52 CTD dimer, and the XPB NTD with XPB RecA2 may restrict the conformational flexibility of XPB RecA2 to optimize XPB activity. (E) An extension of the DRD (blue) contacts XPD (green). The sequence for which formation of an α-helix is predicted (Kelley et al., 2015) is indicated. (F) The DRD extension overlaps with the substrate-binding site on XPD RecA2. Substrate DNA modeled from PDB ID 5HW8 (Constantinescu-Aruxandei et al., 2016).
Figure 3—figure supplement 1
Domain organization of XPB and sequence alignment of the N-terminal regions of XPB or XPB-like enzymes from eukaryotes, archaea, and bacteria.
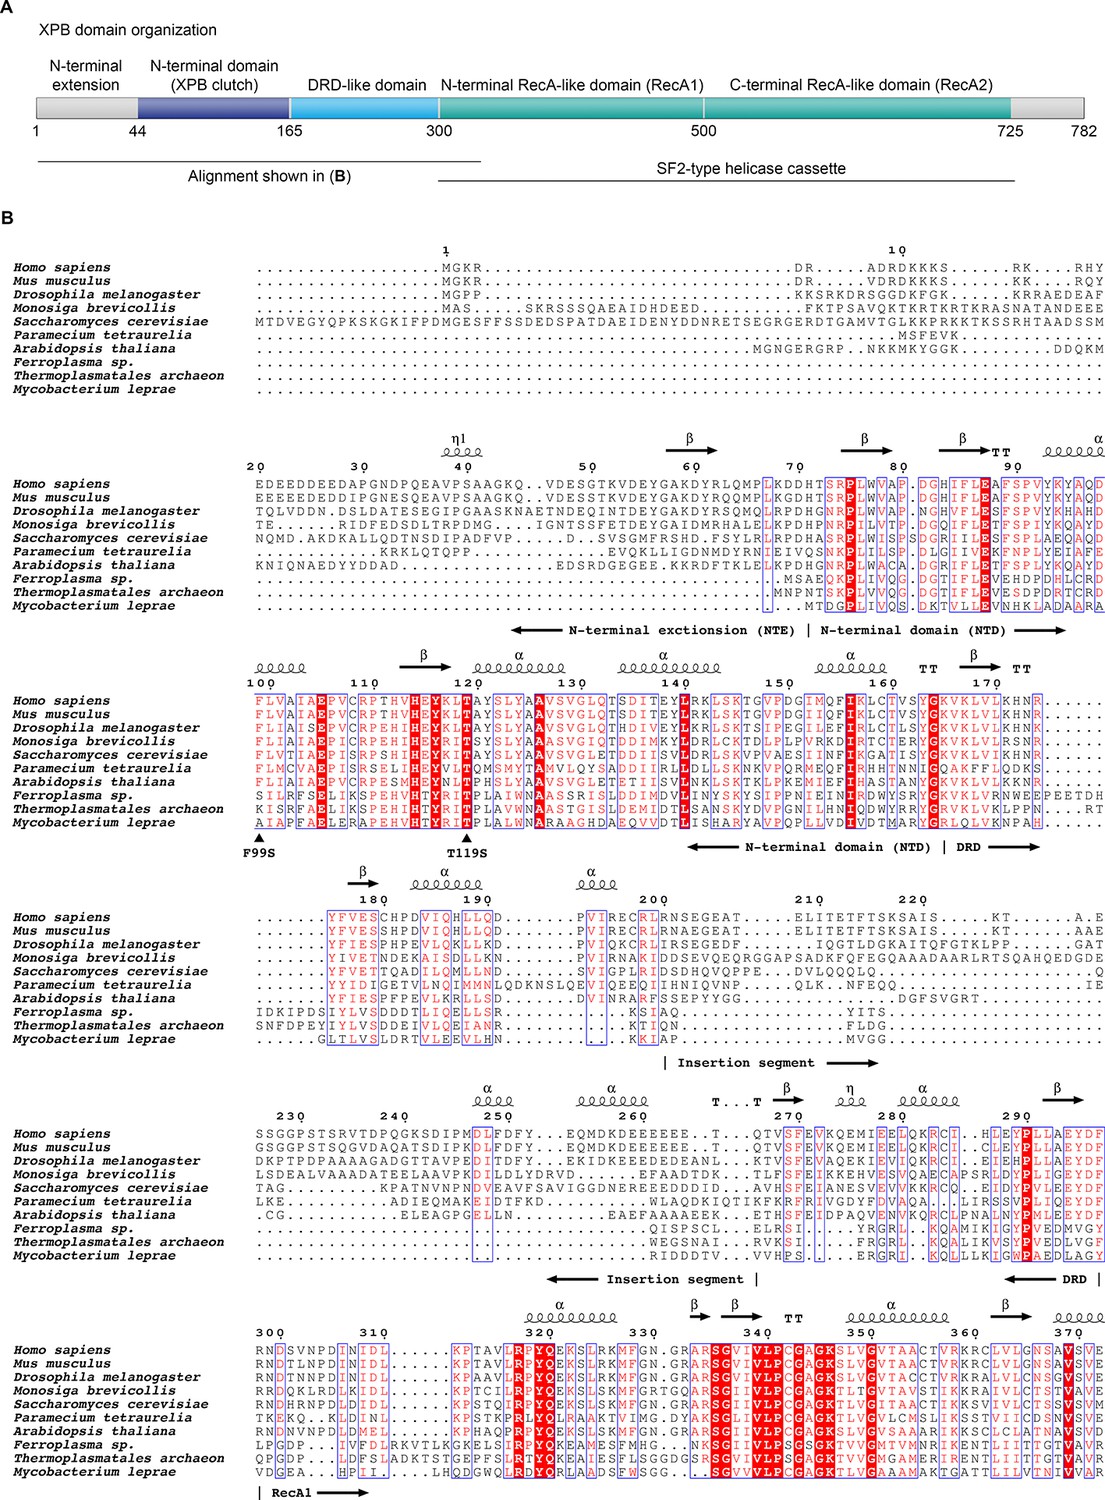
(A) Domain organization of human XPB, color-coded as in Figure 3A. (B) Sequence alignments. Sequences used (species and UNIPROT or GENBANK accession code indicated): Human (Homo sapiens, P19447), mouse (Mus musculus, P49135), fruit fly (Drosophila melanogaster, Q02870), Choanoflagellate (Monosiga brevicollis, A9V0A0), fungus (Saccharomyces cerevisiae, Q00578), ciliate (Paramecium tetraurelia, XP_001448651.1), plant (Arabidopsis thaliana, Q38861), archaea (Ferroplasma, EQB73227.1, Thermoplasmatales, EQB71900.1), bacteria (Mycobacterium leprae, Q9CBE0) (Balasingham et al., 2012; Poterszman et al., 1997). Some archaeal XPBs, including the Archaeoglobus fulgidus homolog that served for structure determination (Fan et al., 2006), contain only the DRD, lacking the NTD/NTE, and were not included. Residues are numbered according to the human sequence. Identical residues are printed white on red background, similar residues in red on white background. Secondary structure elements, residues mutated in human disease (F99S, T119S), and the approx. 70-residue insertion in the DRD are indicated. Figure generated using the ESPript web server (Robert and Gouet, 2014).
Figure 3—figure supplement 2
Structure and interactions of the XPB DRD and NTD.
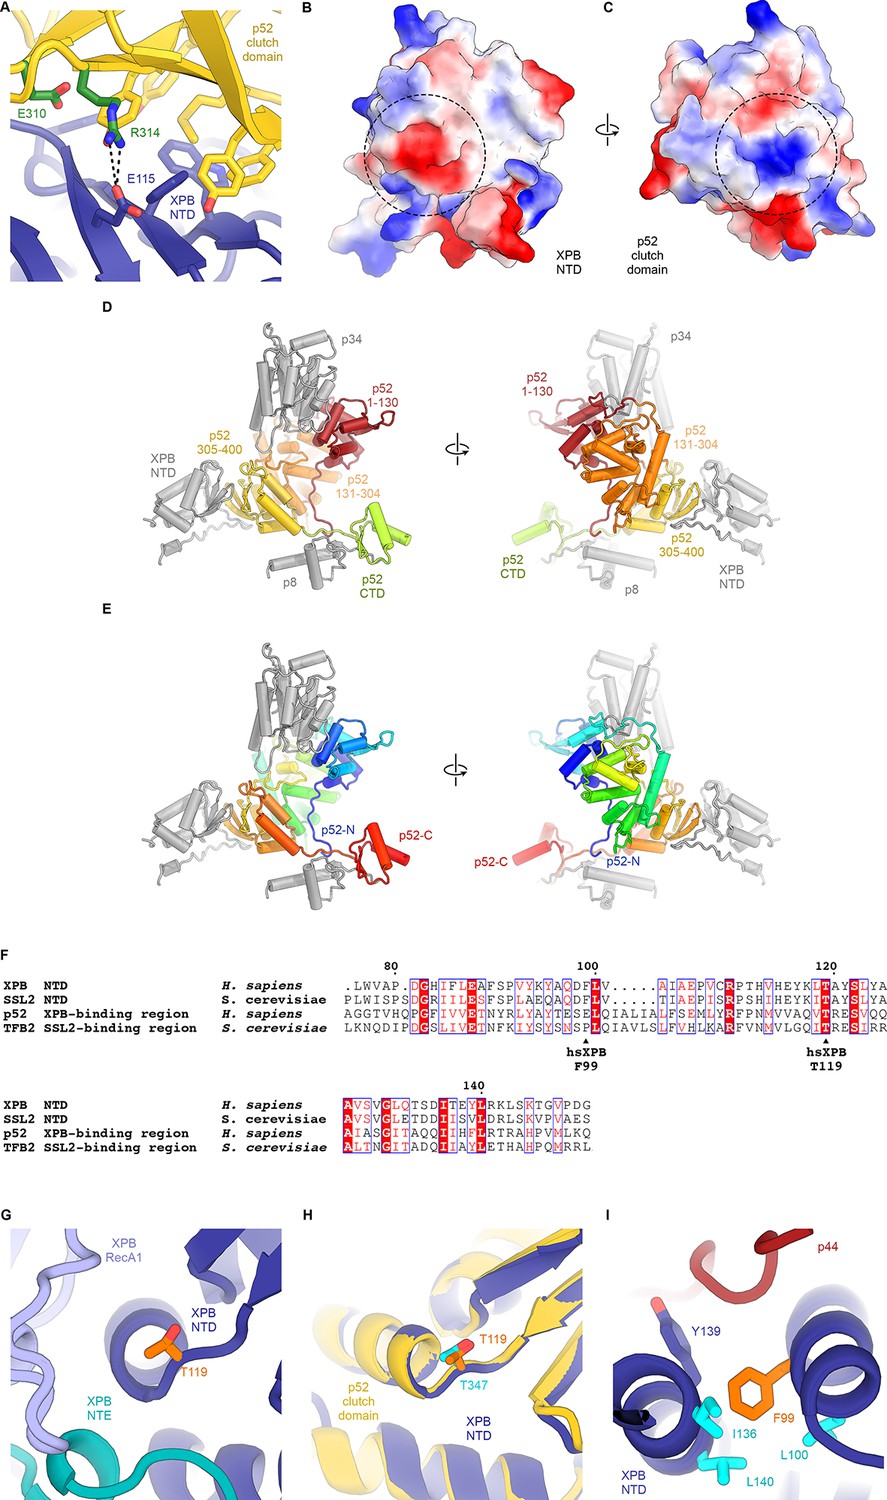
(A) Interface between the XPB NTD and the p52-clutch domains. Contacts include several large hydrophobic residues, as well as a salt bridge between p52 R314 and XPB E115 (shown as sticks). Mutations of residues equivalent to R314 and E310 in D. melanogaster p52 lead to disease-like phenotypes (Fregoso et al., 2007). (B, C) Electrostatic surface potential of the interacting surfaces of the XPB NTD (B) and the p52 clutch domain (C) show charge complementarity (strongest complementary charge peak indicated by a dotted circle). (D) Front and back views of the domain organization of p52. Residues 1–130 (red) and 131–304 (orange) are not in contact with the XPB NTD. Residues 304–400 of p52 form the p52 clutch. Protein subunits or domains interacting with p52 are shown in grey. (E) Same as D), but p52 is colored using a gradient from blue (N-terminus) to red (C-terminus). (F) Sequence alignment of human and yeast p52 clutch and XPB NT domains highlights several highly conserved residues, including XPB T119, which is affected by a human disease mutation. Generated using the ESPript web server (Robert and Gouet, 2014). (G) Location of XPB T119, affected by the TTD mutation T119P, at a junction between a β-strand and an α-helix near the interface between XPB NTD, NTE, and RecA1 domains. (H) Superposition of the XPB NTD and the p52 clutch shows that a threonine at the position of XPB T119 also occurs in the p52 clutch. (I) The XP/CS mutation F99S affects a XPB NTD residue (orange) situated in a hydrophobic pocket formed by aliphatic residues (cyan) that are conserved across yeast and human XPB and p52 (F).
Figure 4 with 2 supplements
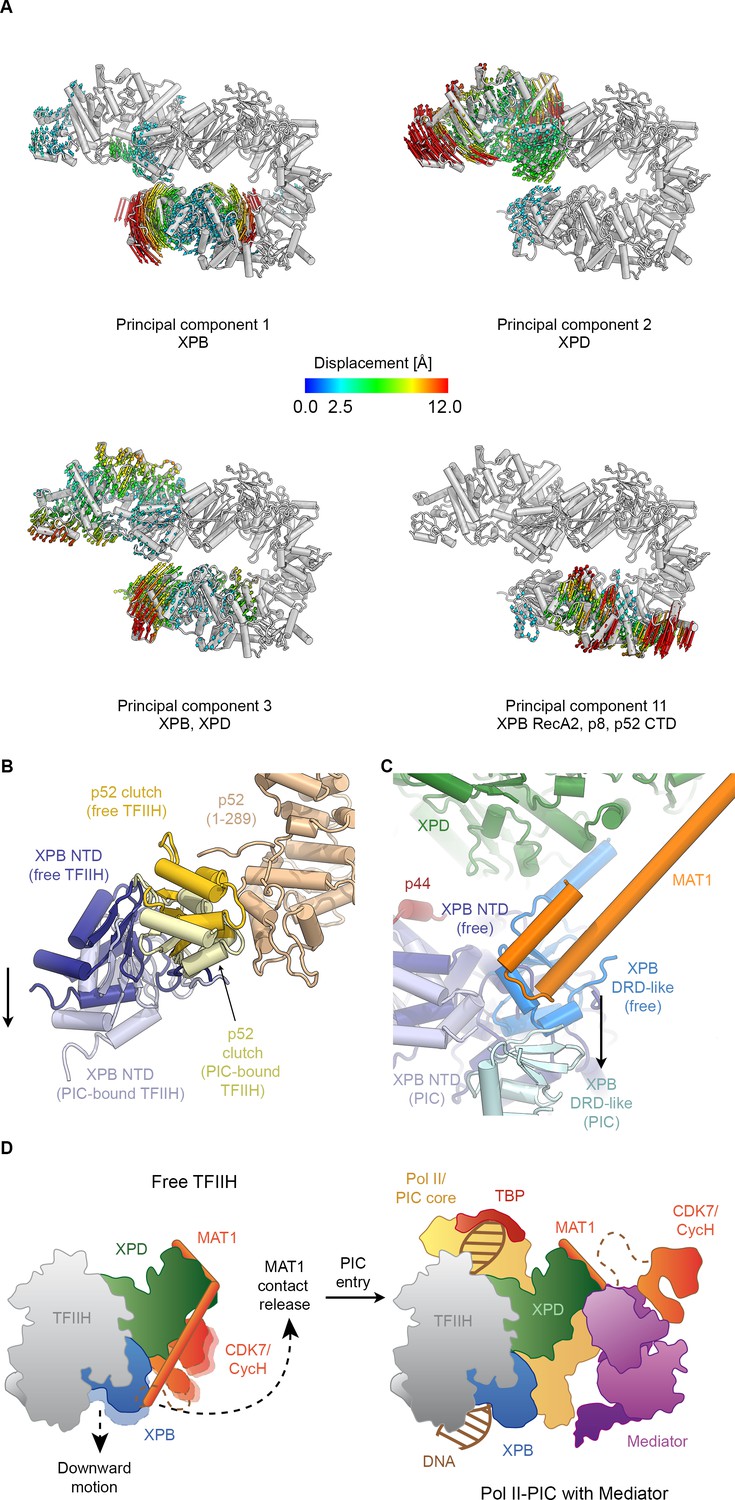
Conformational dynamics of TFIIH.
(A) Results of multibody analysis (also see Figure 4—figure supplement 1 and Materials and methods for details). Several major modes of motion (Cα displacement indicated by colored arrows; distances < 2.5 Å are not shown) involve the enzymatic subunits of the TFIIH core complex or their domains. (B) Motion of the p52 clutch domain (closed conformation gold, open conformation light yellow) and associated XPB NTD (closed conformation blue, open conformation light blue) relative to the remainder of p52 (brown), based on comparison of free and PIC-bound TFIIH structures and fitting of domains into Pol II-PIC cryo-EM maps (He et al., 2016; Schilbach et al., 2017). (C) XPB motions from the closed conformation (free TFIIH; darker blue hues) and the open conformation (TFIIH-PIC; lighter hues). The MAT1-XPB contact probably dissociates during this rearrangement. (D) Schematic model for the conformational transitions in MAT1 and repositioning of the CAK kinase module during Pol II-PIC entry of TFIIH.
Figure 4—figure supplement 1
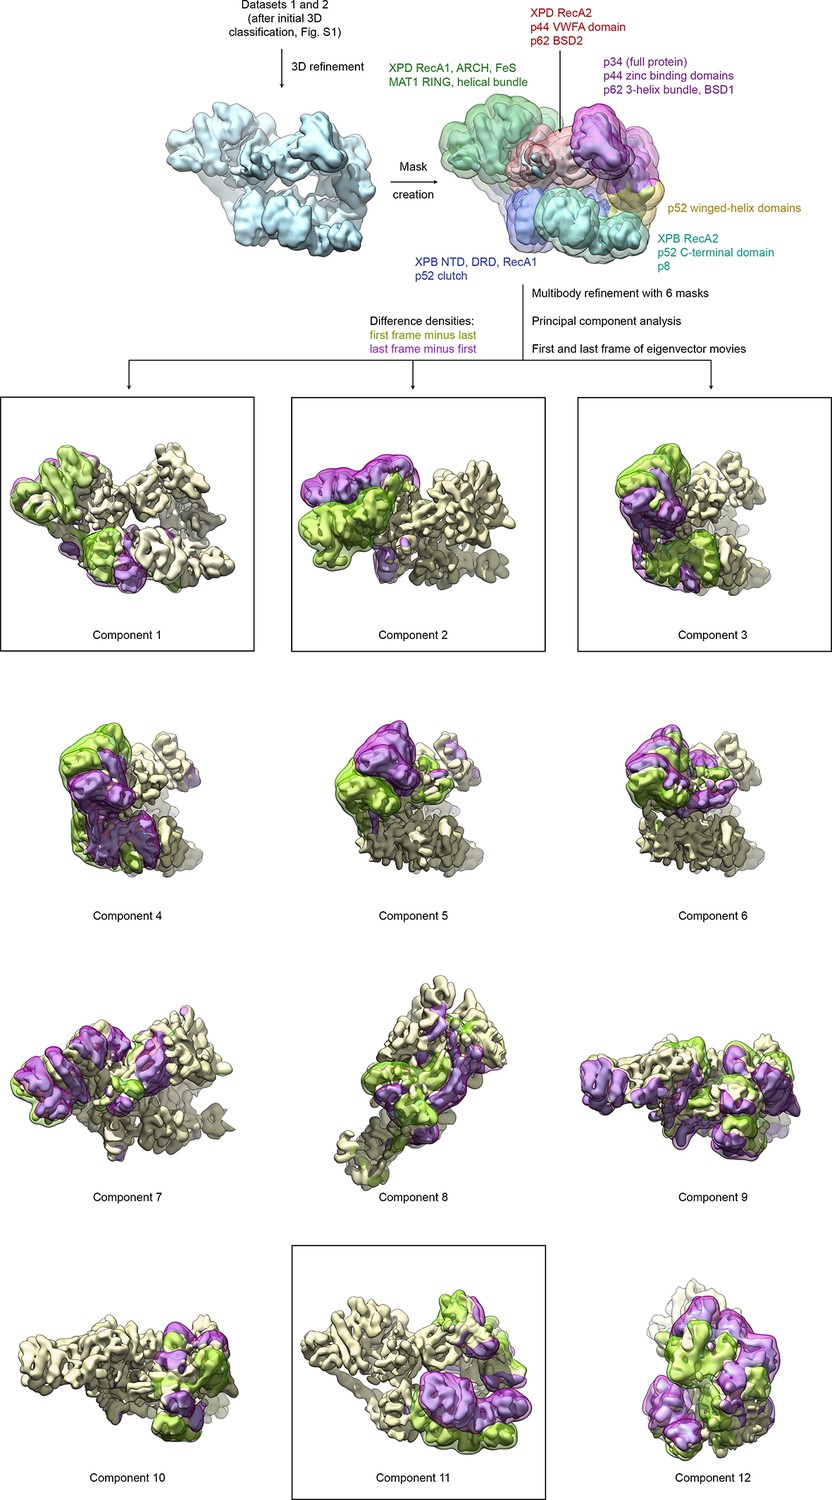
Analysis of conformational variance of TFIIH.
VPP datasets 1 and 2 were refined and subjected to multibody refinement using six masks followed by principal component analysis. The first and last frames of the resulting eigenvector movies of the first 12 principal components are shown (both volumes are shown in light yellow), along with difference densities obtained by subtracting the last volume from the first (green) and vice versa (purple) to visualize the conformational differences in the eigenvector movie. For the boxed components, the full (non-subtracted) TFIIH particles with the highest and lowest eigenvalues were extracted and refined, and atomic coordinates were rigid body refined into the resulting maps (see Figure 4A and Materials and methods).
Figure 4—figure supplement 2
Conformational dynamics of TFIIH and comparison with the PIC-bound TFIIH.
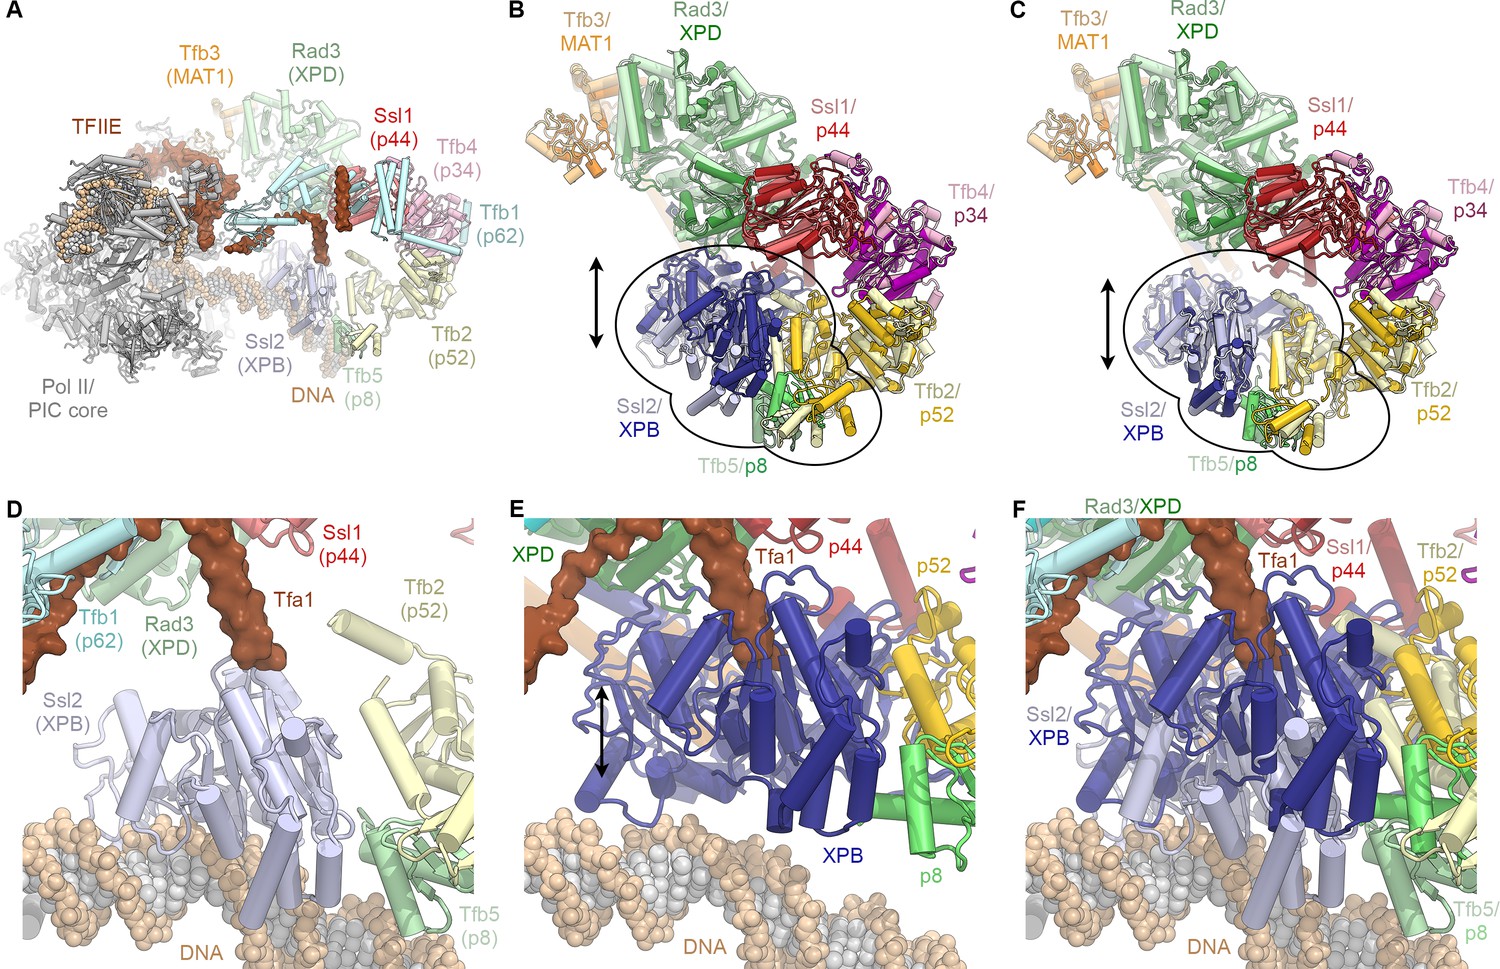
(A) Rendering of the yeast TFIIH-containing Pol II-PIC (Schilbach et al., 2017). TFIIH subunits are colored and labeled with their yeast names, with human names in brackets. (B) Superposition of TFIIH from the yeast PIC (as shown in A, light colors) (Schilbach et al., 2017) and the complete structure of the human TFIIH core complex (this work; superposed on p44, bright colors) as single bodies. The top lobe of TFIIH (MAT1 helical bundle, XPB, p44, p34, p52 winged-helix domains; p62 not shown for clarity) aligns well, while the XPB-p52 (clutch/C-terminal domain)-p8 module is in a different position for the free and PIC-bound TFIIH (indicated). (C) Same as (B), but with the human XPB-p52 (clutch/C-terminal domain)-p8 module superposed on the yeast structure as a rigid body. (D) View of DNA-bound Ssl2 (XPB) and neighboring subunits in the yeast Pol II-PIC (Schilbach et al., 2017). (E) View of human XPB, superposed on the yeast structure as in (B). XPB could not bind DNA in this conformation, and the Tfa1 (TFIIE α-subunit) bridge helix, as observed in the yeast Pol II-PIC, clashes with XPB. (F) Panels (D) and (E) combined, visualizing the conformational change of TFIIH upon entry into the Pol II-PIC.
Figure 5 with 2 supplements

Structure and regulation of XPD.
(A) Structure of XPD colored by domain. N- and C-terminal segments (blue and purple, respectively) of XPD are indicated. An ADP molecule superposed from the structure of DinG (Cheng and Wigley, 2018) denotes the nucleotide-binding pocket in XPD RecA1, which is empty in our structure. (B) Structure of the FeS domain. Residues critical for XPD enzymatic activity (blue) and damage verification (teal) are indicated. The R112H mutation causes TTD in human patients. ARCH domain insertion brown. DNA superposed from (Cheng and Wigley, 2018). The region corresponding to the view in this panel (but viewed from the back side) is indicated in (A). (C) Interaction network of XPD with surrounding TFIIH subunits (interacting regions colored, remainder grey). (D) Cartoon model for repression and de-repression of XPD by MAT1, XPB, and p62. (E) XPD-p44 interacting regions (defined as residues within <4 Å of the neighboring protein) are colored in dark green (XPD) and dark red (p44). Residues discussed in the text are shown as sticks; those with mutation data (natural variants or experimental constructs) are colored yellow on XPD, teal on p44. The remainder of the β4-α5 loop harboring the synthetic p44 mutations is colored teal as well.
Figure 5—figure supplement 1
Structure of XPD.
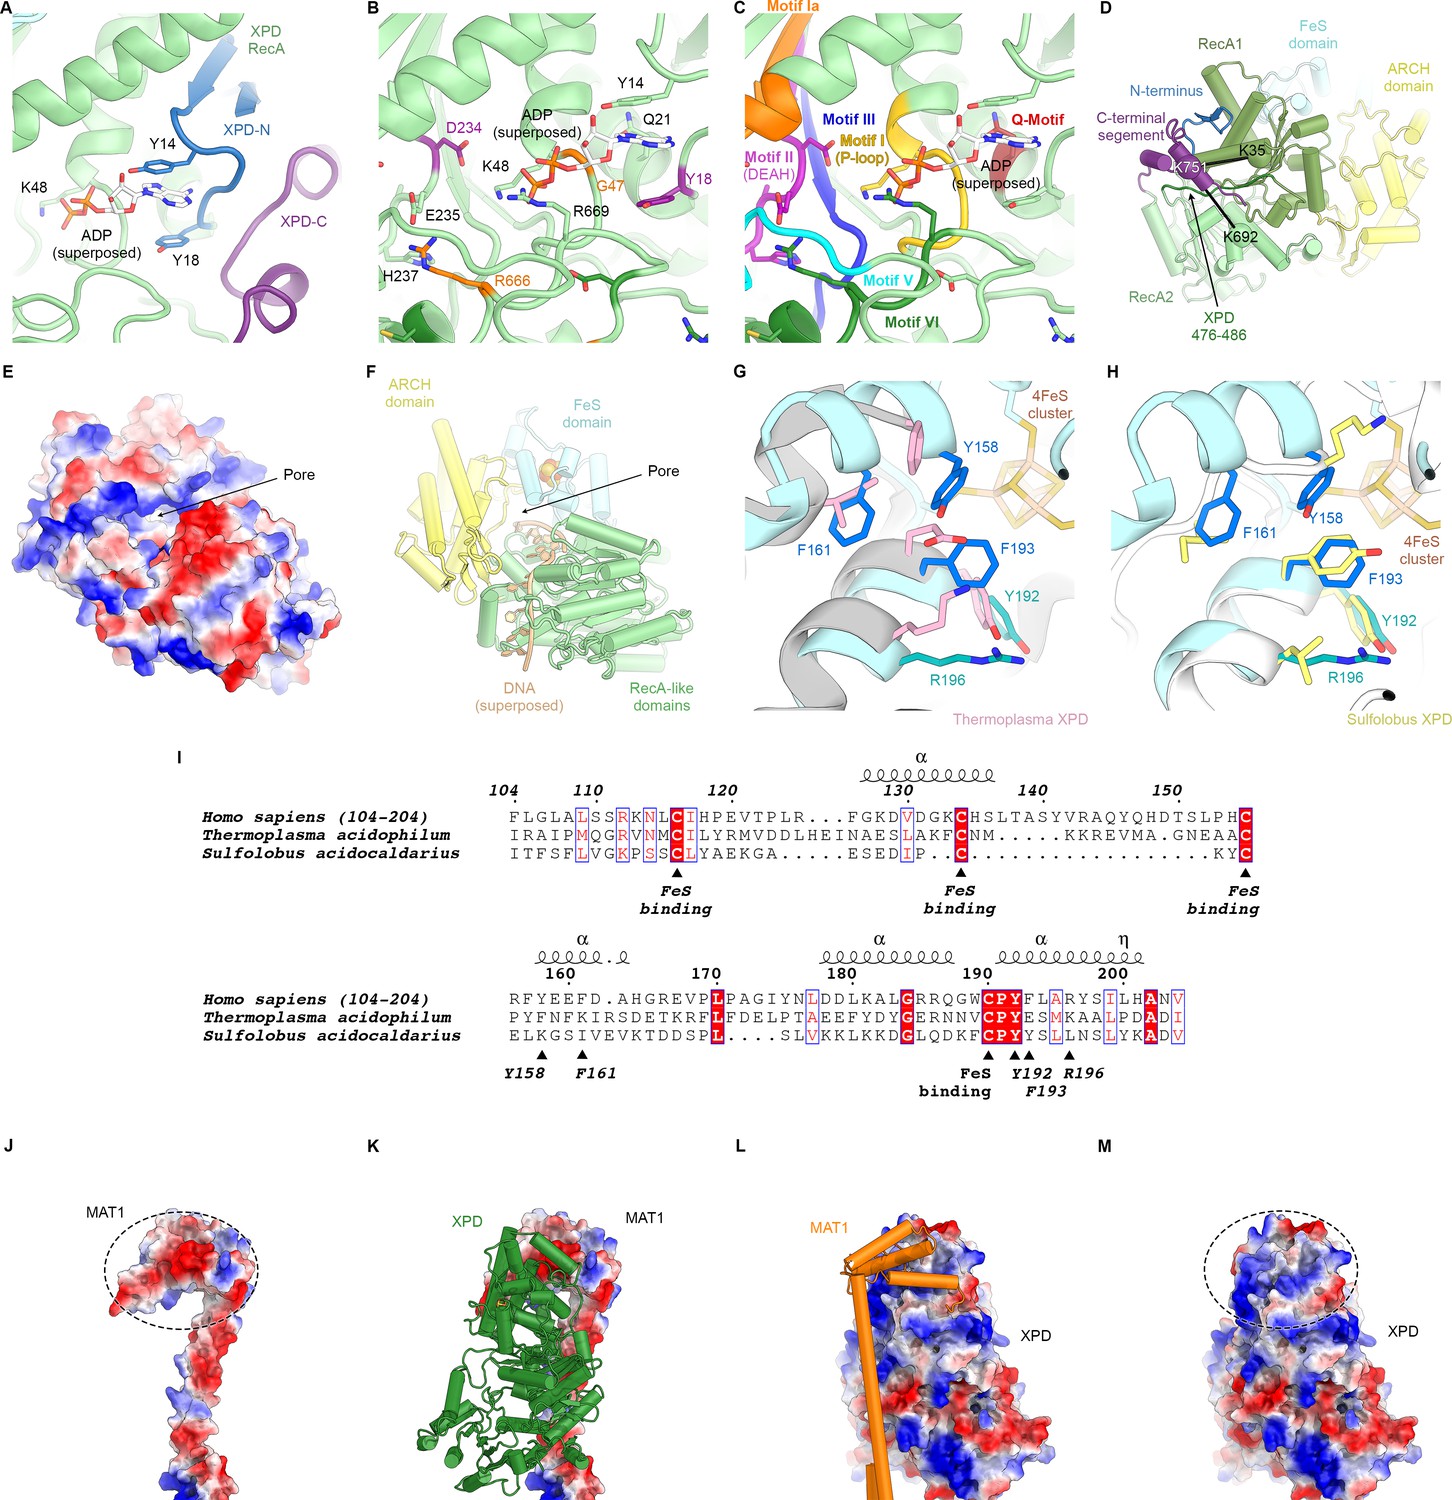
(A) Close-up view of the XPD N- and C-terminal segments near the nucleotide binding pocket of the enzyme. Y14 and Y18 may stabilize nucleotides when bound (not present in our structure). (B) View of the nucleotide binding site of XPD with superposed ADP from nucleotide-bound DinG (PDB ID 6FWS (Cheng and Wigley, 2018)). Residues mutated in human disease are shown as sticks and colored (purple: XP, orange: XP/CS, dark green, TTD). These include Y18, which we propose could form a stacking interaction with the base of a bound nucleotide, as well as residues in conserved helicase motifs (see C). (C) Same view as (B), but with conserved helicase motifs color-coded. Motifs Q, I, II, and IV are involved in nucleotide binding and hydrolysis (Fairman-Williams et al., 2010). (D) View of the back side of XPD, with the N- and C-terminal segments indicated. The C-terminal segment interacts with the linker between XPD RecA1 and RecA2 (residues 476–486). CX-MS crosslinks support the assignment of the C-terminal segment. The K751Q polymorphism has been associated with cancer therapy outcomes (Mlak et al., 2018; Peters et al., 2014), though functional differences between the variants has been debated (Clarkson and Wood, 2005). (E, F) Electrostatic surface (E) and cartoon (F) representations of the XPD structure, highlighting the pore between the XPD ARCH an FeS domains through which DNA (superposed from PDB ID 6FWR (Cheng and Wigley, 2018)) passes while being translocated by XPD. (G, H) Comparison of the structures of the human and archaeal FeS domains (F), Thermoplasma, PDB ID 4A15 (Kuper et al., 2012), (G), Sulfolobus, PDB ID 3CRV (Fan et al., 2008)). There are differences at the secondary structure level, and functionally important residues are only partially conserved. (I) Sequence alignment of FeS domains from human, Sulfolobus, and Thermoplasma XPD. With the exception of the conserved cysteine residues that bind the FeS-cluster, sequence conservation in this domain is relatively low. Residues discussed in the text are indicated. (J–M) Charge complementary of regions of negative and positive electrostatic potential near the MAT1 3-helix bundle and the XPD ARCH domain interface (circled).
Figure 5—figure supplement 2
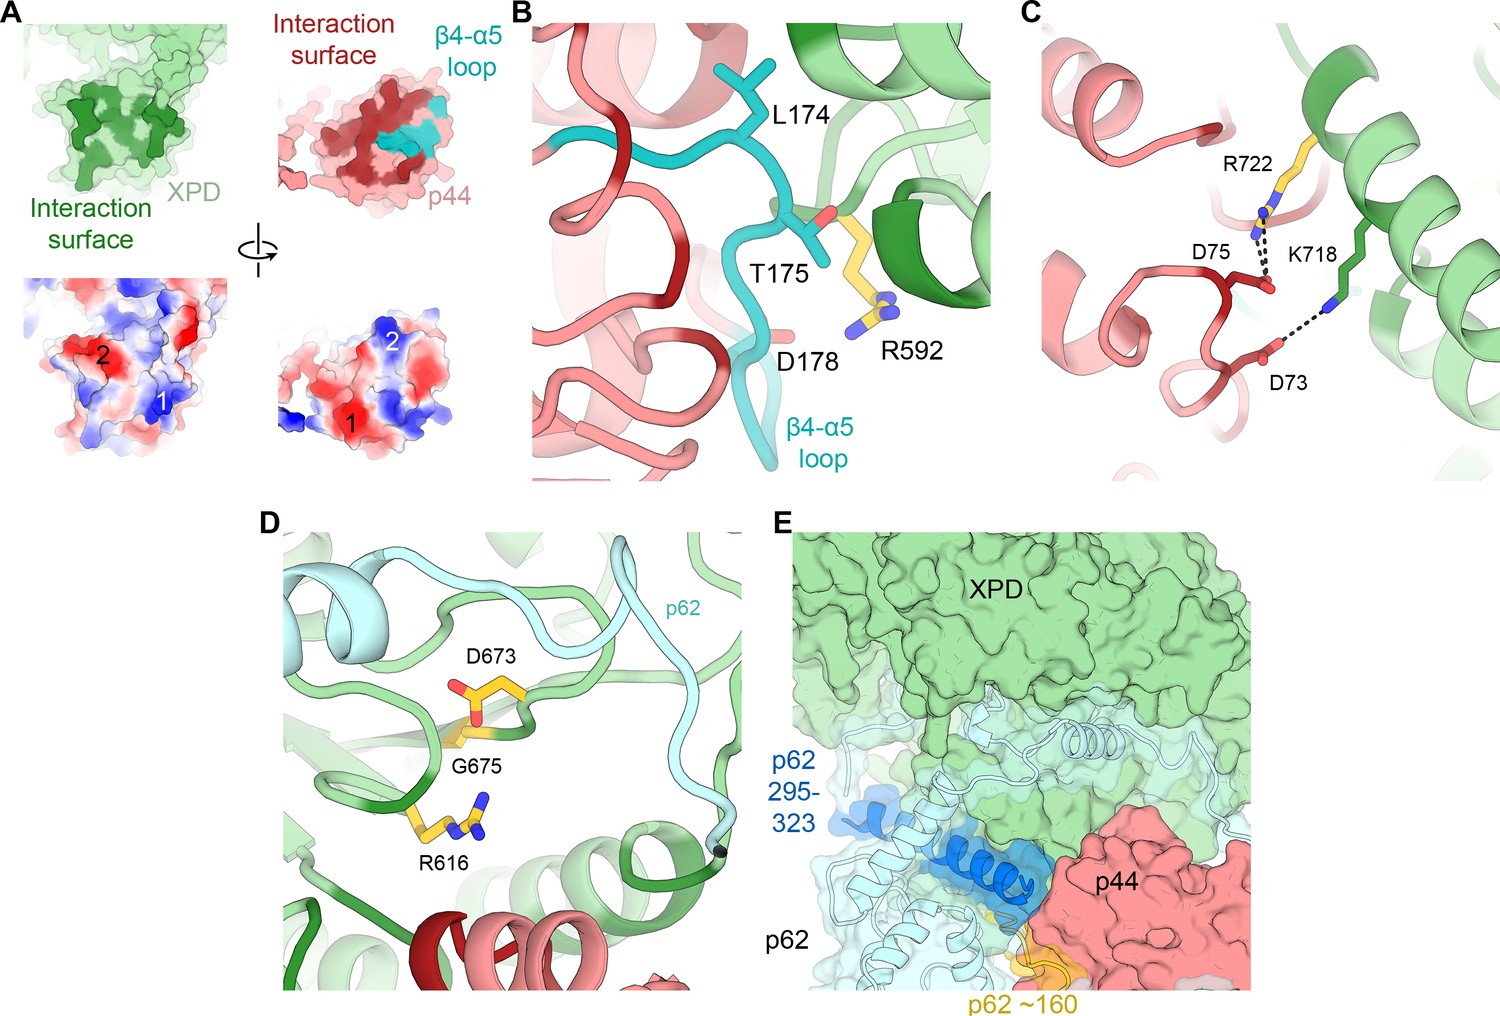
XPD-p44 interaction.
(A) Top: XPD-p44 (XPD green, p44 red) interaction surfaces are shown in darker shade (interacting residues in p44 β4-α5 loop are shown in teal). Bottom: Charge complementarity of the interface (two major complementary regions numbered 1 and 2). (B) Detailed view of the β4-α5 loop (teal) with mutations discussed in the text. XPD-p44 interacting regions (defined as residues within <4 Å of neighboring protein) are colored in dark green (XPD) and dark red (p44). Residues discussed in the text are shown as sticks; those with mutation data (natural variants or experimental constructs) are colored yellow on XPD, teal on p44. (C) Detailed view of the interactions formed by XPD R722, which is mutated in TTD. (D) View of XPD residues R616, D673, and G675 in the context of p62 and p44. (E) XPD-p44-p62 interaction region. p62 segments interacting with both XPD and p44 are colored dark blue and yellow.
Figure 6 with 1 supplement

Disease mutations in XPD.
(A) Residues affected by disease mutations are shown as spheres (XP purple; TTD yellow; CS-XP orange). Conserved helicase elements for DNA binding are shown in blue, for nucleotide binding and hydrolysis in green, and for coupling of nucleotide hydrolysis and DNA translocation in brown. DNA superposed from (Cheng and Wigley, 2018). (B) Salt bridge between R658 (RecA2) and D240 (RecA1) visualized in our structure that is affected by the temperature sensitive TTD mutation R658C (Vermeulen et al., 2001).
Figure 6—figure supplement 1
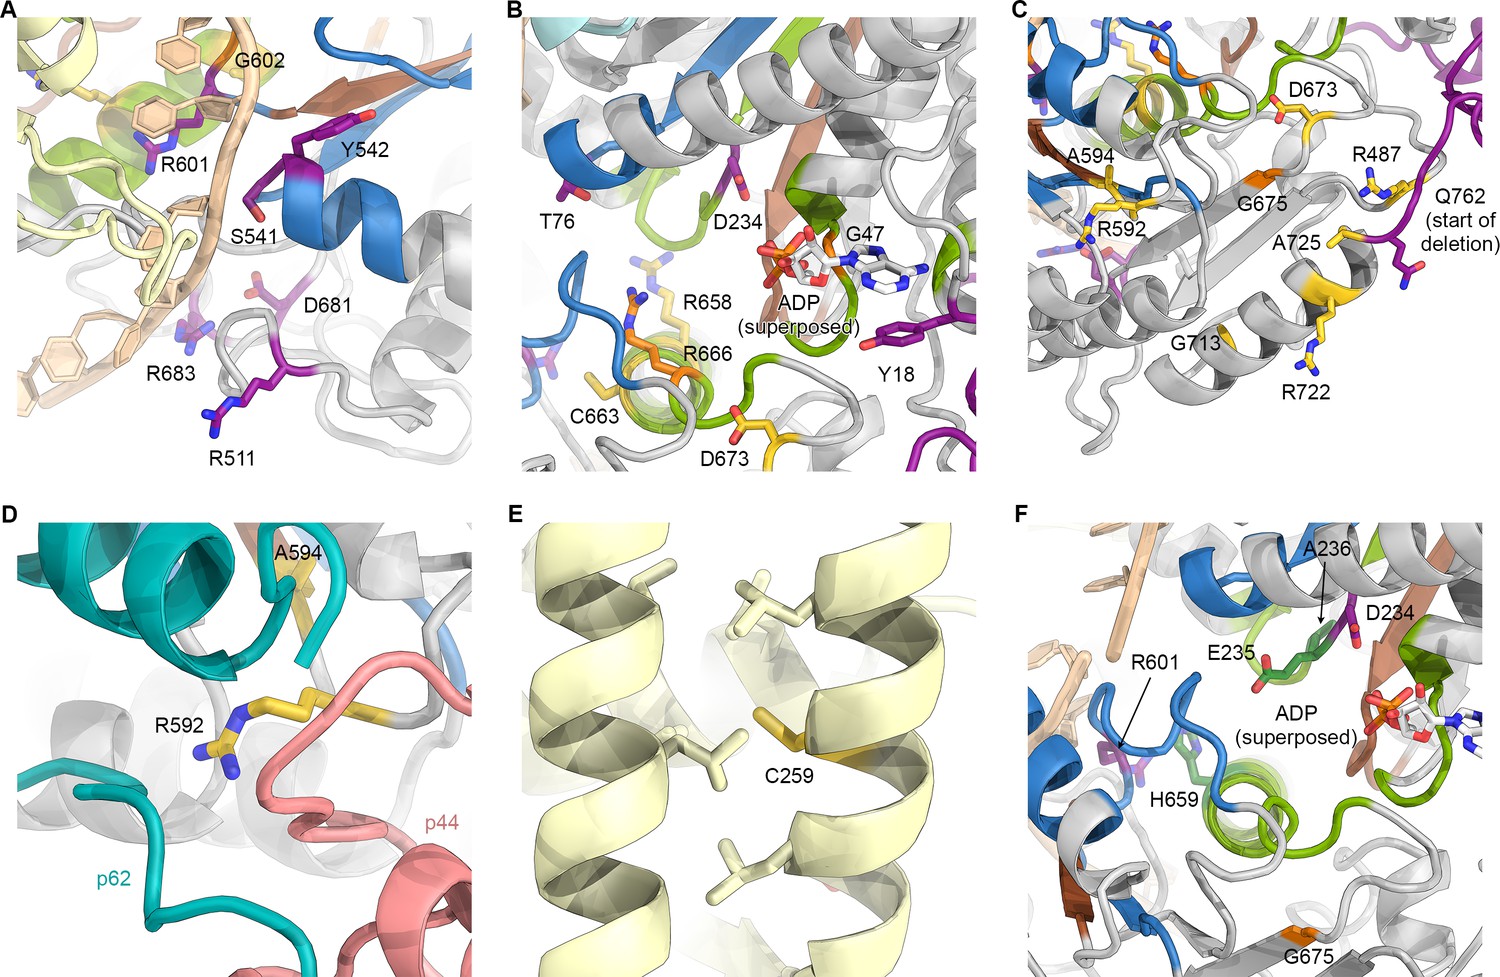
Mapping of XPD disease mutations on the TFIIH structure.
(A) Several residues affected by XP mutations localize near the DNA binding surfaces of XPD. This figure uses the same color scheme as Figure 6 (XP mutations purple; TTD yellow; CS-XP orange; helicase elements for DNA binding in blue, nucleotide binding and hydrolysis in green, coupling of nucleotide hydrolysis to DNA translocation in brown (Fairman-Williams et al., 2010); DNA superposed from (Cheng and Wigley, 2018)). (B) Mapping of mutations near the catalytic site of XPD. ADP superposed from (Cheng and Wigley, 2018). Y18H is found in a patient that also harbors the A725P TTD mutation and shows overlapping XP and TTD symptoms (Kralund et al., 2013). (C) Mutations near the interface with p44. Note the predominance of TTD mutations in this peripheral region of XPD. Also see Figure 5E, Figure 5—figure supplement 2, and text for details. (D) XPD R592, affected by a TTD mutation is in a key location where p44, p62, and XPD interact. (E) Location of C259, affected by the C259Y mutation, which likely causes disruption of ARCH domain integrity and leads to defects in CAK subcomplex recruitment. (F) Mapping of yeast Rad3 rem mutations (green) onto our XPD structure. E235 and A236 are part of the conserved DEAH sequence motif (helicase motif II), as is the immediately adjacent XP mutation D234. H659 localizes near DNA (according to the superposed model) and may be involved in ordering R601, which is in direct contact with the modeled DNA and affected by an XP mutation.
Figure 7
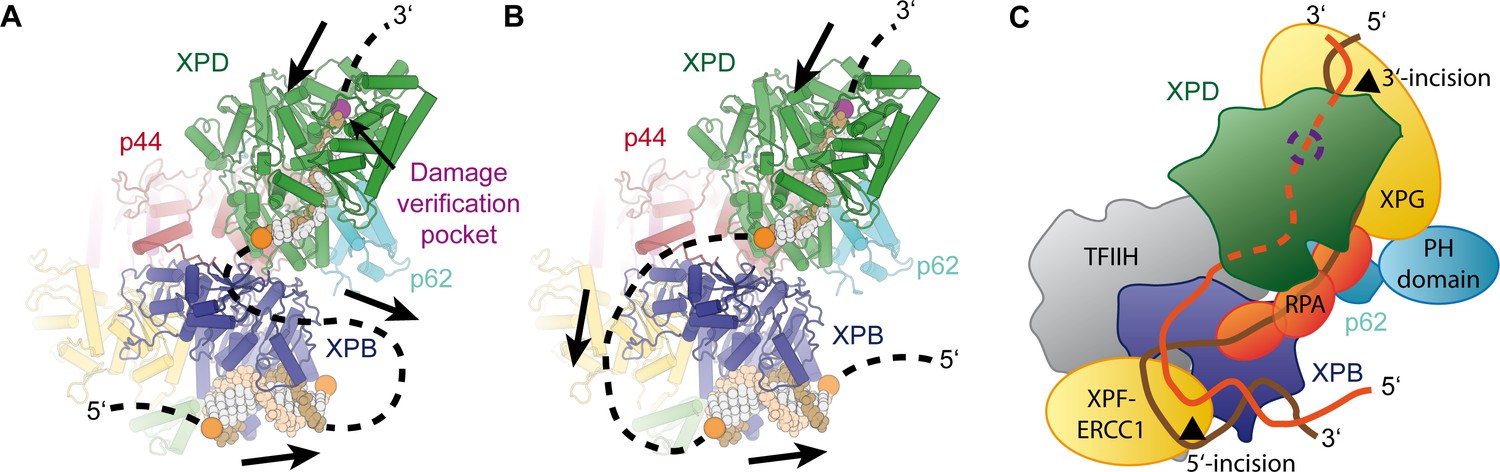
Implications for assembly of the repair bubble during NER.
(A) Schematic of DNA-bound TFIIH (DNA damage verification pocket in XPD and DNA 5’-phosphates indicated by purple and orange spheres, respectively) Binding of both XPB and XPD to the damaged strand would lead to extrusion of a bubble when XPD scans in the 5’−3’ direction, while XPB may be stationary or contribute to bubble extrusion if translocating in the 3’−5’ direction (DNA superposed from PDB IDs 6FWR, 5OQJ (Cheng and Wigley, 2018; Schilbach et al., 2017)). (B) Binding of XPB to the undamaged strand would enable the entire complex to scan in 5’−3’ direction, given the opposing polarities of the two ATPases/helicases involved. (C) Model for the assembled repair bubble. Positions of NER factors are approximate. XPG-p62 PH domain interaction according to (Gervais et al., 2004). See Discussion for details.
Videos
Video 1
Architecture of the TFIIH core complex.
Rotating structure of the TFIIH core complex, followed by views that highlight the interactions of p62 near the nucleotide binding pocket of XPD and near the substrate binding cleft of XPD (binding sites are indicated by a flashing ADP molecule and DNA strand, respectively). Bound substrates, which are not present in our structure, were superposed from PDB ID 6FWS (Cheng and Wigley, 2018).
Video 2
Conformational rearrangements of TFIIH during incorporation into the Pol II-PIC.
Transition of TFIIH from the closed conformation observed in our structure of free TFIIH to the open conformation present in Pol II-PIC bound TFIIH, followed by a depiction of TFIIH in the context of the Pol II-PIC. Coordinates (PDB 5IYB, PDB 5OQJ) and maps (EMD-8131, EMD-8132, EMD-3846) used for core-Pol II-PIC depictions and analysis of TFIIH conformation from (He et al., 2016; Schilbach et al., 2017).
Video 3
Visualization of disease mutations mapped onto the structure of the TFIIH core complex.
The human disease mutations discussed in the manuscript are shown in the context of the TFIIH structure. The areas depicted are: (i) The interaction interface between p8 and XPB, affected by a TTD mutation; (ii) the XPB N-terminal domain, affected by XP and TTD mutations; (iii) the active site region of XPD, affected mostly by XP and XP/CS mutations; (iv) the DNA-binding cleft of XPD, affected mostly by XP mutations; (v) the interaction site between XPD and p44, affected mostly by TTD mutations; (vi) the interaction site between MAT1 and XPD, affected by a TTD mutation (see text for further details).
Additional files
-
Supplementary file 1
Data collection statistics.
All datasets were acquired on Gatan K2 Summit direct electron detectors mounted in 300 kV-electron microscopes with three-condenser type electron optics. The high rejection rate for the data collected without VPP was due to poorer CTF resolution estimates compared to the VPP data, likely because of the use of a low-base Titan with a less stable side entry holder for most of these data. Abbreviations: TEM, transmission electron microscope; VPP, volta phase plate; Σ, sum.
- https://doi.org/10.7554/eLife.44771.027
-
Supplementary file 2
Components of the TFIIH structure.
- https://doi.org/10.7554/eLife.44771.028
-
Supplementary file 3
Data collection, map and model refinement, model validation.
- https://doi.org/10.7554/eLife.44771.029
-
Supplementary file 4
Result summary of mapping of CX-MS data (Luo et al., 2015) onto the TFIIH structure.
- https://doi.org/10.7554/eLife.44771.030
-
Transparent reporting form
- https://doi.org/10.7554/eLife.44771.032
Download links
A two-part list of links to download the article, or parts of the article, in various formats.
Downloads (link to download the article as PDF)
Open citations (links to open the citations from this article in various online reference manager services)
Cite this article (links to download the citations from this article in formats compatible with various reference manager tools)
The complete structure of the human TFIIH core complex
eLife 8:e44771.
https://doi.org/10.7554/eLife.44771


