Inter-individual differences in human brain structure and morphology link to variation in demographics and behavior
- Radboud University Nijmegen, Netherlands
- Donders Institute for Brain, Cognition and Behavior, Netherlands
- Radboud University Medical Centre, Netherlands
- Radboud University Medical Center, Netherlands
- University of Oxford, United Kingdom
Figures
Figure 1
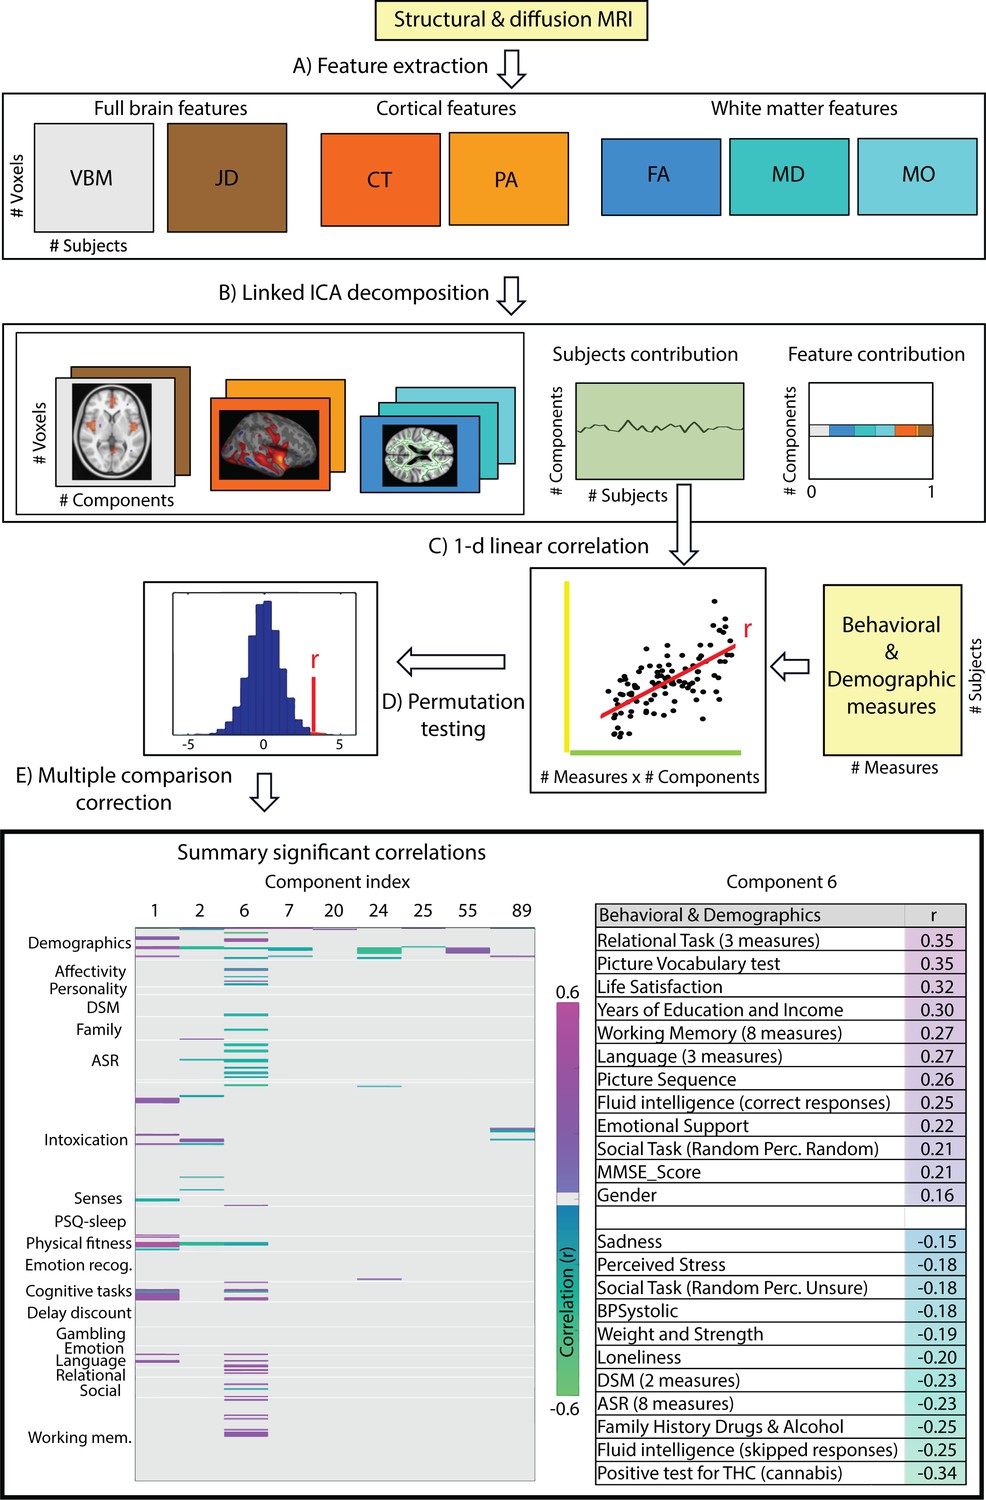
Data processing pipeline and main results.
(A) Structural and diffusion-weighted MRI data are used to extract relevant features, that is, Voxel-Based Morphometry (VBM), Fractional Anisotropy (FA), Mean Diffusivity (MD), Anisotropy Mode (MO), Cortical Thickness (CT), Pial Area (PA) and Jacobian Determinants (JD). (B) These features are used as input to the Linked ICA algorithm. (C) Subject loadings of each independent component are fed together with the behavioral/demographic measures into a correlation analysis. The bottom left panel presents demographic and behavioral measures grouped by categories (y-axis), and a representative set of components reflecting significant correlation with at least one behavioral measure (x-axis). The color-scale encodes the Pearson correlation coefficient and only significant correlations are color-coded. In the bottom right panel, we present a summary of component number six significant correlations to behavioral and demographic variates where the behavioral measures are grouped and ordered according to a decreasing correlation value. These results resemble a mode of structural variation that links to and extends the ‘positive-negative’ behavioral spectrum previously attributed to functional connectivity variations (Smith et al., 2015).
Figure 2
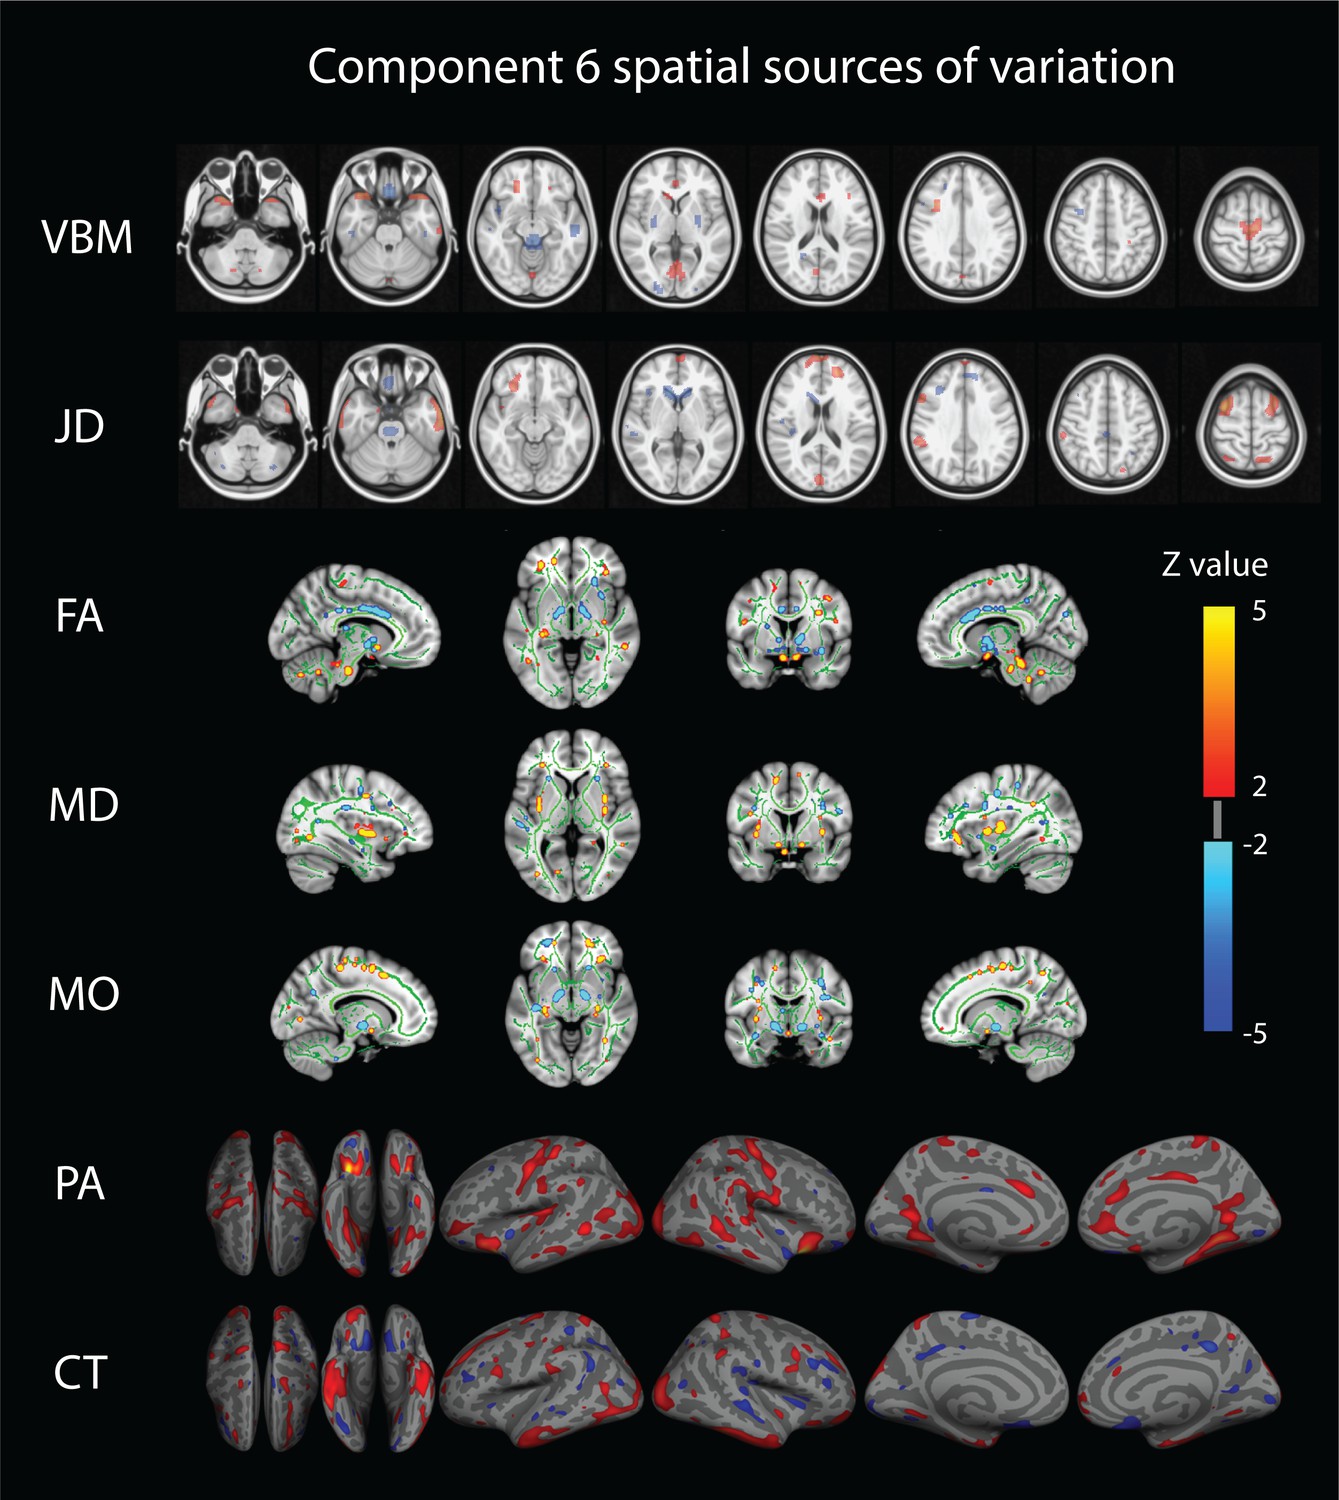
Component number six feature sources of variation.
From top to bottom we visualize the VBM (Voxel Based Morphometry), JD (Jacobian Determinants), FA (Fractional Anisotropy), MD (Mean Diffusivity), MO (Mode of Anisotropy), PA (Pial Area), and CT (Cortical Thickness) spatial maps. For improved visualization, each modality has been thresholded at a z-value of 2. This mode of structural variation, component 6, that strongly reflects a ‘positive-negative’ behavioral spectrum, links to a wide range of brain regions across structural modalities and might reflect the structural multi-modal foundation of a functional brain network linked to these variations that has been earlier identified.
Figure 3
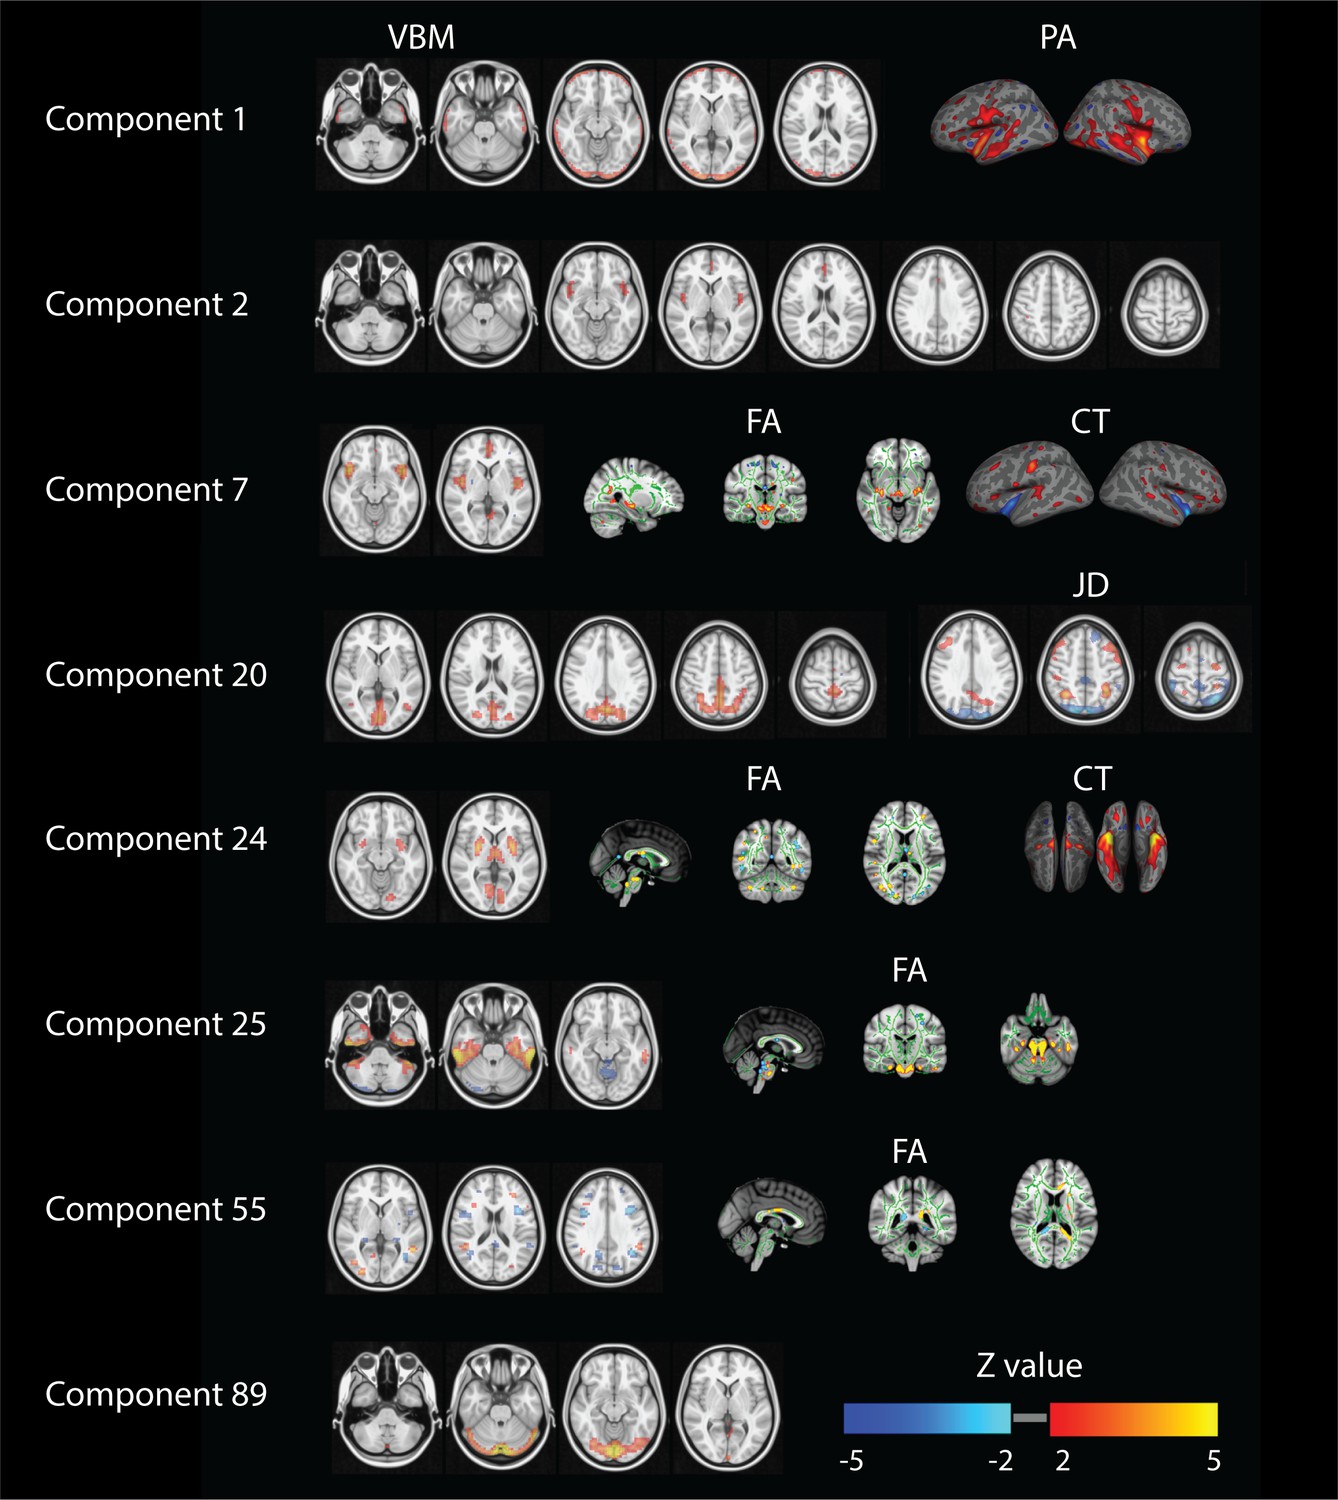
Summary of relevant modalities spatial maps associated with the components indexed in the most left column.
For component one we show spatial maps for VBM and PA, and for components number 2 and 89 just VBM. For numbers 7 and 24 we present VBM, FA and CT. For number 20 we show VBM and JD and finally for numbers 25, 29 and 55 we present VBM and FA.
Appendix 1—figure 1

Relative contributions of each feature modality to the most relevant components.
https://doi.org/10.7554/eLife.44443.021
Appendix 1—figure 2
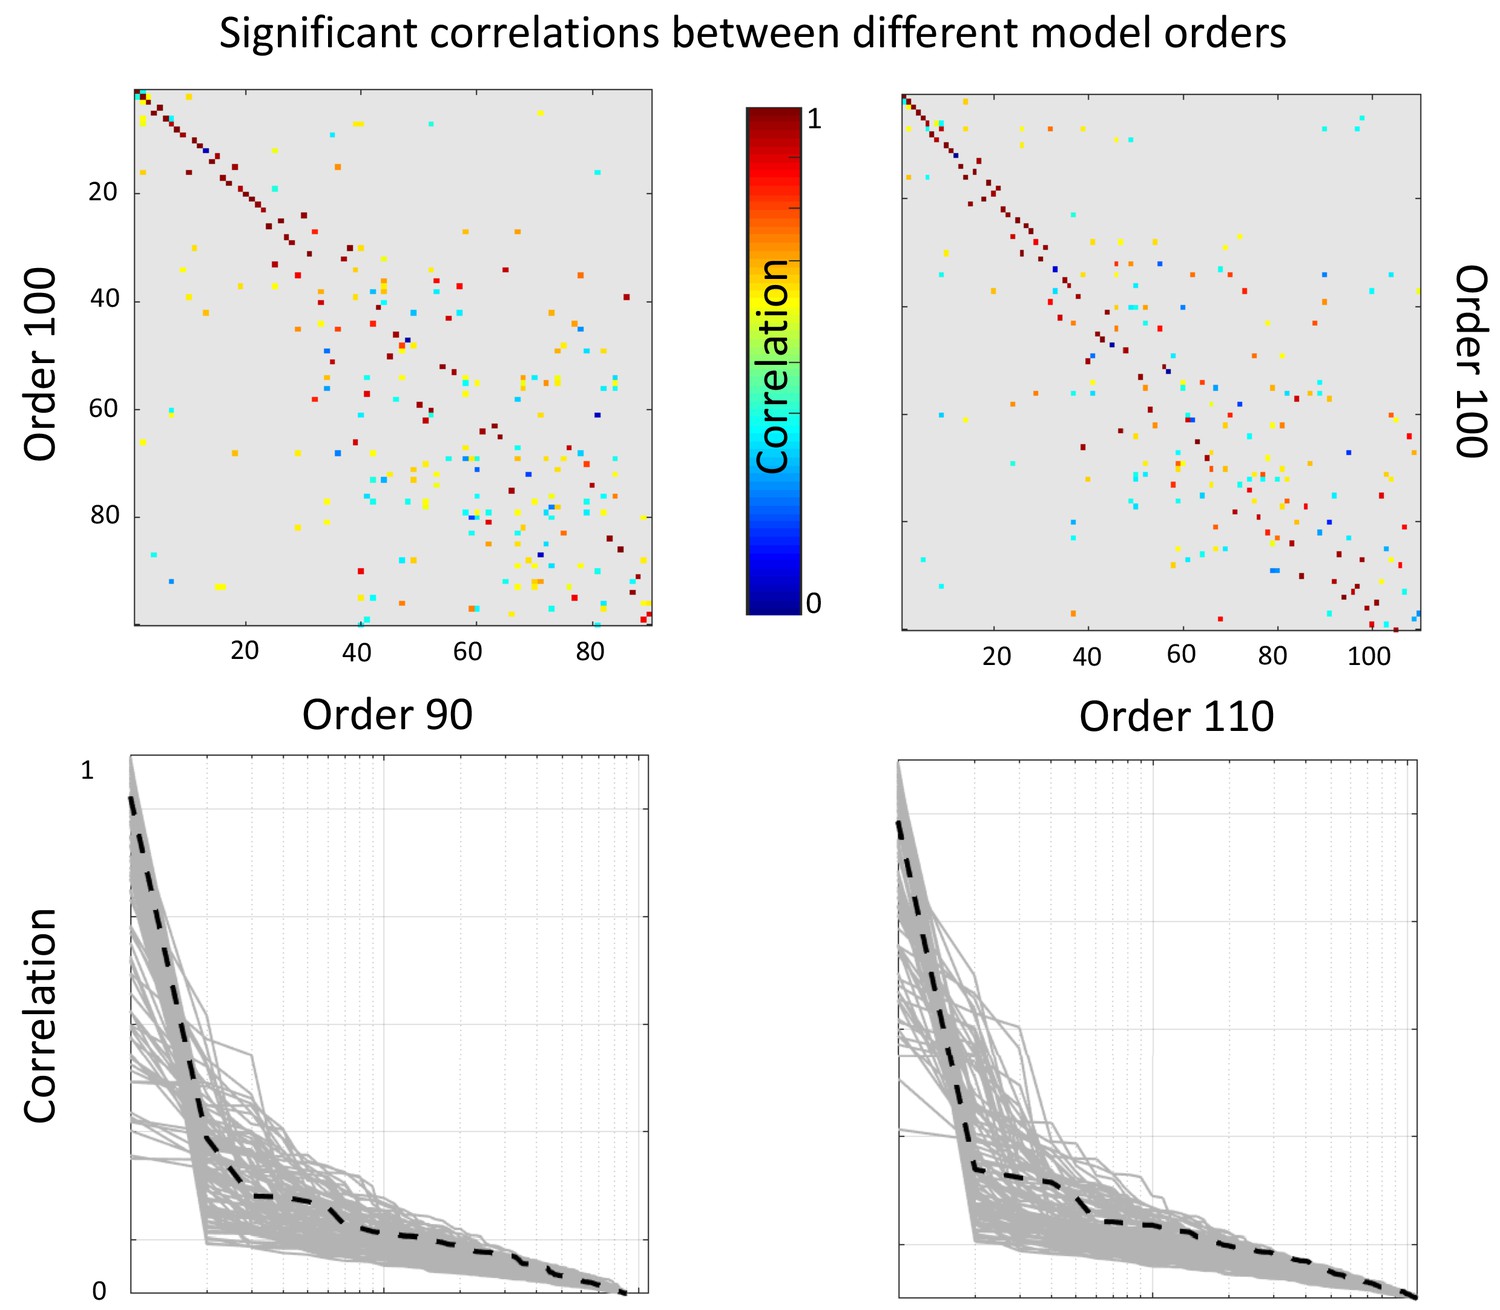
Top: Significant correlations between the reported (100 dimensional) factorization and a 90 dimensional (left panel) and 110 dimensional (right panel).
Bottom: sorted absolute correlations for each of the components of the reported factorization with the other model orders components. The black discontinuous line represents component number 6.
Additional files
-
Supplementary file 1
Summary of the behavioral/demographic measures present in the HCP sample.
- https://doi.org/10.7554/eLife.44443.006
-
Supplementary file 2
Significant results.
First column presents the component number, second the behavioral or demographic measure it correlates with and third and fourth columns present the correlation value and the permutation p-value. Significance is defined at p<0.05 and we used FDR correction for multiple correction (q < 2.2×10⁻⁴).
- https://doi.org/10.7554/eLife.44443.007
-
Supplementary file 3
Comparison between the positive-negative mode presented in the main text and the multi-modal analyses excluding the JD feature (right column).
- https://doi.org/10.7554/eLife.44443.008
-
Supplementary file 4
Summary of the uni-modal analyses using the JD feature.
In the second row all relationships are significant after multiple comparison correction. For the uni-modal analysis (the third row), significant associations after multiple comparison correction are denoted with a double asterisk and nominal significant but not significant after multiple comparison correction are marked with a single asterisk.
- https://doi.org/10.7554/eLife.44443.009
-
Supplementary file 5
Linked ICA spatial maps associated with the FA feature.
- https://doi.org/10.7554/eLife.44443.010
-
Supplementary file 6
Linked ICA spatial maps associated with the MD feature.
- https://doi.org/10.7554/eLife.44443.011
-
Supplementary file 7
Linked ICA spatial maps associated with the MO feature.
- https://doi.org/10.7554/eLife.44443.012
-
Supplementary file 8
Linked ICA spatial maps associated with the VBM feature.
- https://doi.org/10.7554/eLife.44443.013
-
Supplementary file 9
Linked ICA spatial maps associated with the JD feature.
- https://doi.org/10.7554/eLife.44443.014
-
Supplementary file 10
Linked ICA spatial maps associated with the left hemisphere CT feature.
- https://doi.org/10.7554/eLife.44443.015
-
Supplementary file 11
Linked ICA spatial maps associated with the right hemisphere CT feature.
- https://doi.org/10.7554/eLife.44443.016
-
Supplementary file 12
Linked ICA spatial maps associated with the left hemisphere PA feature.
- https://doi.org/10.7554/eLife.44443.017
-
Supplementary file 13
Linked ICA spatial maps associated with the right hemisphere PA feature.
- https://doi.org/10.7554/eLife.44443.018
-
Transparent reporting form
- https://doi.org/10.7554/eLife.44443.019
Download links
A two-part list of links to download the article, or parts of the article, in various formats.
Downloads (link to download the article as PDF)
Open citations (links to open the citations from this article in various online reference manager services)
Cite this article (links to download the citations from this article in formats compatible with various reference manager tools)
Inter-individual differences in human brain structure and morphology link to variation in demographics and behavior
eLife 8:e44443.
https://doi.org/10.7554/eLife.44443


