scRNA-Seq reveals distinct stem cell populations that drive hair cell regeneration after loss of Fgf and Notch signaling
- Stowers Institute for Medical Research, United States
- Ciencias Biologicas, Ecuador
- Wellcome Sanger Institute, Wellcome Genome Campus, United Kingdom
- University of Cambridge, United Kingdom
Figures
Figure 1 with 1 supplement
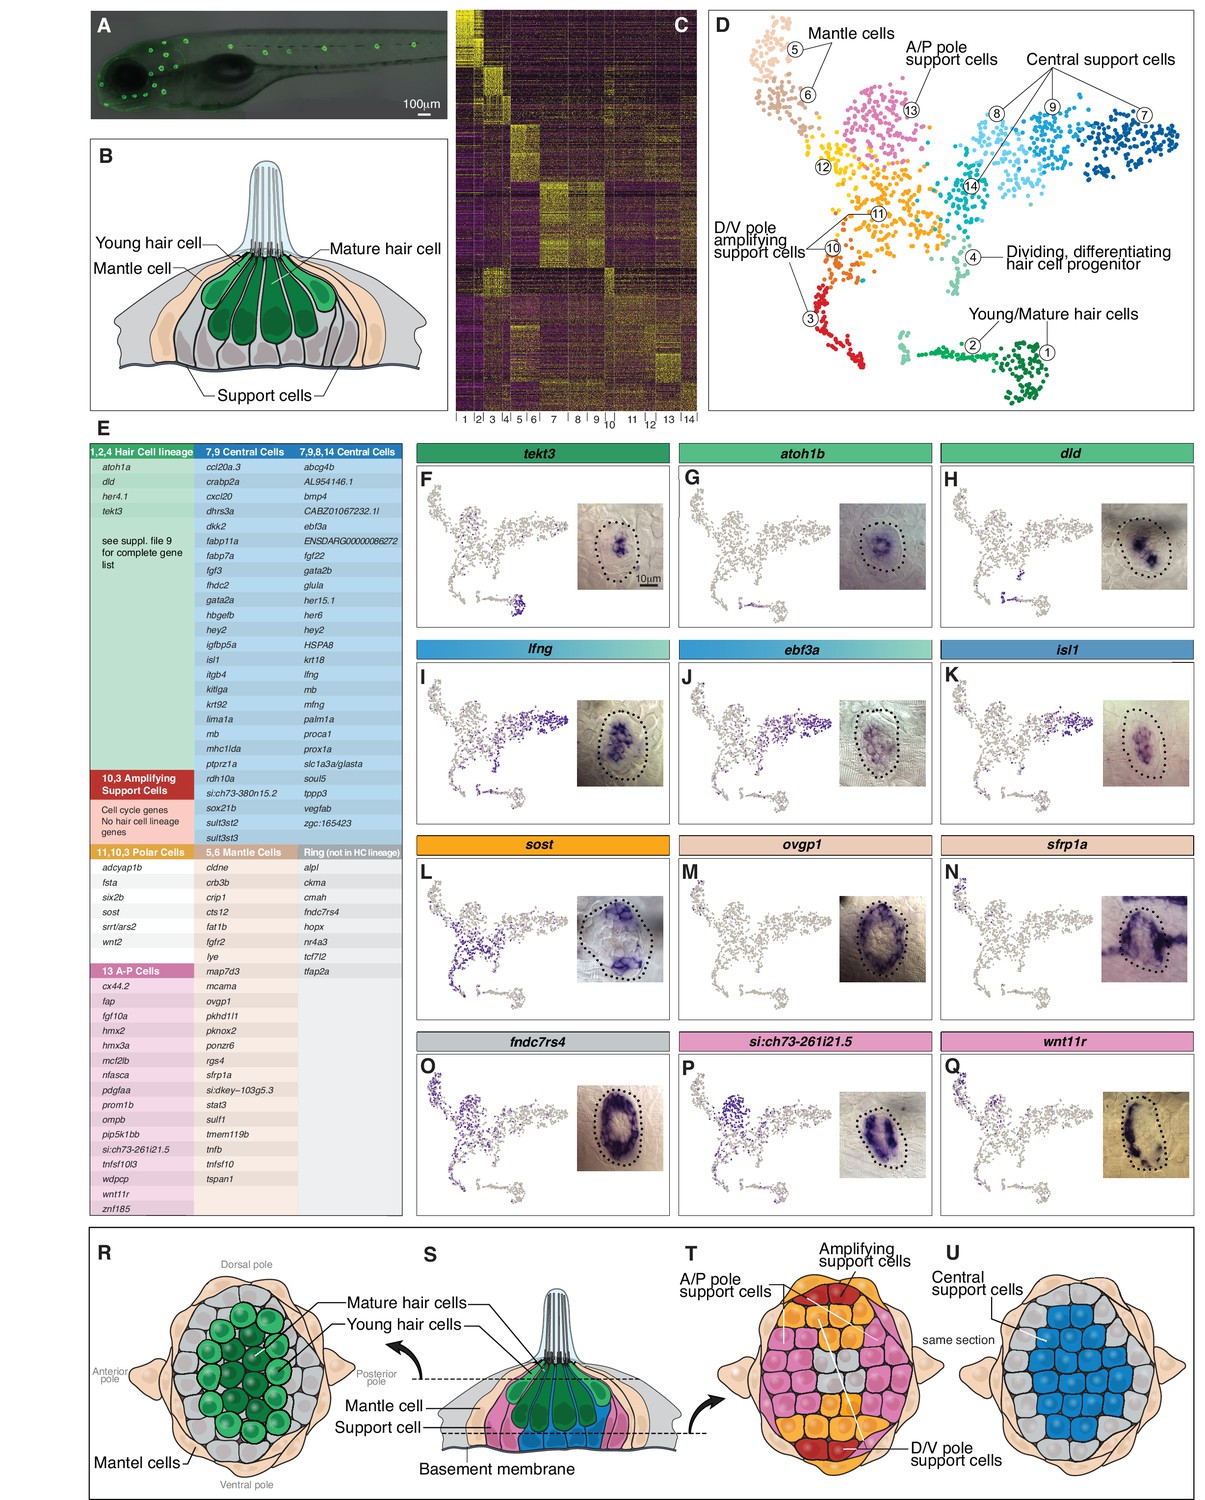
Single cell RNA-Seq reveals support cell heterogeneity.
(A) Et(Gw57a) labels support cells with GFP. (B) Schematic of a cross section through a neuromast. (C) Heatmap showing the expression levels of the top 50 marker genes (y-axis) for each cluster (x-axis), sorted by highest fold change. (D) t-SNE plot showing the different cell clusters. (E) Table of marker genes that distinguish the different cell clusters. (F–Q) t-SNE plots of selected cluster markers and in situ hybridization with these genes. (R, T and U) Schematics of dorsal views of neuromasts with the different cell types colored. (S) Schematic of a cross section through the center of a neuromast.
Figure 1—video 1
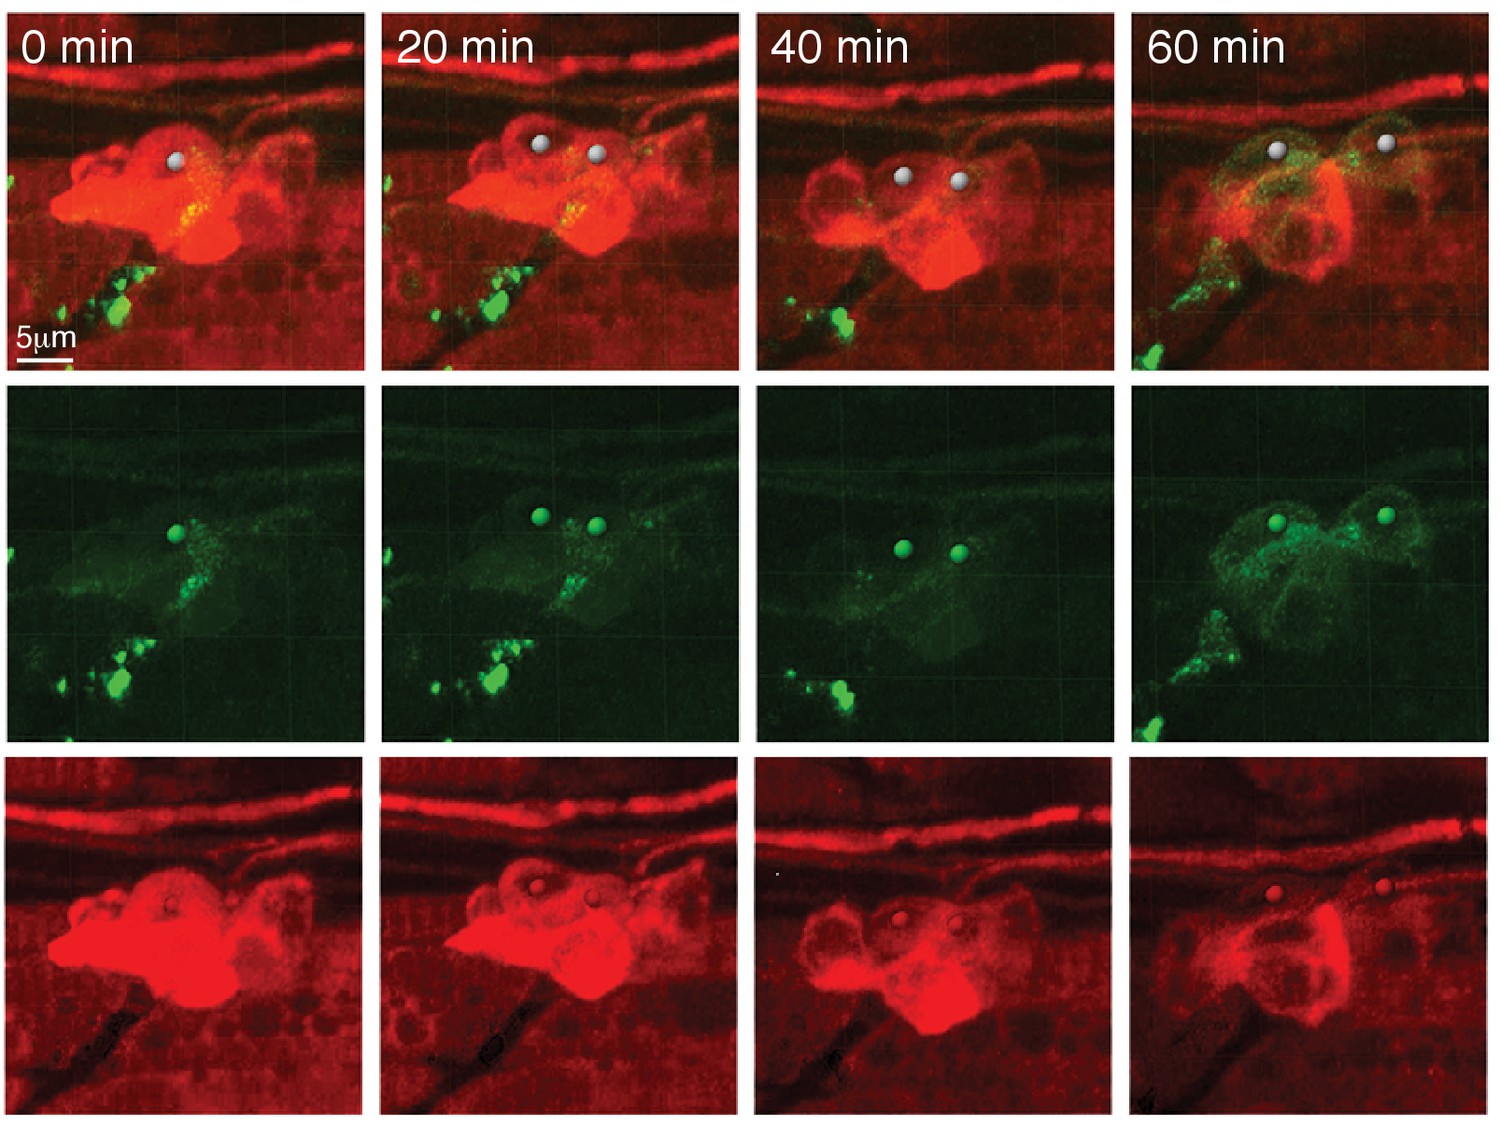
Tg(prox1a:tagRFP;pou4f3:gfp) during regeneration.
A dividing prox1a-positive cell downregulates prox1a:tagRFP and upregulates the hair cell marker pou4f3:gfp.
Figure 2 with 2 supplements
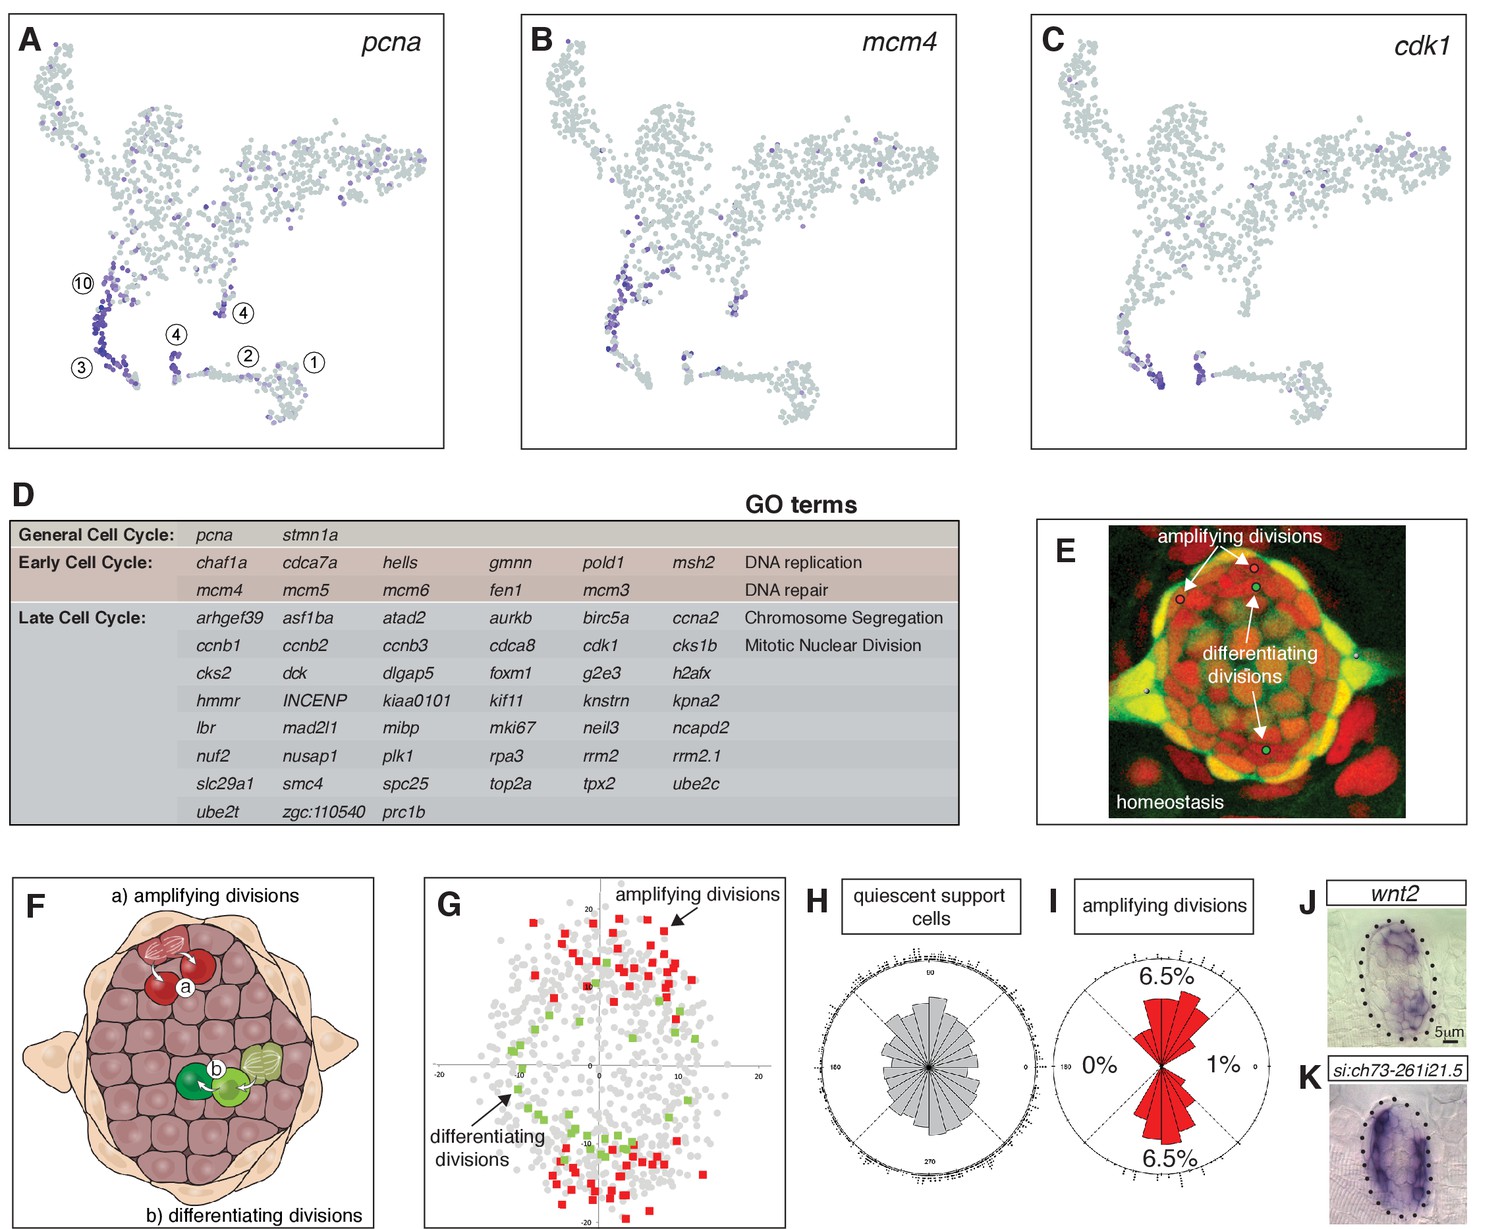
Cycling cells characterize the amplifying and differentiating lineages.
(A) pcna labels all proliferating cells. (B) mcm4 labels cells that are replicating DNA early in the cell cycle. (C) cdk1 labels cells in late stages of the cell cycle. (D) Table of early and late cell cycle genes. (E) Still image of a time lapse video of a homeostatic neuromast in which all dividing cells were tracked. Red dots indicate the position of pre-division amplifying cells, green dots indicate differentiating cells (Romero-Carvajal et al., 2015). (F) Schematic dorsal view of a neuromast showing that amplifying cells are next to mantle cells in the poles (red), whereas differentiating cells are centrally located (adapted from Romero-Carvajal et al., 2015). (G) BrdU analysis of 18 homeostatic neuromasts that were labeled with BrdU for 24 hrs (Romero-Carvajal et al., 2015). The position of each dividing support cell was plotted. Cells that divided symmetrically and self-renewed are plotted in red; dividing cells that differentiated into hair cells are in green. Quiescent support cells are in grey and show that cells in the A/P poles are relatively quiescent and if they divide, they differentiate. Mantle cells are not shown. (H, I) Rose diagrams show that the D/V poles possess slightly more cells than the A/P poles (H), however a larger percentage of them proliferates (I). (J) wnt2 is expressed in the domain of amplifying cells. (K) the zona pellucida-like domain-containing protein 1gene si:ch73-261i21.5 is expressed in the quiescent region.
Figure 2—figure supplement 1

t-SNE plot, cell cycle genes regressed out.
Cluster 4 (differentiating divisions) and cluster 3 cells (amplifying support cells) now cluster with central and D/V support cells, respectively (dashed lines).
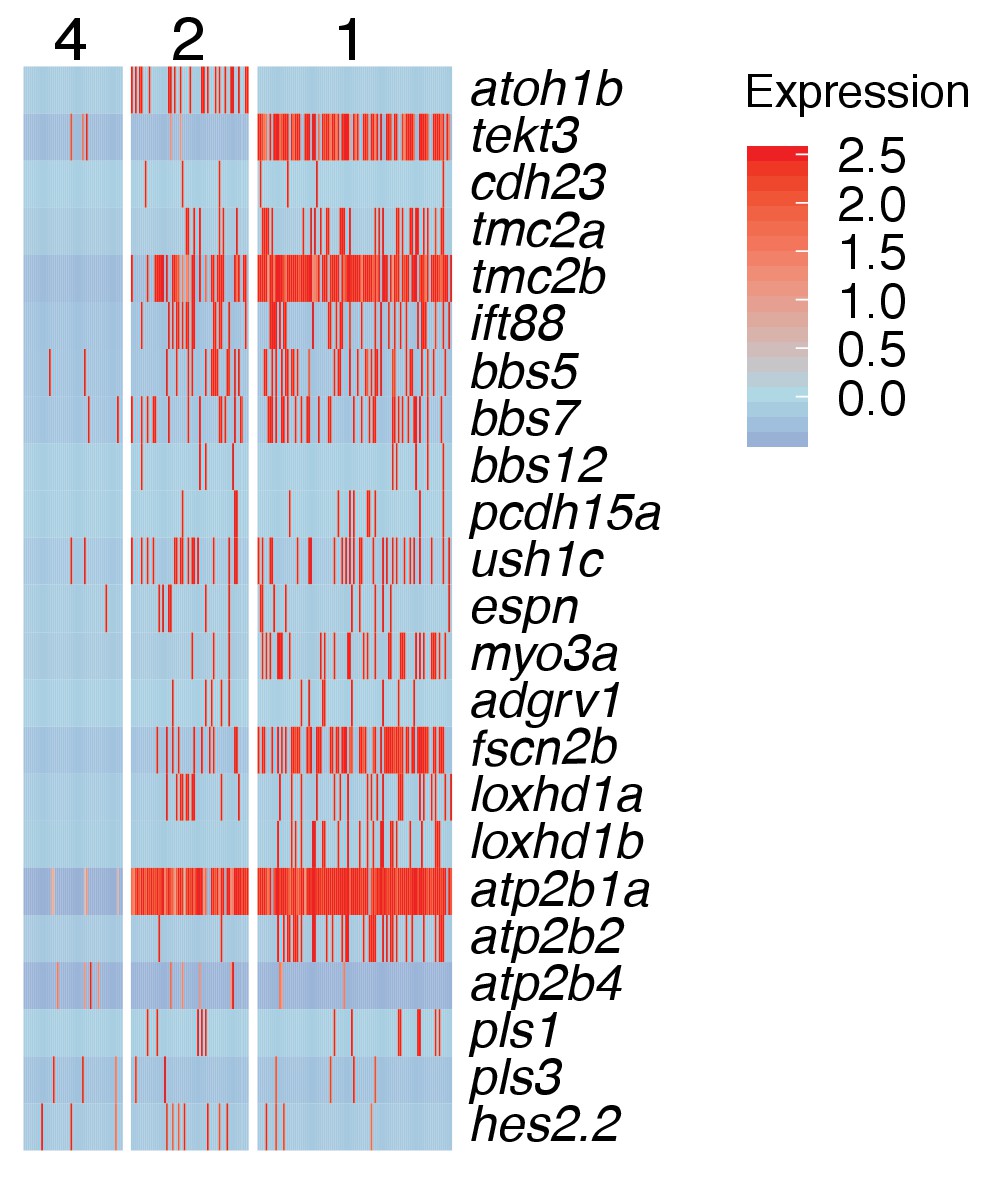
Figure 2—figure supplement 2

Heatmap of human deafness genes that are expressed in homeostatic lateral line scRNA-Seq data.
https://doi.org/10.7554/eLife.44431.006
Figure 3 with 2 supplements
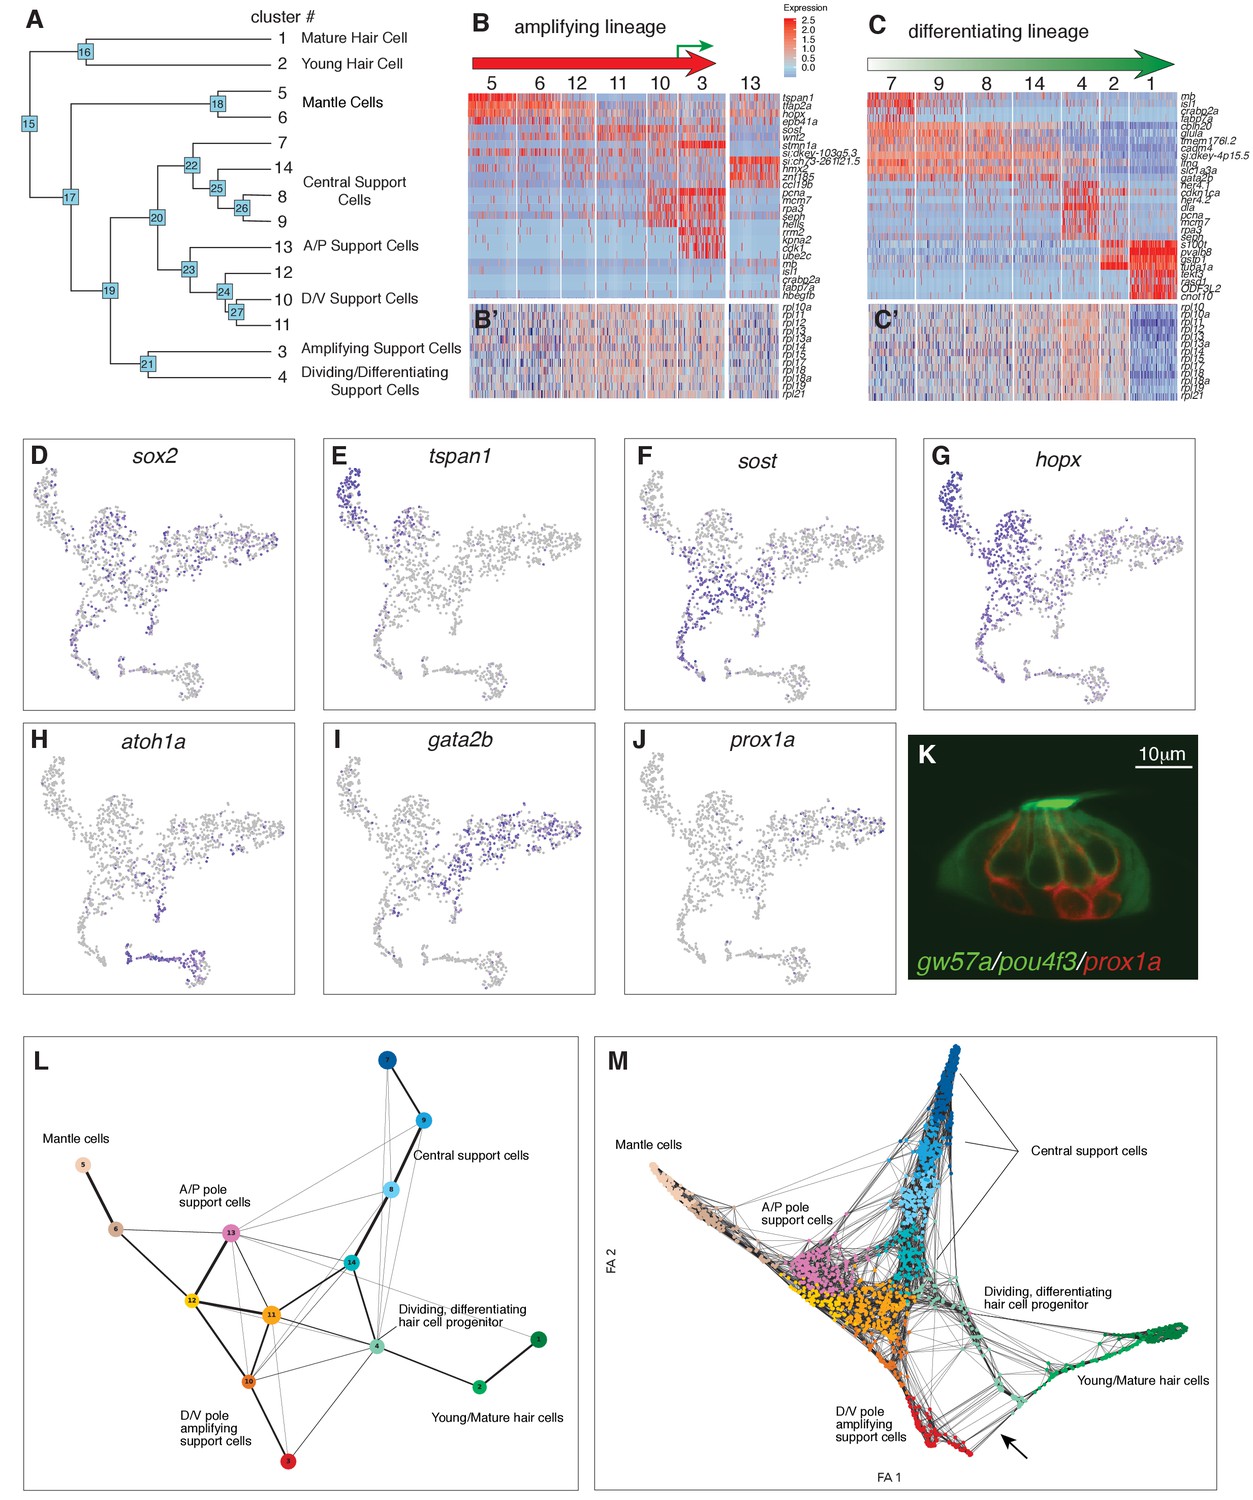
Organizing clusters along a putative path of development reveals amplifying and differentiating lineages.
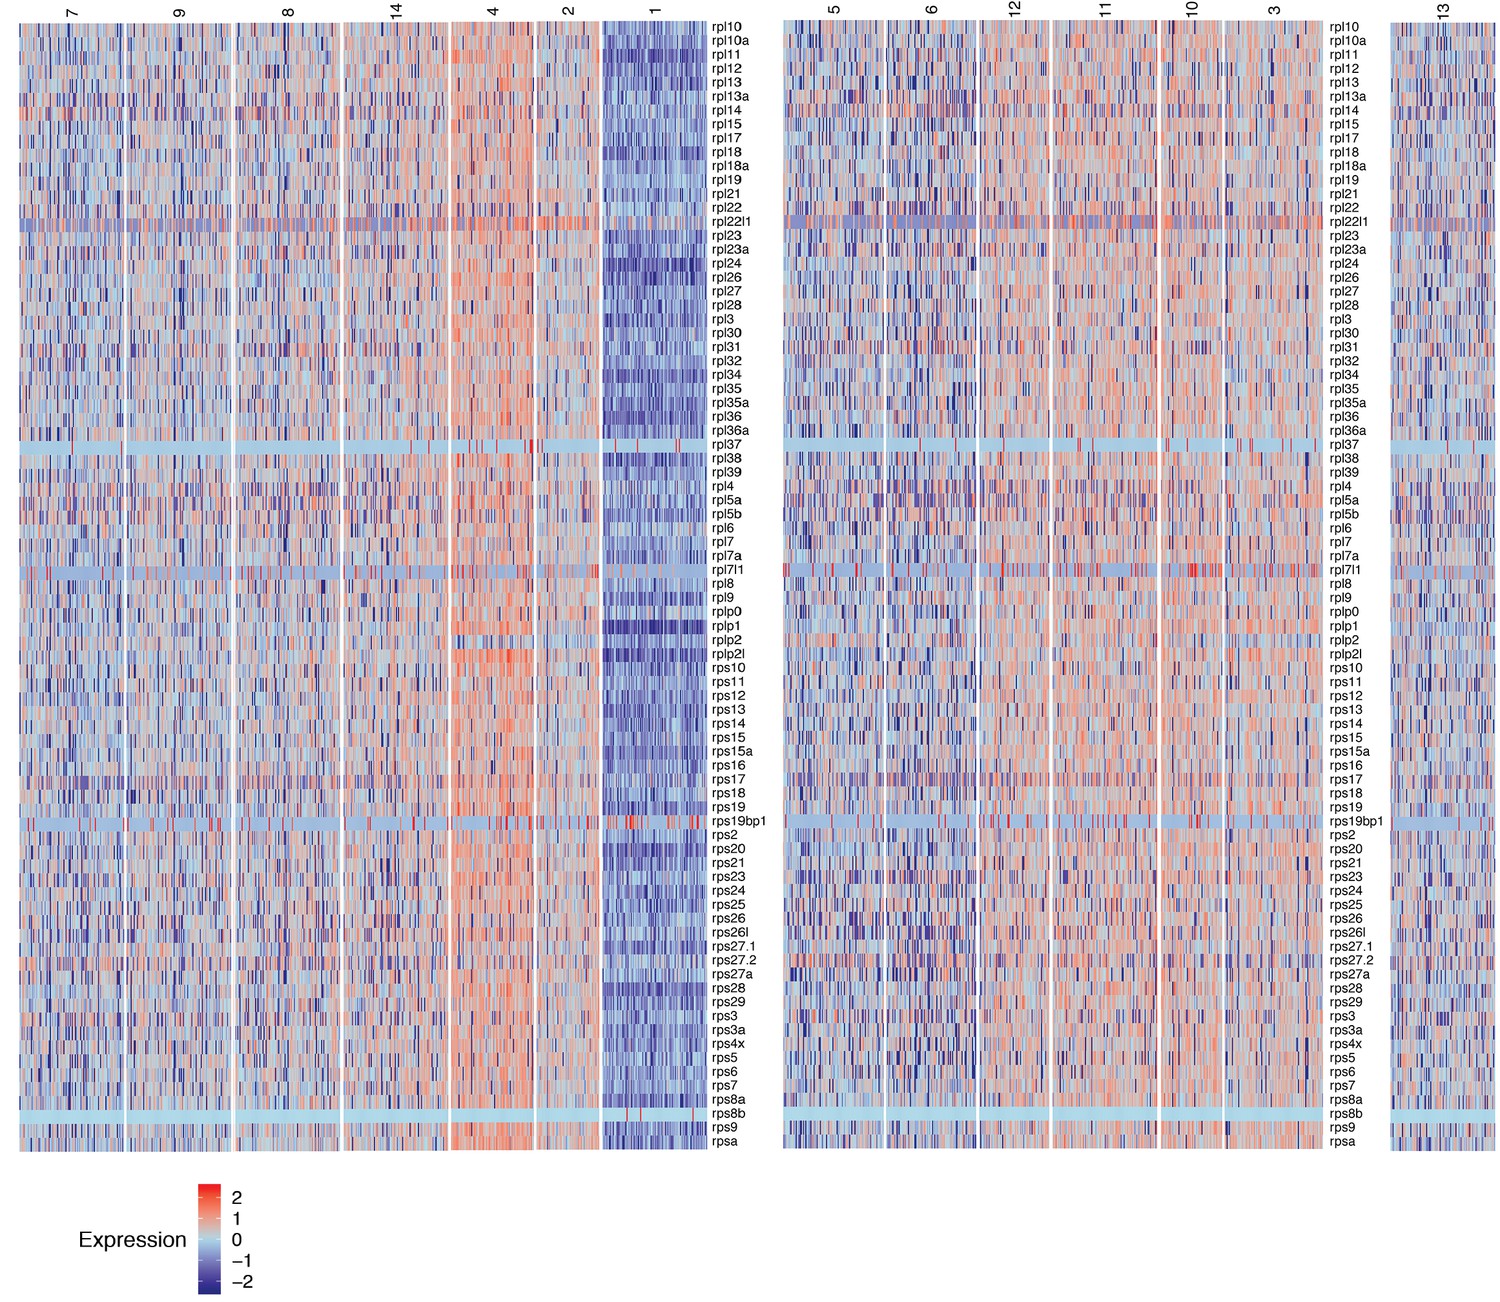
(A) Dendrogram of cell clusters. Each branch point (node) is labeled. Genes enriched in each branch are shown in Supplementary file 7. (B, C) Genes selected from the node heatmaps show how some genes are shared between different clusters indicating the existence of two different lineages. Heat map legend shows log2 fold expression changes. (B) Amplifying lineage: Mantle cells (clusters 5, 6) to proliferating, self-renewing support cells (cluster 3). Green arrow shows that some amplifying cells switch over to the differentiating lineage when displaced toward the center of the neuromast. The relationships with cluster 13 cells is unclear. This cluster is thus set aside. (C) Differentiating lineage: Central support cells (7, 9, 8) to differentiated hair cells (clusters 1, 2). (B’, C’) Heatmaps of ribosomal genes in the two lineages suggest increased transcription as support cells are activated. Mantle cells, central cells and differentiated hair cells show low levels of ribosome biogenesis (see Figure 3—figure supplement 1). (D–J) t-SNE plots of selected genes labeling the different lineages. (D) sox2 labels all support cells. (E–G) The amplifying lineage is labeled by tspan1, sost and hopx. (H) atoh1a labels the differentiating/hair cell lineage. (I) gata2b labels mostly the central cells. (J) prox1a labels mostly central cells in cluster 7. (K) A gw57a; prox1a; pou4f3:GFP transgenic neuromast shows that red, prox1a-positive cells sit immediately beneath the green hair cells. (L) Each node in the PAGA graph represents a cluster and the weight of the lines represents the statistical measure of connectivity between clusters. (M) A ForceAtlas2 plot shows connectivity (KNN, k=15) between individual cells. The arrow points at connections between amplifying cells (cluster 3) and differentiating cells (cluster 4).
Figure 3—figure supplement 1
Heatmap of the expression of ribosomal protein genes in homeostatic lateral line cell scRNA-Seq data, reflecting transcriptional activity .
Cluster 13 is set aside because the relationships with cluster 13 cells is unclear. Heat bar shows log2 fold expression changes.
Figure 3—figure supplement 2
Still images of a video of prox1a:tagRFP-positive cells differentiating into pou4f3:gfp-positive hair cells.
https://doi.org/10.7554/eLife.44431.009
Figure 4 with 3 supplements

Dynamics of gene expression during hair cell differentiation.
(A–H) t-SNE plots of selected genes at different stages along the hair cell trajectory. Genes that show similar expression patterns are listed below the respective t-SNE plots. (I) Expression heatmap of hair cell lineage genes with cells from clusters 14, 4a/b, 2, and one ordered along pseudotime (see Figure 4A). Each gene # corresponds to the row index in Supplementary file 11. (J) Heatmap of genes that are downregulated as hair cells mature. Heat bar shows log2 fold expression changes. (K) In situ of fndc7a. Genes that are expressed in support cells but are downregulated in the hair cell lineage form a ring of expression. (L–N) A NFκB2:gfp reporter line shows expression in all support cells but not the hair cell lineage. (O) Maturing hair cells downregulated a number of genes as they develop from young to mature hair cells (clusters 2 and 1). Heat bar shows log2 fold expression changes.
Figure 4—figure supplement 1
Cilia gene expression in young (cluster 2) and mature hair cell (cluster 1).
https://doi.org/10.7554/eLife.44431.011
Figure 4—figure supplement 2
Related to Figure 4: GO terms of genes down regulated in Hair Cell clusters 1 and 2.
https://doi.org/10.7554/eLife.44431.012
Figure 4—figure supplement 3

Notch signaling plays an essential role in inhibiting proliferation and maintaining support cell fates.
(A, B) Heatmap and t-SNE plots of Notch receptors, ligands, modulators (lfng, mfng, numb) and downstream targets (e.g. hey1, her4.1). hey1 is a good read out for Notch signal activation and is active in all support cells and downregulated in the hair cell lineage, whereas delta a/b/c/d are expressed in hair cell progenitors. (C, D) The notch reporter Tg(Tp1:eGFP) is expressed in a mosaic fashion in central support cells underlying hair cells but not in hair cells themselves or the amplifying support cells in the D/V poles. atoh1a, the Notch ligands dla and jag2b are already expressed in central support cells before they proliferate (cluster 14), whereas dld and dlc are only expressed in proliferating progenitors (cluster 4). On the other hand, jag2b and dll4 are also or only expressed in differentiated hair cells (clusters 1, 2) suggesting that their loss could contribute or cause the downregulation of Notch signaling after hair cell death.
Figure 5 with 1 supplement
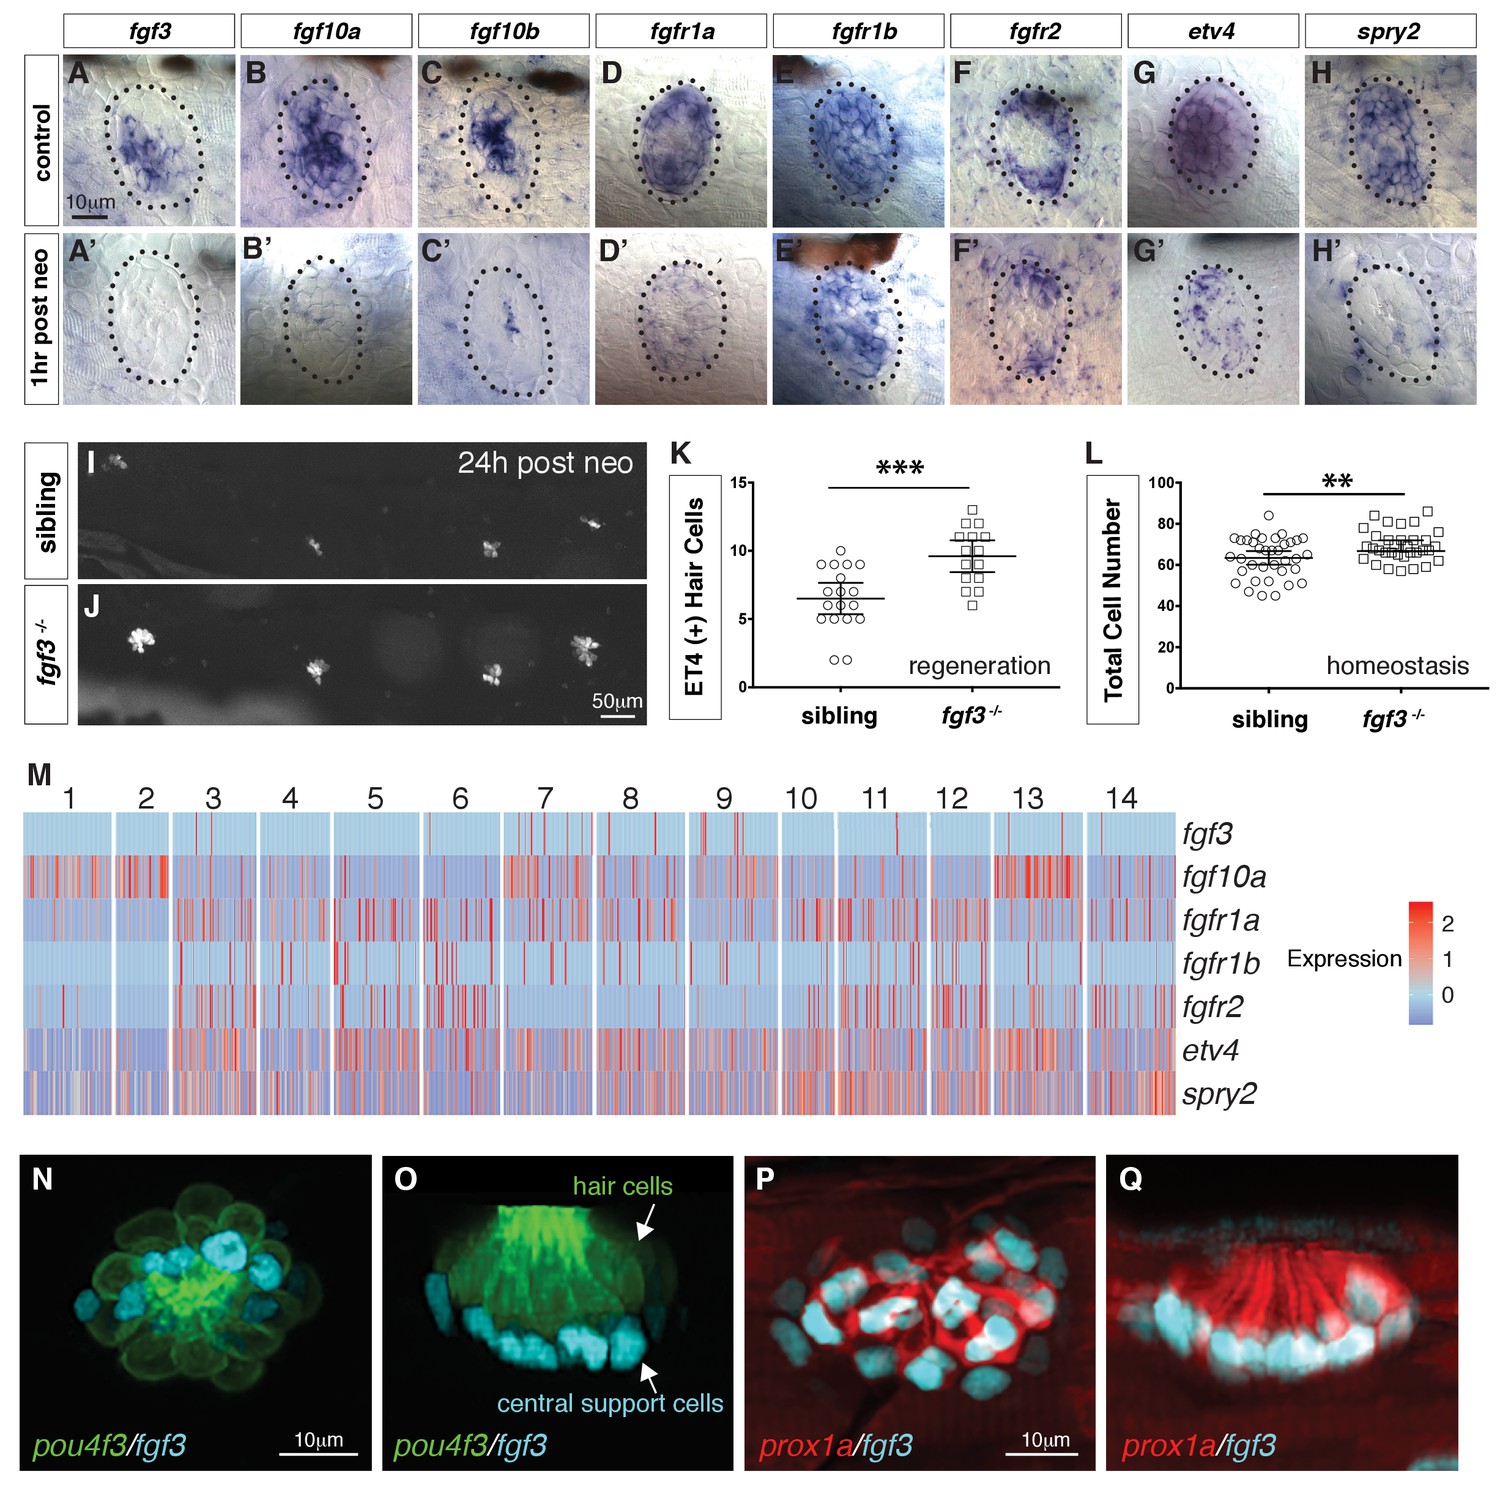
scRNA-seq reveals that fgf3 is expressed in central support cells and its downregulation enhances regeneration.
(A–H) Fgf pathway genes are expressed in 5dpf neuromasts. (A’–H’) Fgf pathway genes are downregulated 1 hr after hair cell death (post neo). (I and J) DASPEI staining of sibling (I) and fgf3-/- larvae (J) 24 hrs post neomycin showing hair cells. (K) Quantification of ET4:GFP (+) hair cells 24 hrs post neomycin in siblings and fgf3-/- neuromasts. fgf3-/- show increased hair cell and support cell numbers during regeneration. Error bars show the 95% confidence interval (CI). ***p<0.0004, unpaired t-test. (L) Quantification of total neuromast cell numbers at 5dpf in homeostatic sibling and fgf3 -/- neuromasts. Even during homeostasis fgf3-/- neuromasts possess more cells. Error bars show 95% CI. **p<0.0084, unpaired t-test. (M) Homeostasis scRNA-Seq expression heatmap of Fgf pathway genes. Heat bar shows log2 fold expression changes. (N–O) Double transgenic for pou4f3:gfp and fgf3:h2b-mturquoise2 at 5dpf. Dorsal and lateral views, respectively. Hair cells are in green, fgf3-expressing nuclei of central cells are in cyan. (P-Q) Double transgenic for prox1a:tag-rfp and fgf3:h2b-mturquoise2 at 5dpf. prox1a and fgf3 are co-expressed in central support cells.
Figure 5—video 1
3D animation of a fgf3:H2B-mturquoise2 and pou4f3:gfp-expressing neuromast.
https://doi.org/10.7554/eLife.44431.015
Figure 6 with 1 supplement

Loss of fgf3-/- causes increased support cell proliferation during homeostasis and regeneration.
(A–B) Spatial analysis of amplifying (red squares), differentiation (green triangles) cell divisions and quiescent mantle cells (blue X’s) in sibling and fgf3-/- neuromasts during homeostasis. Quiescent and BrdU-positive cells from 18 neuromasts are superimposed onto the same X-Y plane. N.S. = not significant. (A’–B’’) Rose diagrams of the angular positions of BrdU(+) support cells (red) or hair cells (green) in sibling and fgf3-/- during homeostasis. D/V clustering and directional bias to the posterior was analyzed with a Binomial distribution test, *p<0.05, **p<0.008. (C–D) Spatial analysis of amplifying and differentiation cell divisions or quiescent mantle cells in sibling and fgf3-/- 24 hrs post neomycin. (C’–D’’) Rose diagrams of the angular positions of BrdU-positive support cells or hair cells in sibling or fgf3-/- 24 hrs post neomycin. D/V clustering and directional bias to the posterior was analyzed with a Binomial distribution test, ****p<0.00001, **p<0.008 (E) BrdU index of amplifying, differentiating and total cell divisions in sibling and fgf3-/- during homeostasis. Error bars show 95% CI. p-value determined by unpaired t-test, *p<0.03, **p<0.007. (F) BrdU index of amplifying, differentiating and total cell divisions in siblings and fgf3-/- mutants during 24 hrs post neomycin treatment. Error bars show 95% CI. p-value determined by unpaired t-test, ***p<0.0005, ****p<0.0001. (G–H) Alkaline phosphatase staining of sibling or fgfr1a-/-/fgfr2-/- at 5dpf. (I) Quantification of total neuromast cell number at 5dpf in siblings, fgfr2-/-, fgfr1a-/- and fgfr1a-/-/fgfr2-/-. Error bars show 95% CI. p-value determined by unpaired t-test, **p<0.007, ****p<0.0001. (J–K) Spatial analysis of all cell divisions (orange squares) or quiescent cells (grey X) in sibling or fgfr1a/fgfr2-/- during homeostasis. (L) EdU index of total cell divisions in siblings and fgfr1a/fgfr2-/- mutants during homeostasis. Error bars show 95% CI. p-value determined by unpaired t-test, *p=0.03.
Figure 6—figure supplement 1
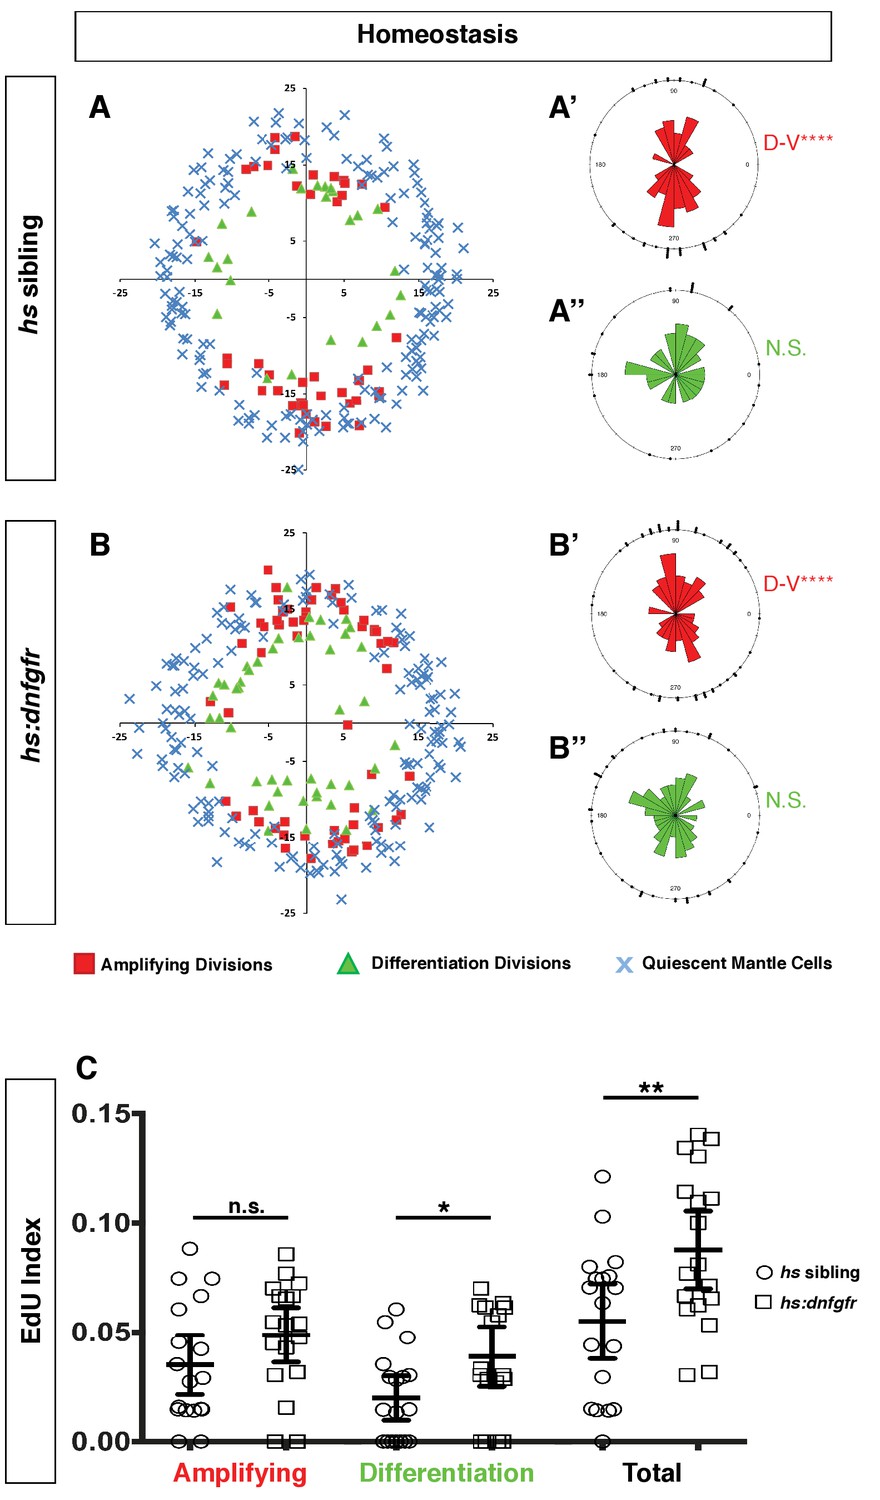
Expression of dnfgr1 also induces neuromast cell proliferation.
(A–B”) Spatial analysis of amplifying and differentiation cell divisions in hs sibling and hs:dnfgfr1 larvae during homeostasis. Clustering was analyzed with a Binomial distribution test, ****p<0.0001. (C) EdU index of amplifying, differentiation and total cell divisions in homeostatic hs sibling and hs:dnfgfr1 larvae. Error bars show 95% CI. p-value determined by unpaired t-test, *p<0.02, **p<0.008.
Figure 7 with 1 supplement
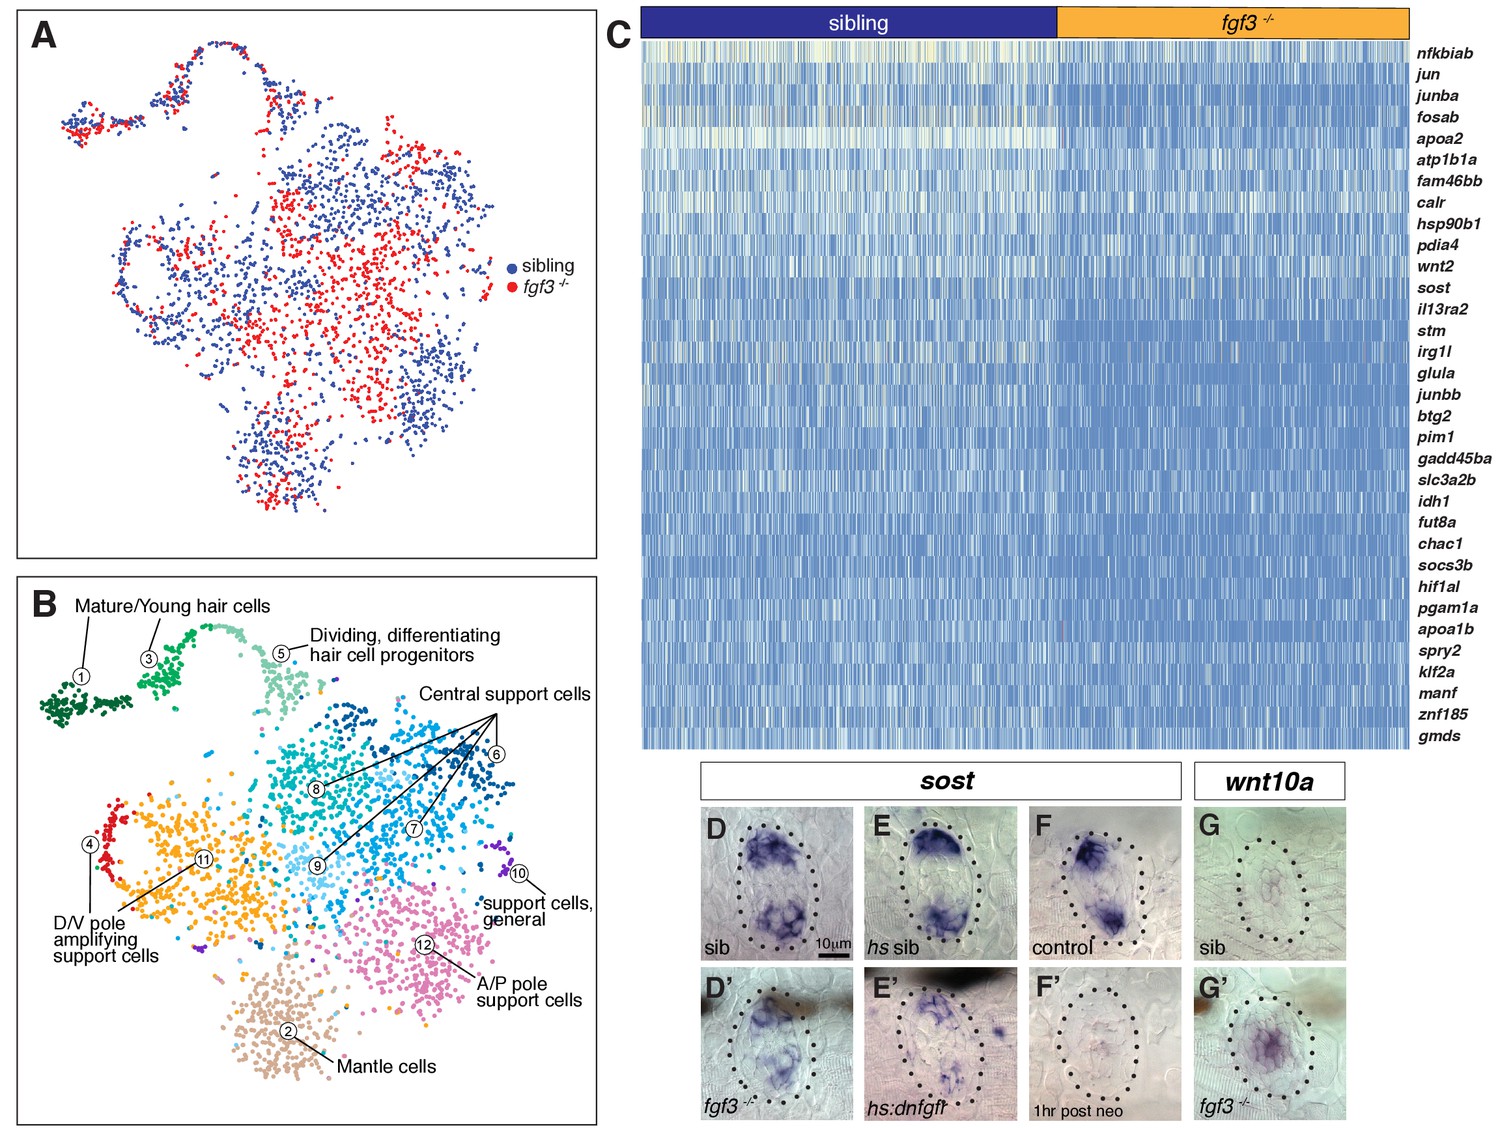
scRNA-Seq analysis of fgf3 mutants identifies fgf3 targets.
(A) t-SNE plot depicting the integration of fgf3 mutant and sibling scRNA-Seq data sets. Sibling cells in blue, fgf3-/- cells in red. (B) Graph-based clustering of both fgf3 mutant and sibling data sets. No major cluster is missing in fgf3-/-. (C) Heatmap of genes downregulated in five dpf fgf3-/- neuromasts. (D–F’) sost expression is downregulated in 5dpf fgf3-/- mutants; after expression of dnfgfr1a and after 1 hr post neomycin treatment. (G–G’) The Wnt target gene, wnt10a, is upregulated in 5dpf fgf3-/- neuromasts.
Figure 7—figure supplement 1
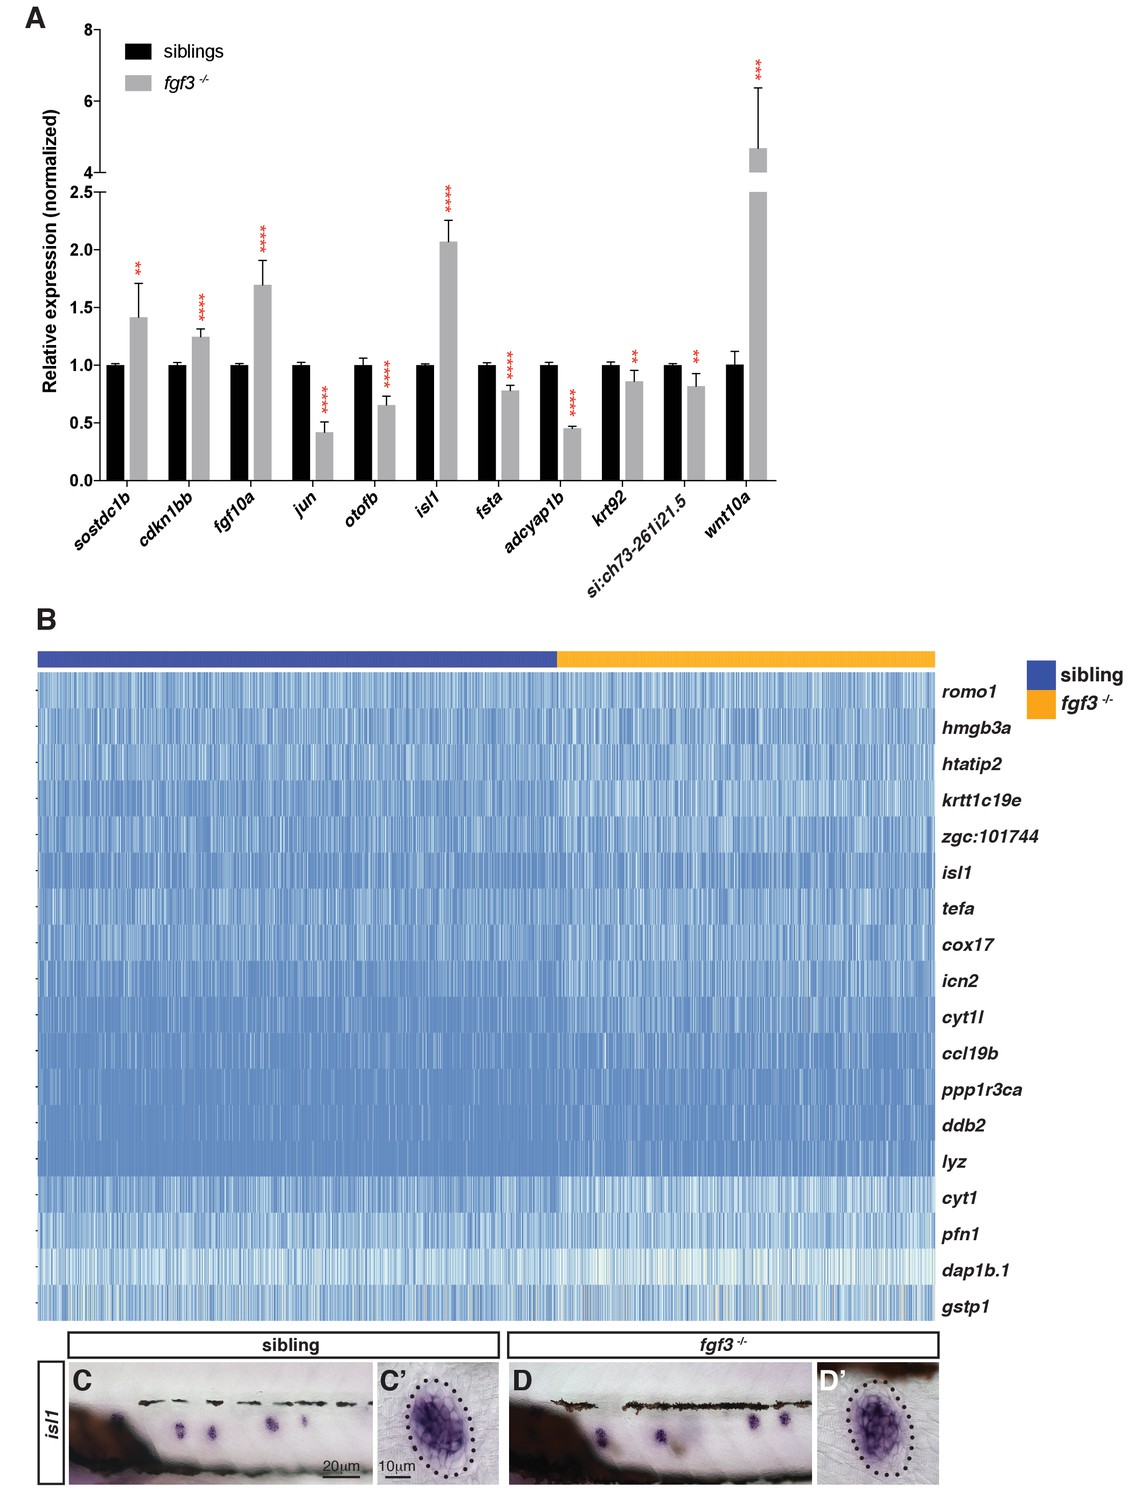
Selection of genes that are differentially expressed in fgf3 mutants.
(A) RT-qPCR with candidate genes identified in the fgf3-/- scRNA-Seq analysis. Error bar: SD, t-test, **p<0.01, ***p<0.001, and ****p<0.0001. (B) Heatmap of genes upregulated in fgf3 mutant lateral line cells. (C–D’) In situ hybridization of isl1 that is slightly upregulated in fgf3-/- neuromasts.
Figure 8
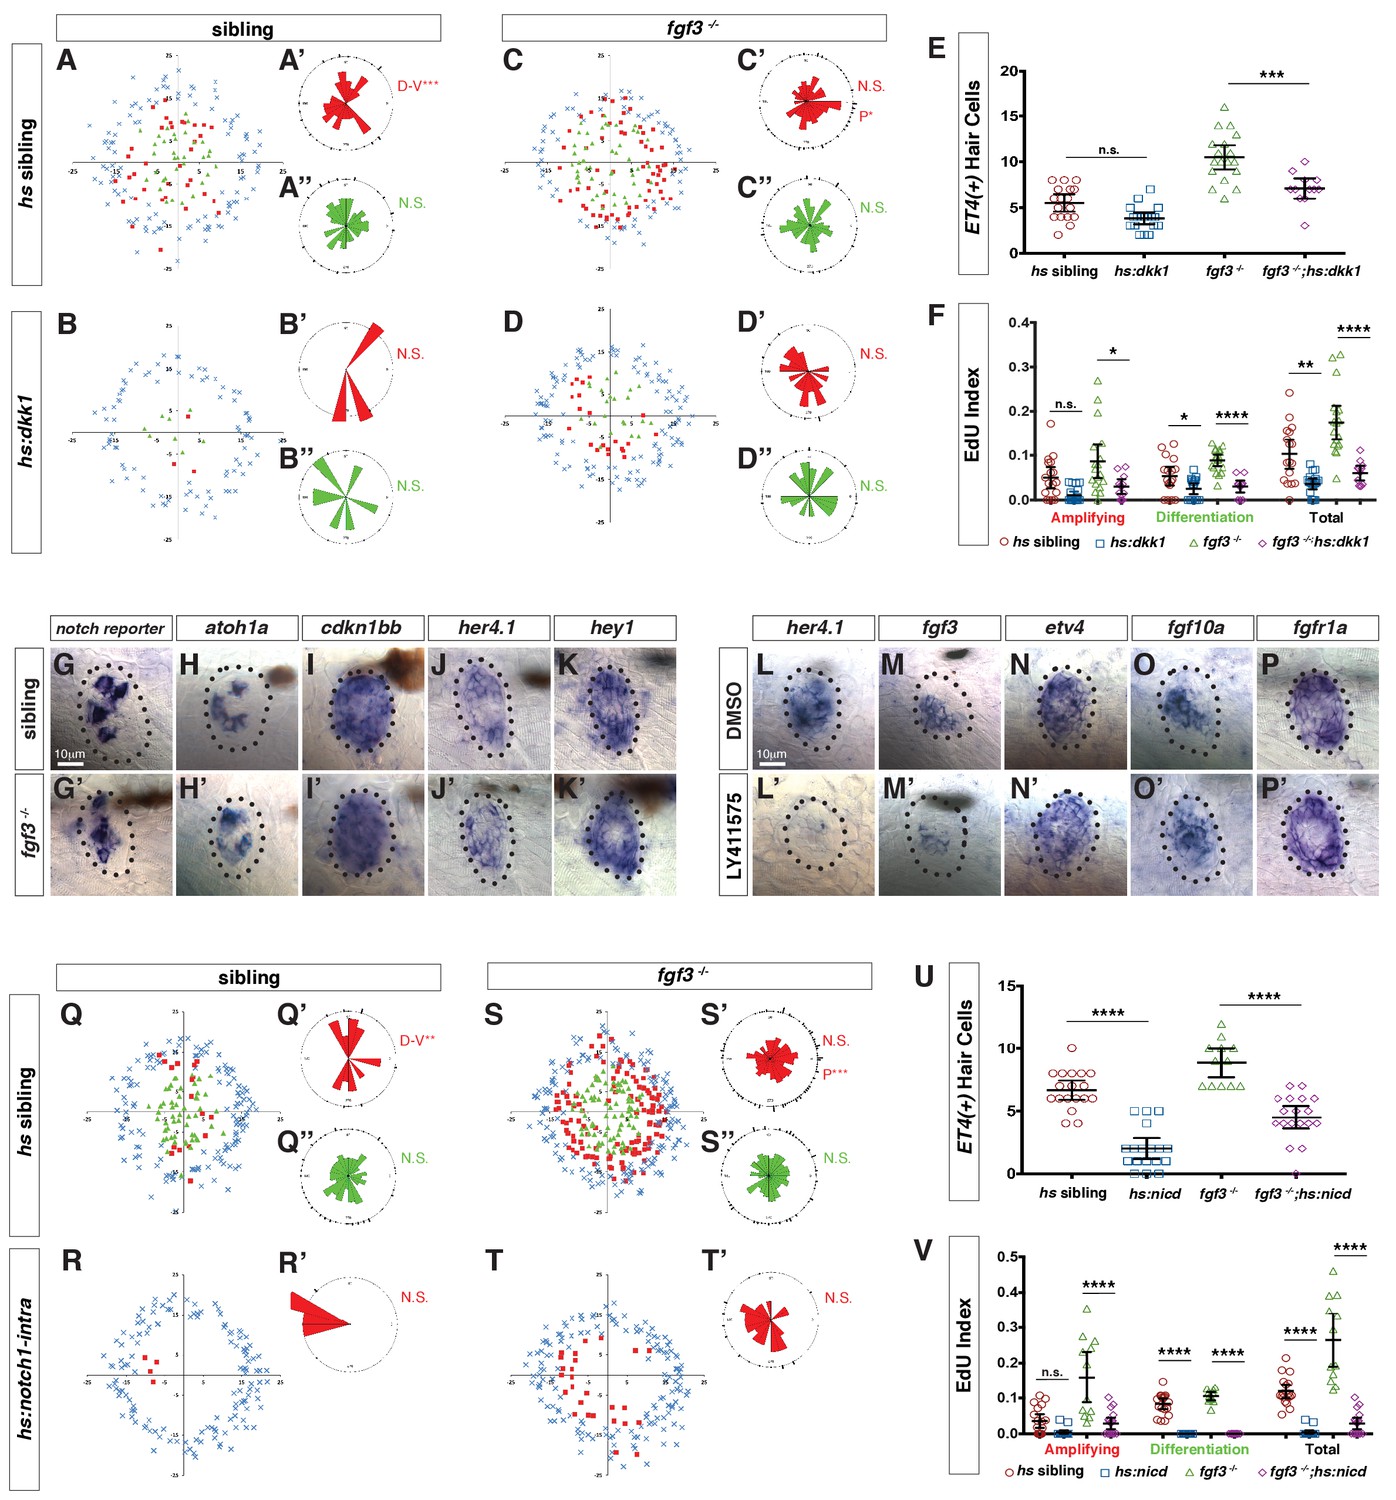
Fgf and Notch signaling largely act in parallel to inhibit Wnt-induced proliferation during homeostasis.
(A–D”) Spatial analysis of amplifying and differentiating cell divisions in sibling and fgf3-/- with or without dkk1 expression 24 hrs post neomycin. D/V clustering and directional bias to the posterior was analyzed with a Binomial distribution test, *p=0.03, **p<0.008. (E) Quantification of ET4:GFP-positive hair cells 24 hrs post neomycin in sibling and fgf3-/- with or without dkk1. Error bars show 95% CI. p-value determined by Anova and Tukey post-Hoc test, ***p=0.001. (F) EdU index of amplifying, differentiating and total cell divisions in sibling and fgf3-/- with or without dkk1 24 hrs post neomycin. Error bars show 95% CI. p-value determined by Anova and Tukey post-Hoc test, *p<0.02, **p<0.004, ****p<0.0001. (G–K’) Expression of Notch pathway genes. (G–G’) the notch reporter, atoh1a (H–H’), cdkn1bb (I–I’), her4.1 (J–J’) and hey1 (K–K’) are unchanged in 5dpf fgf3-/-. (L–P’) LY411575 inhibits her4.1 (L–L’) and fgf3 (M–M’), but not etv4 (N–N’), fgf10a (O–O’), or fgfr1a (P–P’) in 5dpf neuromasts. (Q–T’) Spatial analysis of amplifying and differentiating cell divisions in sibling and fgf3-/- with or without notch1a-intracellular domain expression 24 hrs post neomycin. D/V clustering and directional bias to the posterior was analyzed with a Binomial distribution test, **p<0.001, ***p<0.004 (U) Quantification of ET4:GFP-positive hair cells 24 hrs post neomycin in sibling and fgf3-/- with or without notch1a-intracellular domain (nicd). Error bars show 95% CI. p-value determined by Anova and Tukey post-Hoc test, ****p<0.0001. (V) Quantification of amplifying, differentiating and total cell divisions in sibling and fgf3-/- with or without nicd 24 hrs post neomycin. Error bars show 95% CI. p-value determined by Anova and Tukey post-Hoc test, ****p<0.0001.
Figure 9
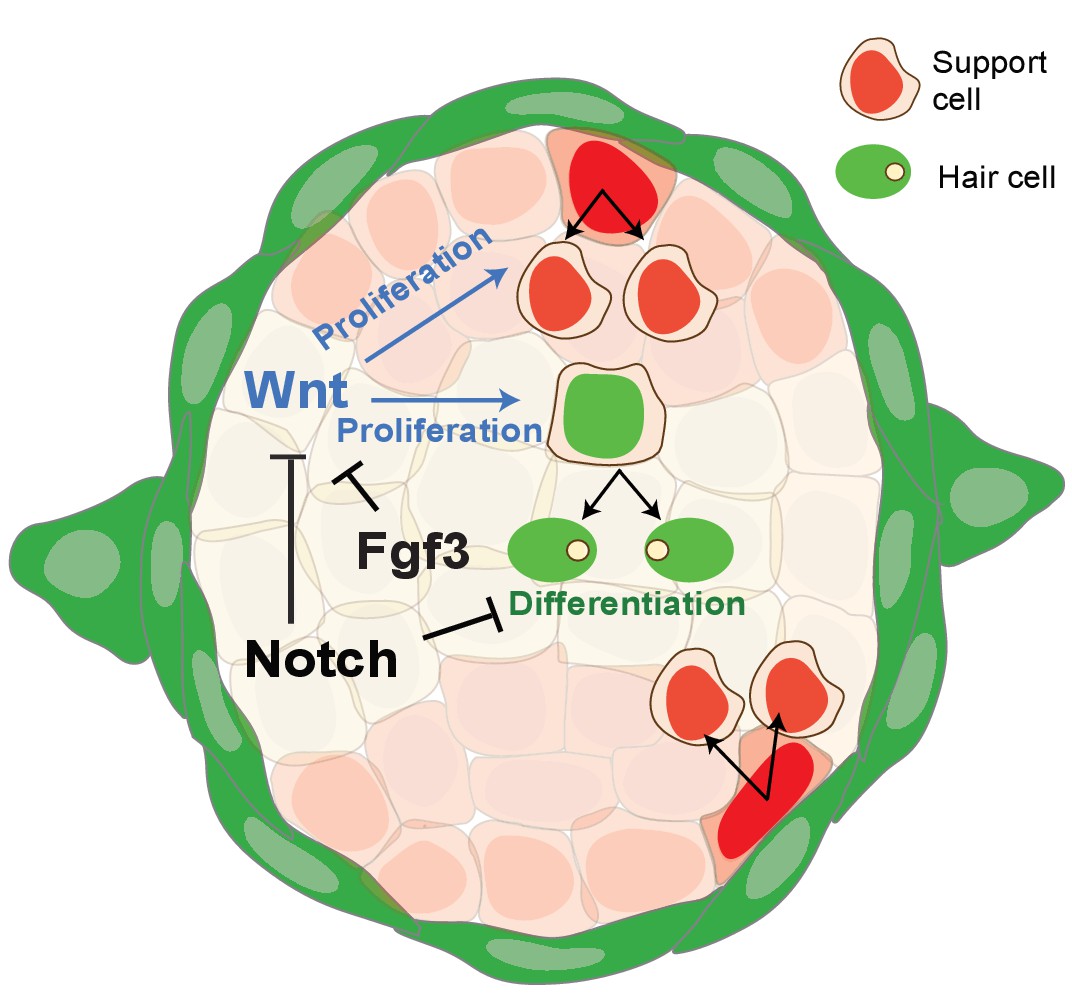
Schematic of signaling pathway interactions in a homeostatic neuromast (modified after Romero-Carvajal et al., 2015).
Notch and fgf3 inhibit Wnt signaling in parallel in homeostatic neuromasts. The downregulation of Notch and Fgf signaling after hair cell death leads to the upregulation of Wnt signaling and proliferation in central, differentiating and D/V, amplifying support cells.
Tables
Key resources table
| Reagent type (species) or resource | Designation | Source or reference | Identifiers | Additional information |
|---|---|---|---|---|
| Genetic reagent (D. rerio) | ET(krt4:EGFP)SqGw57a | (Kondrychyn et al., 2011) | SqGw57a | |
| Genetic reagent (D. rerio) | Tg(pou4f3:GAP-GFP)s356t | (Xiao et al., 2005) | s356t; RRID:ZFIN_ZDB-GENO-100820-2 | |
| Genetic reagent (D. rerio) | fgf3t26212 | (Herzog et al., 2004) | t26212; RRID:ZFIN_ZDB-ALT-040716-16 | |
| Genetic reagent (D. rerio) | Tg(hsp70l:dkk11b-GFP)w32tg | (Stoick-Cooper et al., 2007) | w32tg; RRID:ZFIN_ZDB-GENO-100420-26 | |
| Genetic reagent (D. rerio) | Tg(hsp70l:MYC-notch1a,cryaa:Cerulean)fb12Tg | (Zhao et al., 2014) | fb12Tg; RRID:ZFIN_ZDB-ALT-140522-5 | |
| Genetic reagent (D. rerio) | Tg(hsp70l:dnfgfr1a-EGFP)pd1tg | (Lee et al., 2005) | pd1tg; RRID:ZFIN_ZDB-ALT-060322-2 | |
| Genetic reagent (D. rerio) | TgBAC(prox1a:KALTA4,4xUAS-ADV.E1b:TagRFP)nim5Tg | (van Impel et al., 2014) | nim5Tg; RRID:ZFIN_ZDB-ALT-140521-3 | |
| Genetic reagent (D. rerio) | Tg(EPV.Tp1-Mmu.Hbb:EGFP)um14 | (Parsons et al., 2009) | um14; RRID: ZFIN_ZDB-GENO-090626-1 | |
| Genetic reagent (D. rerio) | Et(krt4:EGFP)sqet4ET | (Parinov et al., 2004) | sqet4ET; RRID:ZFIN_ZDB-GENO-070702-7 | |
| Genetic reagent (D. rerio) | Et(krt4:EGFP)sqet20ET | (Parinov et al., 2004) | sqet20ET; RRID:ZFIN_ZDB-ALT-070628-20 | |
| Genetic reagent (D. rerio) | Tg(fgf3:H2B-mturquoise2)psi60Tg | This paper | psi60Tg | |
| Genetic reagent (D. rerio) | fgfr1asa38715 | This paper | sa38715; RRID:ZFIN_ZDB-ALT-161003-16150 | |
| Genetic reagent (D. rerio) | fgfr2sa30975 | This paper | sa30975; RRID:ZFIN_ZDB-ALT-160601-753 | |
| Antibody | Mouse monoclonal Anti-BrdU | Sigma Aldritch | 1170376001; RRID:AB_2313622 | IHC (1/200) |
| Antibody | Rabbit polyclonal Anti-GFP | Thermo Fisher Scientific | A11122; RRID: AB_10073917 | IHC (1/400) |
| Antibody | Alexa Fluor 568 Goat anti-mouse monoclonal | Thermo Fisher Scientific | A11004; RRID:AB_141371 | IHC (1/1000) |
| Antibody | Alexa Fluor 488 Goat anti-rabbit polyclonal | Thermo Fisher Scientific | A11034; RRID:AB_2576217 | IHC (1/1000) |
| Sequence based reagent | crRNA | IDT | GGCCATGGAAACTAAATCTG | |
| Peptide, recombinant protein | Cas9 | PNA Bio | CP01 | 1 μM |
| Commercial assay or kit | Chromium Single Cell 3' Library and Gel Bead Kit | 10X Genomics | 120267 | |
| Commercial assay or kit | SMART-Seq v4 Ultra Low Input RNA kit | Takara | 634888 | |
| Chemical compound, drug | BrdU | Sigma Aldritch | B9285 | 10 mM |
| Chemical compound, drug | EdU | Carbosynth | NE08701 | 3.3 mM |
| Chemical compound, drug | Neomycin sulfate | Sigma Aldritch | N6386 | 300 μM |
| Chemical compound, drug | Alexa Fluor-594 Azide | Thermo Fisher Scientific | A10270 | 2.5 μM |
| Chemical compound, drug | LY411575 | Selleckchem | S2714 | 50 μM |
| Software, algorithm | Cell Ranger (v1.3.1 WT data set; v2.1.1 for fgf3 data sets) | 10X Genomics | ||
| Software, algorithm | Seurat (v2.3.4) | (Butler et al., 2018) | ||
| Software, algorithm | Scanpy (v1.3.2) | (Wolf et al., 2018a) | ||
Additional files
-
Supplementary file 1
Related to Figure 1: excel file of genes that are expressed in at least three cells.
- https://doi.org/10.7554/eLife.44431.022
-
Supplementary file 2
Related to Figure 1E: excel file of cluster marker genes.
- https://doi.org/10.7554/eLife.44431.023
-
Supplementary file 3
Related to Figure 1E: t-SNE plots of all cluster marker genes.
- https://doi.org/10.7554/eLife.44431.024
-
Supplementary file 4
Related to Figure 2D: excel file of cell cycle genes.
- https://doi.org/10.7554/eLife.44431.025
-
Supplementary file 5
Related to Figure 2D: t-SNE plots of cell cycle genes.
- https://doi.org/10.7554/eLife.44431.026
-
Supplementary file 6
Related to Figure 2—figure supplement 2: excel file of zebrafish orthologs of human deafness genes.
- https://doi.org/10.7554/eLife.44431.027
-
Supplementary file 7
Related to Figure 3A: excel files of differentially expressed genes between nodes (dendrogram).
- https://doi.org/10.7554/eLife.44431.028
-
Supplementary file 8
Related to Figure 3A: heatmaps of dendrogram node genes.
- https://doi.org/10.7554/eLife.44431.029
-
Supplementary file 9
Related to Figure 4A–H: excel file of hair cell lineage genes.
- https://doi.org/10.7554/eLife.44431.030
-
Supplementary file 10
Related to Figure 4A–H: t-SNE plots of hair cell lineage genes.
- https://doi.org/10.7554/eLife.44431.031
-
Supplementary file 11
Related to Figure 4l: excel file of hair cell genes ordered along pseudotime.
- https://doi.org/10.7554/eLife.44431.032
-
Supplementary file 12
Related to Figure 4—figure supplement 1: excel file of cilia genes.
- https://doi.org/10.7554/eLife.44431.033
-
Supplementary file 13
Related to Figure 7: excel file of cluster markers in fgf3-/- scRNA-Seq.
- https://doi.org/10.7554/eLife.44431.034
-
Supplementary file 14
Related to Figure 7C, S9B: differentially expressed genes in the fgf3-/-.
- https://doi.org/10.7554/eLife.44431.035
-
Supplementary file 15
Primer table for RT-qPCR.
- https://doi.org/10.7554/eLife.44431.036
-
Supplementary file 16
Related to Figures 1, 2, 5, 7 and 8: primers used for in situ probes.
- https://doi.org/10.7554/eLife.44431.037
-
Transparent reporting form
- https://doi.org/10.7554/eLife.44431.038
Download links
A two-part list of links to download the article, or parts of the article, in various formats.
Downloads (link to download the article as PDF)
Open citations (links to open the citations from this article in various online reference manager services)
Cite this article (links to download the citations from this article in formats compatible with various reference manager tools)
scRNA-Seq reveals distinct stem cell populations that drive hair cell regeneration after loss of Fgf and Notch signaling
eLife 8:e44431.
https://doi.org/10.7554/eLife.44431


