ADAM17-dependent signaling is required for oncogenic human papillomavirus entry platform assembly
- University Medical Center of the Johannes Gutenberg-University Mainz, Germany
- University of Bonn, Germany
- University Medical Center of the Johannes Gutenberg University Mainz, Germany
- University Hospital Schleswig-Holstein, Germany
Figures
Figure 1 with 2 supplements
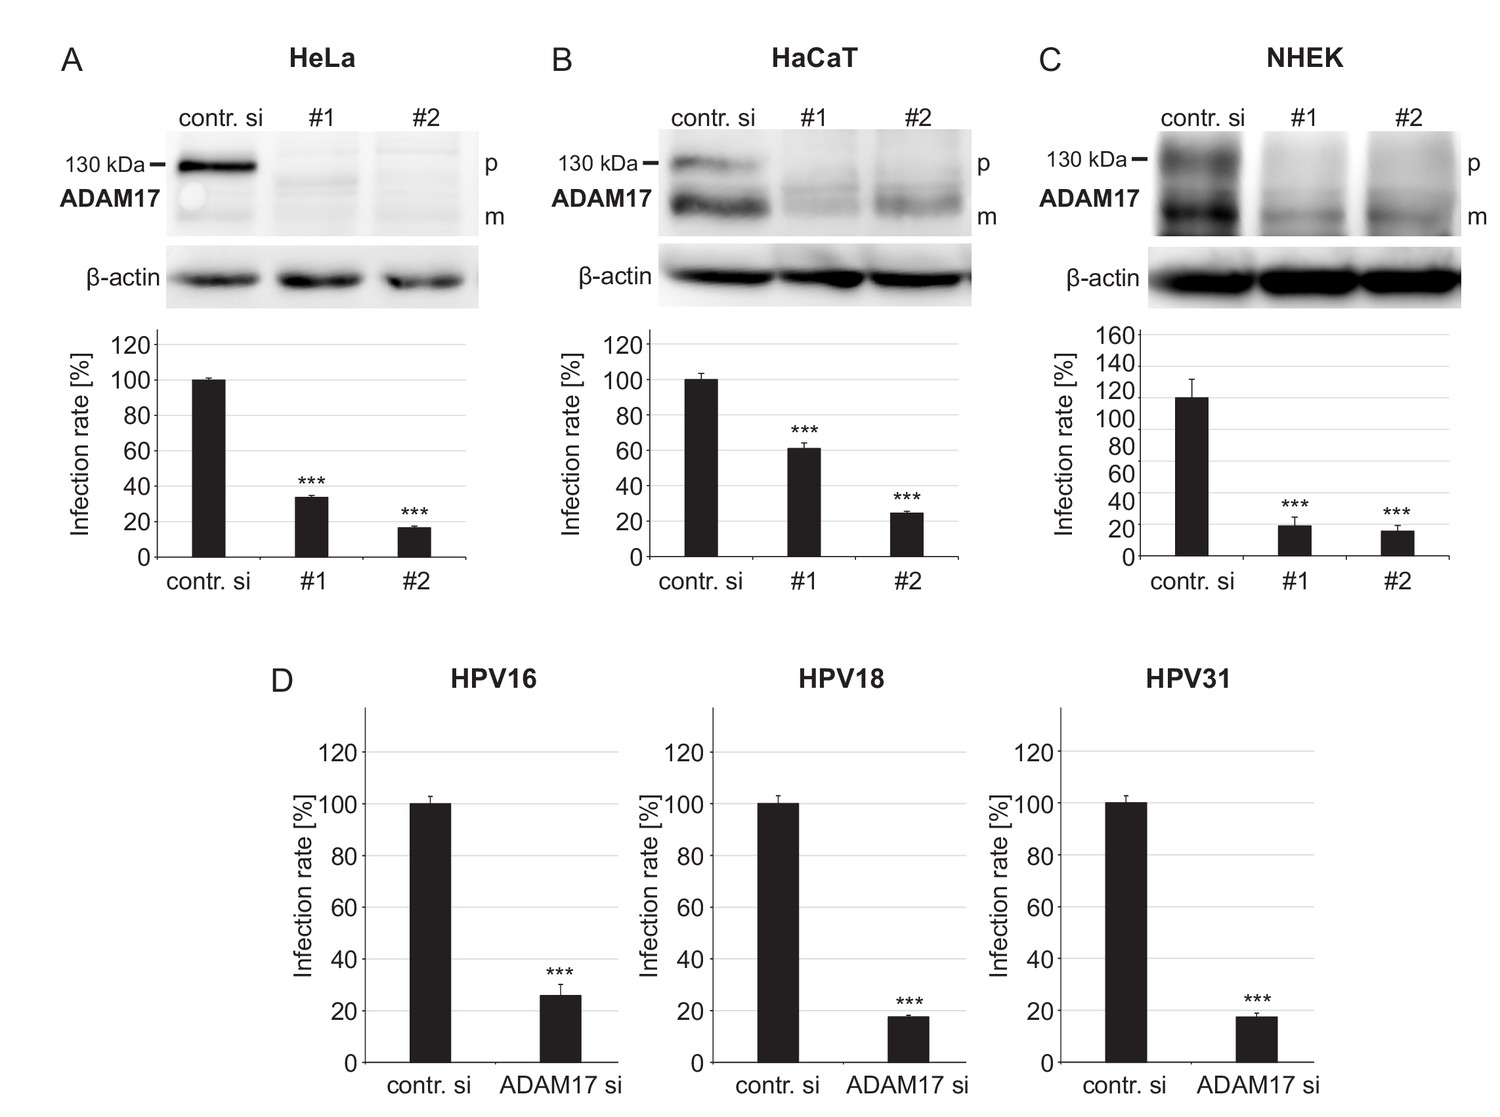
ADAM17 is required for HPV infection.
(A) HeLa, (B) HaCaT and (C) NHEK cells were treated with each one of two specific ADAM17 siRNAs and 48 hr later incubated with PsVs. Data obtained from HeLa cells (n = 9–10) were analyzed with two sample t-test: p=1.77E-12 (#1) and Welch two sample t-test: p=1.62E-09 (#2). HaCaT (n = 10); two-sample t-test: p=1.23E-07 (#1) and Welch two sample t-test: p=5.34E-10 (#2). NHEK (n = 8–13); Welch two sample t-test: p=1.07E-05 (#1) and p=7.35E-06 (#2). Upper panels, immunoblots for ADAM17 illustrating the efficiency of ADAM17 depletion (β-actin served as a loading control), whereas lower panels display the infection rate. Abbreviations: p and m indicate the premature and mature form of ADAM17, respectively. (D) HaCaT cells were depleted of ADAM17 applying a mixture of the two different pooled ADAM17-specific siRNAs (ADAM si) and 48 hr later infected with HPV16, HPV18 or HPV31 PsVs. Data for HPV16 (n = 9–10) and HPV31 (n = 10) were analyzed with two sample t-test: p=3.54E-11 and p=9.11E-16, respectively. Data for HPV18 (n = 10) with Welch two sample t-test: p=2.17E-10. (A)-(D) The values are given as mean ± SEM and the mean for control siRNA-treated cells (contr. si) was set to 100%. ADAM17-specific siRNAs have no effect on luciferase expression (Figure 1—figure supplement 2).
Figure 1—figure supplement 1
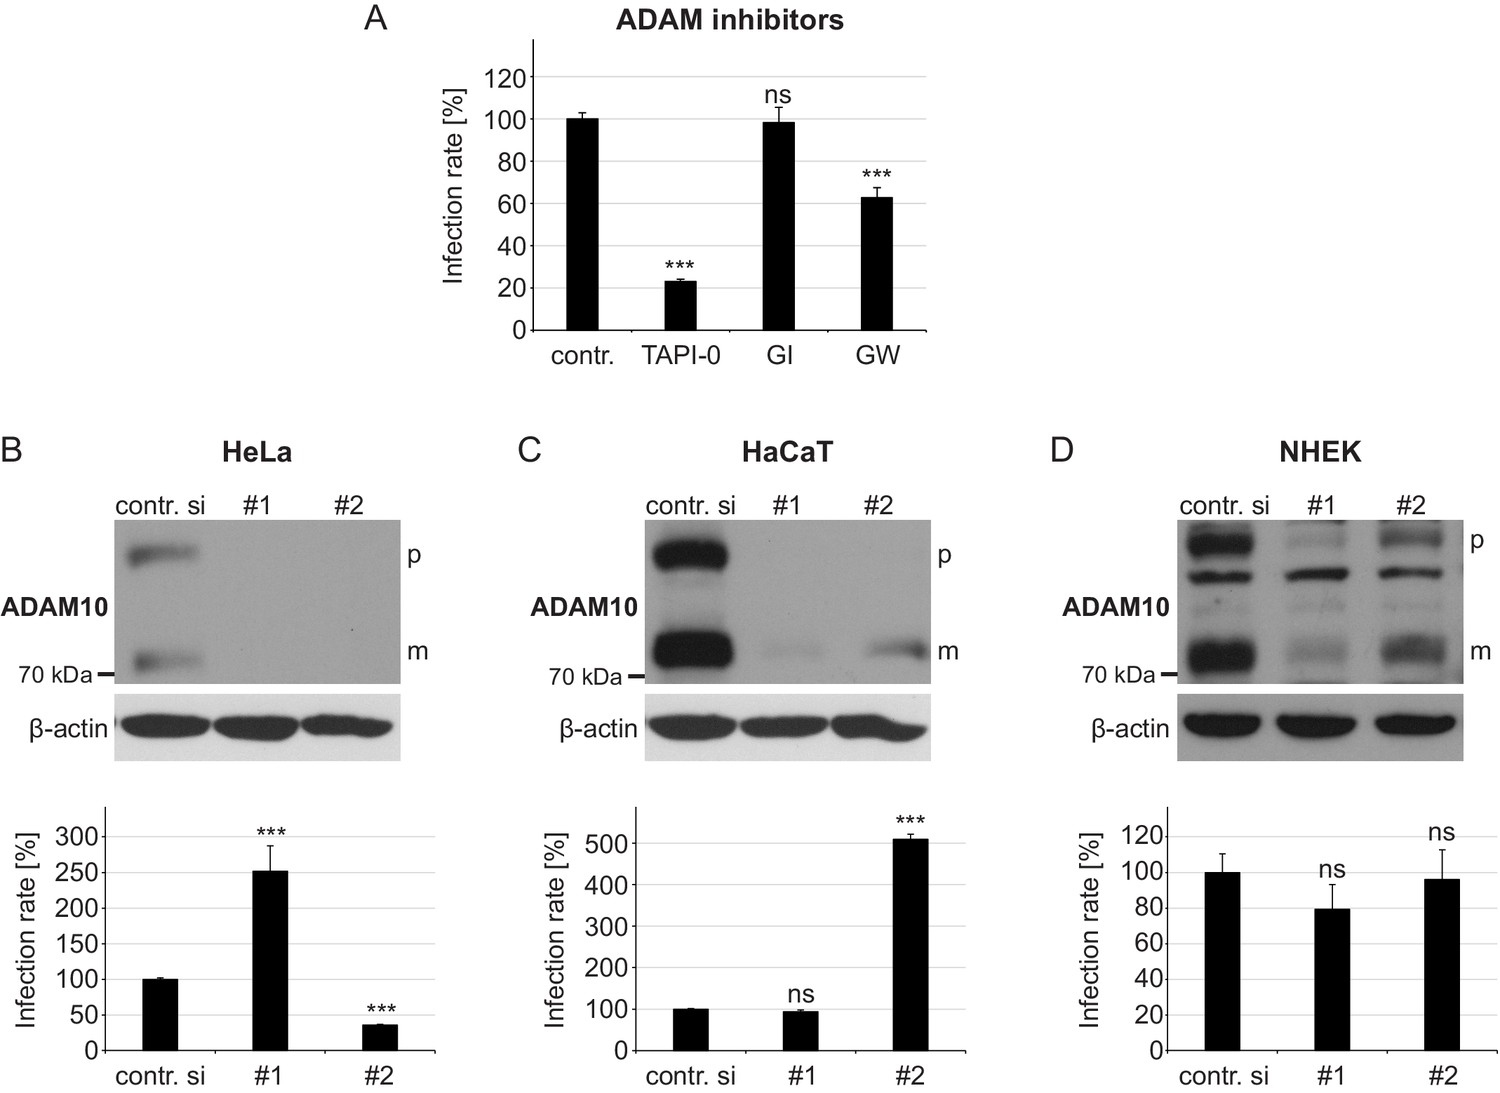
Effect of ADAM17 inhibitors and ADAM10 depletion on HPV16-mediated infection rate.
(A) HaCaT cells were pre-treated with DMSO as a control, TAPI-0, GI or GW inhibitor for 1 hr and afterwards incubated with PsVs. Luciferase activity was assessed 24 hr later and normalized by LDH measurements. Obtained data (n = 7–20) were statistically analyzed with Welch two sample t-test: p=2.20E-16 (TAPI-0), and two sample t-test: p=0.785 (GI) and 3.00E-08 (GW). Infection rate is given as mean ± SEM and the mean for DMSO-treated cells (contr.) was set to 100%. (B) HeLa, (C) HaCaT and (D) NHEK were treated with each one of two ADAM10-specific siRNAs and 48 hr later incubated with HPV16 PsVs. Infection rate was assessed 24 hr later. Data obtained from HeLa (n = 11) were analyzed with Wilcoxon rank sum test: p=2.84E-06 (#1) and Welch two sample t-test: p=3.77E-13 (#2). Data for HaCaT (n = 11) with Welch two sample t-test: p=0.2164 (#1) and Wilcoxon rank sum test: p=2.84E-06 (#2). NHEK (n = 11–12); Wilcoxon rank sum test: p=0.069 (#1) and p=0.413 (#2). Upper panels, immunoblots for illustrating the efficiency of ADAM10 depletion by western blot, whereas lower panels display assessed infection rate after the siRNA treatment. (B)-(D) Infection rate is given as a mean ± SEM and the mean for control siRNA-treated cells (contr. si) was set to 100%. β-actin served as a loading control. Abbreviations: p and m indicate premature and mature form of ADAM10, respectively.
Figure 1—figure supplement 2
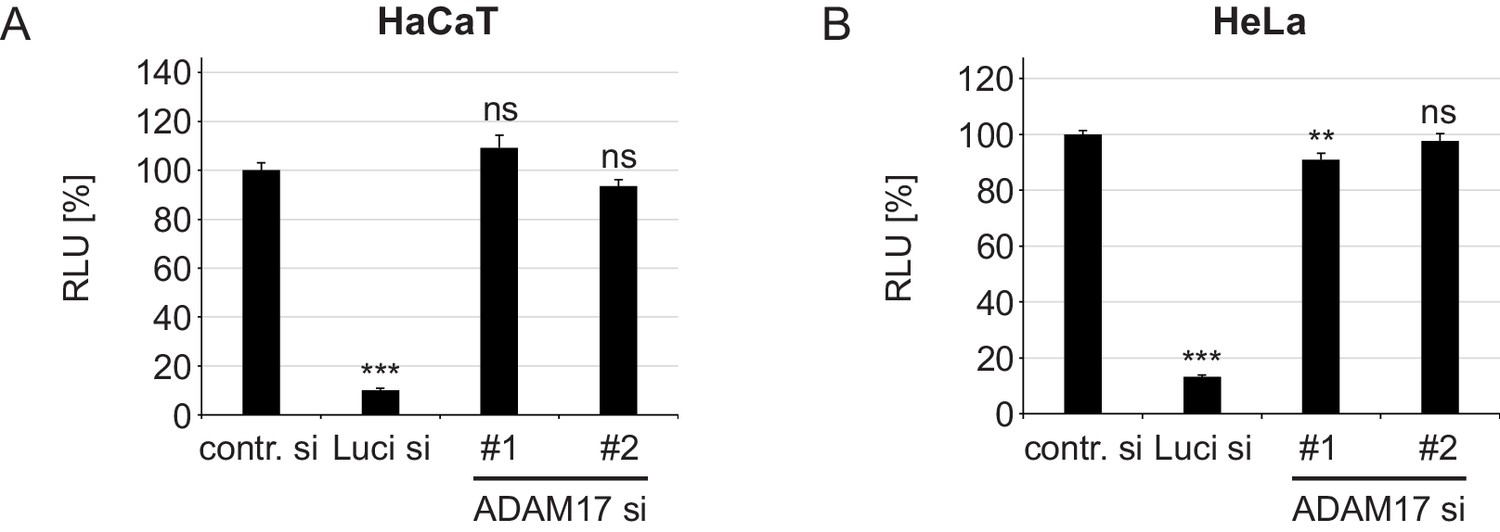
ADAM17-specific siRNAs have no effect on luciferase expression.
(A) HaCaT and (B) HeLa cells were transfected with a control, luciferase or target-specific siRNA, and the next day with luciferase expressing plasmid. Luciferase expression was assessed 24 hr later and is shown as a percentage of relative light units (RLU). When compared to contr. si, data for HaCaT (n = 8) were analyzed with Welch two sample t-test: p=2.11E-06 (Luci) and two sample t-test p=0.142 (ADAM17#1) and p=0.137 (ADAM17#2). HeLa samples (n = 8) were analyzed using two sample t-test: p=2.2E-16 (Luci), p=0.005 (ADAM17#1), p=0.453 (ADAM17#2). The RLU values are given as mean ± SEM and the mean for control siRNA-treated cells (contr.) was set to 100%.
Figure 2 with 4 supplements
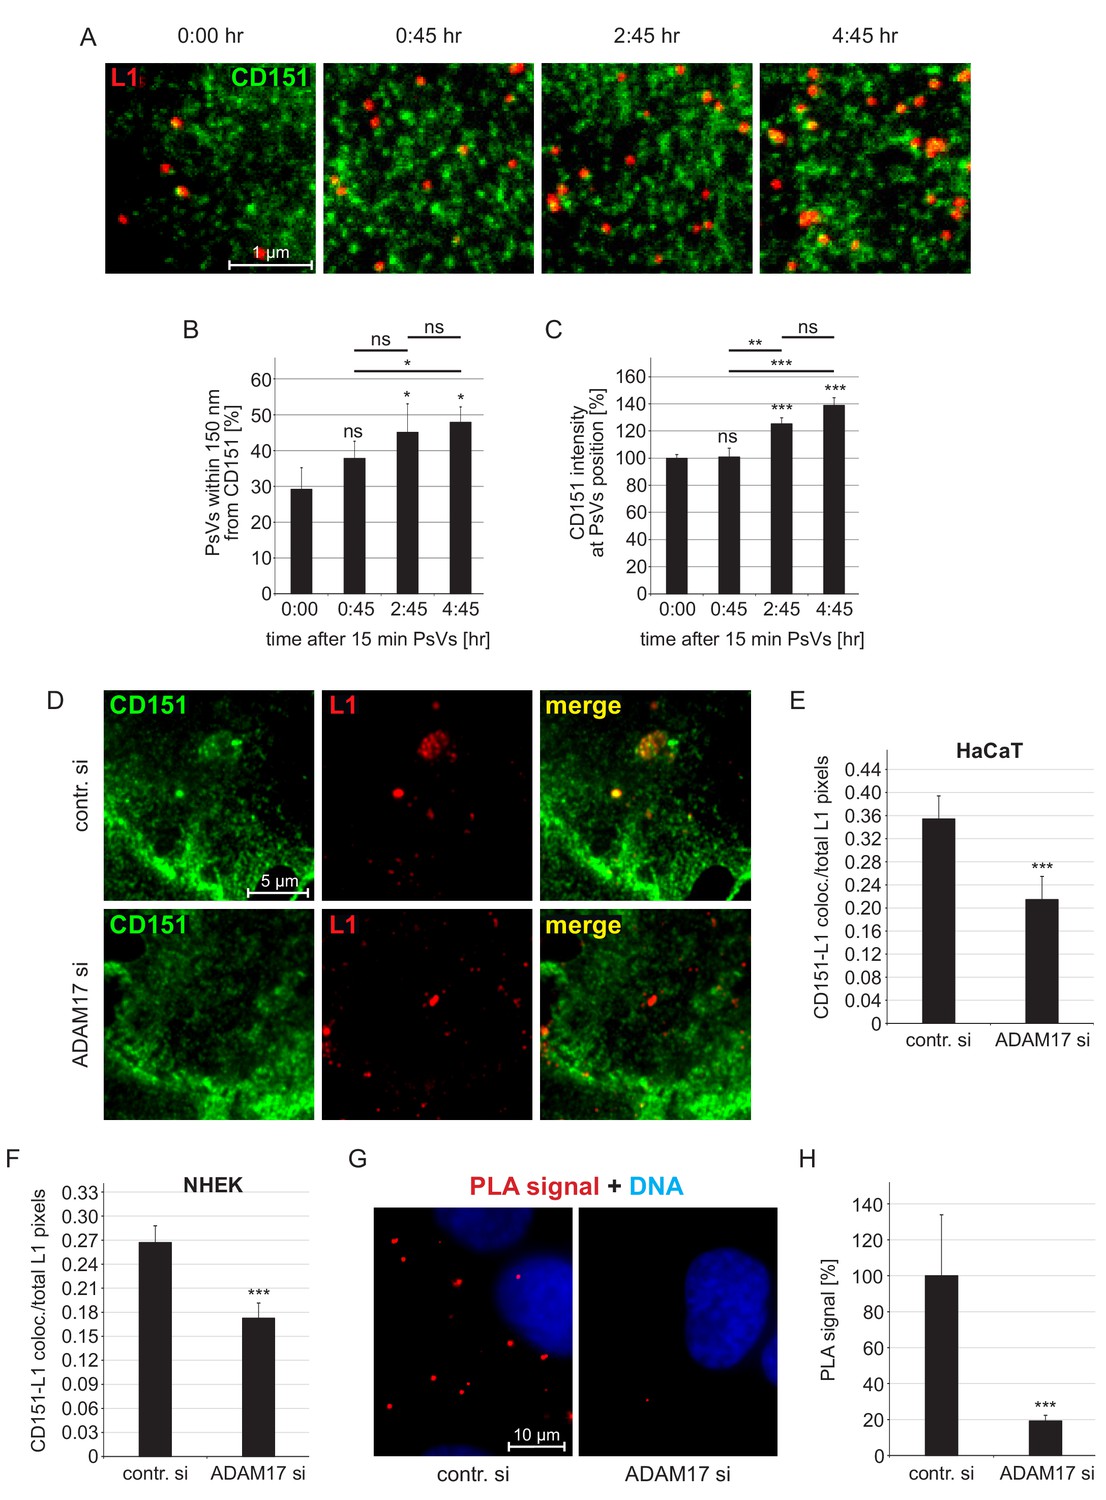
Association of HPV16 with CD151.
(A) HaCaT cells were incubated for 15 min with HPV16 PsVs, washed, and either directly fixed or after incubation for the indicated times. Then cells were stained with anti-CD151 mAb 11G5A (green) and anti-L1 pAb K75 (red) antibodies and analyzed by superresolution STED microscopy. Representative STED-images for the different time points are shown. From the STED micrographs, we determined the distance of a PsV to its next nearest CD151 cluster and the local intensity of CD151 at the PsV position. (B) Increase of the fraction of HPV16 PsVs that are closer than 150 nm to the next CD151 nano-cluster. Statistical significance (n=3) was analyzed with paired t-test: p=0.091 (0:45), p=0.021 (2:45), p=0.017 (4:45), difference between 0:45 and 2:45: p=0.276, between 0:45 and 4:45: p=0.011 and 2:45 and 4:45: p=0.617. Values for every sample were expressed as percentage of the total number of PsVs in the given sample. (C) The CD151 intensity at the HPV16 PsV position increases over time. Data (60–65 cells per condition) were analyzed with Wilcoxon rank sum test: p=0.974 (0:45), p=2.53E-08 (4:45), difference between 0:45 and 2:45: p=4.86E-03, between 0:45 and 4:45: p=3.02E-04 and 2:45 and 4:45: p=0.290, and with Welch two sample t-test: p=5.20E-06 (2:45). 15 min time point (0:00) was normalized to 100%. (D) HaCaT cells were incubated for 15 min with PsVs, washed, incubated for another 4:45 hr, fixed and incubated with primary antibodies as in (A). Representative images are shown of control siRNA- (upper panel) or ADAM17 siRNA- (lower panel) treated cells. (E, F) Quantification of the spatial overlap between CD151 and L1 in HaCaTs (E) or in NHEK cells (F). The values obtained from the ratio of CD151-L1 colocalizing to total L1 pixels of control siRNA-treated cells (contr. si) were normalized to 100%. Data for HaCaTs (n = 111–129) were analyzed using Wilcoxon rank sum test: p=4.33E-04. NHEKs (n = 180–187); Wilcoxon rank sum test: p=1.75E-05. (G) HaCaT control or ADAM17 siRNA-treated cells were incubated with HPV16 PsVs for 5 hr, fixed, and processed for PLA detection using primary antibodies as in (A). Shown is the CD151-L1 PLA signal. (H) The ratio of PLA positive signal (red) to nuclear signal (blue) is for contr. si set to 100%. Data (n = 104–115 images) were analyzed using Wilcoxon rank sum test: p=5.77E-10. All values are given as mean ± SEM.
Figure 2—figure supplement 1

Time course of CD151-L1 colocalization.
HaCaT cells were incubated with HPV16 PsVs for 15 min at 4°C, washed, fixed at different time points (as indicated), and stained with anti-CD151 mAb 11G5A and anti-L1 pAb K75 antibodies and analyzed as in Figure 2E. Shown is the ratio of CD151-L1 colocalizing to total L1 pixels. Data (n = 139–163 randomly chosen fields) were analyzed with Wilcoxon rank sum test. For different time points compared to 0:00 hr (control): p=1.44E-04 (0:45 hr), p=3.08E-11 (2:45 hr) and p=2.20E-16 (4:45 hr); difference between 0:45 hr and 2:45 hr: p=6.86E-04, 0:45 hr and 4:45 hr: p=7.12E-08 and 2:45 hr and 4:45 hr: p=0.136. All values are given as mean ± SEM.
Figure 2—figure supplement 2
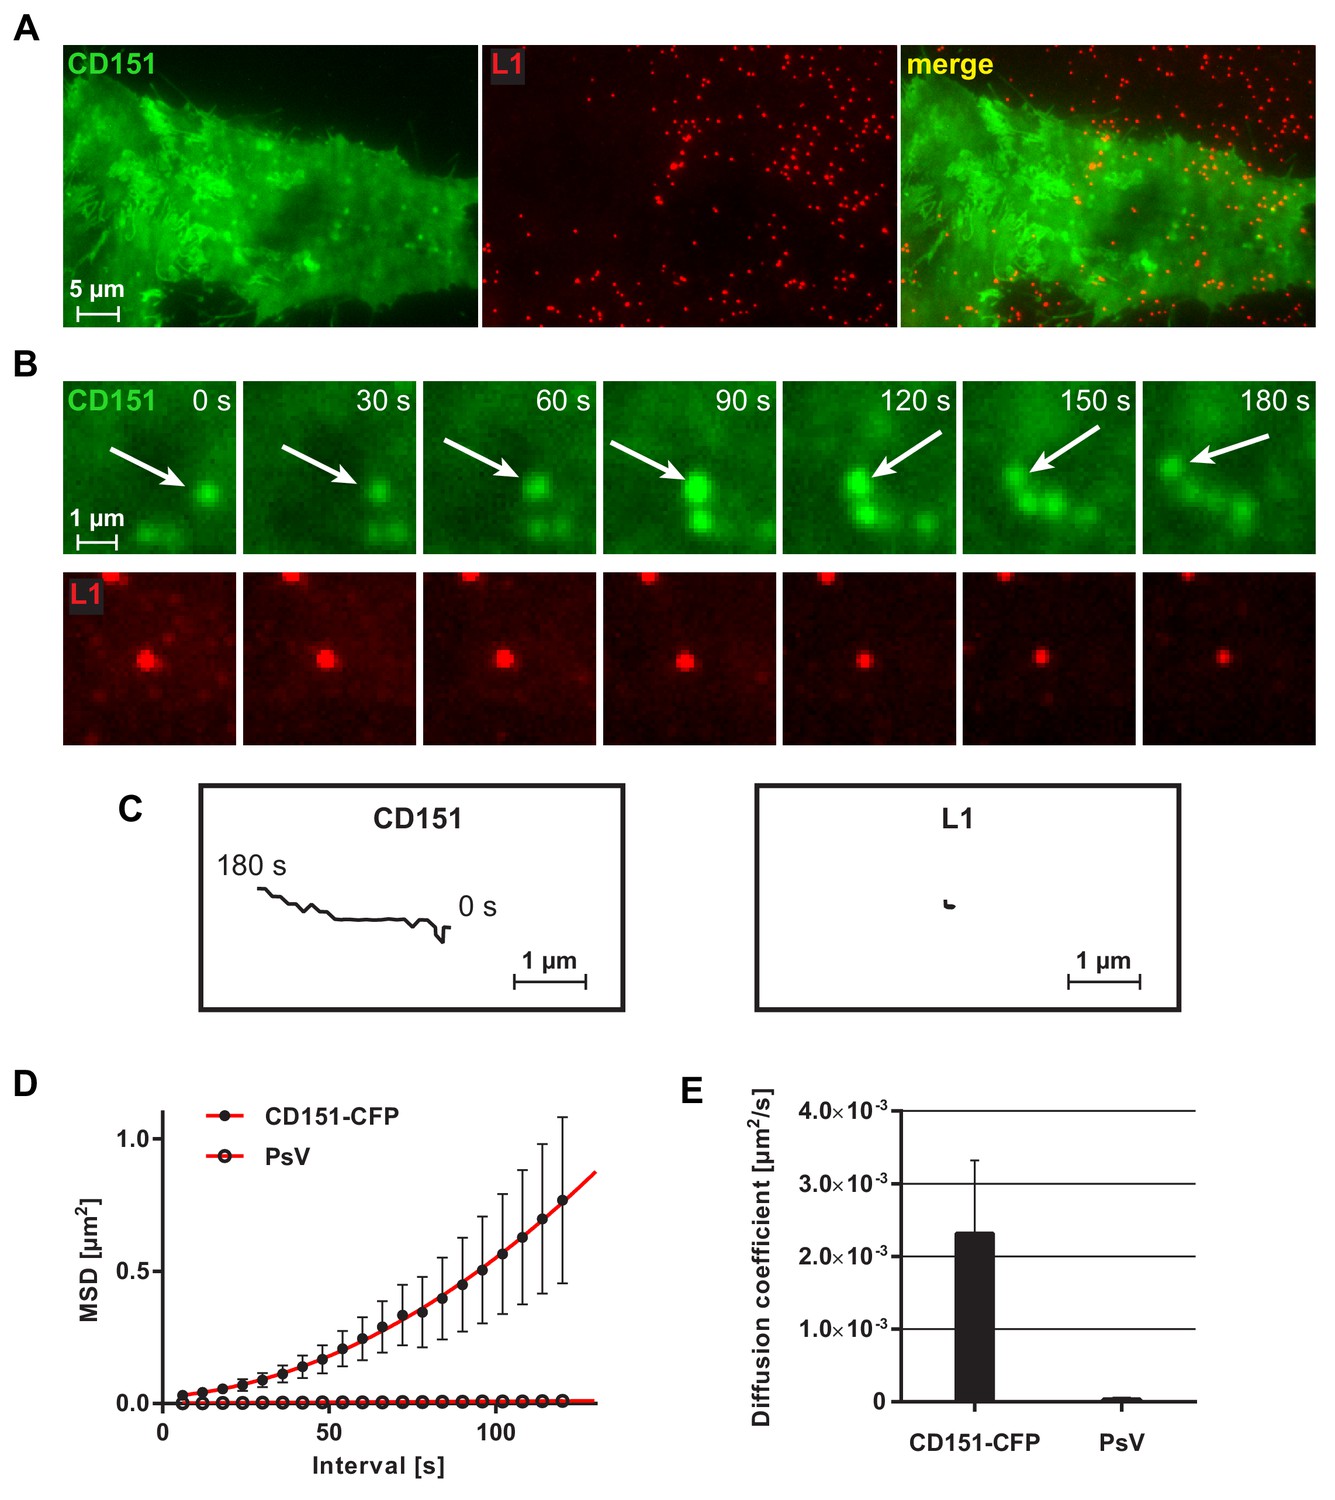
Viral particle mobility analyzed by TIRF microscopy.
For the analysis, five movies were analyzed published in part already in Scheffer et al. (2013). HeLa cells were tranfected with CD151-CFP (shown in green) and incubated with Alexa Fluor 488 (AF488)-labeled HPV16 pseudovirions (shown in red) for 1.5–4 hr, followed by imaging for 3 min at 0.166 Hz employing TIRF microscopy. (A) Overview from the two channels and overlay. The CD151 cluster pattern is not well resolved due to diffraction-limited resolution. (B) Magnified views (upper and lower rows are not the same field of view). Images taken from a 180 s sequence show the lateral mobility of a CD151-CFP particle (upper row) and PsV particle (lower row). Spherical CD151 structures often move directional. (C) Tracks of the object marked with an arrow in (B) and the centered viral particle in (B). (D) Mean squared displacement (MSD) plotted against time interval (n = 14–15 particles per channel) for CD151-CFP and PsV particles, respectively. (E) Diffusion coefficients for CD151-CFP and PsV particles. Statistical significance (n = 14–15 particles per channel) was analyzed with Wilcoxon rank sum test: p=5.89E-03. All values are given as means ± SEM.
Figure 2—figure supplement 3
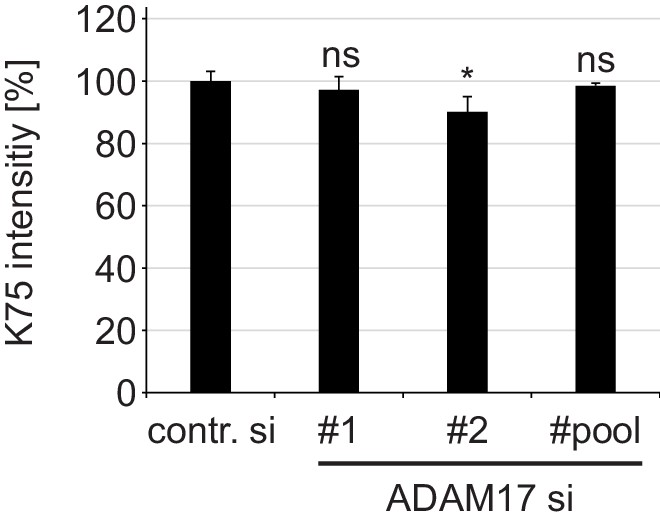
ADAM17 plays no role in cell surface binding of HPV16 PsVs.
HaCaT cells were depleted of ADAM17 applying ADAM17-specific siRNAs or a mixture of the two different siRNAs (pool) and 48 hr later incubated with HPV16 PsVs for 1 hr at 4°C. Cell-bound PsVs were detected by flow cytometry employing anti-L1 pAb K75. Obtained data (n = 6–9) were analyzed with Wilcoxon rank sum test: p=0.546 (ADAM17#1), p=0.031 (ADAM17#2) and p=0.181 (ADAM17#pool). K75 intensity is shown as a percentage and the mean for control siRNA-treated cells (contr. si) was set to 100%. All values are given as means ± SEM.
Figure 2—figure supplement 4
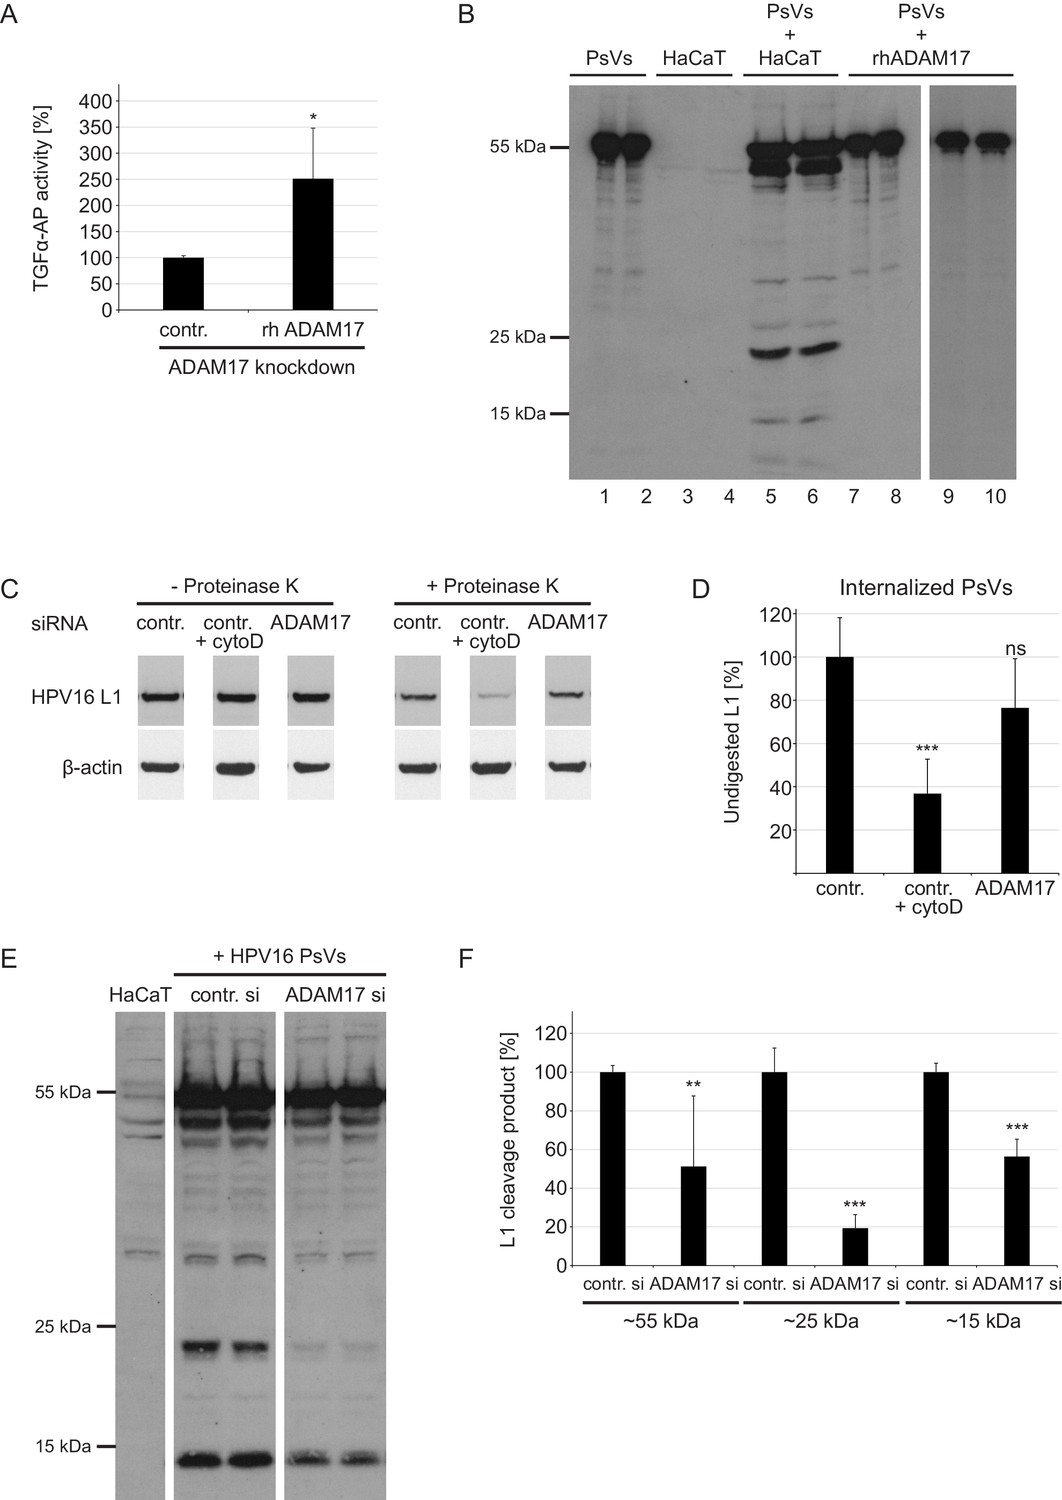
ADAM17 does not cleave major capsid protein L1 nor affects HPV16 internalization rate but priming/processing of the L1 protein in an indirect manner.
(A) Recombinant ADAM17 mediates the release of TGF-α. HeLas were treated with ADAM17-specific siRNA, 24 hr later transfected with alkaline phosphatase-tagged TGF-α plasmid and the next day either treated with rhADAM17 or left non-treated, and incubated for 3 hr at 37°C. Data (n = 3–5) were analyzed with Wilcoxon rank sum test: p=0.036. The release of transfected AP-tagged TGF-α, used as readout for ADAM17 activity, is shown as a percentage and the mean for rhADAM17-non-treated cells was set to 100%. (B) PsVs (lanes 1 and 2) and PsVs-non-exposed HaCaTs (lanes 3 and 4) served as a negative controls for detection of non-specific L1 proteolytic products (lanes 3 and 4). HaCaT cells exposed to PsVs for 24 hr served as a positive control for specific L1 products (lanes 5 and 6). A mixture of HPV16 PsVs and rhADAM17 (1.25 ng/µl of rhADAM17 for lanes 7 and 8, and 7.5 ng/µl for lanes 9 and 10, respectively) was prepared in the recommended assay buffer, incubated for 24 hr and lysed in SDS sample buffer. L1 cleavage products were detected with mAbs 312F and 33L1-7, and pAb K75. (C) Control (contr.) or ADAM17 siRNA-transfected HaCaT cells were exposed to HPV16 PsV for 24 hr. Non-internalized viral particles were removed by proteinase K digestion (+Proteinase K) and internalized particles were analyzed by western blotting using L1-specific mAb 312F. Cytohalasin D (Cyto D) was used as a control for inhibited endocytosis. (D) Percentage of undigested L1 protein was determined by densitometrical quantification of relative band intensities recorded on western blot shown in (C). L1 level upon proteinase K digestion (+Proteinase K) was normalized to the L1 input (- Proteinase K), after both were normalized to the β-actin (loading control). Data (n = 6) were analyzed with two sample t-test: p=0.075 (contr. +Cyto D) and p=7.72E-05 (ADAM17). The L1 expression level in control siRNA-treated cells (contr.) was set to 100% ± SEM. (E) HaCaTs were transfected with control or a mixture of two ADAM17 siRNAs, 48 hr later treated with HPV16 PsVs, afterwards intensively washed and lysed 24 hr later. L1 cleavage products were detected using antibodies as in (A). (F) Densitometric quantification of different L1 cleavage products presented in (E). Data (n = 6) for bands corresponding to the 55 kDa were analyzed using Wilcoxon rank sum test: p=0.002. Data for bands corresponding to 25 kDa were analyzed with two sample t-test: p=7.68E-05 and for 15 kDa: p=9.34E-04. The values are given as mean ± SEM and the mean for each of the cleavage products in control siRNA-treated cells was set to 100%.
Figure 3
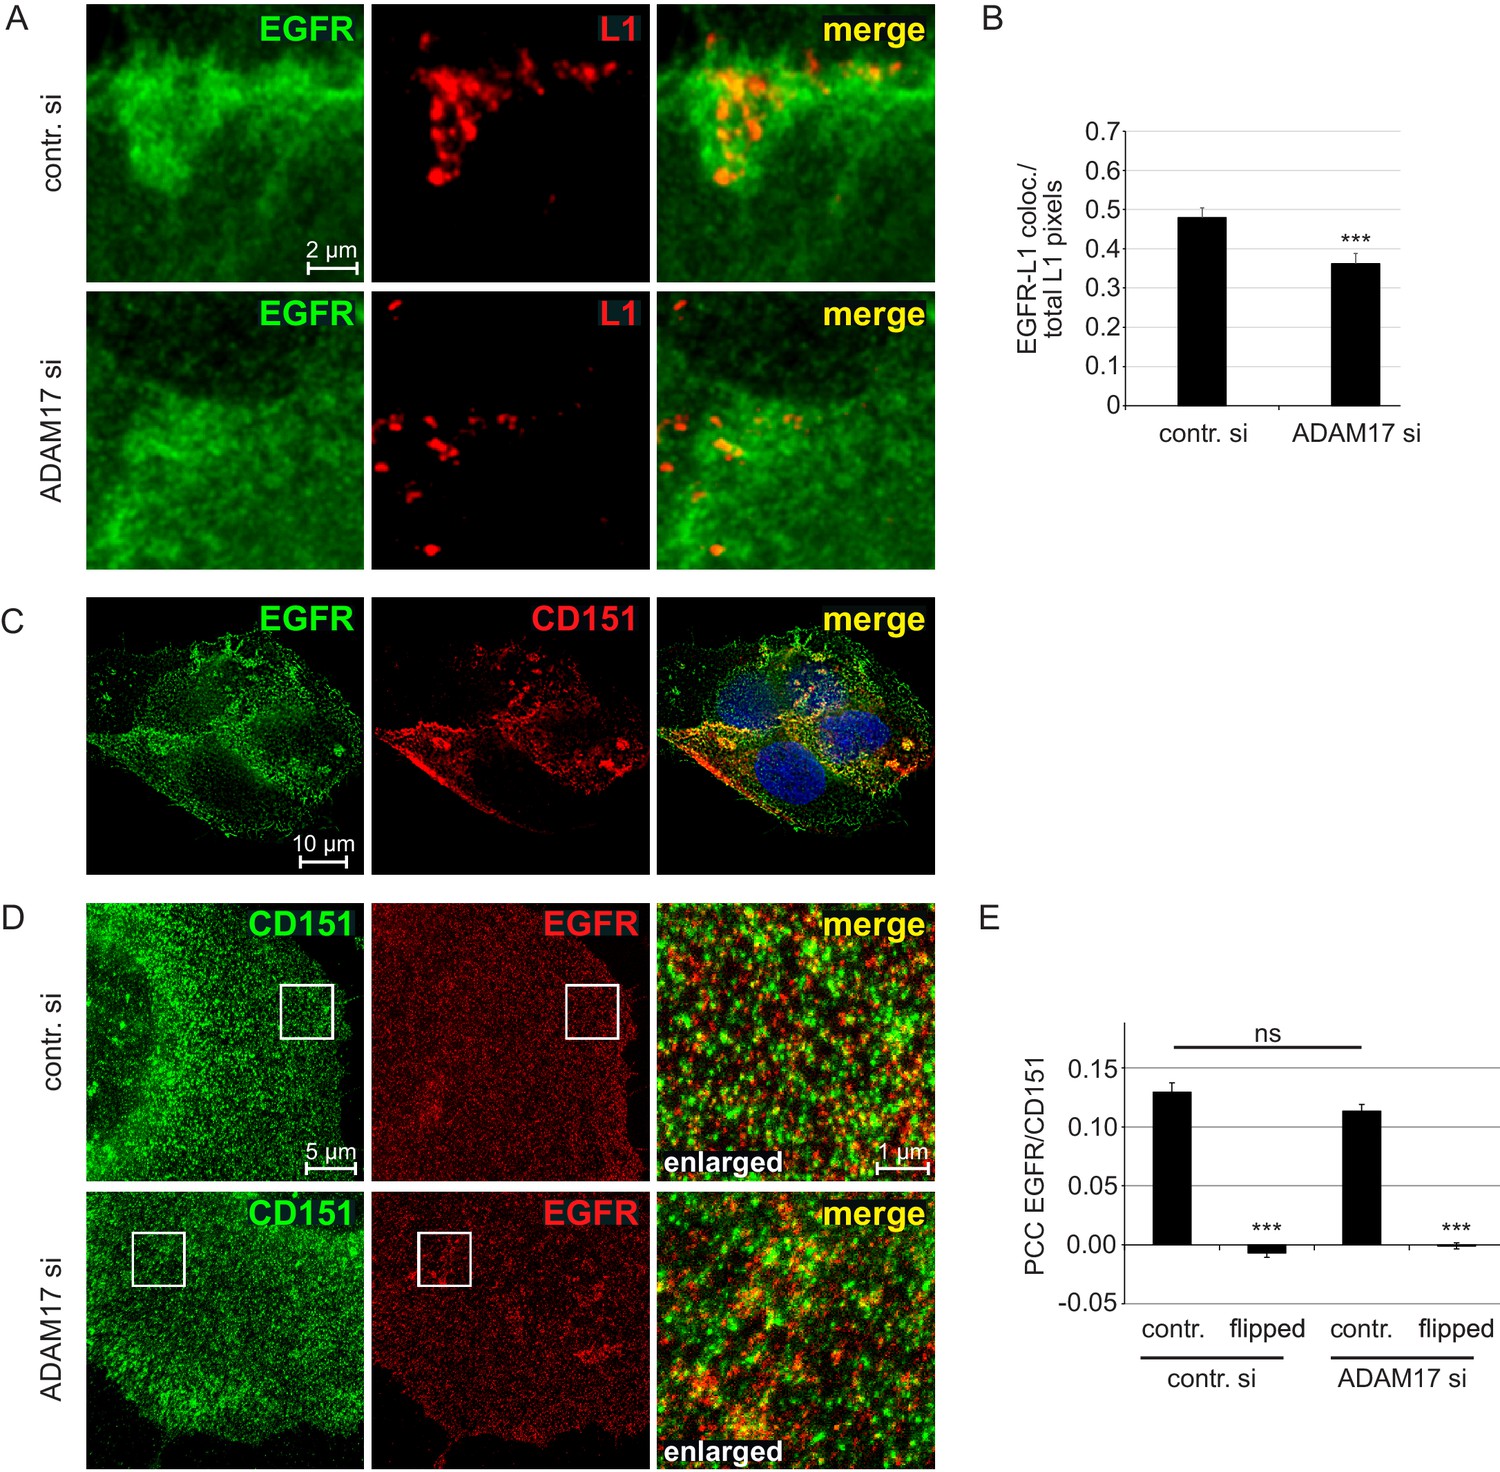
EGFR as a component of the HPV entry receptor complex.
(A, B) ADAM17 depletion reduces EGFR-L1 association. (A) Representative images of HaCaT cells treated with control or ADAM17-specific siRNA for 48 hr, exposed to HPV16 PsVs for 5 hr, and subsequently stained with EGFR-specific D38B1 (green) and L1-specific 312 F (red) antibodies. (B) Quantification of the pixel overlap from the stainings shown in (A). Data for HaCaTs (n = 158–176 randomly chosen fields) were analyzed using Wilcoxon rank sum test: p=5.90E-04. (C) EGFR-CD151 association analyzed by fluorescence microscopy. Shown is a deconvoluted image of a HaCaT cells double stained with antibodies specific for EGFR (D38B1) and CD151 (11G5A). EGFR is shown in green, CD151 in red and nuclei in blue. (D) EGFR-CD151 overlap analyzed by superresolution microscopy. Representative images of control or ADAM17 depleted HaCaT cells, exposed to HPV16 PsVs for 5 hr, stained with the same primary antibodies as in (C) but CD151 is shown in green and EGFR in red, and analyzed by STED microscopy. (E) Pearson’s correlation coefficient (PCC) of staining shown in (D) indicate specific overlap of EGFR and CD151. For the quantification of random overlap, we flipped one image horizontally and vertically to randomize the distribution. Data (n = 60 randomly chosen fields) for each siRNA was compared to control (contr. si) and analyzed using Wilcoxon rank sum test: p<2.20E-16. The difference between contr. and ADAM17 siRNA was not significant (p=0.239). The values for all experiments are given as mean ± SEM.
Figure 4 with 1 supplement

ADAM17 is required for internalization of large CD151 clusters.
(A) Representative images of membrane sheets generated from HaCaT cells stained for CD151 with 11G5A mAb (green) and HPV16 L1 with K75 pAb (red). Shown are membrane sheets generated from control siRNA (upper and middle row) and ADAM17 siRNA (lower row) transfected cells that were incubated for 5 hr without (upper row) or with PsVs (middle and lower row). (B) HPV16 treatment diminishes CD151 cluster size, an effect that is abolished upon ADAM17 depletion. ADAM17+/PsVs + was compared to the two other conditions and analyzed with Wilcoxon rank sum test: p=3.10E-04 (for ADAM17+/PsVs-) and p=7.01E-09 (for ADAM17-/PsVs+). (C) HPV16 treatment diminishes the CD151 surface level, an effect that is abolished upon ADAM17 depletion. Statistical analysis was performed comparing to the condition ADAM17+/PsVs + and analyzed with Welch two sample t-test: p=4.16E-05 (for ADAM17+/PsVs-) and two sample t-test: p=2.21E-07 (for ADAM17-/PsVs+). For (B) and (C) (n = 60), membrane sheets for each condition were collected from three biological replicates. Values are given as mean ± SEM. The condition ADAM17+/PsVs- was set to 100%.
Figure 4—figure supplement 1
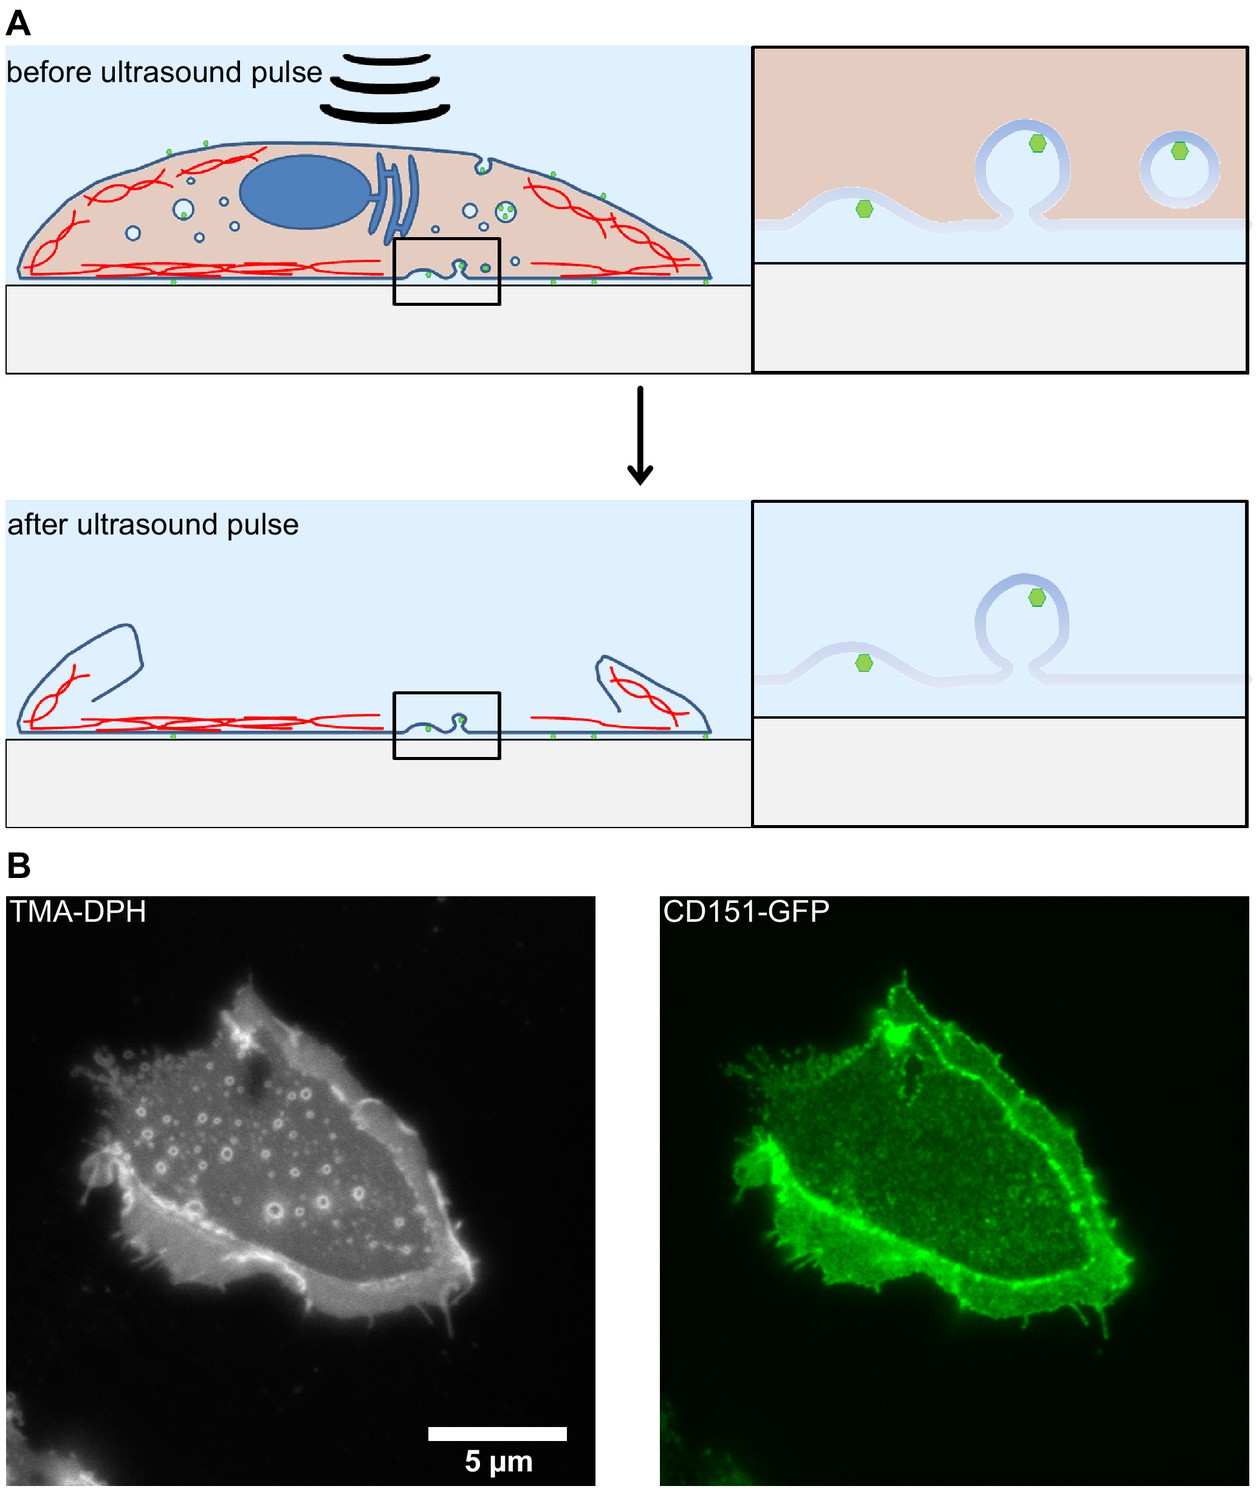
Illustration of the membrane sheet preparation.
HaCaT cells were detached and transfected with CD151-GFP (Scheffer et al., 2013) using the Gene pulser Xcell electroporation system (Bio-Rad, Hercules, CA) employing the settings 200 V, 950 μF and 200 Ω. Cells were plated onto poly-Lysine glass-coverslips and after 24 hr membrane sheets were generated applying 100 ms ultrasound sonication pulses at different coverslip locations. The sample was directly fixed using 4% PFA and quenched with 50 mM NH4Cl. The sample was blocked with 3% BSA in PBS, washed and imaged in PBS containing 1-(4-tri-methyl-ammonium-phenyl)−6-phenyl-1,3,5-hexatriene p-toluene-sulfonate (TMA-DPH, cat# T-204, Invitrogen) for the visualization of membranes. Imaging was performed using an Olympus IX81 fluorescence microscope essentially as previously described (Homsi et al., 2014). (A) By applying an ultrasound pulse, the apical membrane and cytosolic structures are ripped off leaving behind the basolateral membrane. Intracellular compartments and cytosolic content are removed. Only membrane bound invaginations, cytoskeletal elements and other membrane-anchored structures remain. (B) Exemplary image of a plasma membrane sheet. The left panel shows membrane staining by TMA-DPH. The right panel shows overexpressed CD151-GFP. Please note that at the edges double membranes are visible. For this reason, analysis is performed on central areas of the plasma membrane sheets.
Figure 5
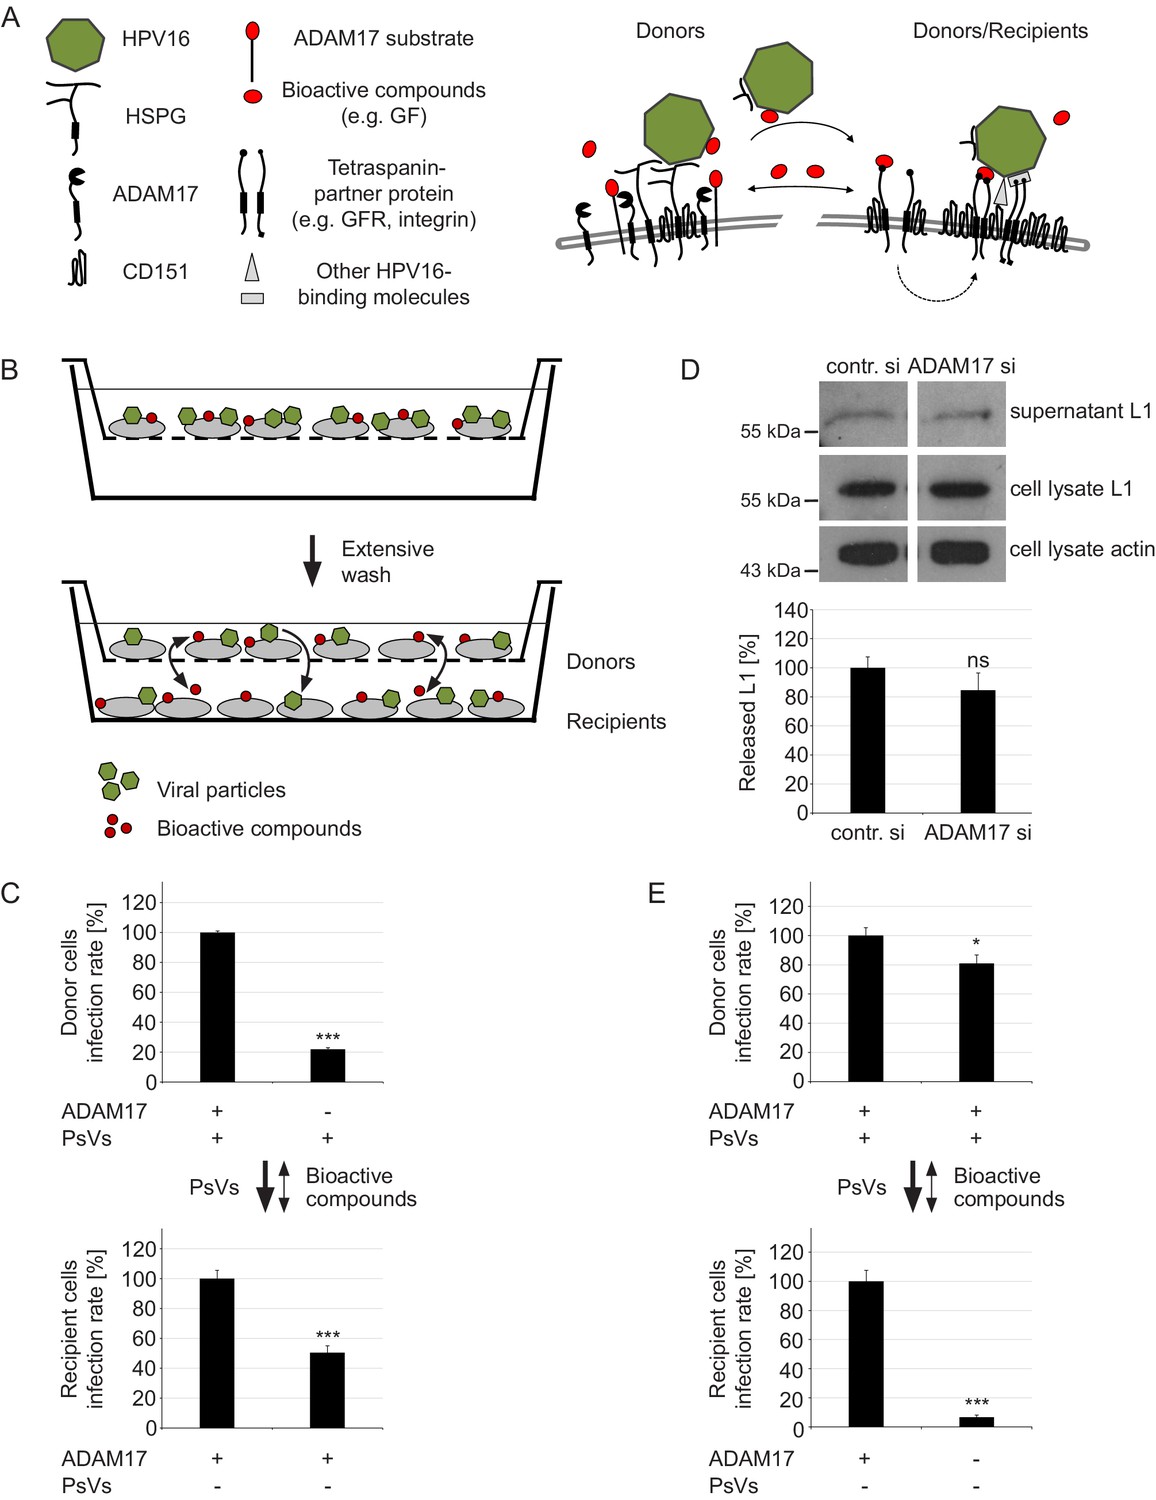
ADAM17 acts by the release of bioactive compounds.
(A) Two-step model of virus entry platform formation. Initially, the virus (green) binds to a primary complex (left) from which it is transferred to or transformed into a secondary receptor entry complex (right). Cells exchange bioactive molecules (red) in both directions. (B) Schematic illustration of the “donor“ cell - “recipient“ cell co-culture system. Donor cells cultured in inserts were incubated with PsVs, washed and placed above recipient cells. Black arrows indicate transfer of PsVs and bioactive compounds between the donor and recipient cells. (C) Donor cells were transfected with control or ADAM17 siRNA and 48 hr later incubated with PsVs for 1 hr to allow virus binding. Next, cells were intensively washed, placed on top of siRNA-non-treated and PsVs-non-exposed recipients and incubated for another 24 hr. Relative infection rates obtained for donor cells (n = 11–13) were analyzed using Welch two sample t-test: p=4.81E-04 and for recipients (n = 12) with two sample t-test: p=5.34E-04. (D) HaCaT cells were depleted of ADAM17 and 48 hr later incubated with HPV16 PsVs for 15 min. Next, the cells were thoroughly washed, incubated for another 4 hr, and finally L1 was assessed by western blot using L1-specific Ab 312F (upper panel). Shown is a percentage of the L1 band intensity and represents the amount of the total L1 protein in the supernatant (lower panel). Data (n = 7–8) were analyzed using Wilcoxon rank sum test: p=0.536. Detection of L1 and β-actin in the cell lysate served as controls. The values are given as mean ± SEM and the mean for control siRNA-treated cells (contr. si) was set to 100%. (E) Recipient cells were transfected with control or ADAM17 siRNA. After 48 hr siRNA-non-treated donor cells were allowed to bind PsVs for 1 hr, intensively washed, placed on top of siRNA-treated and PsVs-non-exposed recipient cells and incubated for another 24 hr. Data for donor cells (n = 12) were analyzed with two sample t-test: p=0.025 and for recipients (n = 11–12) with Welch two sample t-test: p=1.36E-07. For (C) and (E) infection rate of donor (upper panel) and recipient (lower panel) cells is displayed as a percentage. The values are given as mean ± SEM and the mean for control siRNA-treated cells was set to 100% for donors and recipients. Symbols: + and – denote presence or absence of ADAM17 protein or PsVs, respectively.
Figure 6 with 1 supplement

EGFR is a proviral factor in HPV16 entry (A) and soluble EGF relieves the effect of ADAM17 depletion on the phosphorylation status of ERK1/2 (B, C), HPV16 PsVs infection rate (D) and HPV16-CD151 proximity (E, F).
(A) EGFR blocking-antibody Cetuximab decreases HPV16 PsVs infection rate. HaCaT cells were pre-incubated with stated concentrations (µg/ml) of Cetuximab for 1 hr, infected with HPV16 PsVs and 24 hr later luciferase counts were measured. Samples (n = 8) were analyzed using two sample t-test: p=3.67E-08 (1 µg/ml), and Welch two sample t-test: p=4.42E-06 (10 µg/ml) and p=6.76E-07 (30 µg/ml). Infection rate is given as mean ± SEM and the mean for control-treated cells (contr.) was set to 100%. (B) HaCaT cells were depleted of ADAM17 for 48 hr. Next, cells were starved for 1 hr in medium without FCS, either left non-treated or treated with EGF (20 ng/ml) for 5 min, and incubated with HPV16 PsVs for 5 min. Western blots show phosphorylated and total ERK1 and 2 for the indicated conditions; α-tubulin was used as a loading control. (C) The amount of phosphorylated ERK1 (black) and ERK2 (gray) is shown as a ratio of phosphorylated to total ERK form. Data for ERK1 (n = 8–9) compared to the corresponding ERK1 of the contr. si were analyzed with two sample t-test: p=3.85E-08 (ADAM17 si) and Welch two sample t-test: p=1.73E-05 (ADAM17 si + EGF), and the difference between ADAM17 si and ADAM17 si + EGF: p=3.15E-06. Data for ERK2 (n = 9) when compared to the corresponding ERK2 of control siRNA-treated cells (contr. si); Welch two sample t-test: p=1.61E-06 (ADAM17 si) and p=1.13E-03 (ADAM17 si + EGF), and the difference between ADAM17 si and ADAM17 si + EGF: p=2.62E-05. The values are given as mean ± SEM and the mean for contr. si was set to 100%. (D) Infection assay after EGF reconstitution. HaCaT cells were transfected with control (left panel) or ADAM17 siRNA (right panel) for 48 hr, left non-treated or treated with EGF (20 ng/ml) and infected with HPV16 PsVs. Samples shown on the left panel (n = 7) were analyzed using Wilcoxon rank sum test: p=2.33E-03 and on the right panel (n = 9) with two sample t-test: p=1.30E-06. Infection rate (in %) is given as mean ± SEM and the mean of EGF-non-treated control siRNA-treated cells was normalized to 100%. Because of simplicity, the data is shown in separate graphs (panels). (E) Shown is specific CD151-L1 PLA signal (red). HaCaT cells were depleted of ADAM17 and either left non-treated, or pre-treated with EGF (20 ng/ml) for 5 min and afterwards incubated with PsVs for 5 hr. (F) The ratio of PLA-positive signal (red) to nuclear signal (blue) (in %) is given as mean ± SEM. and the mean was normalized to EGF-non-treated control cells (shown in Figure 2G). Data (n = 128–152 images) were analyzed using Wilcoxon rank sum test: p=7.97E-06.
Figure 6—figure supplement 1
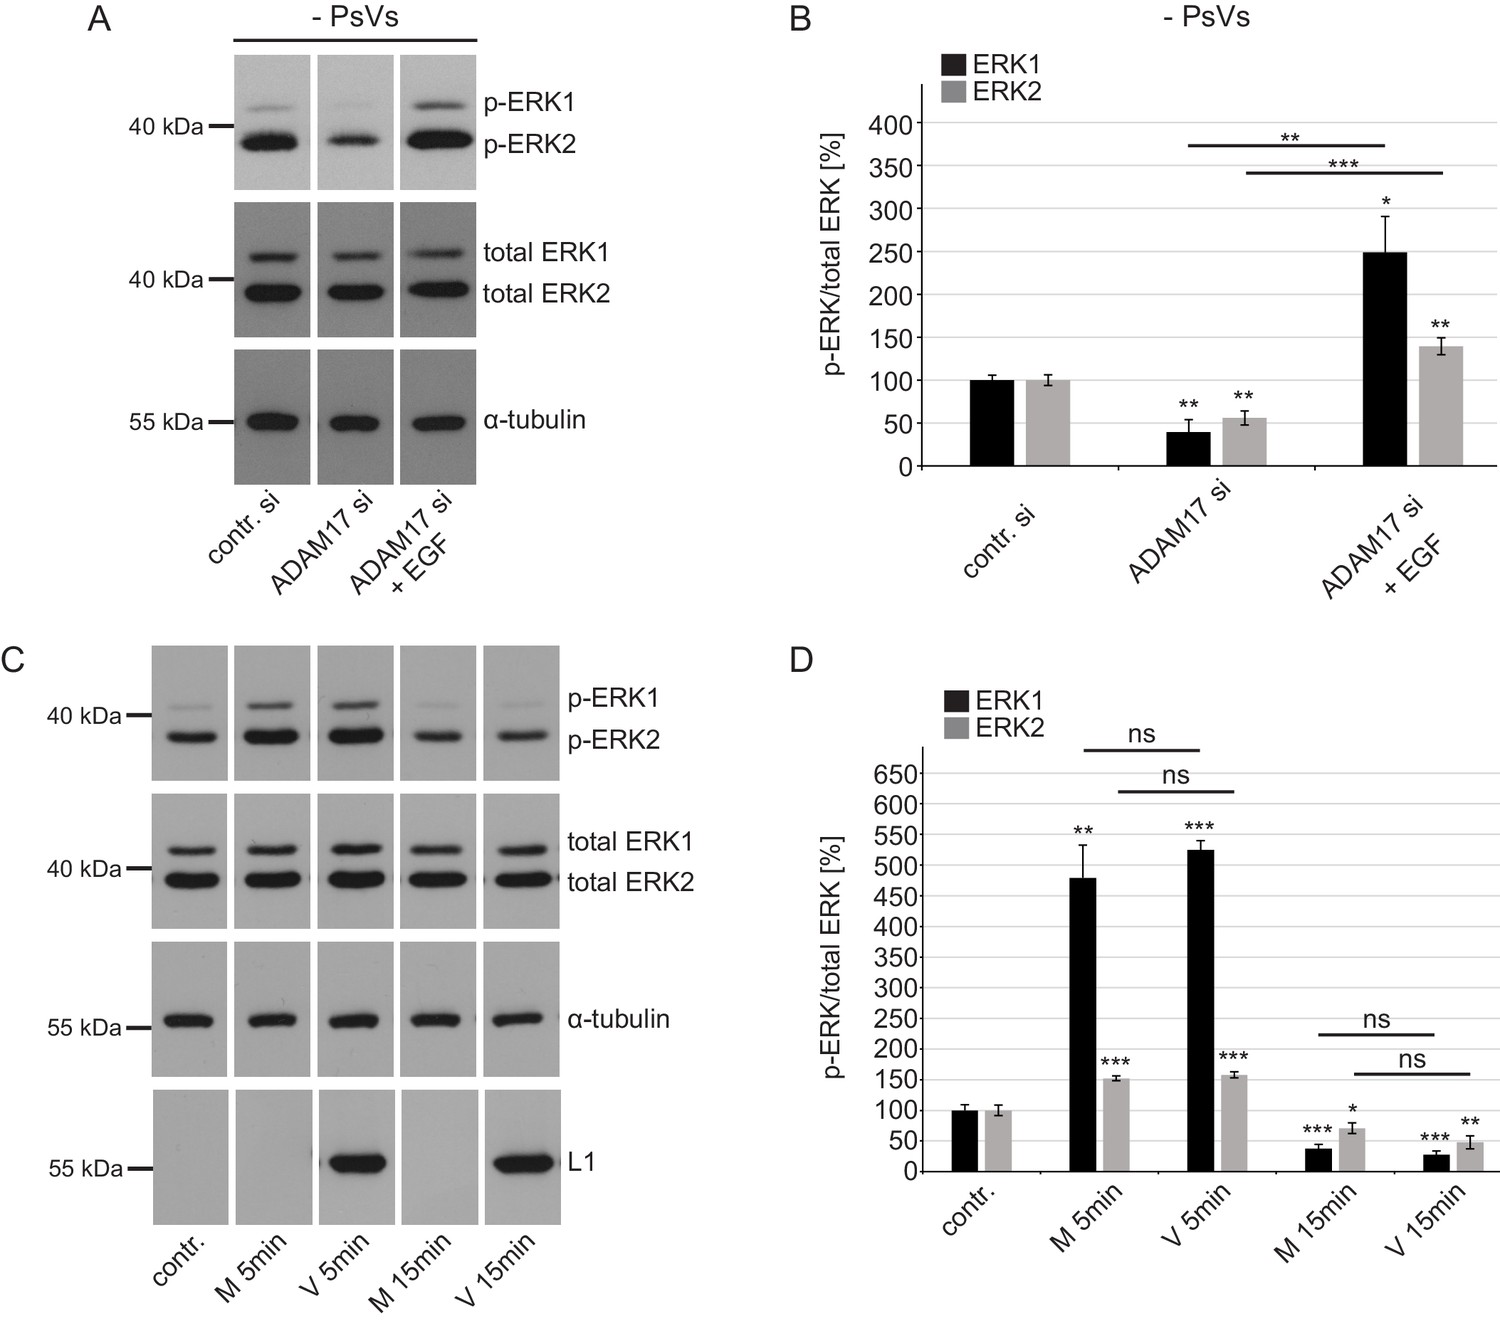
ADAM17 affects ERK1/2 in PsVs-non-exposed cells but PsVs have no effect on ERK1/2.
(A) Western blot performed on HaCaT cells upon ADAM17 depletion. Cells were depleted of ADAM17 for 48 hr, starved for 1 hr in medium without FCS, either left non-treated or treated with EGF for 5 min at 37°C. α-tubulin was used as a loading control. (B) Quantification of the western blots as shown in (A). The amount of phosphorylated ERK1 (labeled in black) and ERK2 (labeled in gray) protein is shown as a ratio of phosphorylated to total ERK form. Data for ERK1 (n = 6–7) when compared to the corresponding contr. si were analyzed using Welch two sample t-test: p=4.83E-03 (ADAM17 si) and: p=0.016 (ADAM17 si +EGF) and the difference between ADAM17 si and ADAM17 si +EGF: p=2.96E-03. Data for ERK2 (n = 6–7) when compared to the corresponding contr. si were analyzed using two sample t-test: p=1.09E-03 (ADAM17 si) and p=5.09E-03 (ADAM17 si +EGF) and the difference between ADAM17 si and ADAM17 si +EGF: p=4.17E-05. The values are given as mean ± SEM and the mean for control siRNA-treated cells (contr. si) was set to 100%.(C) HaCaT Cells were starved for 4 hr in medium without FCS, either left non-treated or treated with Mock (M: no HPV16 capsid) of PsVs (V: with HPV16 capsid) preparation for 5 or 15 min. α-tubulin was used as a loading control and L1 (K75) for capsid detection. (D) Quantification of the western blots shown in (C). The amount of phosphorylated ERK1 (black) and ERK2 (gray) protein is shown as a ratio of phosphorylated to total ERK. Data for ERK1 (n = 5) when compared to non-treated cells (contr.) were analyzed using Welch two sample t-test: p=1.75E-03 (M 5 min), two sample t-test: p=8.84E-09 (V 5 min), p=6.56E-04 (M 15 min) and p=1.91E-04 (V 15 min), the difference between M 5 min and V 5 min: p=0.449, and between M 15 min and V 15 min: p=0.307. Data for ERK2 (n = 6) when compared to non-treated cells (contr.) were analyzed using two sample t-test: p=2.40E-04 (M 5 min), p=1.59E-04 (V 5 min), p=0.039 (M 15 min), p=3.30E-03 (V 15 min), the difference between M 5 min and V 5 min: p=0.390, and between M 15 min and V 15 min: p=0.122. The values are given as mean ± SEM and the mean for non-treated cells (contr.) was set to 100% for ERK1 and ERK2, respectively.
Figure 7 with 1 supplement
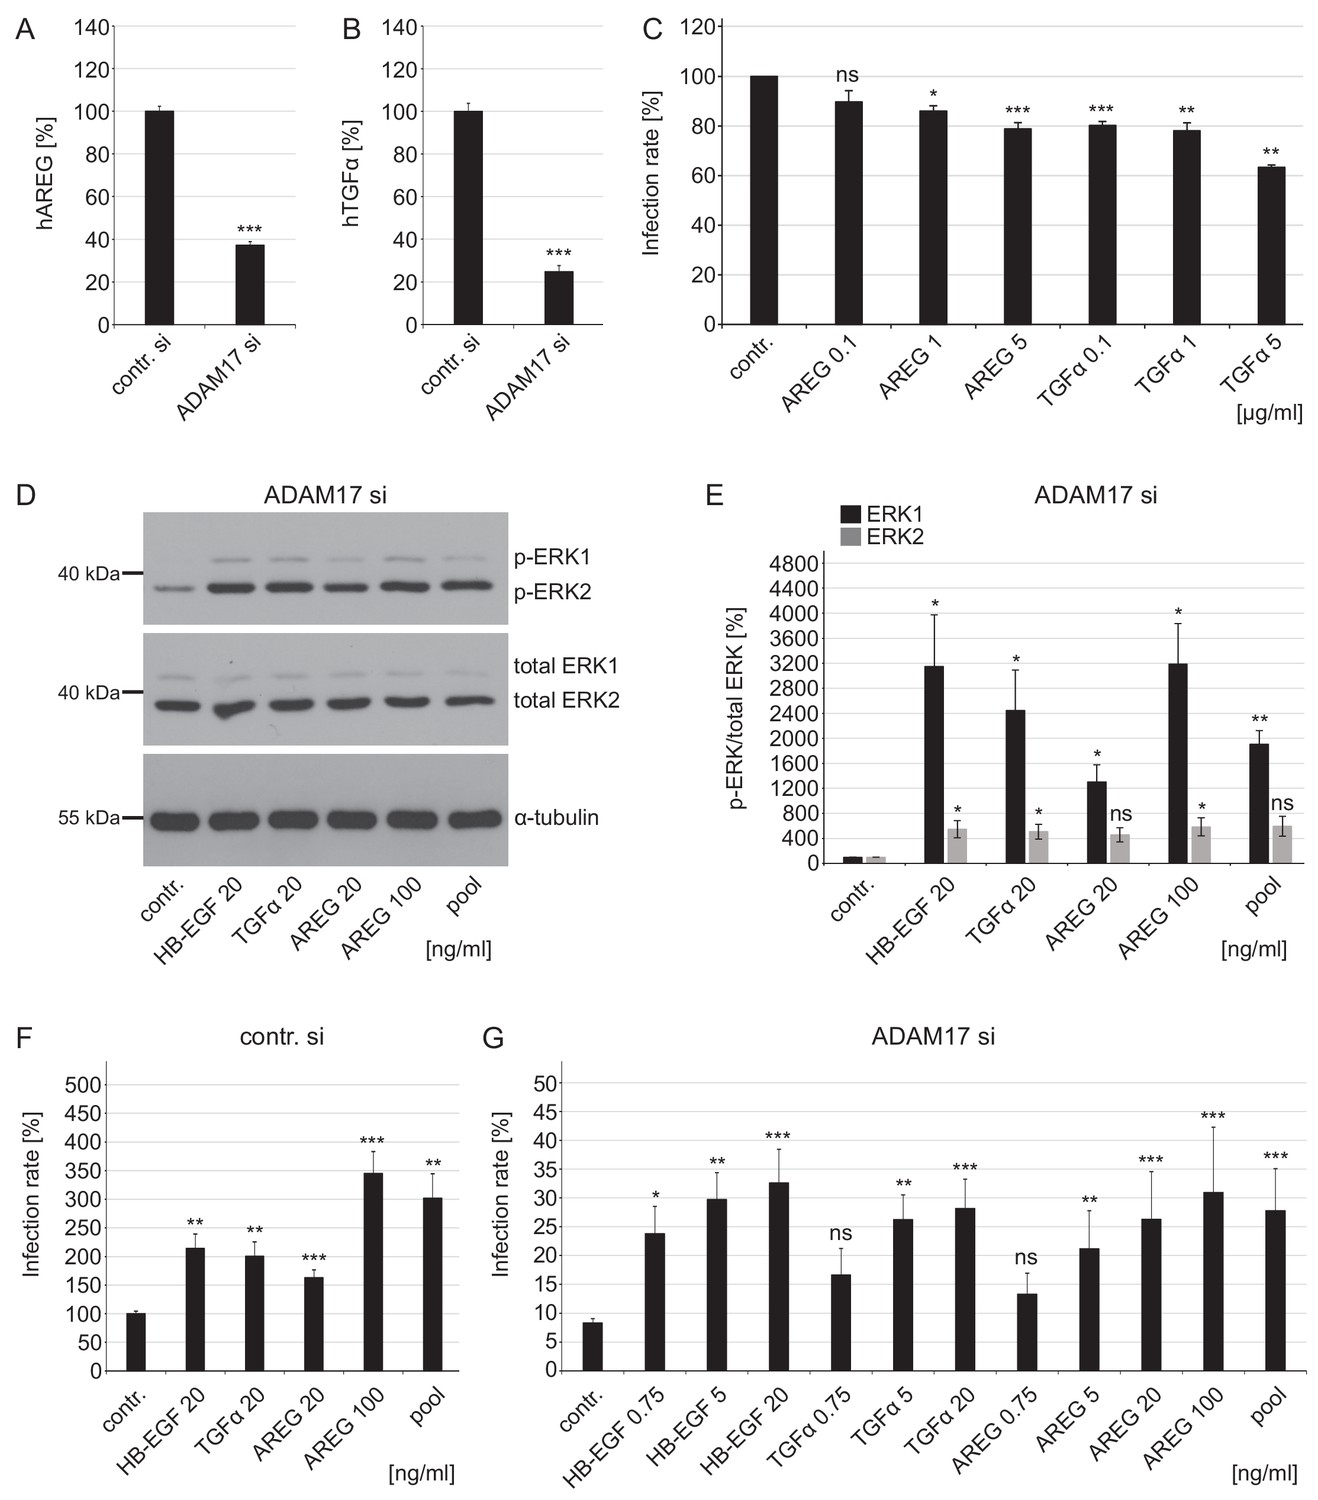
Growth factors affect ERK1/2 signaling and HPV16 infection rate in ADAM17-depleted cells.
(A) ADAM17 depletion diminishes release of human AREG (ELISA). HaCaT cells were depleted of ADAM17 for 48 hr, afterwards starved in medium without FCS and 24 hr later supernatants were collected. Supernatants (n = 24) were analyzed with Wilcoxon rank sum test: p=3.06E-09. Release of AREG is given as mean ± SEM and the mean for control siRNA-treated cells (contr. si) was set to 100%. (B) Knockdown of ADAM17 decreases release of human TGFα (Ectodomain shedding assay). HeLa cells were treated with ADAM17-specific siRNA, 24 hr later transfected with alkaline phosphatase-tagged TGFα plasmid and the next day incubated in the fresh medium without FCS for 3 hr at 37°C. Supernatants (n = 7) were analyzed with two sample t-test: p=1.83E-09. The release of transfected AP-tagged TGFα, used as readout for ADAM17 activity, is shown as a percentage and the mean for control siRNA-treated cells was set to 100%. (C) AREG and TGFα neutralizing antibodies significantly diminish HPV16 infection rate. HaCaT cells were pre-treated with specified antibodies murine IgG (contr.), AREG or TGFα for 1 hr, infected with PsVs and analyzed 24 hr later. Data for AREG (n = 6) were analyzed with Wilcoxon rank sum test: p=0.227 (AREG 0.1 ng/ml), Welch two sample t- test: p=0.011 (AREG 1 ng/ml) and two sample t-test: p=1.05E-04 (AREG 5 ng/ml). Data for TGFα (n = 6) were analyzed with two sample t-test: p=1.35E-06 (TGFα 0.1 ng/ml) and p=1.20E-03 (TGFα 1 ng/ml) and Wilcoxon rank sum test: p=4.77E-03 (TGFα 5 ng/ml). The values are given as mean ± SEM and the mean of all tested concentrations for murine IgG-treated cells (contr.) was set to 100%. (D) HaCaT cells were depleted of ADAM17 for 48 hr. Next, cells were starved for 4 hr in medium without FCS, either left non-treated or treated with depicted concentrations of different GFs for 15 min. Western blots show phosphorylated and total ERK1 and ERK2 for the indicated conditions; α-tubulin was used as a loading control. (E) The amount of phosphorylated ERK1 (in black) and ERK2 (in gray) is shown as a ratio of phosphorylated to total ERK form. Data for ERK1 (n = 4) were analyzed with Welch two sample t-test: p=0.034 (HB-EGF 20 ng/ml), p=0.036 (TGFα 20 ng/ml), p=0.022 (AREG 20 ng/ml), p=0.018 (AREG 100 ng/ml) and p=3.70E-03 (pool). Data for ERK2 (n = 4); Welch two sample t-test: p=0.047 (HB-EGF 20 ng/ml), p=0.042 (TGFα 20 ng/ml), p=0.051 (AREG 20 ng/ml), p=0.043 (AREG 100 ng/ml) and p=0.052 (pool). The values are given as mean ± SEM. and the mean for control-treated cells (contr.) was set to 100%. (F) Control siRNA-treated HaCaTs were starved for 2 hr in medium without FCS, treated with depicted concentration of different GFs for 15 min and infected with PsVs for 24 hr. Data (n = 7–10) were analyzed with Welch two sample t-test: p=0.13E-03 (HB-EGF 20 ng/ml), p=2.95E-03 (TGFα 20 ng/ml), p=1.00E-03 (AREG 20 ng/ml), 6.86E-04 (AREG 100 ng/ml) and p=3.03E-03 (pool). The values are given as mean ± SEM. and the mean for non-treated cells (contr.) was set to 100%. (G) ADAM17 siRNA-treated cells were treated as in (F). Data (n = 5–12) when compared to non-treated cells (contr.) were analyzed with Welch two sample t-test: p=0.014 (HB-EGF 0.75 ng/ml), p=3.59E-03 (HB-EGF 5 ng/ml), p=0.130 (TGFα 0.75 ng/m), p=4.09E-03 (TGFα 5 ng/ml), p=0.617 (AREG 0.75 ng/ml), p=3.23E-03 (AREG 5 ng/ml), p=3.23E-04 (AREG 20 ng/ml), p=1.08E-04 (AREG 100 ng/ml), p=1.08E-04 (pool), and with Wilcoxon rank sum test: p=1.48E-06 (HB-EGF 20 ng/ml), p=3.09E-06 (TGFα 20 ng/ml). The values are given as mean ± SEM. and the mean for non-treated cells (contr.) was set to 8.31%. Pool represents mixture of HB-EGF, TGFα and AREG used at final concentration of 20 ng/ml for each GF.
Figure 7—figure supplement 1

Growth factors increase HPV16 infection rate in ADAM17 siRNA-treated cells under full medium conditions.
(A) Control siRNA-treated HaCaTs were treated with depicted concentration of different GFs for 15 min and infected with PsVs for 24 hr. Data (n = 6–9) were analyzed with Welch two sample t-test: p=0.010 (HB-EGF 20 ng/ml), p=0.183 (TGFα 20 ng/ml) and p=0.734 (AREG 20 ng/ml). The values are given as mean ± SEM. and the mean for non-treated cells (contr.) was set to 100%. (B) ADAM17 siRNA-treated cells were handled as in (A). Data (n = 6–11) were analyzed with Welch two sample t-test: p=9.21E-04 (HB-EGF 20 ng/ml), and two sample t-test: p=5.30E-05 (TGFα 20 ng/ml) and p=6.53E-08 (AREG 20 ng/ml). The values are given as mean ± SEM. and the mean for non-treated cells (contr.) was set to 11,23%.
Tables
Key resources table
| Reagent type (species) or resource | Designation | Source or reference | Identifiers | Additional information |
|---|---|---|---|---|
| Cell line (Homo sapiens) | HaCaT cells | Cell Lines Services (CLS) | Cat. #: 300493; RRID:CVCL_0038 | human immortalized keratinocytes (from adult skin) |
| Cell line (Homo sapiens) | HeLa cells | German Resource Center of Biological Material (DSMZ) | Cat. #: ACC 57; RRID:CVCL_0030 | human cervical carcinoma cell line |
| Cell line (Homo sapiens) | NHEK cells | PromoCell | Cat. #: C-12002 | normal human epidermal keratinocytes |
| Antibody | anti-ADAM10 (rabbit polyclonal) | Merck Millipore | Cat. #: AB19026; RRID:AB_2242320 | WB (1:750) |
| Antibody | anti-ADAM17 (rabbit polyclonal) | Merck Millipore | Cat. #: AB19027; RRID:AB_91097 | WB (1:1000) |
| Antibody | anti-AREG (goat polyclonal) | R and D Systems | Cat. #: AF262; RRID:AB_2243124 | |
| Antibody | anti-CD151 (mouse monoclonal) | Bio-Rad | Bio-Rad: MCA1856; RRID:AB_2228964 | IHC (1:100) |
| Antibody | anti-EGFR (rabbit monoclonal) | Cell Signaling | Cat. #: 4267; RRID:AB_2246311 | IHC (1:100) |
| Antibody | anti-EGFR; Cetuximab | Merck | 3023710001 | |
| Antibody | anti-L1 K75 (rabbit polyclonall) | PMID: 15543569 | WB (1:10000); IHC (1:1000), flow cytometry (1:500) | |
| Antibody | anti-L1 16L1-312F (mouse monoclonal) | PMID: 17640876 | WB (1:350); IHC (1:10) | |
| Antibody | anti-L1 33L1-7 (mouse monoclonal) | PMID: 7996132 | WB (1:350) | |
| Antibody | anti-mouse Alexa Fluor 488 (goat polyclonal) | Molecular Probes (Invitrogen) | Cat. #: A-11029; RRID:AB_138404 | IHC (1:450) |
| Antibody | anti-mouse Alexa Fluor 546 (goat polyclonal) | Molecular Probes (Invitrogen) | Cat. #: A-11030; RRID:AB_144695 | IHC (1:450) |
| Antibody | anti-mouse Alexa Fluor 647 (donkey polyclonal) | Molecular Probes (Invitrogen) | Cat. #: A-31571; RRID:AB_162542 | IHC (1:200) |
| Antibody | anti-p44/42 MAPK (rabbit monoclonal) | Cell Signaling | Cat. #: 4695; RRID:AB_390779 | WB (1:2000) |
| Antibody | anti-p44/42 MAPK-Thr202, Tyr204 (rabbit monoclonal) | Cell Signaling | Cat. #: 4370; RRID:AB_2315112 | WB (1:2000) |
| Antibody | anti-rabbit Alexa Fluor 488 (goat polyclonal) | Molecular Probes (Invitrogen) | Cat. #: A-11034; RRID:AB_2576217 | IHC (1:450) |
| Antibody | anti-rabbit Alexa Fluor 546 (goat polyclonal) | Molecular Probes (Invitrogen) | Cat. #: A-11035; RRID:AB_143051 | IHC (1:450) |
| Antibody | anti-rabbit Alexa Fluor 594 (donkey polyclonal) | Molecular Probes (Invitrogen) | Cat. #: A-21207; RRID:AB_141637 | IHC (1:200) |
| Antibody | anti-TGFα (goat polyclonal) | R and D Systems | Cat. #: AF-239; RRID:AB_2201779 | |
| Antibody | anti-α-tubulin (mouse monoclonal) | Sigma-Aldrich | Cat. #: T5168; RRID:AB_477579 | WB (1:10000) |
| Antibody | anti-β-actin (mouse monoclonal) | Sigma-Aldrich | Cat. #: A5441; RRID:AB_476744 | WB (1:10000) |
| Antibody | control IgG (mouse) | Sigma-Aldrich | Cat. #: I5381; RRID:AB_1163670 | |
| Antibody | HRP anti-rabbit (polyclonal) | Jackson ImmunoResearch | Cat. #: 111-035-003; RRID:AB_231356 | WB (1:10000) |
| Antibody | HRP anti-mouse (polyclonal) | Jackson ImmunoResearch | Cat. #: 115-035-003; RRID:AB_10015289 | WB (1:10000) |
| Recombinant DNA reagent | AP-TGFα | PMID: 17079736 | provided by Dr. Carl P. Blobel (Hospital for Special Surgery, New York, USA) | |
| Recombinant DNA reagent | CD151-CFP | PMID: 23302890 | ||
| Recombinant DNA reagent | CD151-GFP | PMID: 23302890 | provided by Dr. Dr. Xin A. Zhang (Oklahoma City, USA) | |
| Sequenced-based reagent | siRNA (in this paper ADAM10 #1) | Sigma-Aldrich | sequence GGACAAACUUAACAACAAU | |
| Sequenced-based reagent | siRNA (in this paper ADAM10 #2) | Sigma-Aldrich | sequence UACACCAGUCAUCUGGUAUUUCCUC | |
| Sequenced-based reagent | siRNA (in this paper ADAM17 #1) | Invitrogen | sequence GGAAGCUGACCUGGUUACAACUCAU | |
| Sequenced-based reagent | siRNA (in this paper ADAM17 #2) | Invitrogen | sequence CCAGGGAGGGAAAUAUGUCAUGUAU | |
| Peptide, recombinant protein | EGF-Alexa Fluor 488 complex | Thermo Fischer Scientific | Cat. #: E13345 | |
| Peptide, recombinant protein | human ADAM17 | R and D Systems | Cat. #: 930-ADB | |
| Peptide, recombinant protein | human AREG | Peprotech | Cat. #: 100-55B | |
| Peptide, recombinant protein | human HB-EGF | Roche | Cat. #: 259-HE | |
| Peptide, recombinant protein | human TGFα | Biolegend | Cat. #: 589904 | |
| Commercial assay, kit | CytoTox-ONE Homogeneous Membrane Integrity Assay | Promega | Cat. #: G7890 | |
| Commercial assay, kit | DuolinkIn Situ Orange Starter Kit Mouse/Rabbit | Sigma-Aldrich | Cat. #: DUO92102 | |
| Commercial assay, kit | Human Amphiregulin DuoSet ELISA kit | R and D Systems | Cat. #: DY262 | |
| Chemical compound | GI254023X | Tocris Bioscience | Cat. #: 3995 | |
| Chemical compound | GW280264X | Aobious | Cat. #: AOB3632 | |
| Chemical compound | TAPI-0 | Sigma-Aldrich | Cat. #: SML1292 | |
| Other | luciferase assay buffer | This paper | see Materials and methods | |
| Software, algorithm | ImageJ | ImageJ (http://imagej.nih.gov/ij/) | ||
| Software, algorithm | Statistical Software R (2017, version 3.3.3) | R (http://www.R-project.org/) | R: A language and environment for statistical computing. R Foundation for Statistical Computing, Vienna, Austria |
Additional files
-
Transparent reporting form
- https://doi.org/10.7554/eLife.44345.018
Download links
A two-part list of links to download the article, or parts of the article, in various formats.
Downloads (link to download the article as PDF)
Open citations (links to open the citations from this article in various online reference manager services)
Cite this article (links to download the citations from this article in formats compatible with various reference manager tools)
ADAM17-dependent signaling is required for oncogenic human papillomavirus entry platform assembly
eLife 8:e44345.
https://doi.org/10.7554/eLife.44345


