Transcriptomic and epigenetic regulation of hair cell regeneration in the mouse utricle and its potentiation by Atoh1
- Baylor College of Medicine, United States
- University of Southern California, United States
- The Texas Heart Institute, United States
Figures
Figure 1 with 2 supplements
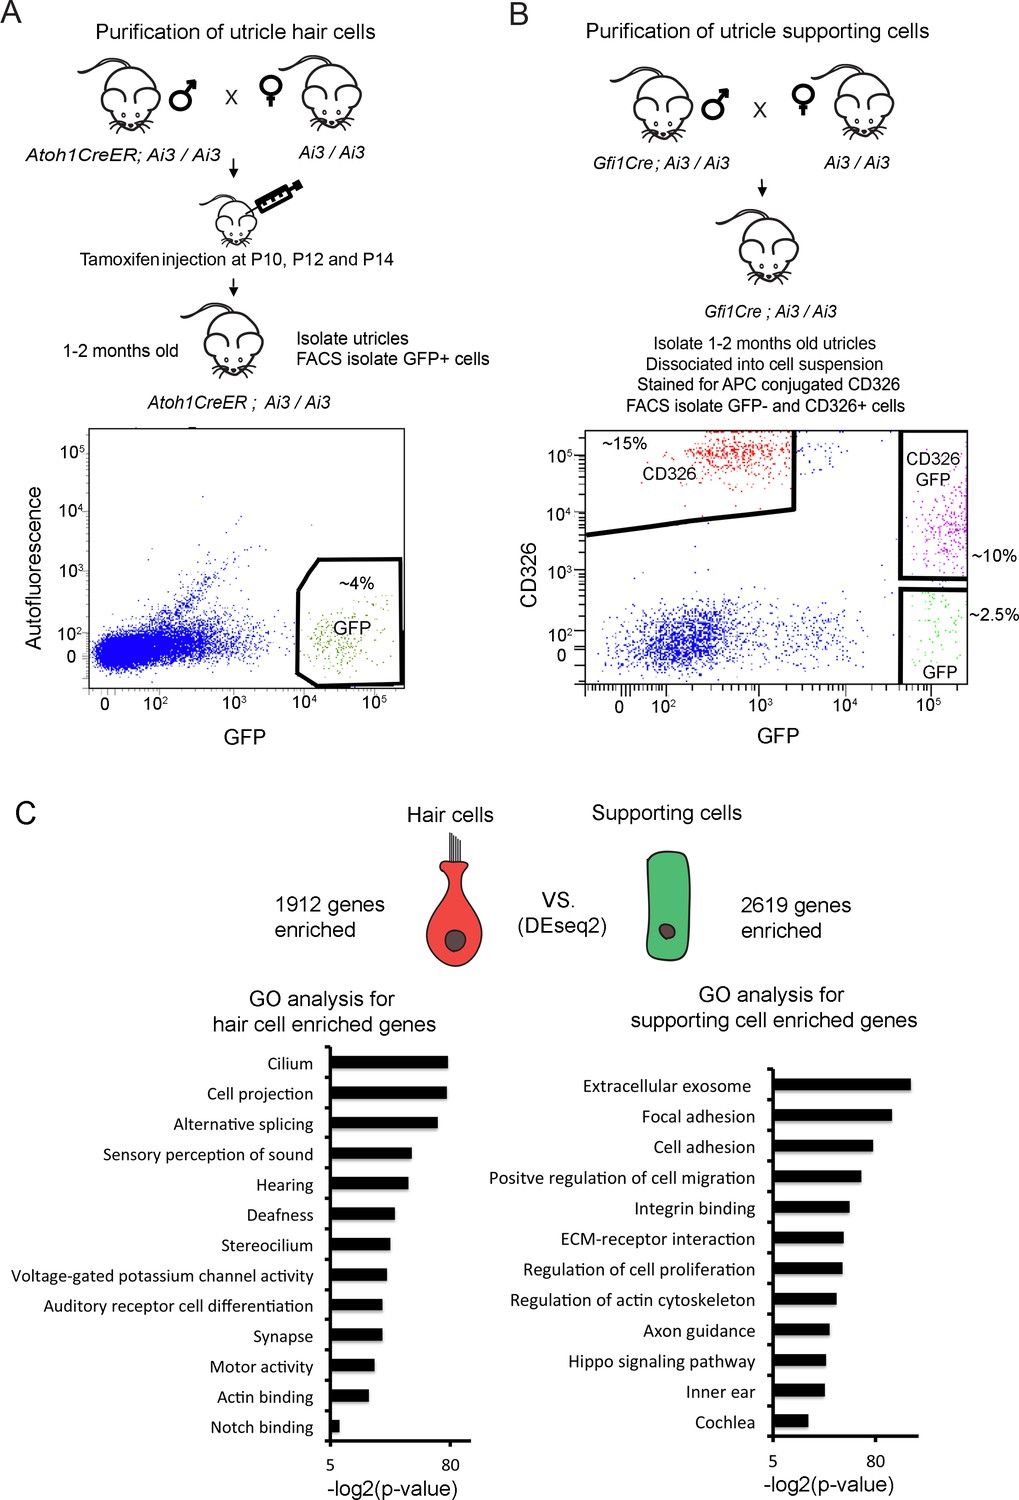
Identification of unique utricle hair cell and supporting cell transcripts by FACS sorting and RNA-sequencing.
Diagrams of the breeding and FACS purification strategy to isolate utricle hair cells and supporting cells. (A) To isolate utricle hair cells, Ai3 reporter mice carrying an Atoh1-CreER transgene received tamoxifen injections at 10, 12 and 14 days after birth. GFP-expressing hair cells were sorted from 1 to 2 month old animals. (B) To isolate supporting cells, Ai3 reporter mice carrying a Gfi1-Cre transgene were sacrificed at 1–2 months of age, and the dissociated cells labeled with anti-CD326 conjugated to allophycocyanin (APC). Supporting cells were isolated by sorting the CD326+, GFP- population (red). (C) Identification of differentially expressed genes in utricle hair cells and supporting cells using DEseq2. Differentially expressed genes were determined based on fold change >4 and adjusted P value < 0.05. Gene ontology analysis of (GO) analysis of enriched pathways or keywords in each cell population was performed with the DAVID analysis tool using 1912 hair cell-enriched genes and 2619 supporting cell-enriched genes.
-
Figure 1—source data 1
Lists of top 100 utricle hair cell-enriched genes and top 100 utricle supporting cell-enriched genes.
- https://doi.org/10.7554/eLife.44328.005
Figure 1—figure supplement 1
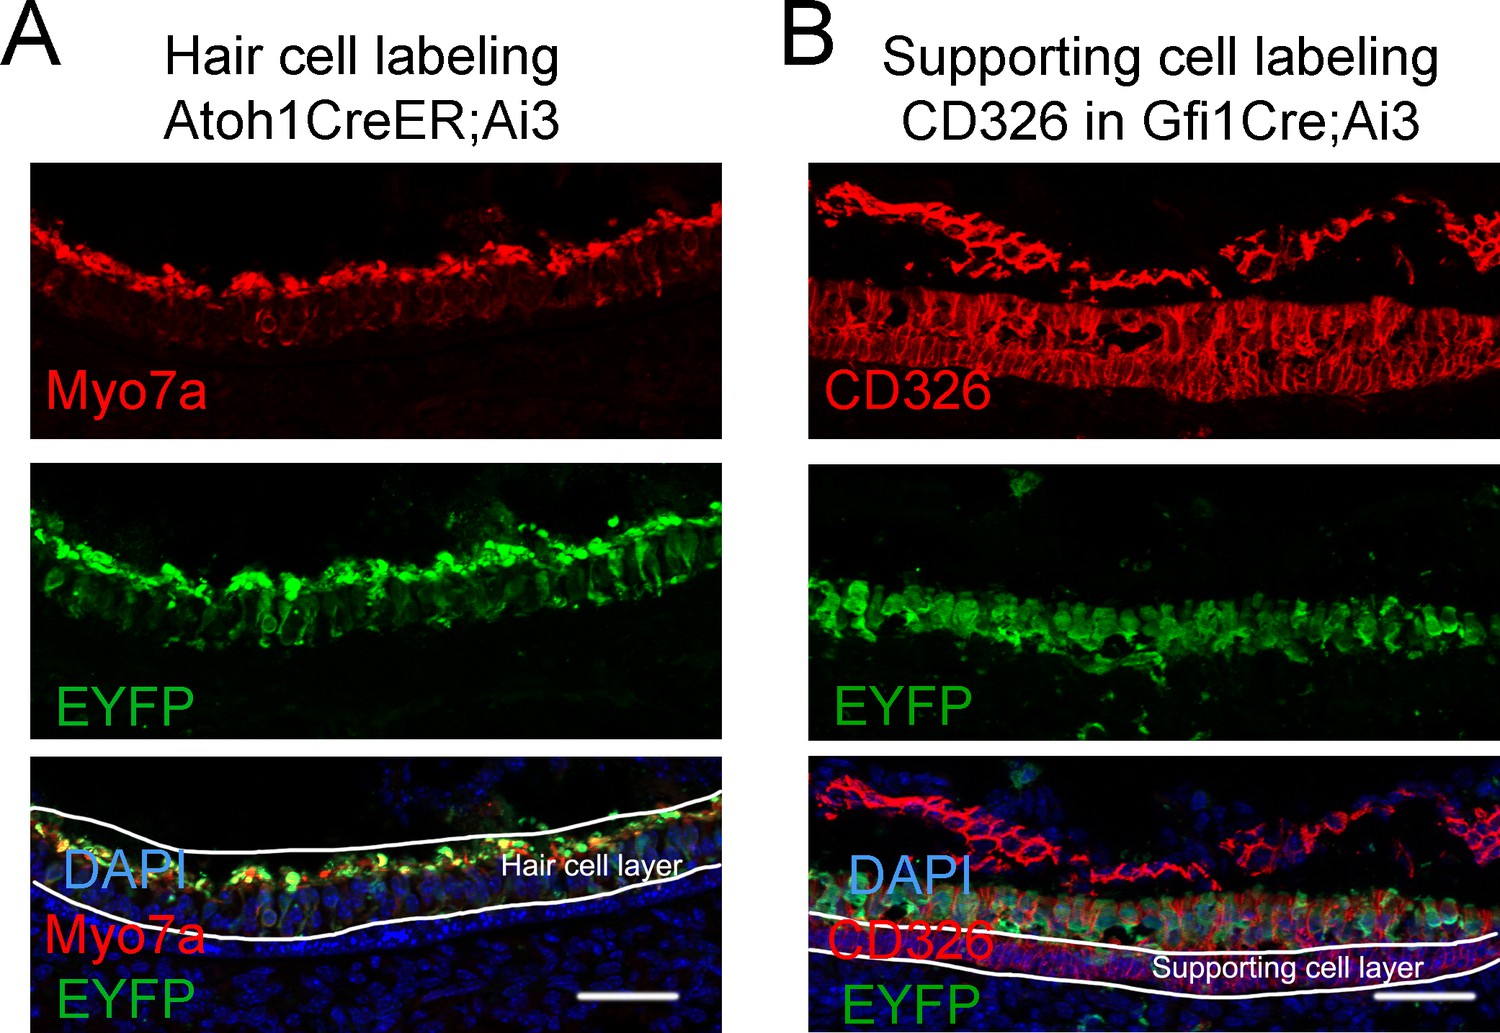
Fluorescence labeling of endogenous epithelial cells for RNA-seq and ATAC-seq.
(A) Immunofluorescence staining of utricle sections from 4 to 5 week old Atoh1-CreER; Ai3 mice treated with tamoxifen to show hair cells (Myo7a) and the GFP Cre reporter. (B) Immunofluorescence staining of utricle sections from 4 to 5 week old Gfi1-Cre; Ai3 mice to show CD326 labeling of epithelial cells, and the GFP reporter labeling hair cells. Scale bars 50 µm.
Figure 1—figure supplement 2
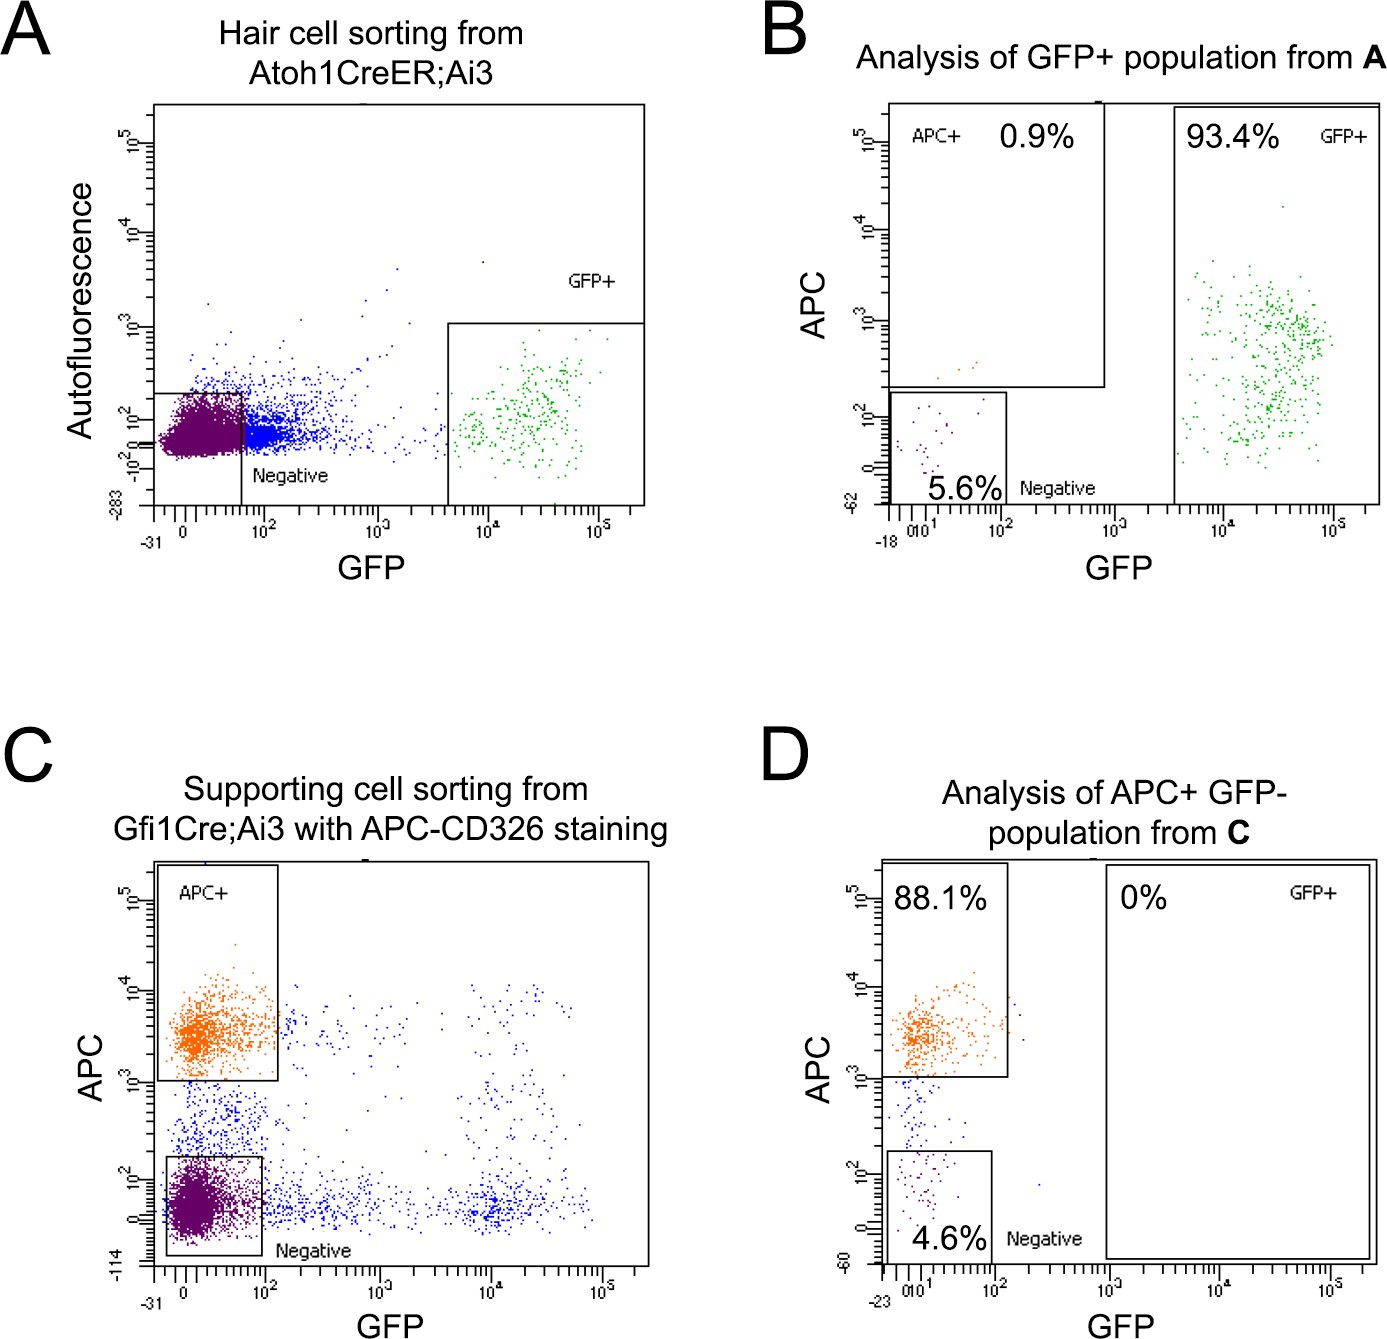
Flow cytometric analysis of sorted utricle hair cells and supporting cells.
(A) Purification of utricle hair cells: Sample FACS profile showing the distribution of isolated GFP-expressing hair cells from Atoh1-CreER;Ai3 Cre reporter mice. (B) Flow cytometric analysis of re-sorted GFP +cells stained with CD326-APC. Fewer than 1% of the CD326 +epithelial cells do not express GFP. (C) Purification of utricle supporting cells: Sample FACS profile showing the distribution of isolated CD326 positive and GFP negative supporting cells from Gfi1-Cre;Ai3 Cre reporter mice. (D) Flow cytometric analysis of re-sorted supporting cells. We were not able to detect contaminating GFP-expressing hair cells in the re-sorted supporting cells.
Figure 2 with 2 supplements
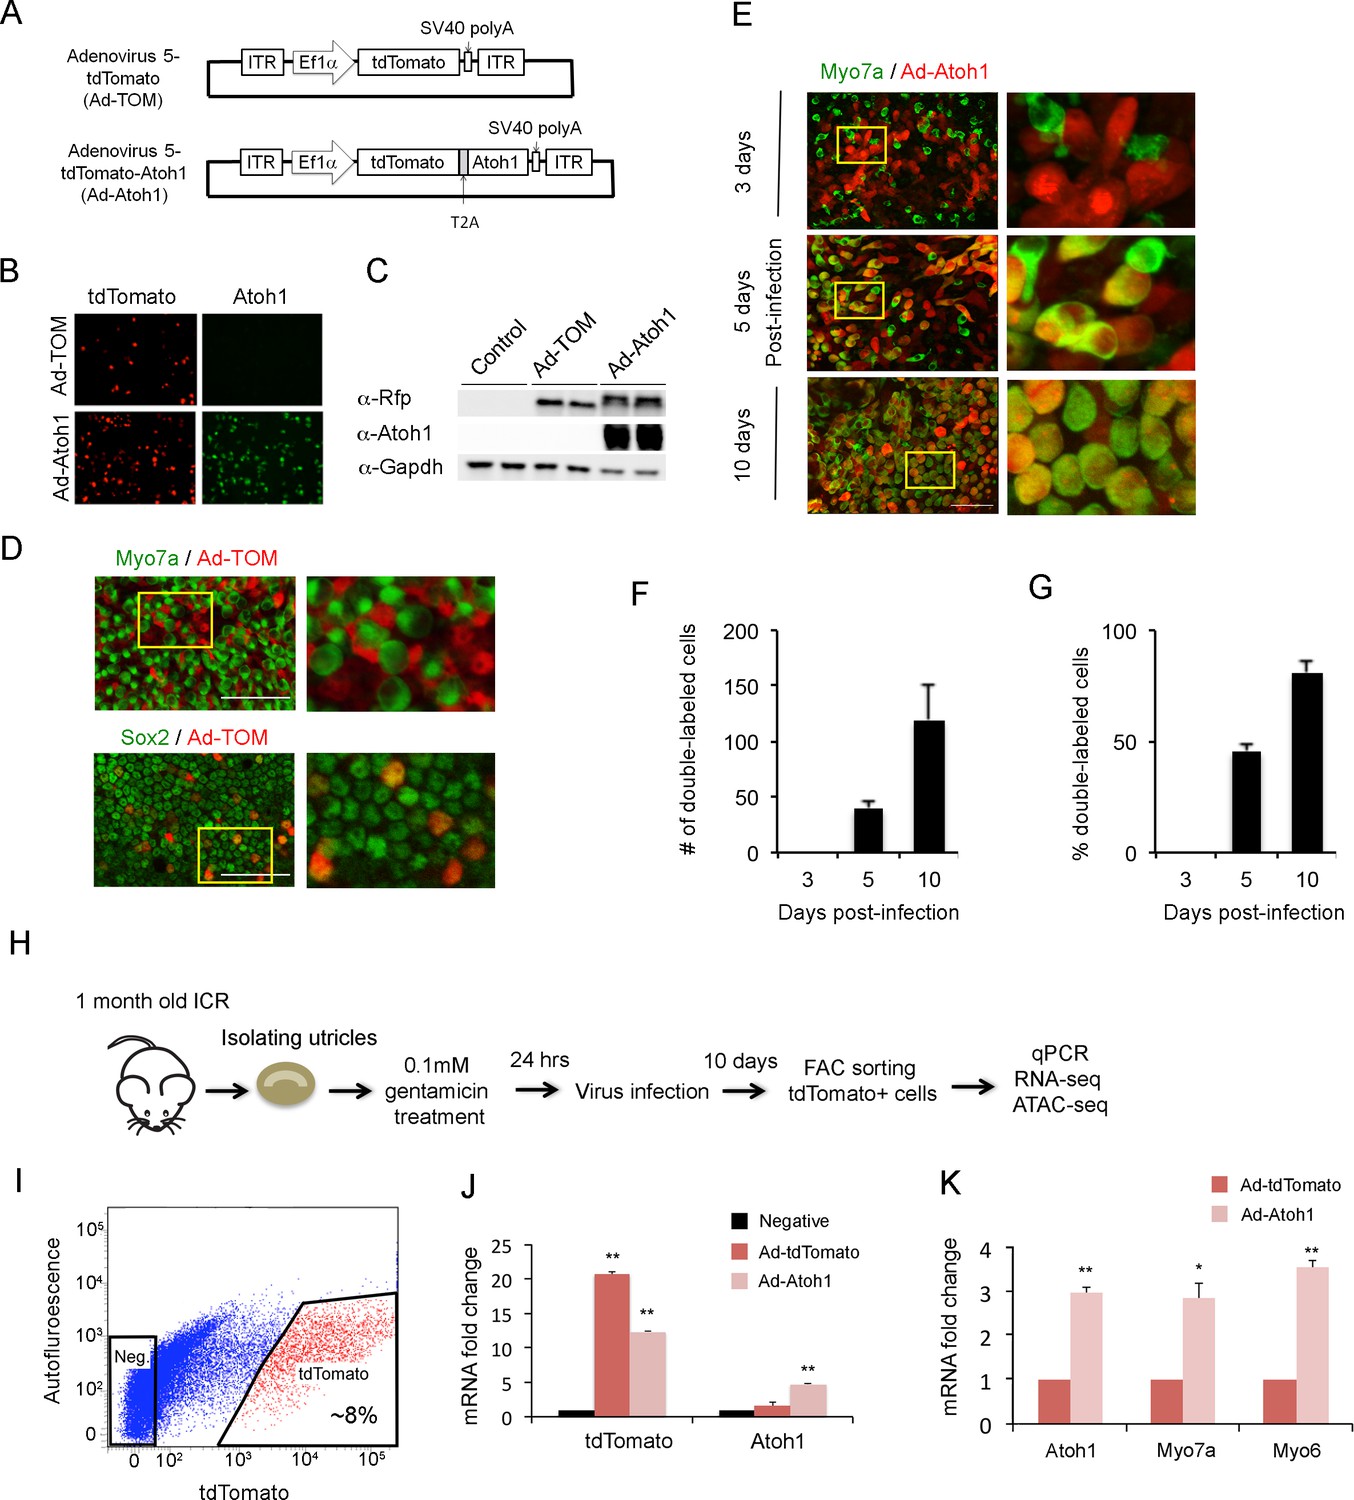
Overexpression of Atoh1 induces hair cell-like cells in the adult utricle.
(A) Diagram of adenoviral vector constructs expressing tdTomato (Ad-TOM) and tdTomato and Atoh1 (Ad-Atoh1). ITR: inverted terminal repeat sequences, T2A: picornavirus T2A sequence. (B) Immunofluorescence staining for tdTomato and Atoh1 protein in 293 T cells infected with Ad-TOM or Ad-Atoh1 viruses. Scale bar, 50 µm. (C) Western blots for expression of tdTomato in 293 T cells infected with Ad-TOM or Ad-Atoh1 viruses. Duplicate lanes are shown for each condition. (D) Immunofluorescence staining for hair cell (Myo7a-cytoplasmic staining) and supporting cell (Sox2-nuclear staining) markers on utricle explants treated with Ad-tdTomato. After 48 hr, no tdTomato +cells express Myo7a, whereas all tdTomato +cells express Sox2. Optical sections are taken through the cell body at the level of the nucleus. Scale bar, 100 µm. (E) Infection of supporting cells with Ad-Atoh1 virus induces expression of the hair cell marker Myosin7a. Utricle cultures were examined 3, 5 and 10 days post-infection, with TdTomato marking the infected cells. The insets show enlarged images of the enclosed region by the yellow square. Scale bar, 50 µm. (F) Number of tdTomato +cells per 40x field (42,750 um2) expressing Myo7a increases over the 10 day culture period. Error bars show mean ± SEM (n ≥ 6 utricles). (G) Percentage of tdTomato +cells expressing Myo7a increase over the 10 day culture period. Error bars show mean ± SEM (n ≥ 6 utricles). (H) Schematic diagram of experimental procedure for obtaining tdTomato- and Atoh1-expressing cells for RNA-seq and ATAC-seq. (I) Sample FACS profiles showing the distribution of tdTomato positive cells (red) in the virally-infected utricle cultures. (J) Q-PCR analysis of infected cells shows robust expression of tdTomato with both Ad-TOM and Ad-Atoh1 viruses, but expression of Atoh1 only in Ad-Atoh1-infected cultures. Error bars show mean ± SEM (n = 3) (*p<0.05; **p<0.01 compared with negative control) (K) Hair cell transcripts (Myo7a and Myo6) are up-regulated in Ad-Atoh1-infected cultures, but not control (Ad-TOM) cultures (n = 3) (*p<0.05; **p<0.01).
Figure 2—figure supplement 1
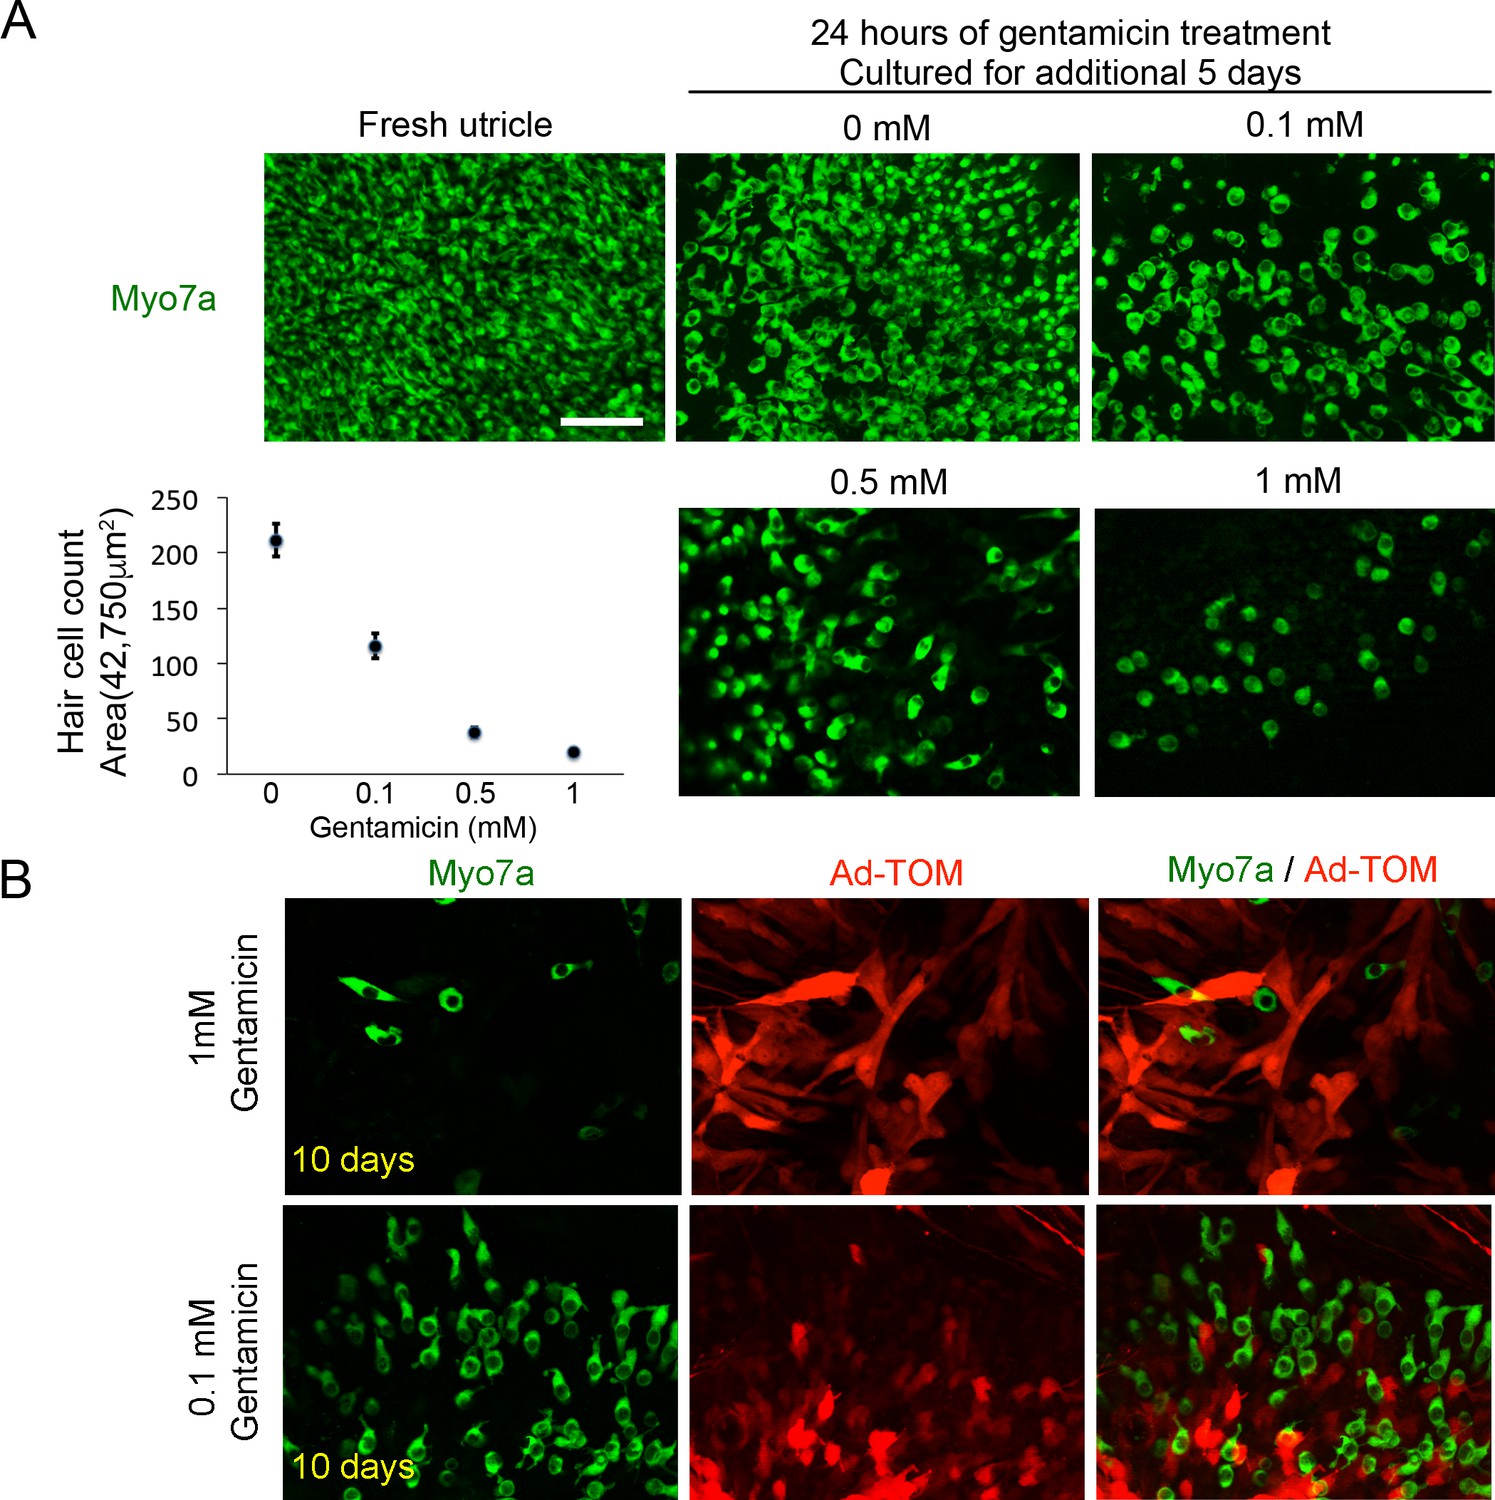
Ad-tdTomato specifically labels supporting cells after gentamicin killing.
(A) Myo7a staining in freshly dissected adult utricle explants, and explants treated with different concentrations of gentamicin for 24 hr and cultured for a further 5 days. Hair cell counts per unit area are shown for each concentration. Scale bar, 50 µm. (B) Immunofluorescence staining for Myo7a and TdTomato antibodies of utricle explants treated with 1 mM or 0.1 mM of gentamicin for 24 hr and then infected with Ad-tdTomato for 24 hr and cultured for another nine days. Supporting cell morphology is abnormal and elongated in cultures treated with 1 mM gentamicin and normal in cultures treated with 0.1 mM gentamicin. Scale bar, 50 µm.
Figure 2—figure supplement 2
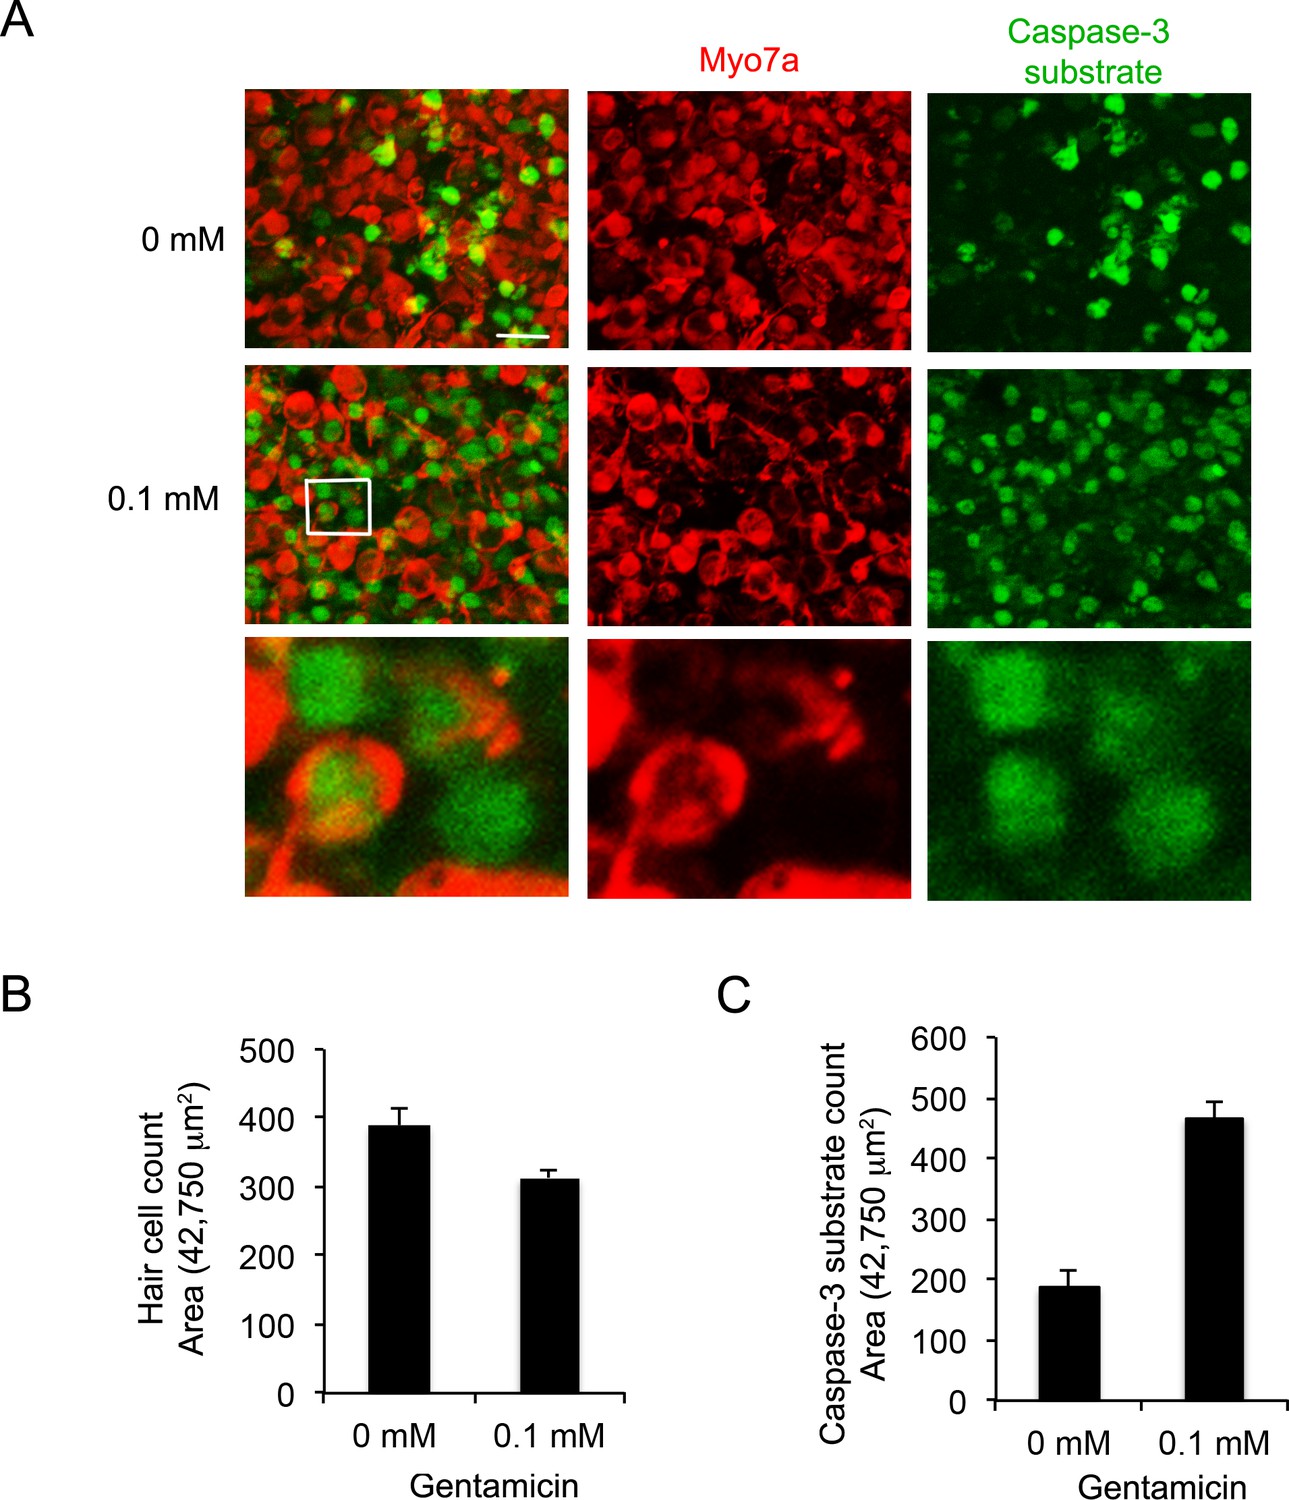
Characterization of cell death in utricle explants acutely treated with gentamicin.
(A) Myo7a staining (red) in utricle explants treated with 0.1 mM gentamicin for 24 hr and cultured for a further 24 hr. Apoptotic cells are revealed by incubation with the NucView488 caspase-3 substrate (Cen et al., 2008). (B) The onset of hair cell death can be seen after 24 hr by a reduction in the number of Myo7a + cells, and C) an increase in the number of cells expressing active Caspase-3.
Figure 3 with 2 supplements
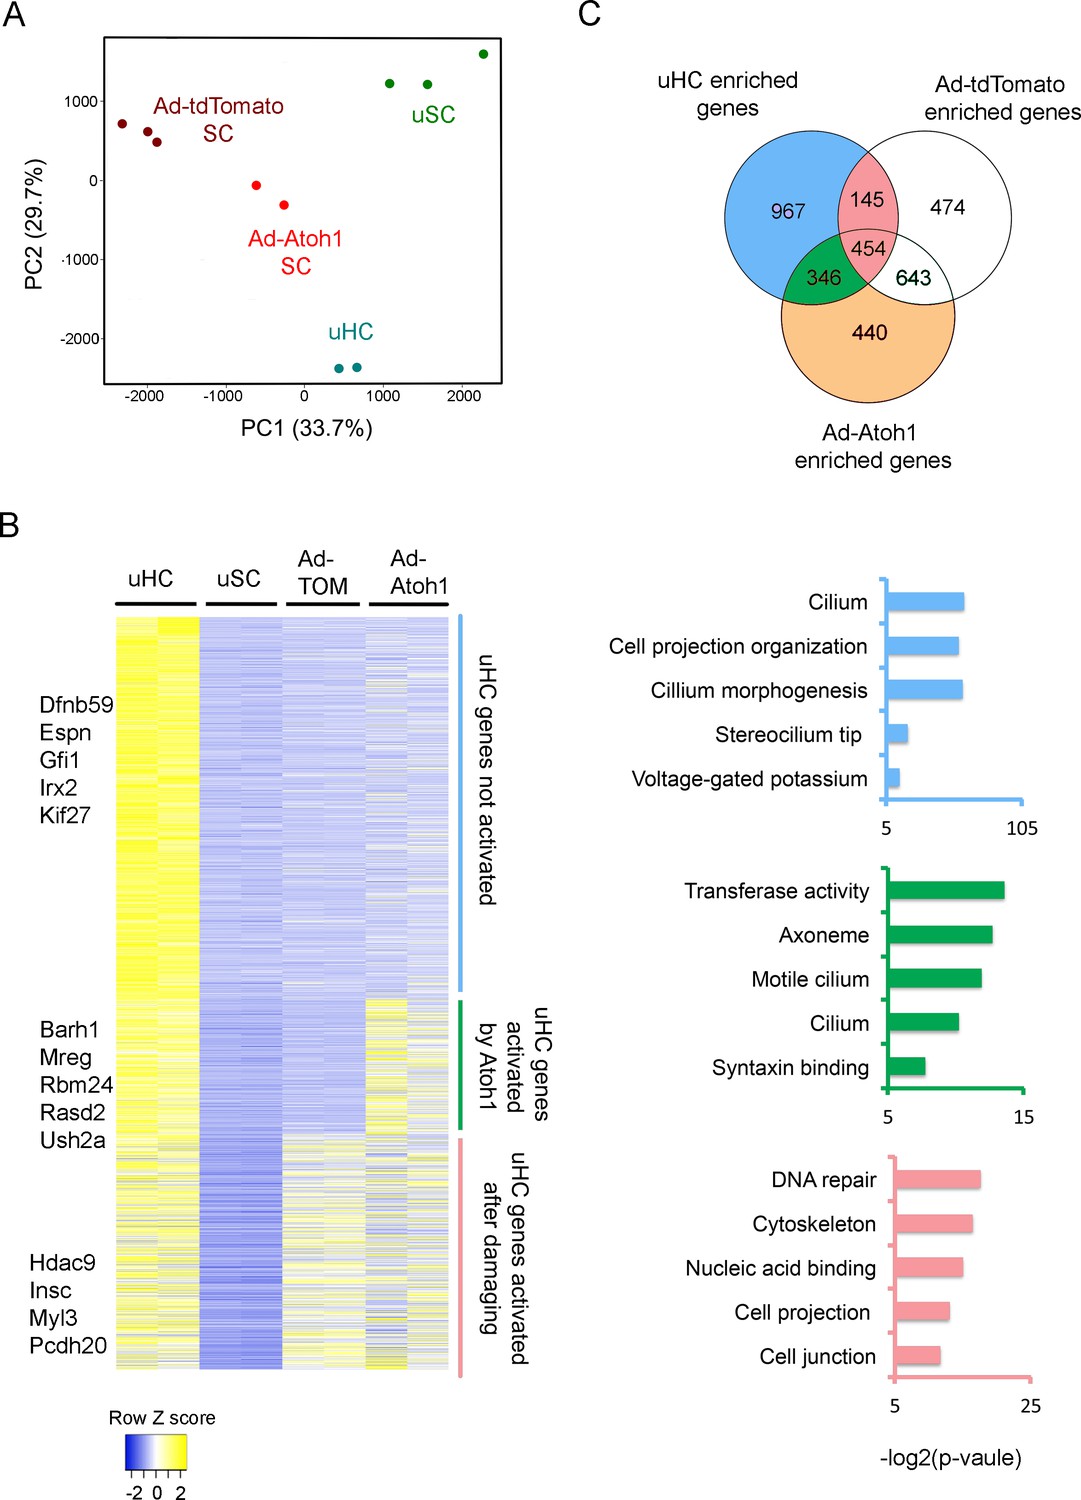
Activation of hair cell enriched genes and cell cycle genes in supporting cells after damaging to vestibular epithelium.
(A) Principle component analysis (PCA) plot using the normalized counts for the RNA-seq data from endogenous utricle hair cells, utricle supporting cell, or utricle supporting cells infected with Ad-tdTomato or Ad-Atoh1. The PCA explain 33.7% (PC1) and 29.7% (PC2) of total variance. (B) Heatmap comparing gene expression level between different groups for all hair cell enriched genes. Genes were divided into three group based on their relative expression in viral infected groups compared with supporting cells. Gene sets were divided into three groups: Hair cell genes no activated in supporting cells; hair cells genes activated by damaging and transduction with Atoh1; hair cell genes activated by damage alone. Examples of known genes are indicated for each group. (C) Venn diagram comparing genes enriched in hair cells and genes enriched in either Ad-tdTomato or Ad-Atoh1 infected supporting cells. Gene ontology analysis of enriched pathways or keywords using genes enriched only in Ad-Atoh1 infected cells (green), enriched in Ad-tdTomato infected cells (pink) and only enriched in utricle hair cells (purple).
Figure 3—figure supplement 1
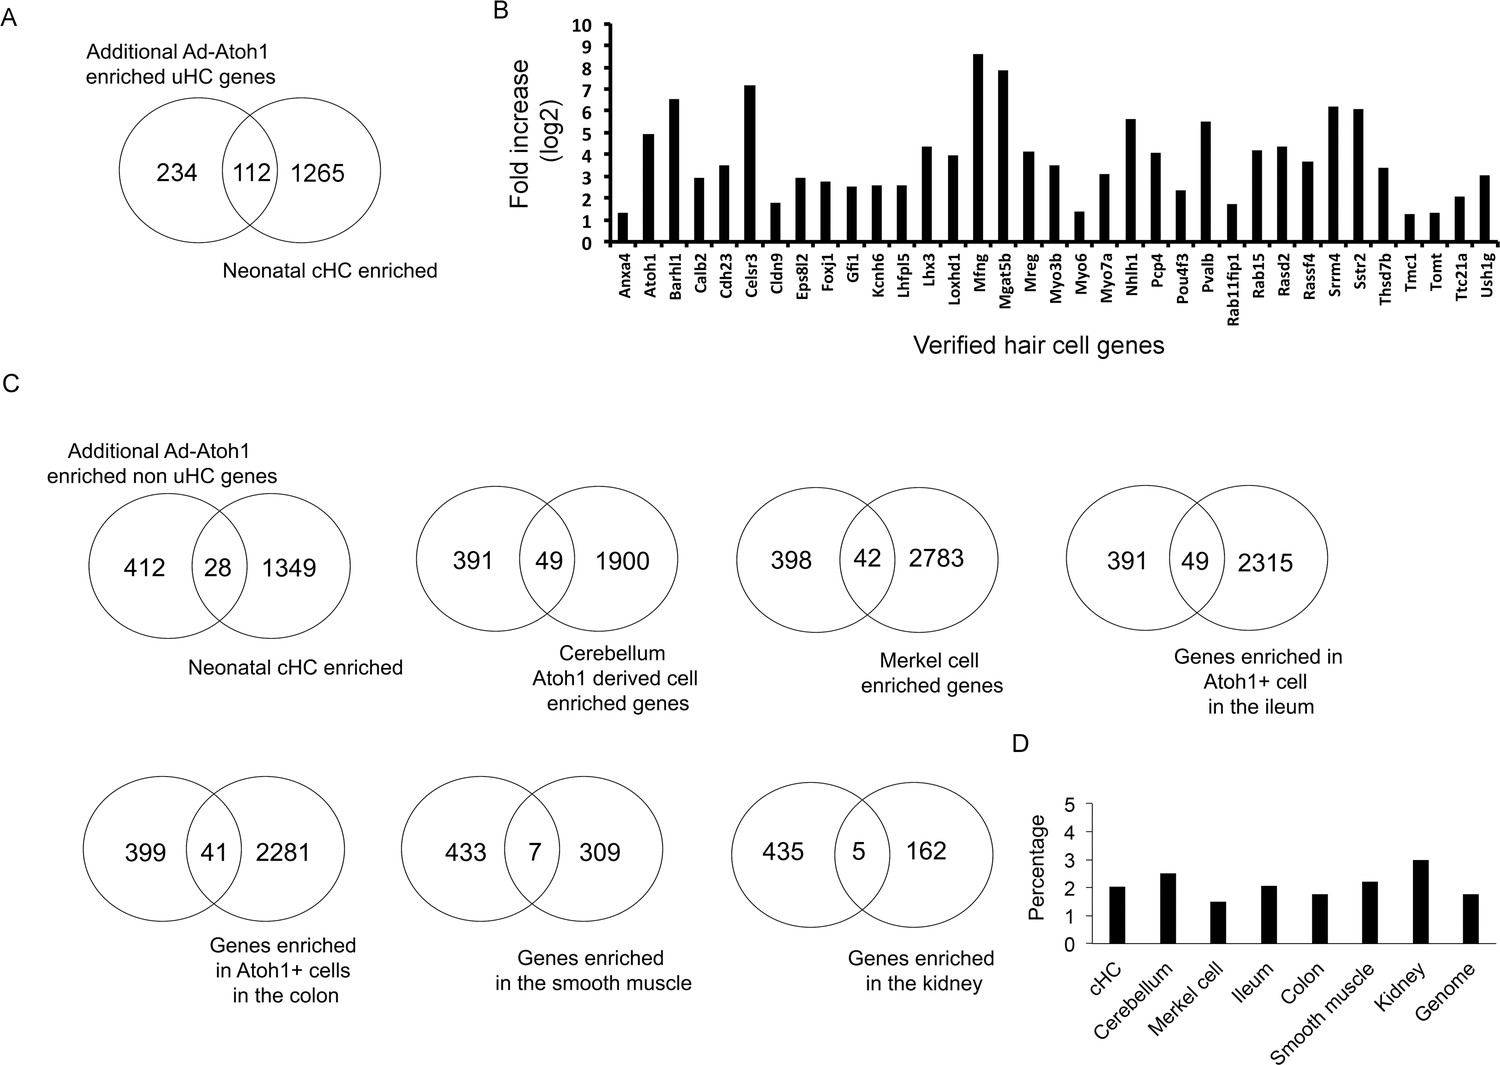
Validation of genes up-regulated in Ad-Atoh1 treated supporting cells.
(A) Venn diagram comparing hair cell genes induced by Atoh1 transduction of supporting cells with genes enriched in neonatal cochlear hair cells (1377 genes, Fold change >3, adj-P <1E-10). 112 of the 346 Atoh1-induced genes were also present in neonatal cochlear hair cells B) Validation of 35 hair cell genes showing expression in Ad-Atoh1 infected cells relative to control Ad-tdTomato infected cells. (C) Analysis of 440 genes induced by Atoh1 in supporting cells that are not normally present utricle hair cells. The Venn diagrams show the intersection of these 440 genes with genes enriched in other Atoh1-expressing cell types (neonatal cochlear hair cells, cerebellum, Merkel cells, secretory cells of the Ileum and colon) as well as two cell types that do not express Atoh1 (smooth muscle and kidney). (D) Graph showing the intersection of the 440 genes induced by Atoh1 in supporting cells that are not normally present utricle hair cells with other cell types. There is no significant difference in up-regulated genes in Atoh1-expressing versus Atoh1 non-expressing cell types.
Figure 3—figure supplement 2
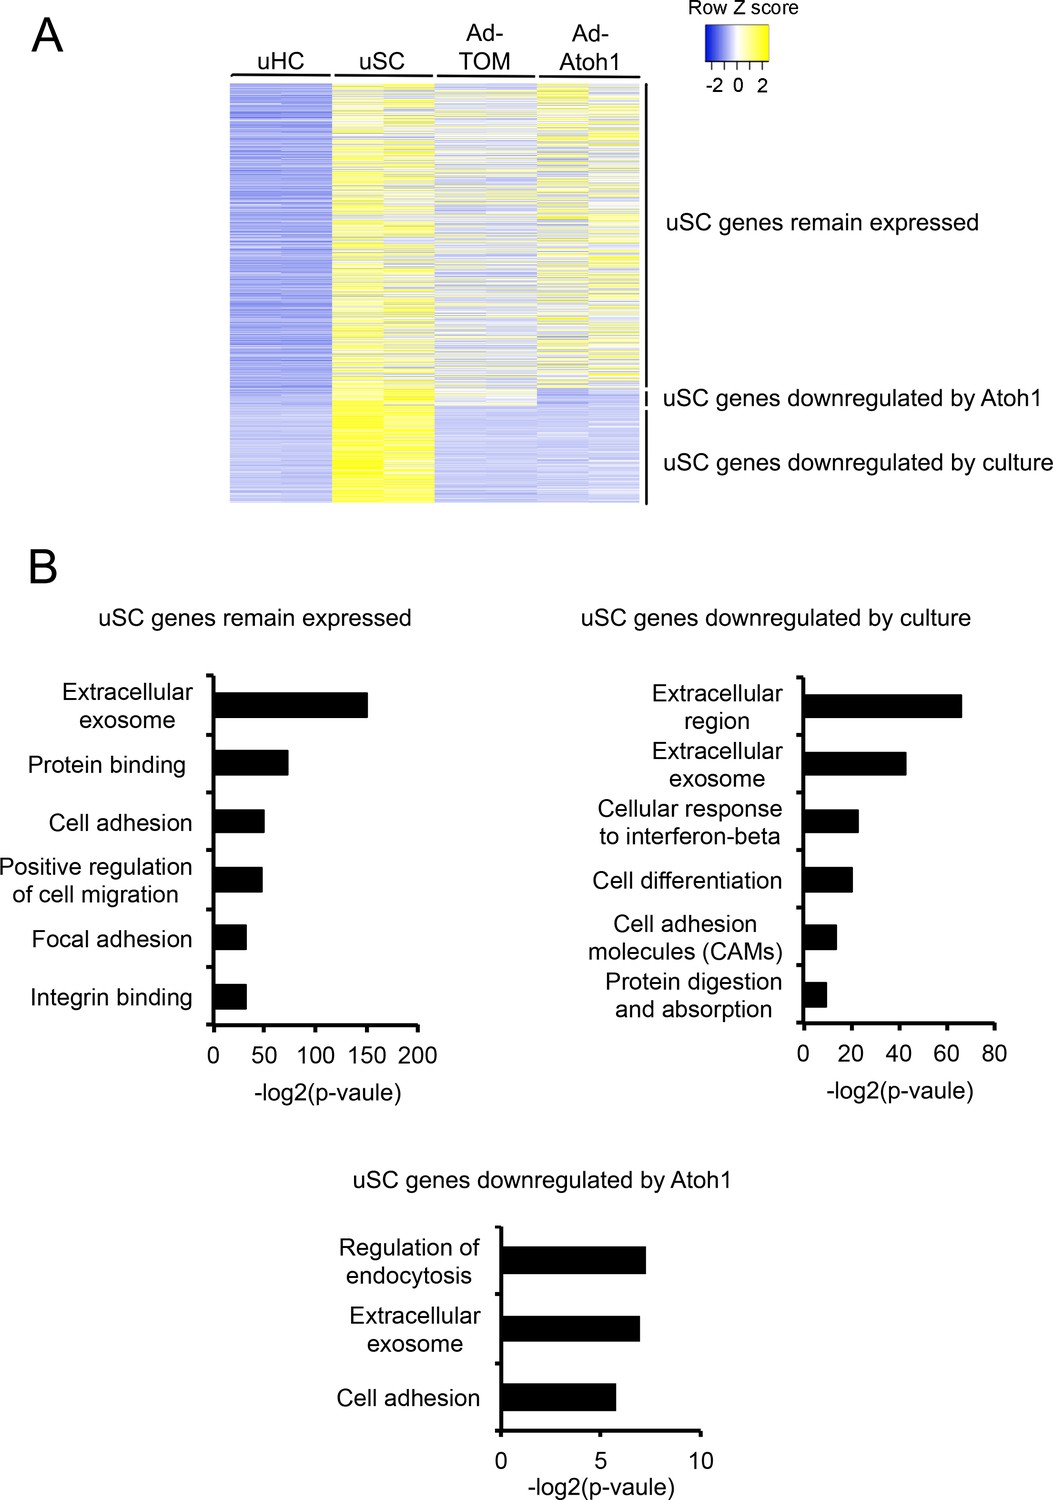
Down-regulation of supporting cell genes in Atoh1 infected supporting cells.
(A) Heat map comparing gene expression level for all 2619 supporting cells enriched genes between intact hair cells, supporting cells and supporting cells from utricles either cultured and exposed to 0.1 mM gentamicin in the presence or absence of Atoh1 virus. Genes were divided into three group based on their relative expression in viral infected groups compared with supporting cells: supporting cell genes that remain expressed with Atoh1 transduction; supporting cells genes that are down-regulated by damaging and transduction with Atoh1; supporting cell genes that are down-regulated by damage alone. (B) Gene ontology analysis of enriched pathways or keywords in the three classes of supporting cell genes identified by clustering.
Figure 4 with 2 supplements
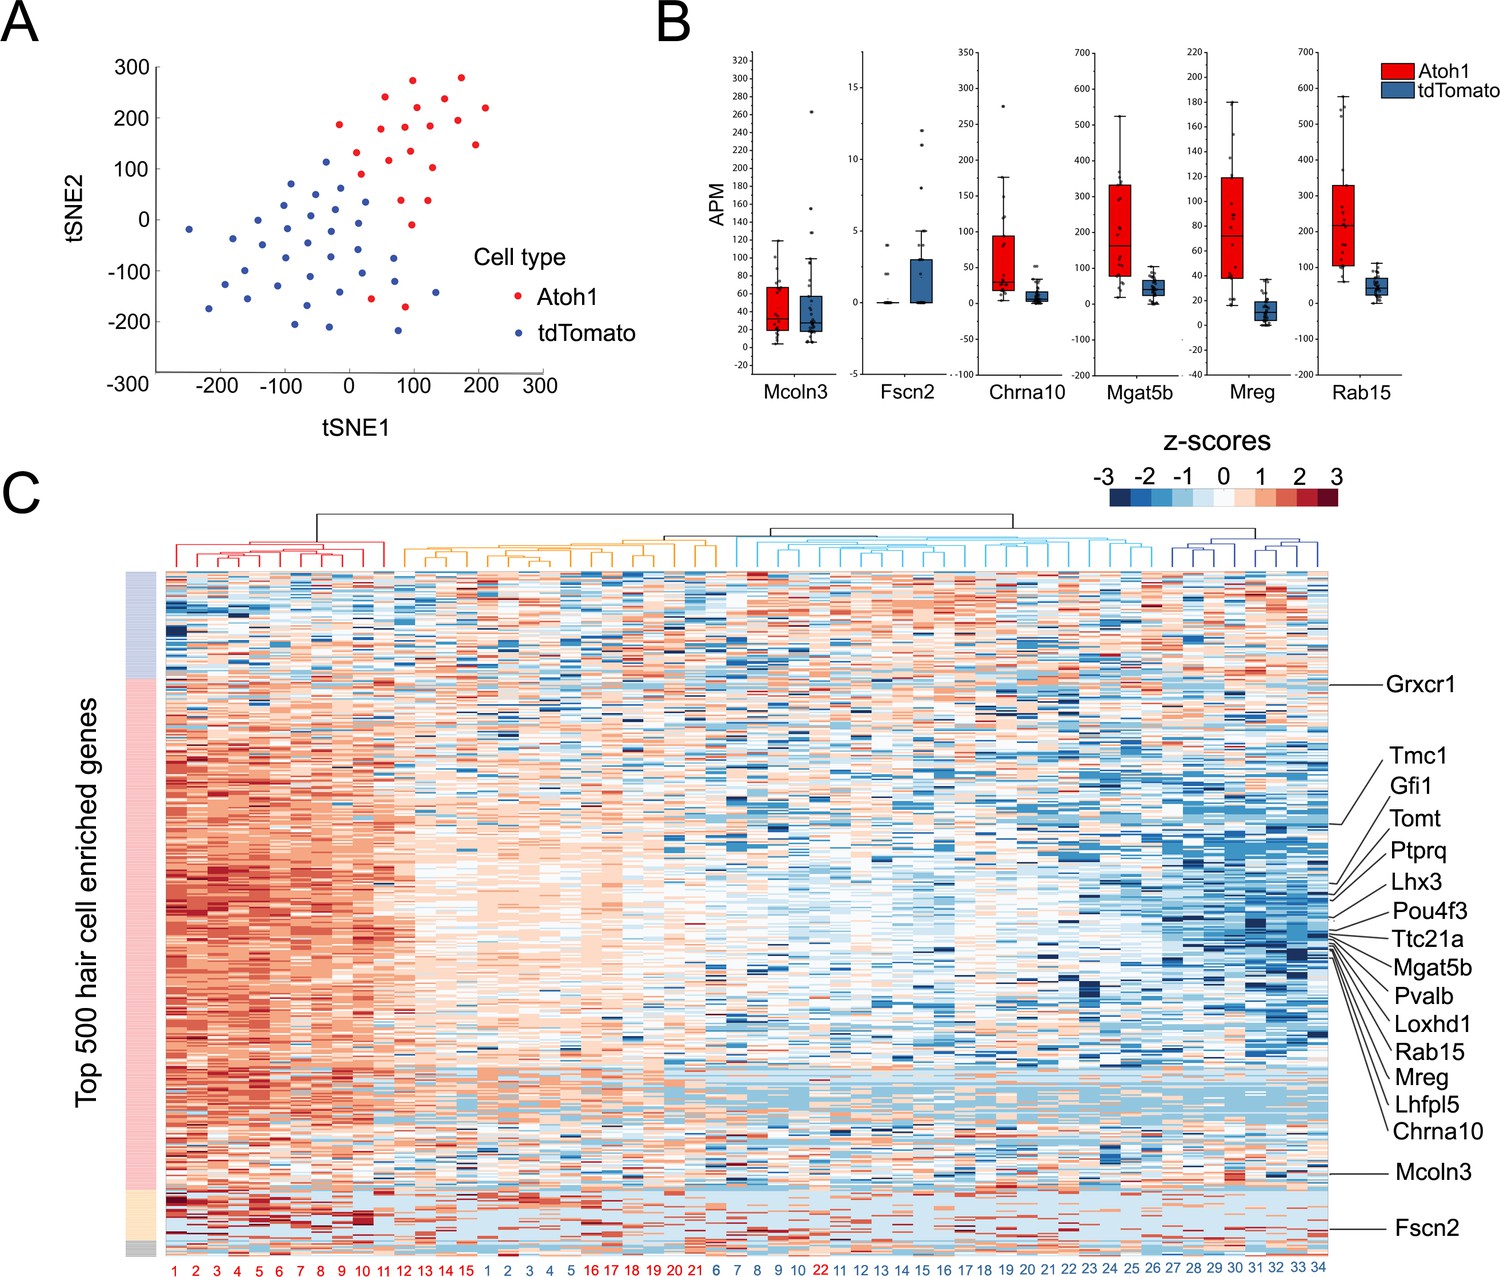
Single Cell RNA-seq analysis reveals heterogeneity in the response of supporting cells to hair cell death and Atoh1 transduction.
(A) t-SNE analysis of single cells (n = 56) for Ad-tdTomato (n = 34) and Ad-tdTomato-Atoh1(n = 22) infected supporting cells using MATLAB. (B) Box-plot for verified hair cell specific genes, including hair cell genes that are not induced by Atoh1 virus infection (Mcoln3, Fscn2) and hair cell genes that are induced by Atoh1 virus infection (Chrna10, Mgat5b, Mreg, Rab15). APM: amplicon per million amplicons. (C) Heatmap showed hierarchical clustering of gene expression level between each single cells (Ad-tdTomato-Atoh1 infected cells labeled in red, and Ad-tdTomato infected supporting cell labeled in blue) for top 500 utricle hair cell enriched genes. Color code on the left suggested clustered genes population while on the top showing how each cells clustered together. Many hair cell genes that are previously identified are also showed in the heatmap.
Figure 4—figure supplement 1
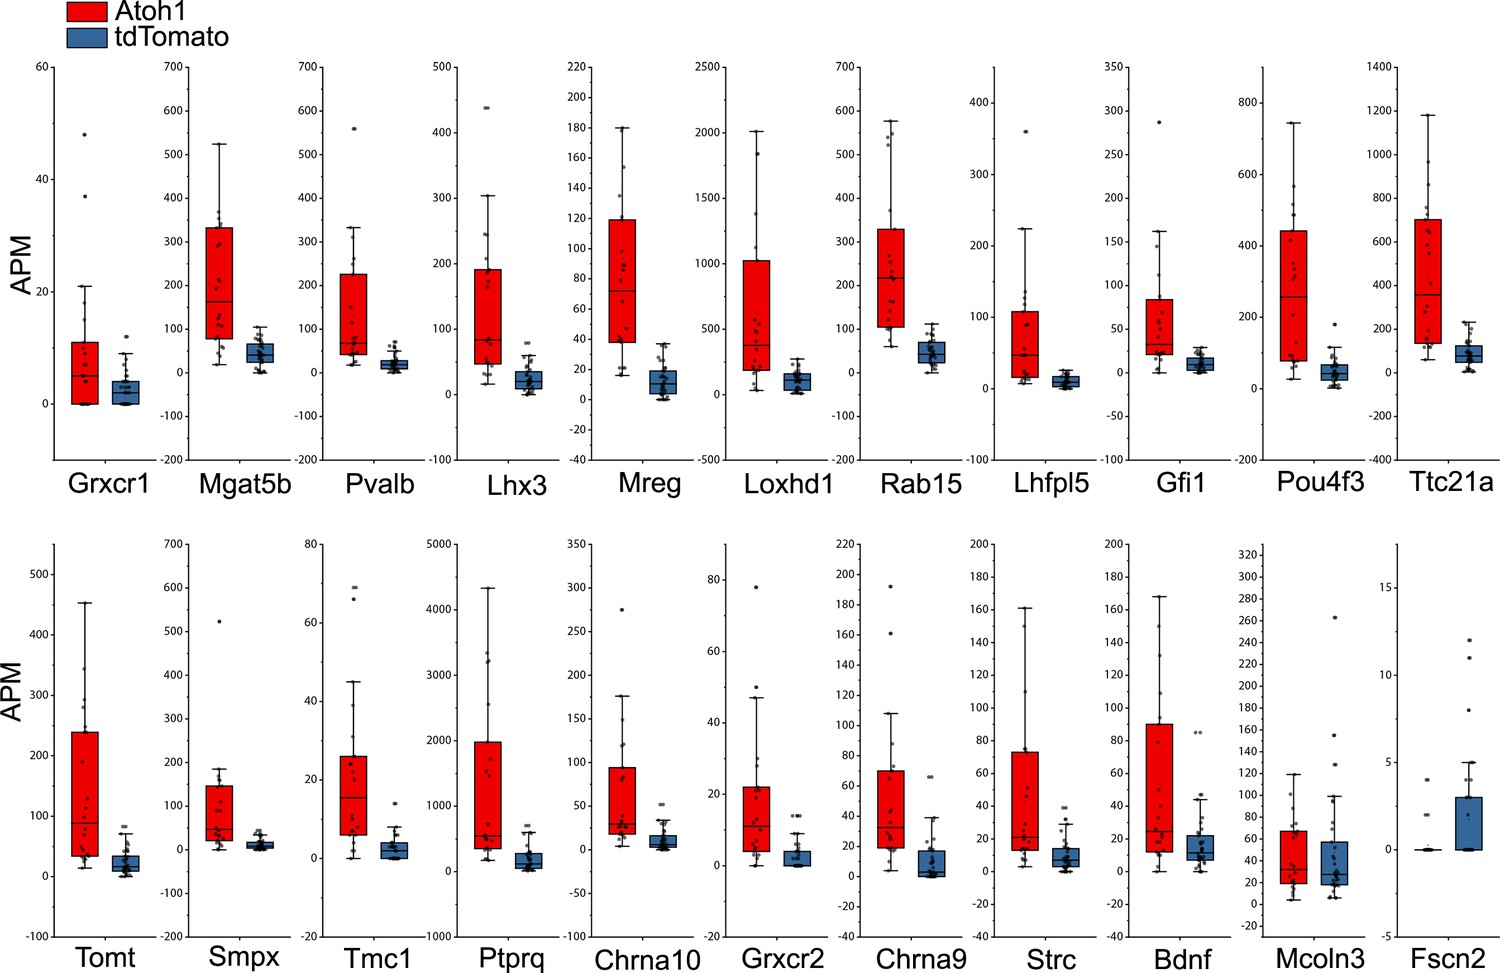
Ad-Atoh1 infected cells showed increased transcripts for many but not all verified hair cell genes.
Box-plot for verified hair cell specific genes among top 500 uHC enriched genes. APM: amplicon per million amplicons.
Figure 4—figure supplement 2
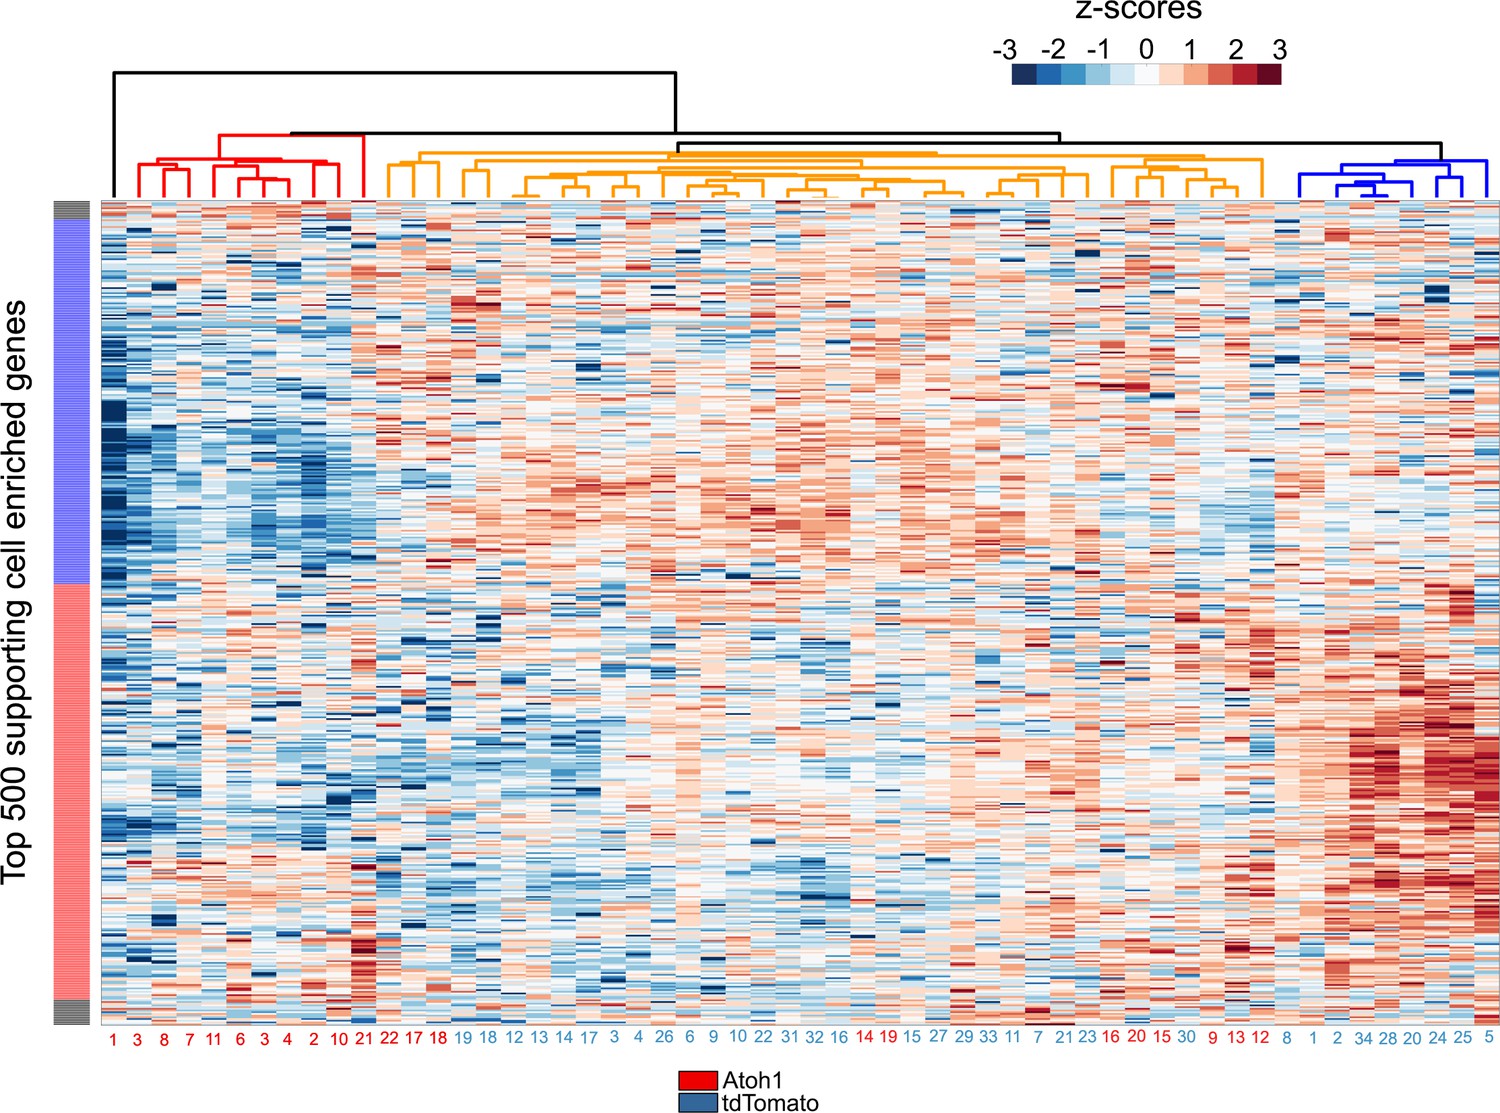
Single Cell RNA-seq analysis reveals Atoh1 transduction down-regulate supporting cell enriched genes.
Heat map shows hierarchical clustering of gene expression level between each single cells (Ad-tdTomato-Atoh1 infected cells labeled in red, and Ad-tdTomato infected supporting cell labeled in blue) for top 500 utricle supporting cell enriched genes. The color code on the left indicates suggested clustered genes population the hierarchical clustering of cells is shown by a dendrogram at the top of the panel.
Figure 5 with 3 supplements

ATAC-seq analysis shows hair cell gene loci are more accessible in utricle supporting cells compared to cochlear supporting cells.
(A) Example of ATAC-seq profiles for a hair cell-specific gene, Lhfpl5, that is not expressed in supporting cells. Peaks are present in the hair cell sample, but not the supporting cell sample B) Example of ATAC-seq profiles for a supporting cell-specific gene, Sox10, that is not expressed in hair cells. Peaks are present in the supporting cell sample, but not the hair cell sample. (C) Example of ATAC-seq profiles for a hair cell-specific gene, Chrna10, that is not expressed in supporting cells. A similar distribution of peaks is observed in utricle hair cells and supporting cells, but the peaks are absent in P21 cochlear supporting cells. (D) A heat map showing the correlation of ATAC-seq signals from utricle hair cells, supporting cells and P21 cochlear supporting cells. Peaks were grouped on the basis of their proximity to the transcriptional start site (TSS) or grouped as occurring in distal enhancers if they were located >2 kb away from the annotated TSS. Top, ATAC-seq signal (read depth) across putative hair cell gene promoters (n = 1549). High read intensity is shown in orange. Bottom, ATAC-seq signal (read depth) at more distal hair cell gene enhancers (n = 464). High read intensity is shown in blue.
Figure 5—figure supplement 1
ATAC-seq analysis shows hair cell gene loci are more accessible in utricle supporting cells compared to cochlear supporting cells.
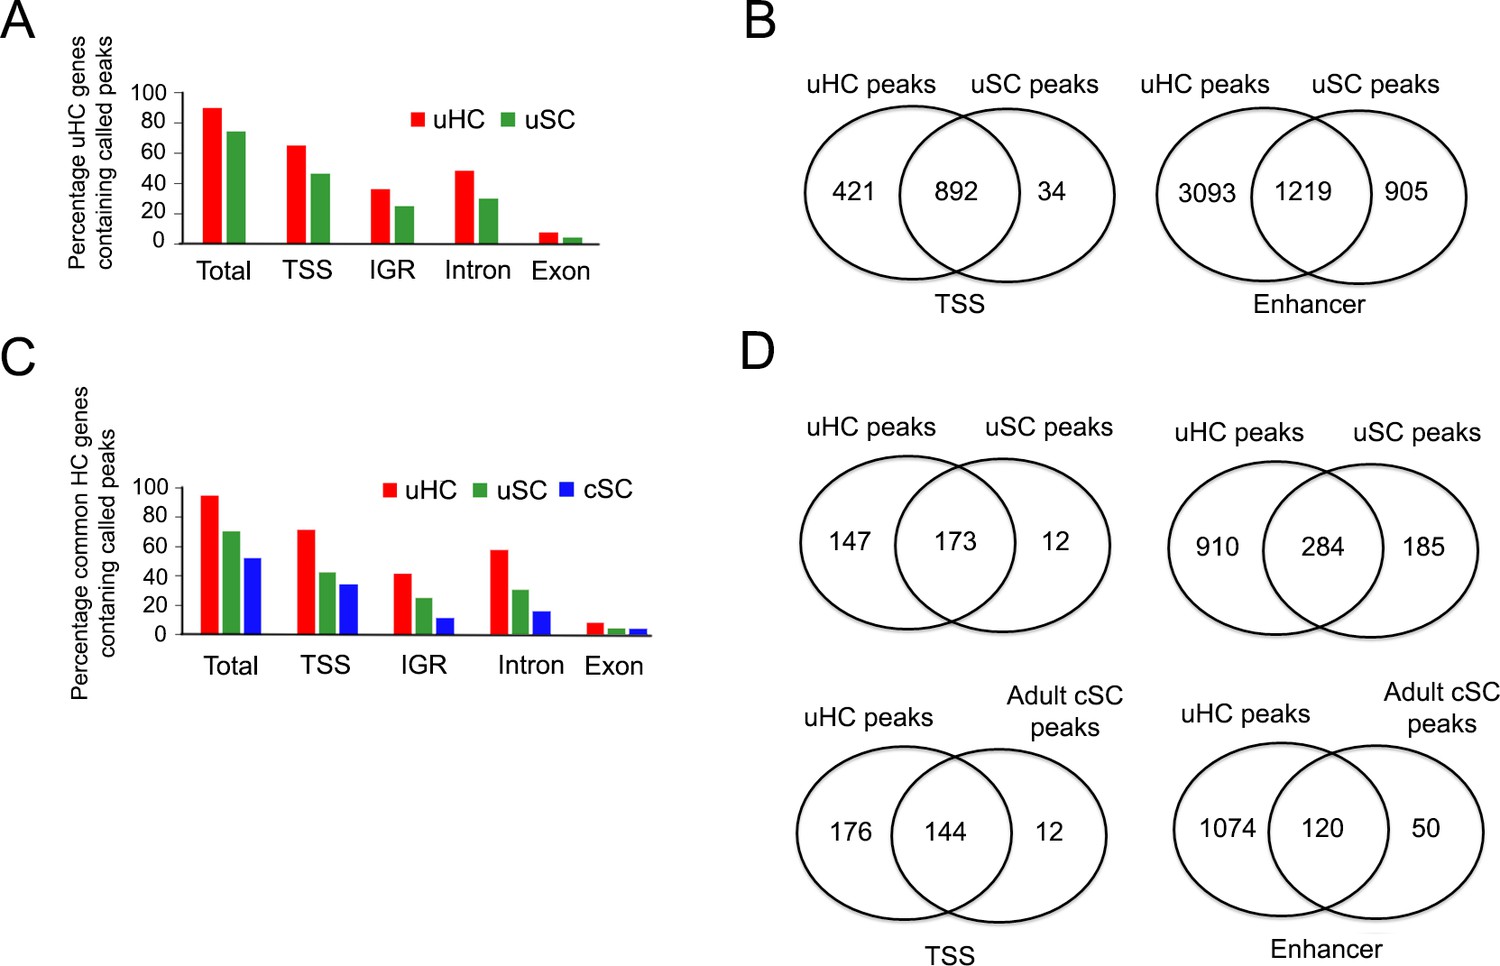
(A) Analysis of ATAC-seq data from 1912 utricle hair cell gene loci showing the proportion of loci containing accessible peaks in either utricle hair cells or utricle supporting cells. TSS: transcription start site, IGR: intergenic region. (B) A Venn diagram showing the number of called peaks that are unique or overlap between each condition for 1912 utricle hair cell specific genes. (C) Analysis of ATAC-seq data from 428 hair cell genes found in both cochlear and utricle hair cells, showing the proportion of loci containing accessible peaks in either utricle hair cells, utricle supporting cells or P21 cochlear supporting cells. TSS: transcription start site, IGR: intergenic region. (D) A Venn diagram showing the number of called peaks that are unique or overlap between each condition for 428 common hair cell specific genes.
Figure 5—figure supplement 2
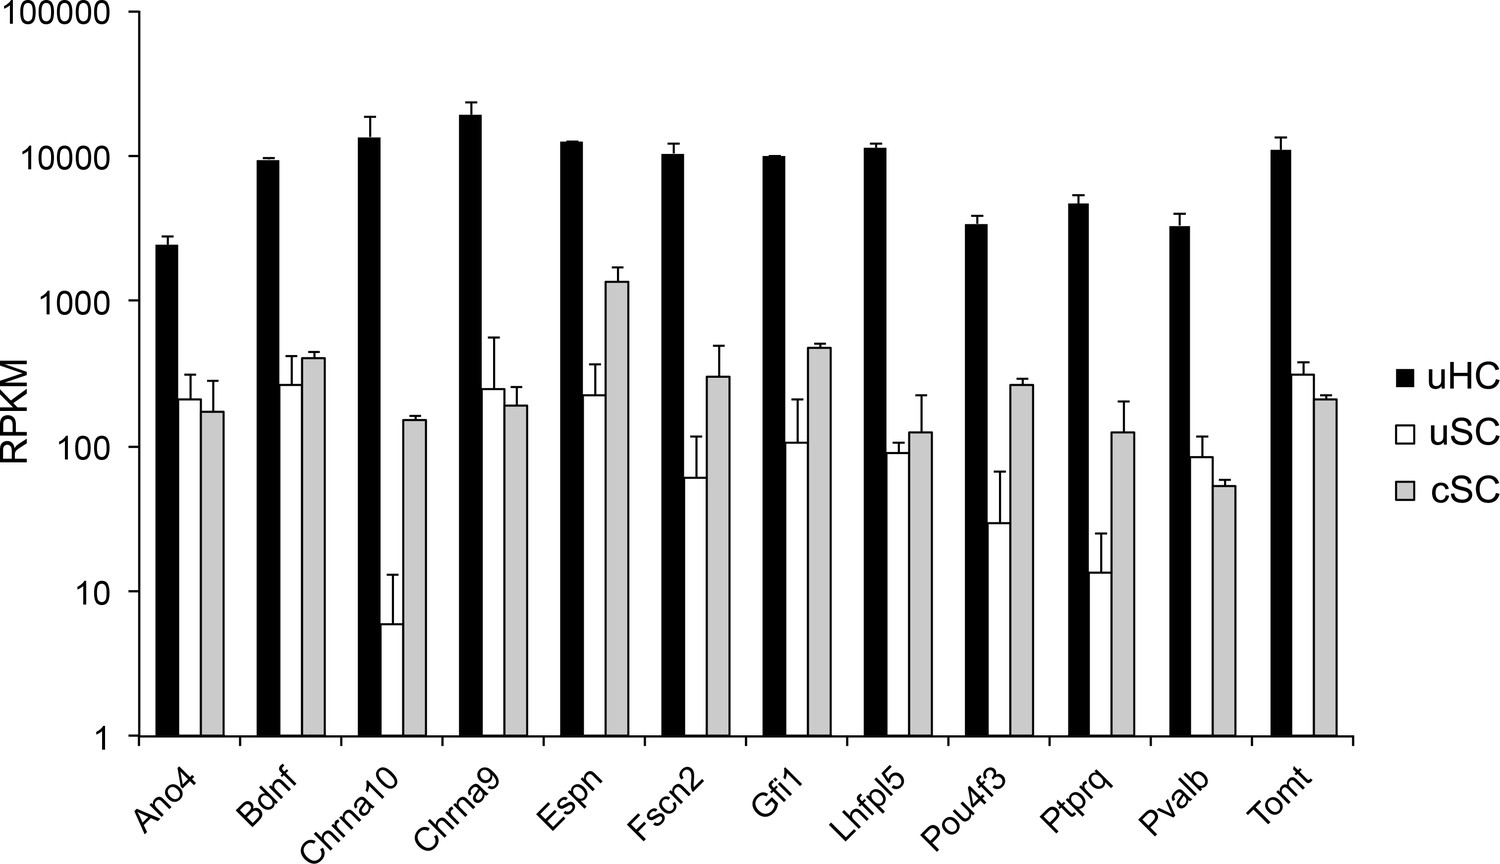
Expression level of hair cell specific genes in utricle hair cells, supporting cells and adult cochlear supporting cells.
The expression of 12 selected hair cell genes is shown as log10 RPKM expression values. In general, expression of hair cell-specific genes is 1–2 orders of magnitude lower in supporting cells than hair cells.
Figure 5—figure supplement 3
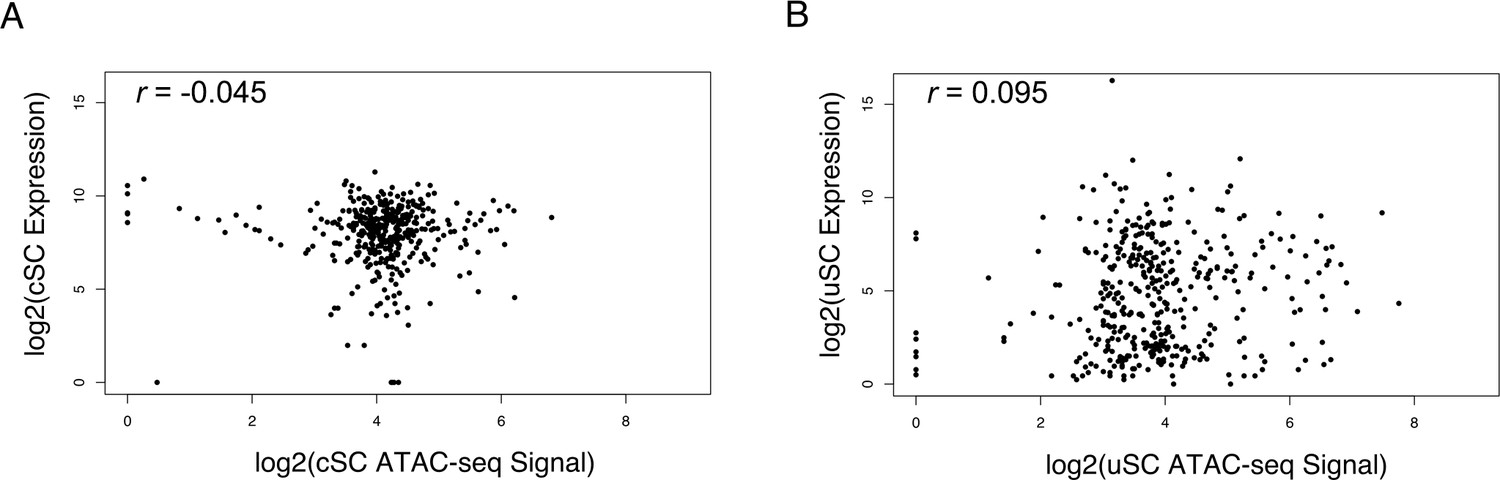
Global Expression and Chromatin Accessibility Correlation Analysis.
The expression levels and ATAC-seq peaks of hair cell-specific genes were correlated for (A) cochlear supporting cells, (B) utricle supporting cells. In both cases there was very low correlation between the expression levels of hair cell genes in supporting cells and the chromatin accessibility of hair cell gene loci.
Figure 6 with 4 supplements
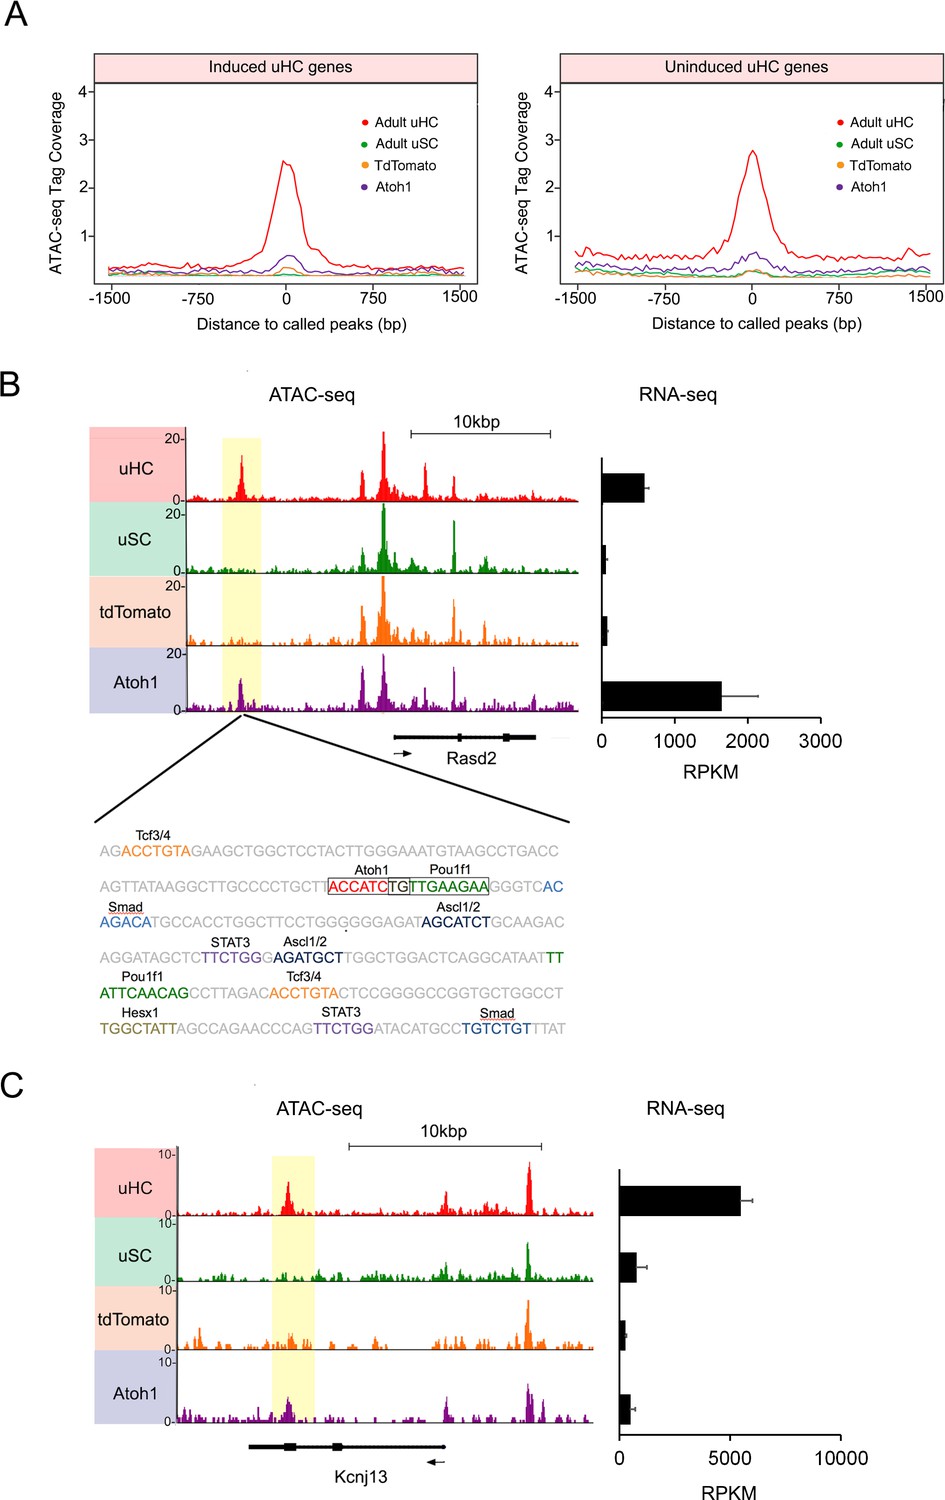
Atoh1 overexpression in utricle supporting cells can remodel chromatin of hair cell gene loci.
(A) Aggregation plot showing enrichment of ATAC-seq signals from each condition for unique utricle peaks that are assigned to the 945 hair cell genes that can be induced in supporting cells (left) or the 967 hair cell genes that cannot be induced in supporting cells (right). No significant differences are seen in the relative accessibility of these two groups of hair cell genes. (B) Example of an ATAC-seq profile for a hair cell-specific gene, Rasd2 that can be altered by Atoh1 transduction. RNA-seq analysis shows that Rasd2 is up-regulated in supporting cells by transduction with Atoh1, but not with the TdTomato control virus. A unique ATAC-seq peak present in hair cells but not supporting cells (yellow highlighting). However, the peak re-appears in supporting cells transduced with Atoh1, but not with the TdTomato control virus. The DNA sequence corresponding to this peak shows binding sites for Atoh1 along with other transcription factors. (C) Example of ATAC-seq profiles for a hair cell-specific gene, Kcnj13. RNA-seq analysis shows that Kcnj13is not up-regulated in supporting cells by transduction with Atoh1 or with the TdTomato control virus. Nevertheless, a unique ATAC-seq peak present in hair cells is re-opened in supporting cells transduced with Atoh1.
-
Figure 6—source data 1
Known motif analysis of transcription factor binding sites that are enriched in the accessible chromatin of utricle hair cells, utricle supporting cells, neonatal cochlear hair cells, Ad-tdTomato or Ad-Atoh1 infected supporting cells.
- https://doi.org/10.7554/eLife.44328.024
Figure 6—figure supplement 1
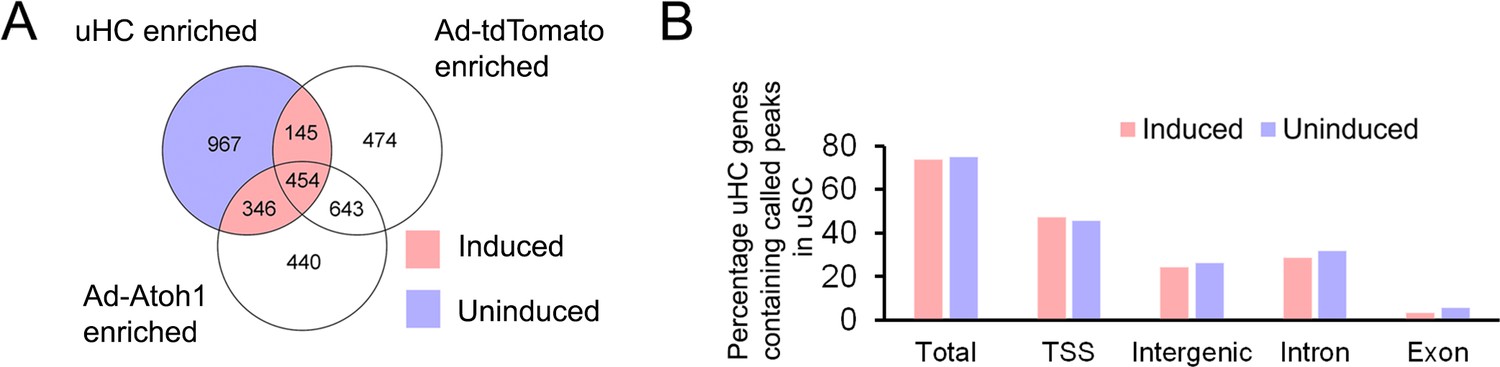
Analysis of hair cell gene up-regulation in supporting cells.
(A) Venn diagram showing identification of hair cell genes that are up-regulated in supporting cells by Atoh1 transduction (945 genes) compared to hair cell genes that failed to be activated by Atoh1 (967 genes). (B) Analysis of ATAC-seq data from 1912 utricle hair cell gene loci showing the proportion of loci containing accessible peaks in genes that were induced by Atoh1 versus those that were not induced by Atoh1. TSS: transcription start site.
Figure 6—figure supplement 2
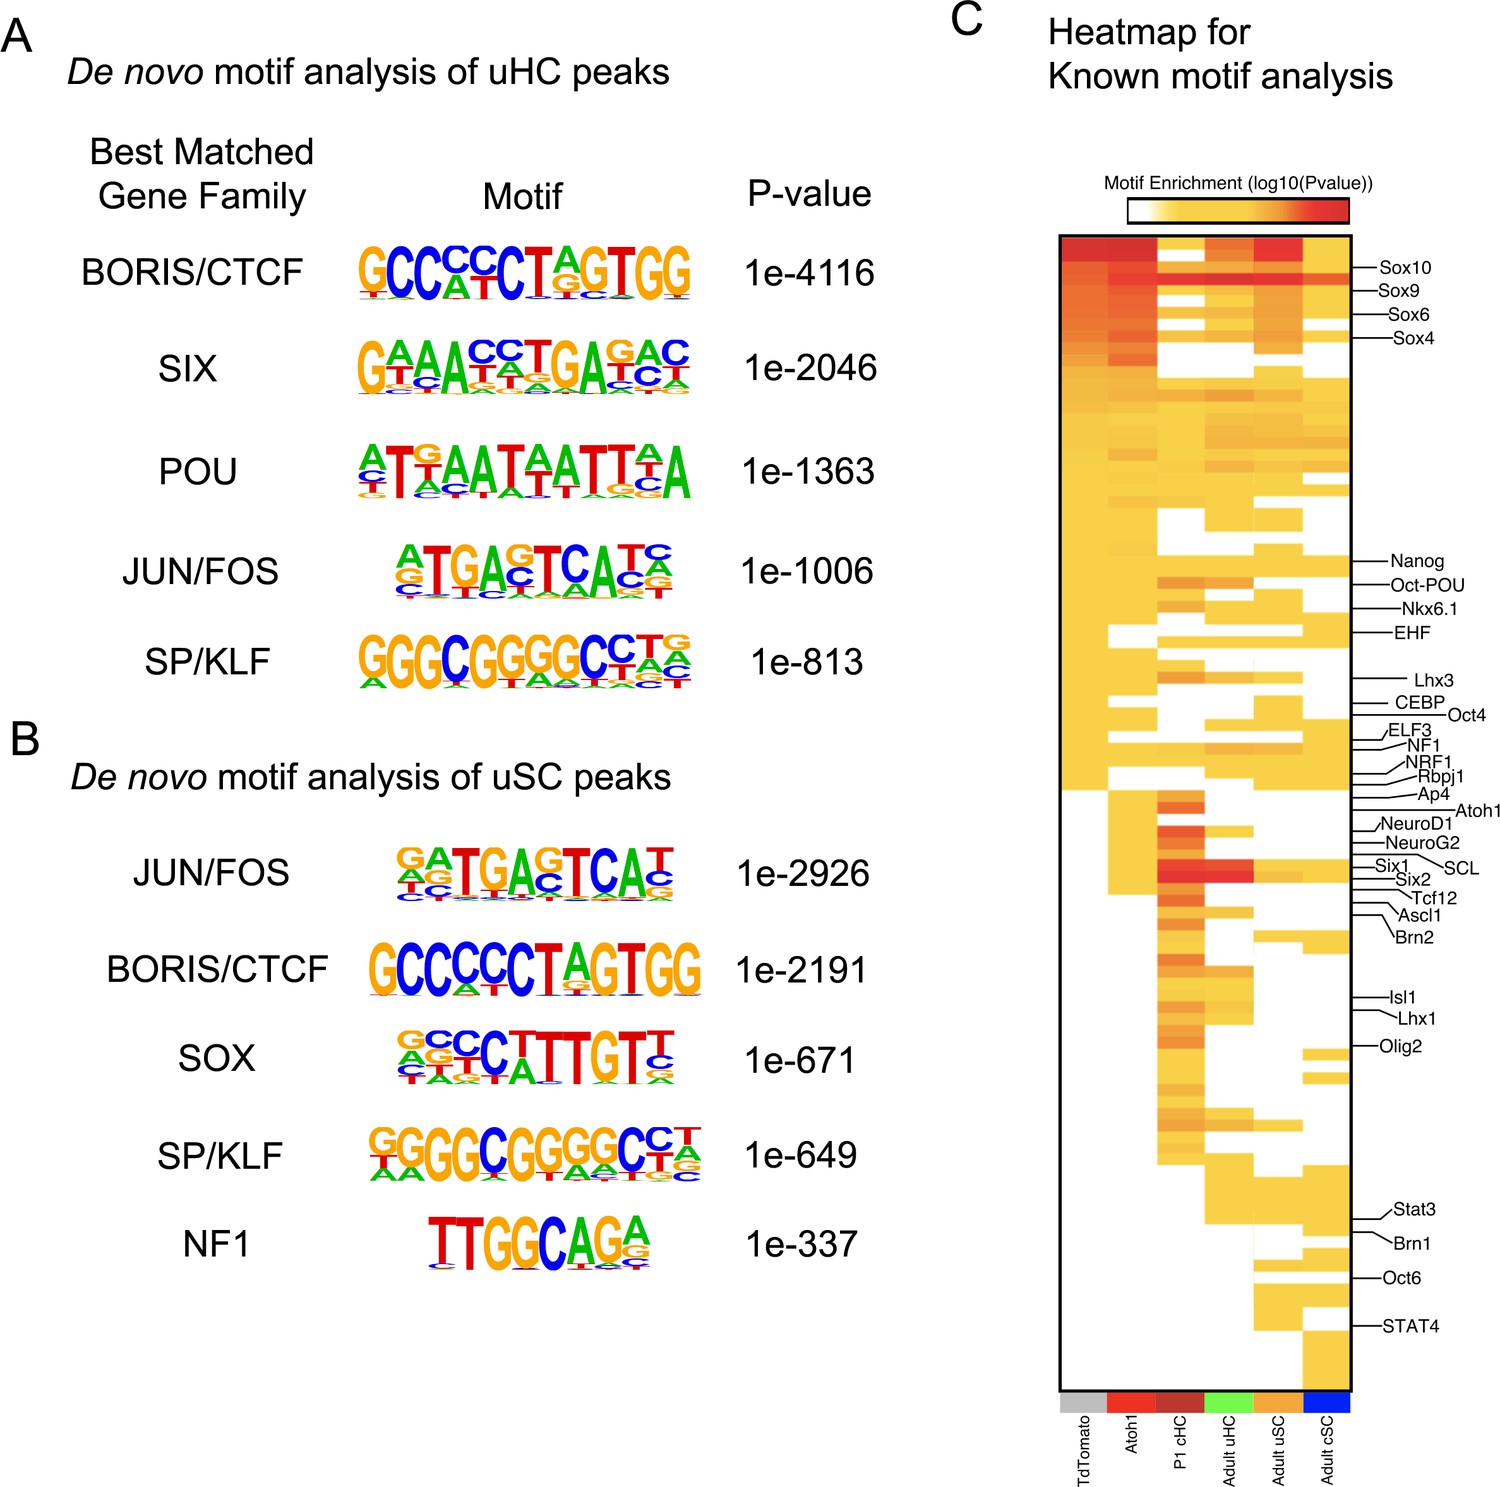
Motif enrichment analysis showing of utricle hair cells and supporting cells, and changes induced by Atoh1 transduction.
(A) De novo motif analysis of all called ATAC-seq peaks from purified utricle hair cells. The top five transcription factor binding motifs discovered in the peaks are shown. Note that Atoh1 is not expressed in mature hair cells, therefore Atoh1 binding motifs were not significantly present in the utricle hair cell peaks. (B) De novo motif analysis of all called ATAC-seq peaks from purified utricle supporting cells. The top five transcription factor binding motifs discovered in the peaks are shown. (C) Heat map showing the relative enrichment of transcription factor binding motifs in called ATAC-seq peaks in utricle hair cells, utricle supporting cells, neonatal (P1) cochlear hair cells, neonatal (P1) cochlear supporting cells, adult (P21) cochlear supporting cells and utricle supporting cells infected with either Ad-tdTomato or Ad-Atoh1. Atoh1 transduction causes an increase in accessible peaks enriched for binding sites in Atoh1 itself (Figure 6C), NeuroD1, Neurog2, SCL, Six1, Six2 and Tcf12.
Figure 6—figure supplement 3
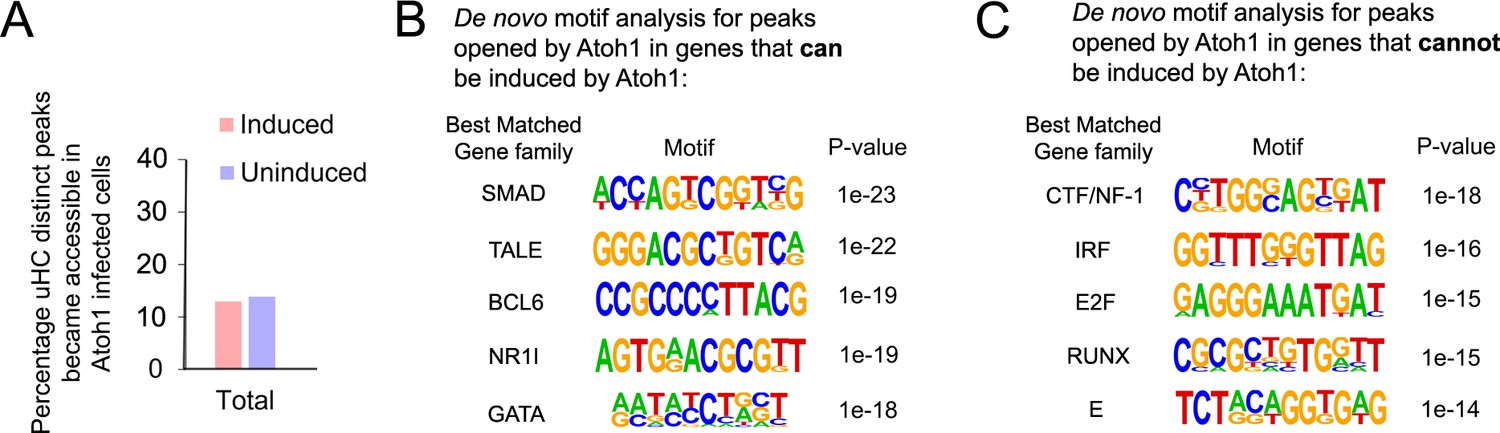
Atoh1 overexpression induced chromatin accessibility is independent for up regulation of hair cell genes in supporting cells.
(A) Quantification of percentage of utricle hair cells specific peaks became accessible in Ad-Atoh1 infected supporting cells for induced or uninduced uHC genes’ loci. (B) De novo motif analysis identified transcription factor binding sites in the utricle hair cell-specific accessible chromatin that became accessible and were expressed in Ad-Atoh1 infected supporting cells. (C) De novo motif analysis also identified transcription factor binding sites in the utricle hair cell specific accessible chromatin that became accessible in Ad-Atoh1 infected supporting cells, but whose associated genes were not expressed after Atoh1 transduction.
Figure 6—figure supplement 4

Atoh1 Overexpression Promotes Ectopic Peak Activation Proximal to Hair Cell Genes.
(A) Venn diagram showing the overlap of Atoh1-motif containing peaks identified proximal to HC genes activated by Ad-Atoh1 for uHCs and Ad-Atoh1 cells. (B) Heatmap showing ATAC-seq signal across the peaks shown in (A).
Additional files
-
Transparent reporting form
- https://doi.org/10.7554/eLife.44328.025
Download links
A two-part list of links to download the article, or parts of the article, in various formats.
Downloads (link to download the article as PDF)
Open citations (links to open the citations from this article in various online reference manager services)
Cite this article (links to download the citations from this article in formats compatible with various reference manager tools)
Transcriptomic and epigenetic regulation of hair cell regeneration in the mouse utricle and its potentiation by Atoh1
eLife 8:e44328.
https://doi.org/10.7554/eLife.44328


