The quantity of CD40 signaling determines the differentiation of B cells into functionally distinct memory cell subsets
- Tokyo University of Science, Japan
Figures
Figure 1 with 1 supplement
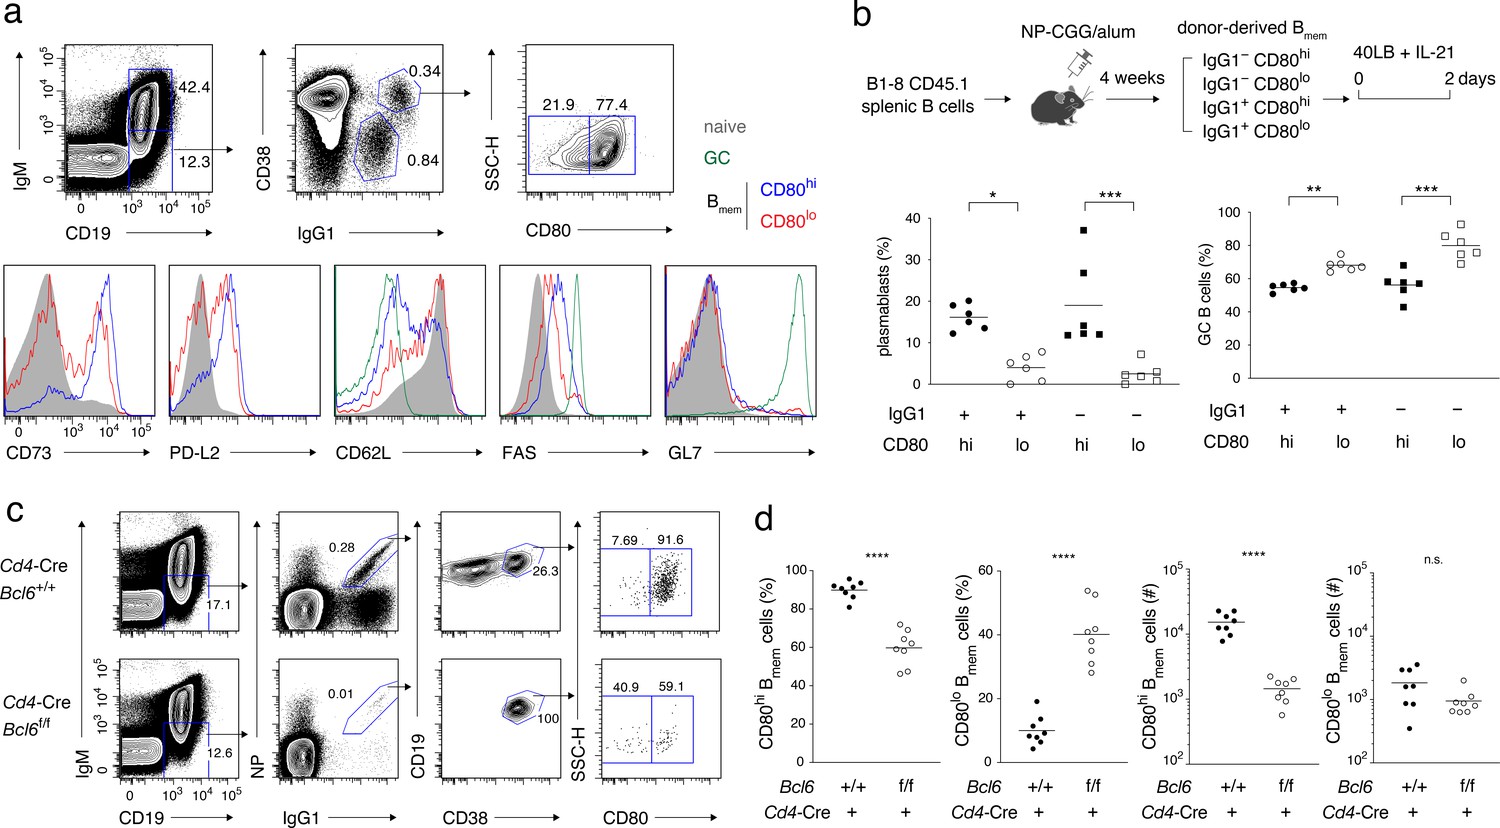
Characterization of CD80hi and CD80lo memory B cells.
(a) Splenocytes from B6 mice immunized with NP-CGG in alum 4 weeks earlier were analyzed by flow cytometry (FCM). The gating strategy for naïve B cells (CD19+ IgM+), GC B cells (CD19+ IgM− IgG1+ CD38−), and CD80lo and CD80hi Bmem cells (CD19+ IgM− IgG1+ CD38+) is shown in the top panels, and the expression of the indicated cell-surface proteins in each population is shown in the bottom panels. Data are representative of two independent experiments with similar results. (b) Outline of the experimental protocol (top). Splenic B cells from CD45.1 B1-8 ki mice were transferred into B6 mice (CD45.2), which were then immunized with NP-CGG in alum. Four weeks later, four subsets of donor-derived Bmem cells (CD45.1+ CD19+ CD38+), defined by the expression of IgG1 and CD80, were sorted from recipient spleens, cultured on 40LB feeder layers with IL-21 for 2 days, and analyzed by FCM. The frequency of CD138+ GL7− plasmablasts or PCs and CD138− GL7+ GC B cells in each subset is represented by a dot (bottom; combined data from two triplicate experiments). (c) Splenocytes from Cd4-Cre, Bcl6+/+ or Bcl6f/f mice immunized with NP-CGG in alum 6 weeks earlier were analyzed by FCM. The representative data indicate the gating strategy with percentages of the gated population. (d) The frequency (%) and absolute number (#) of CD80hi and CD80lo cells among IgG1+ Bmem cells in each spleen from individual recipient mice, as analyzed in (c) (n = 8). The mean of the values in each group is indicated by a horizontal bar (b, d). n.s., not significant (p>0.05); *, p<0.05; ***, p<0.001; ****, p<0.0001; as determined by one-way ANOVA followed by Tukey’s multiple comparisons test (b) and unpaired Student’s t test (d). All data are representative of two independent experiments, except (b and d), where data from two independent experiments are combined.
-
Figure 1—source data 1
Source data for Figure 1b and d.
- https://doi.org/10.7554/eLife.44245.004
Figure 1—figure supplement 1
Supplementary data for Figure 1.
(a) Sorting strategy for Figure 1b. Splenic B cell from CD45.1 B1-8 ki mice were transferred into B6 mice (CD45.2), which were then immunized with NP-CGG in alum. Four weeks later, donor-derived cells were enriched from pooled splenocytes by magnetic sorting, and further sorted into four Bmem cell subsets, as described in the text. (b) Gating strategy for Figure 1b. Four Bmem subsets, sorted as above, were cultured on 40LB feeder layers with IL-21 for 2 days, and analyzed by FCM. Feeder cells were gated out as CD45.1–cells. The expression of GL7 and CD138 in CD45.1+ cells is shown.
Figure 2 with 1 supplement
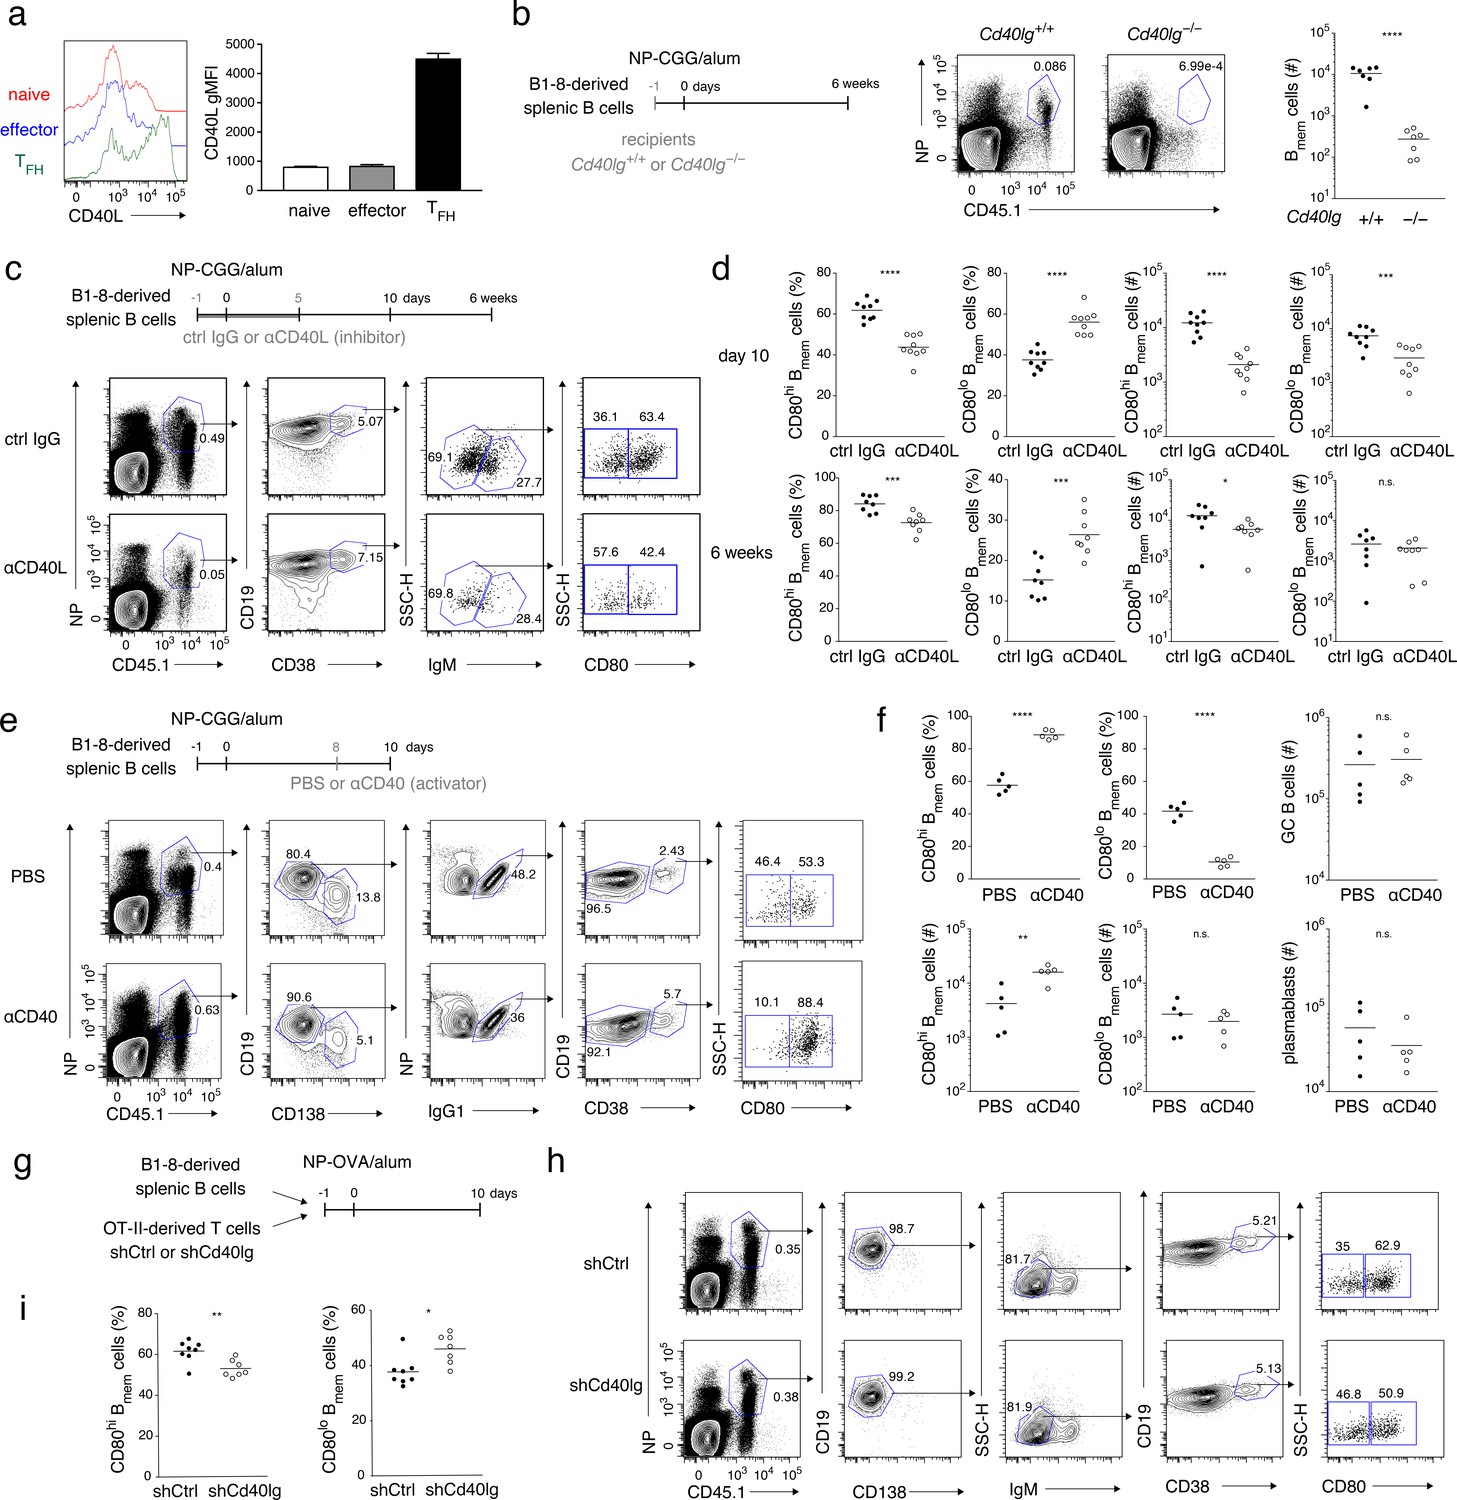
Strong CD40 signaling favors CD80hi Bmem cell development.
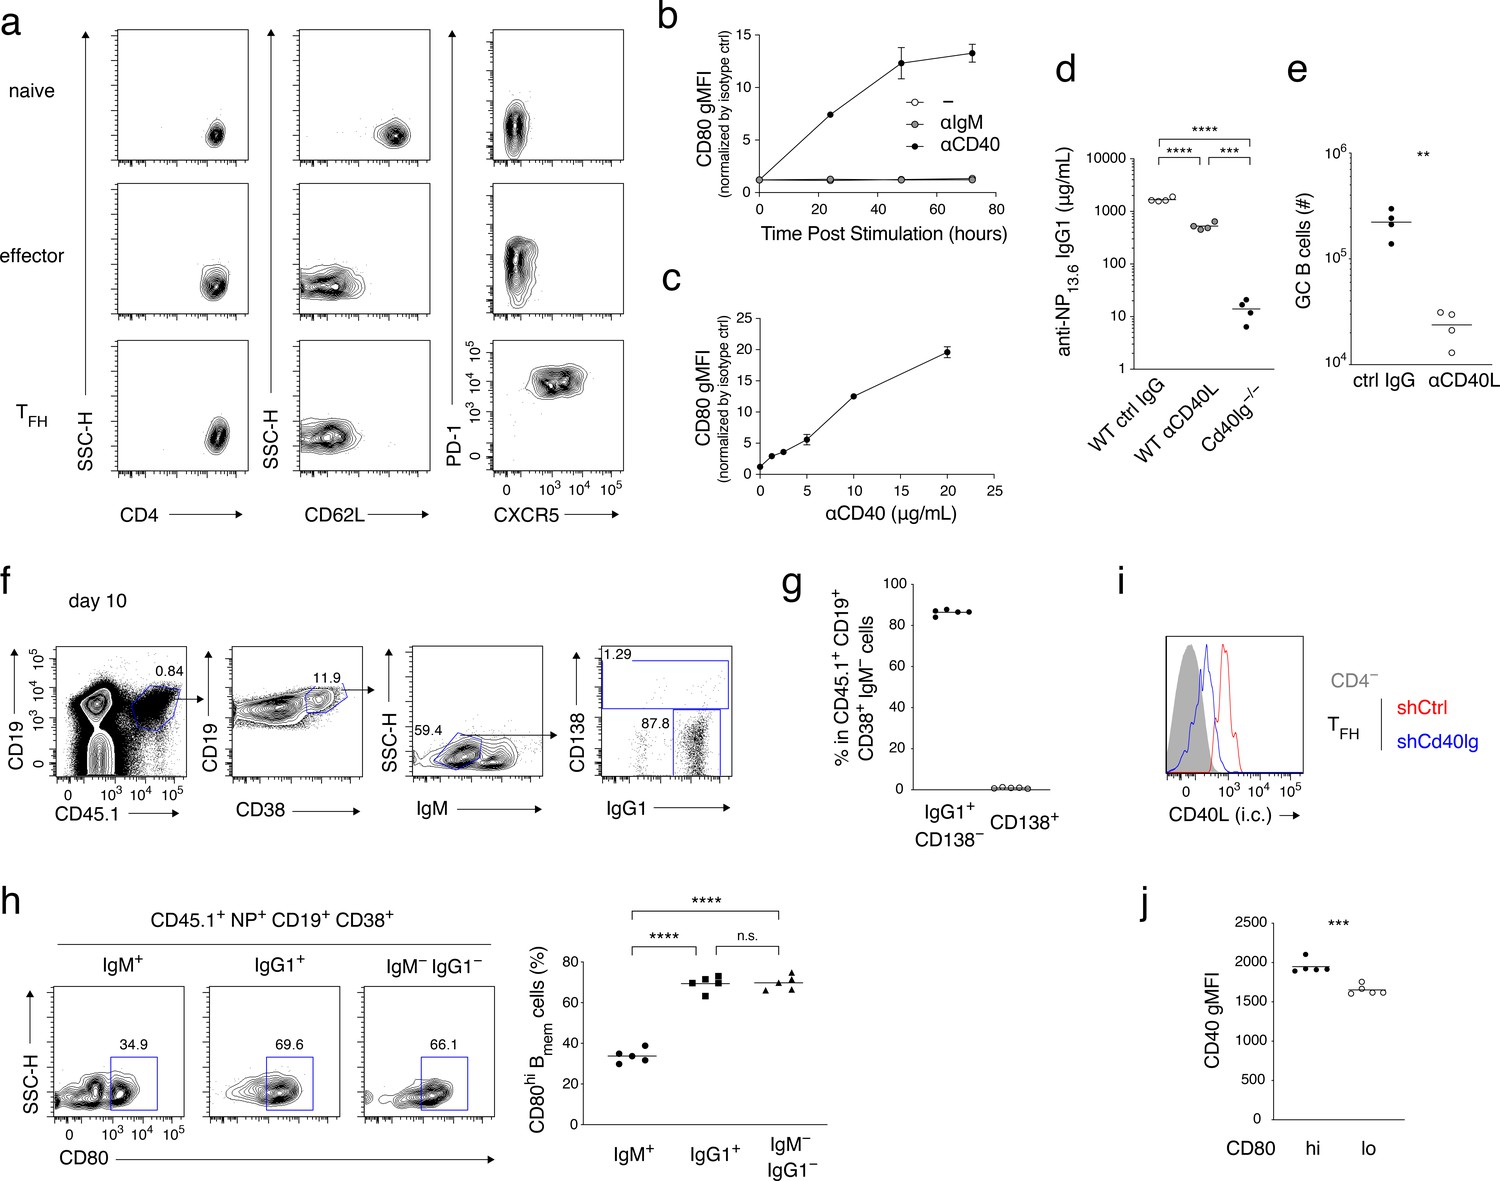
(a) Naïve T (CD4+ CD62L+ CXCR5− PD-1−), effector T (CD4+ CD62L− CXCR5− PD-1−), and TFH (CD4+ CD62L− CXCR5+ PD-1+) cells were sorted from spleens of mice immunized with NP-CGG in alum 7 days earlier and then stimulated with phorbol myristate acetate (PMA) and ionomycin for 2 hr. CD40L expression on each cell subset was analyzed by FCM (left) and represented as geometric mean fluorescence intensity (gMFI, right) (mean + s.d. of triplicates). (b) Cd40lg+/+ or Cd40lg−/− mice were transferred with splenic B cells from B1-8 ki mice, and immunized with NP-CGG in alum. Six weeks later, the frequency of donor-derived (CD45.1+) NP+ CD19+ B cells (representative data on the left) and the number of the donor-derived Bmem cells (CD19+ CD45.1+ NP+ CD38+; plotted on the right; n = 7) in each spleen were analyzed by FCM. (c, d) B6 mice were transferred with splenic B cells from B1-8 ki mice, immunized with NP-CGG in alum, and injected subcutaneously (s.c.) with an inhibitory CD40L (MR-1: 1 mg/kg) mAb (αCD40L) or an isotype-matched control (ctrl IgG) Ab every day from day −1 to day 5 after immunization. Ten days or 6 weeks after immunization, splenocytes of the recipient mice were analyzed by FCM. (c) Representative data (day 10) of the analysis showing the gating strategy. (d) The frequency (%) of CD80hi and CD80lo cells in the donor-derived, class-switched Bmem cells (CD45.1+ NP+ CD19+ CD38+ IgM−), and their absolute numbers (#) at 10 days (top, n = 9) and 6 weeks (bottom, n = 8) after immunization are plotted. (e, f) B6 mice transferred with B1-8 ki B cells and immunized as in (c, d) were injected intraperitoneally (i.p.) with PBS or a stimulatory CD40 mAb (αCD40) (FGK4.5: 250 μg) at 8 days after immunization. Ten days after immunization, splenocytes from the recipient mice were analyzed by FCM. (e) Representative data of the analysis showing the gating strategy. (f) The frequency (%) and absolute numbers (#) of CD80hi and CD80lo cells in the donor-derived, IgG1+ Bmem cells (CD45.1+ NP+ CD138– CD19+ IgG1+ CD38+), and the numbers of the donor-derived GC B cells (CD45.1+ NP+ CD19+ IgG1+ CD38−) or of plasmablasts (CD45.1+ NP+ CD138+) in splenocytes are plotted (n = 5). (g–i) B6 mice, co-transferred on day −1 with B1-8 ki B cells (1 × 10⁵) and OT-II T cells (1 × 10⁵) that had been transduced with control (shCtrl) or shCd40lg retroviral vectors on the previous day, were immunized with NP-OVA in alum. Ten days after immunization, spleen cells from the recipient mice were analyzed by FCM. (g) Outline of the experimental protocol. (h) Representative data showing the gating strategy. (i) The frequencies of CD80hi and CD80lo cells among the donor-derived, class-switched Bmem cells, defined as in (d) (n = 8). The mean of the values in each group is indicated by a horizontal bar (b, d, f, i). n.s., not significant (p>0.05); *, p<0.05; **, p<0.01; ***, p<0.001; ****, p<0.0001; unpaired Student’s t test (b, d, f, i). All data are representative of two independent experiments except (b) and (i), where data from two independent experiments are combined.
-
Figure 2—source data 1
Source data for Figure 2b, d, f and i.
- https://doi.org/10.7554/eLife.44245.007
Figure 2—figure supplement 1
Supplementary data for Figure 2.
(a) Naïve T (CD4+ CD62L+ CXCR5− PD-1−), effector T (CD4+ CD62L− CXCR5− PD-1dull), and TFH (CD4+ CD62L− CXCR5+ PD-1+) cells were sorted from spleen of mice immunized 10 days previously, for the experiments whose results are summarized in Figure 2a. The FCM profiles that are shown demonstrate the purity of the sorted fractions. (b) Naïve B cells were cultured with anti-CD40 Ab (10 μg/ml), anti-IgM Ab (10 μg/ml), or medium alone, for the indicated length of time, then stained with anti-CD80 antibody, and analyzed by FCM. gMFI of the CD80 staining was normalized to that of staining with isotype-matched control Ab. Mean ± s.d. of triplicates. (c) Naïve B cells were cultured with the indicated concentration of anti-CD40 Ab for 3 days, and analyzed as in (b). Mean ± s.d. of triplicates. (d) The concentration of anti-NP13.6 IgG1 Ab in the sera at 10 days after the immunization of the mice shown in Figure 2c,d and Figure 2b (Cd40lg−/− recipients) (n = 4). (e) Absolute number (#) of GC B cells (CD45.1+ NP+ CD19+ CD38−) in the spleens at 10 days after immunization of the mice shown in Figure 2c,d (n = 4). (f–h) Splenic B cells from CD45.1 B1-8 ki mice were transferred into B6 mice (CD45.2), which were then immunized with NP-CGG in alum. Splenocytes from the recipient mice at day 10 after immunization were analyzed by FCM. (f) Gating strategy for (g). (g) The frequency (%) of IgG1+ CD138− and CD138+ cells in CD45.1+ CD19+ CD38+ IgM− cells (n = 5). (h) Representative FCM data showing the expression of CD80 (left) and the frequency (%) of CD80hi cells (right; n = 5) in Bmem cells (CD45.1+ NP+ CD19+ CD38+) of the indicated isotype. (i) Knock-down efficiency of shCd40lg vector in TFH cells. Intracellular (i.c.) CD40L expression in shCtrl- or shCd40lg-transduced TFH cells and CD4− cells in the mice described in Figure 2g–i was analyzed by FCM. (j) CD40 expression on CD80hi and CD80lo Bmem cells (CD45.1+ NP+ CD19+ CD38+ IgM−) was analyzed by FCM at day 10 after immunization. gMFI of the CD40 staining is plotted (n = 5).
Figure 3 with 1 supplement
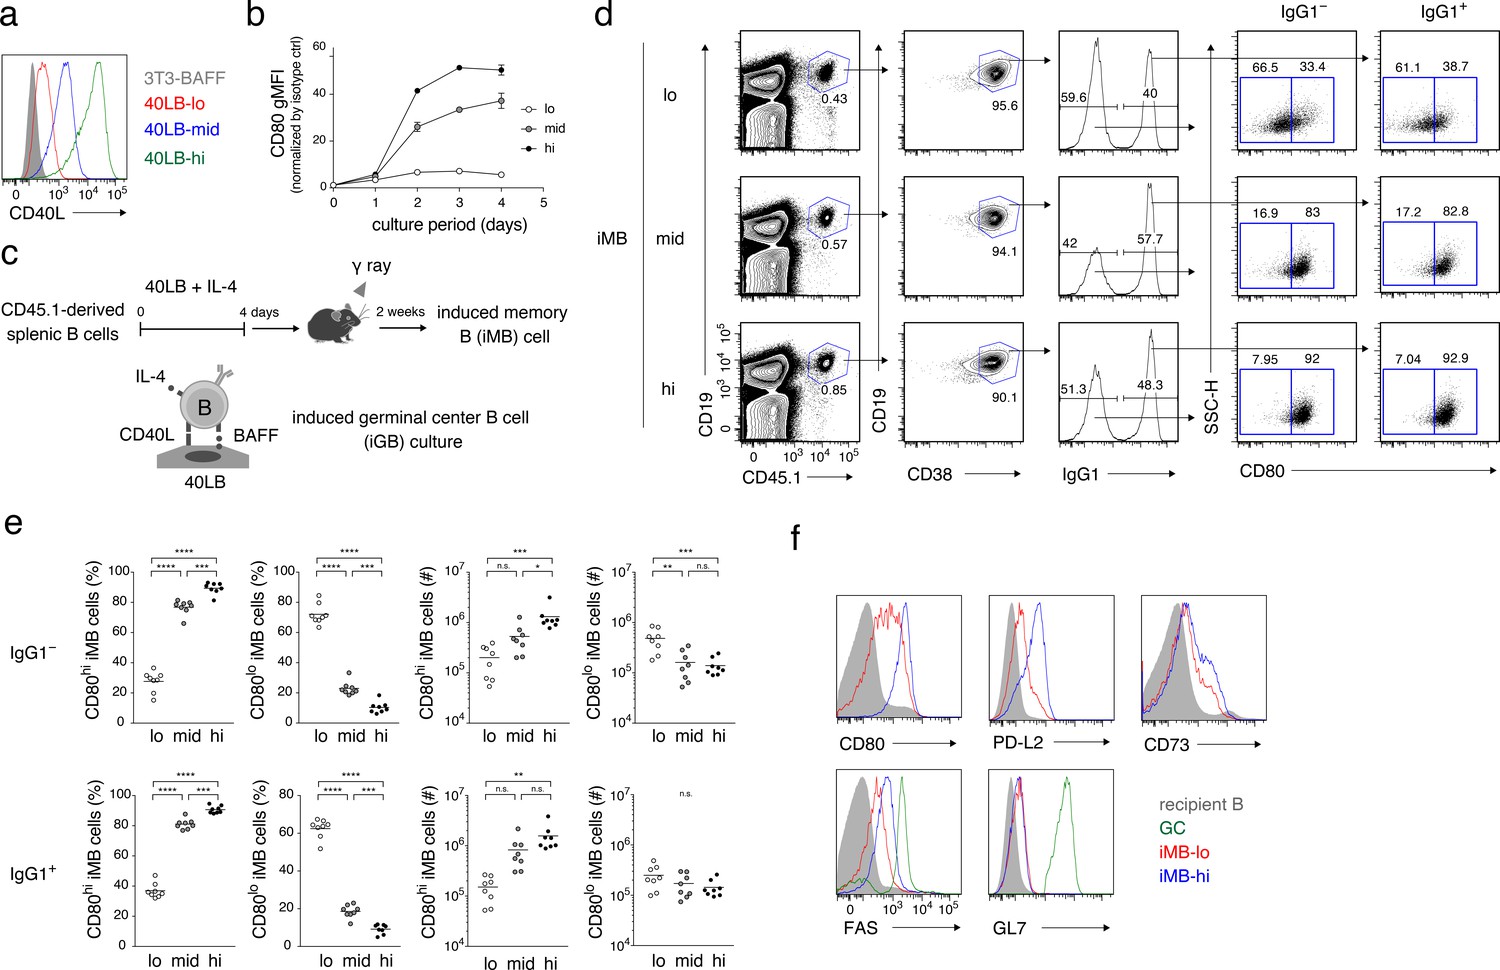
The quantity of CD40 signaling determines the differentiation of B cells into distinct Bmem cell subsets.
(a) Expression of CD40L on 3T3-BAFF cells and 40LB sublines (40LB-lo, 40LB-mid, and 40LB-hi) was analyzed by FCM. (b) Splenic B cells were cultured with IL-4 for the indicated number of days on feeder layers of each 40LB subline. The expression of CD80 on the expanded B (iGB) cells was analyzed by FCM and presented as gMFI (mean of triplicates). (c) A schematic representation of a method used to generate the induced memory B (iMB) cells. Splenic B cells from CD45.1+ congenic B6 mice were cultured for 4 days, as in (b). The resultant iGB-lo, iGB-mid, or iGB-hi cells were transferred intravenously (i.v.) into γ-irradiated mice (CD45.2+), and the donor-derived Bmem-like cells (CD19+ CD45.1+ CD38+) detected in the recipient spleens 2 weeks after the transfer were designated iMB-lo, iMB-mid or iMB-hi cells, respectively. (d–f) Expression of CD80 on IgG1+ or IgG1– iMB cells (iMB-lo, iMB-mid or iMB-hi) generated as in (c) was analyzed by FCM. (d) Representative data showing the gating strategy. (e) The frequencies of CD80hi and CD80lo cells among the IgG1+ or IgG1– iMB cells (%) and their absolute number per spleen (#) are plotted (n = 8). (f) Expression of the indicated surface markers on the recipient total B cells (CD45.1− CD19+), spontaneous GC B cells (CD45.1− CD19+ CD38− GL7+), the iMB-lo and the iMB-hi cells (CD19+ CD45.1+ CD38+). The mean of the values in each group is indicated by a horizontal bar (e). n.s., not significant (p>0.05); *, p<0.05; **, p<0.01; ***, p<0.001; ****, p<0.0001; as determined by one-way ANOVA followed by Tukey’s multiple comparisons test (e). All data are representative of two independent experiments except (e), where data from two independent experiments are combined.
-
Figure 3—source data 1
Source data for Figure 3b and e.
- https://doi.org/10.7554/eLife.44245.010
Figure 3—figure supplement 1
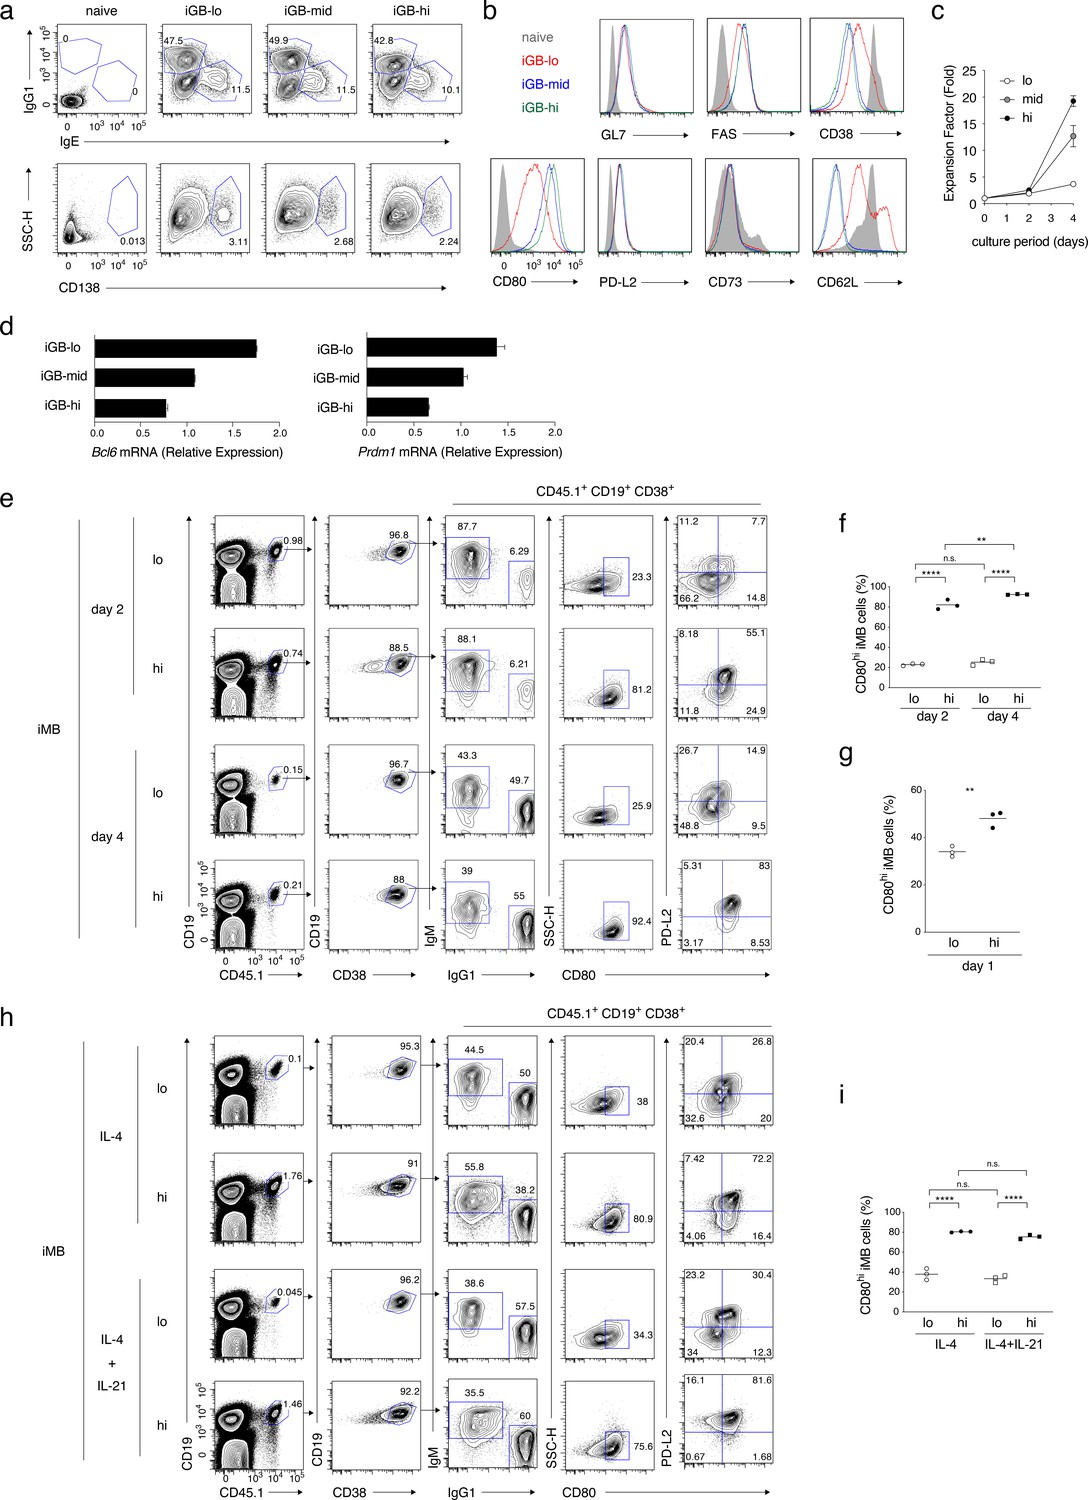
Cellular phenotype, proliferation capacity, gene expression, and differentiation fate of each type of iGB cells.
(a) The frequencies of IgG1+ vs IgE+ cells, or of CD138+ cells, in naïve and the indicated iGB cells on day 4 of culture. (b) The expression of the indicated protein on naïve and the indicated iGB cells. (c) Cumulative fold increasein the numbers of B cells cultured on the feeder layer of each 40LB subline (hi, mid, lo). (d) qRT-PCR analysis of the expression of Bcl6 and Prdm1 mRNAs in the indicated iGB cells (mean + s.d. of triplicates). (e, f) iGB-lo and iGB-hi cells on day 2 or day 4 of the culture were transferred into irradiated B6 mice to generate iMB cells. Two weeks later, spleen cells of the recipient mice were analyzed by FCM. (e) A representative FCM data showing the gating strategy. (f) The frequency (%) of CD80hi cells in iMB cells (CD19+ CD45.1+ CD38+) derived from the iGB-lo and iGB-hi cells on day 2 or day 4 (n = 3). (g) The frequency (%) of CD80hi cells in iMB cells derived from iGB cells cultured for 1 day on 40LB-lo or 40LB-hi feeder cells (n = 3). (h, i) iMB cells were generated from iGB-lo and iGB-hi cells that were cultured with IL-4 and IL-21, or IL-4 alone, for 4 days. (h) Representative FCM data showing the gating strategy. (i) The frequency (%) of CD80hi cells among the iMB cells derived from the iGB cells cultured in the indicated condition.
Figure 4 with 1 supplement
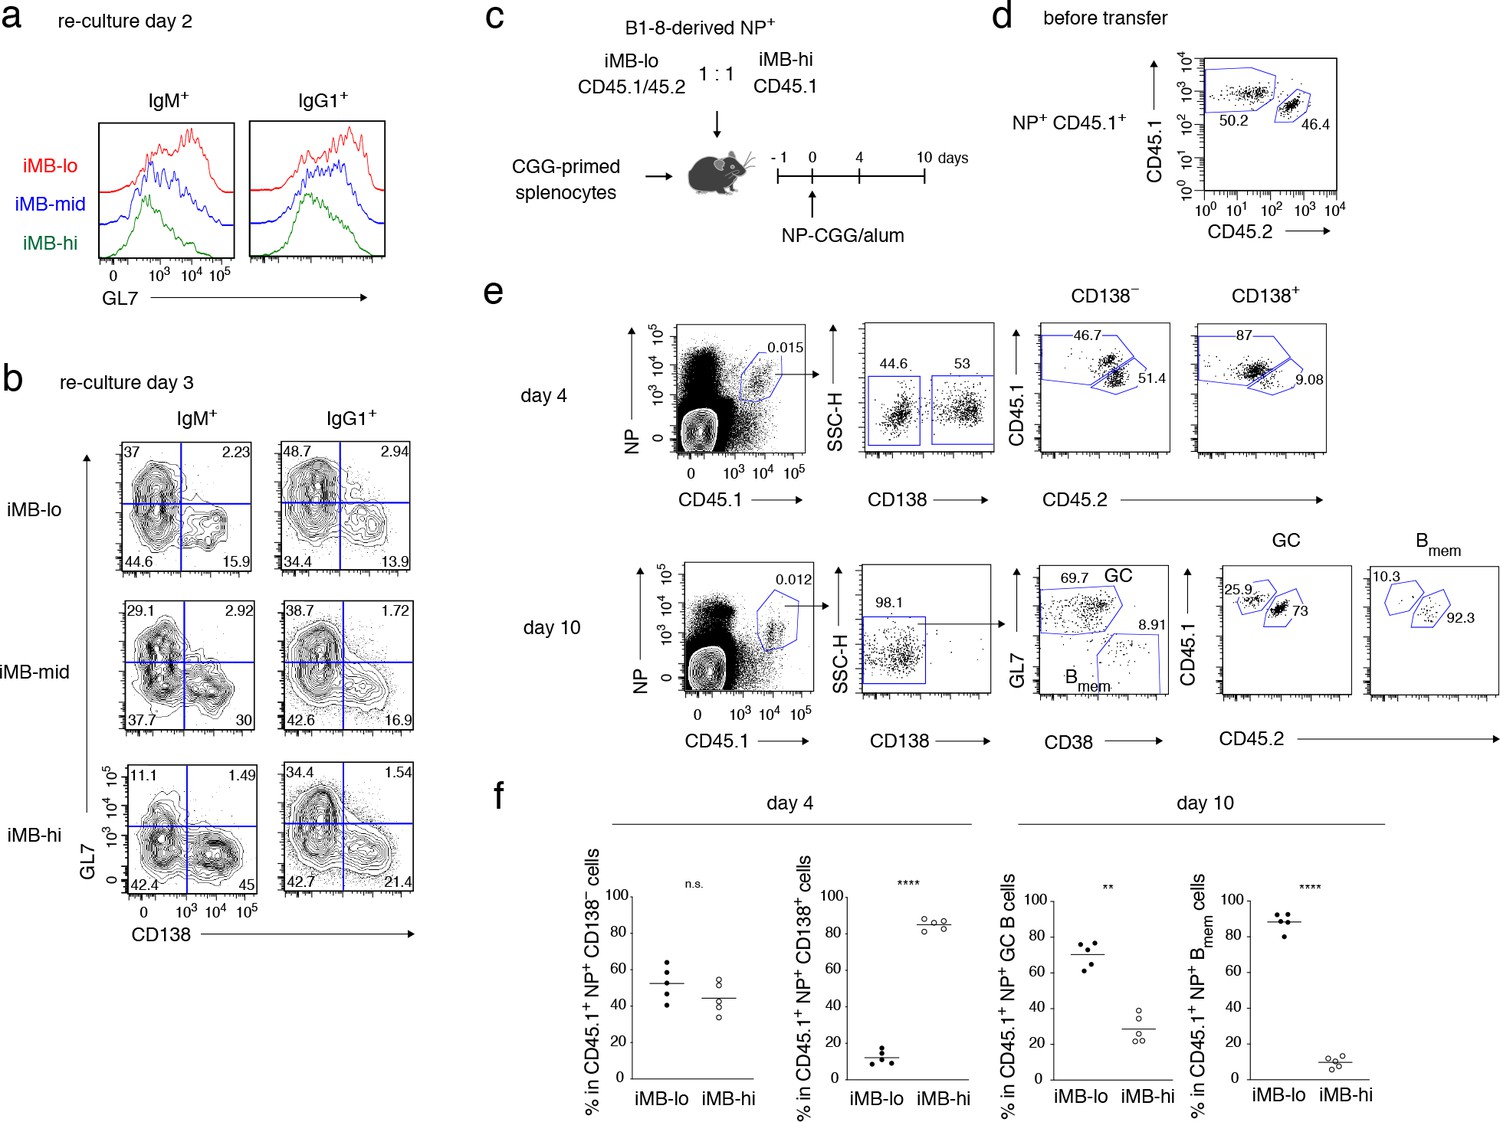
Primary CD40 signaling strength affects secondary Bmem cell differentiation, either to PCs or to GC B cells.
(a, b) Splenic B cells from each recipient mouse (containing iMB cells), generated as in Figure 3 (d), were cultured on 40LB feeder layers with IL-21 for 2 (a) or 3 (b) days. The expression of GL7 (a, b) and CD138 (b) on gated IgM+ or IgG1+ CD45.1+ (iMB cell-derived) cells was analyzed by FCM. (c–f) iMB-lo and iMB-hi cells were generated from B1-8 ki Igκ−/− CD45.1/CD45.2 or B1-8 ki Igκ−/− CD45.1 iGB cells, respectively, as in Figure 3 (d). 2.5 × 10⁴ (for ‘day 4’) or 1 × 10⁴ (for ‘day 10’) of NP+ iMB-lo and iMB-hi cells were mixed and co-transferred into WT B6 recipient mice with 1 × 10⁷ CGG-primed splenocytes. The recipient mice were then immunized with NP-CGG in alum and analyzed 4 or 10 days after immunization. (c) A schematic of the experimental procedure. (d) A representative FCM profile of the mixture of iMB-lo (CD45.2+) and iMB-hi (CD45.2−) cells, gated on CD45.1+ NP+ cells, before the transfer. (e) Representative FCM data at day 4 and day 10 after immunization showing the gating strategy. (f) The frequencies of iMB-lo- and iMB-hi-derived cells among CD45.1+ NP+ CD138− or CD138+ cells at day 4, and among CD45.1+ NP+ Bmem cells (CD138− GL7− CD38+) or GC B cells (CD138− GL7+ CD38−) at day 10. The mean of the values in each group is indicated by a horizontal bar (f). n.s., not significant (p>0.05); **, p<0.01; ****, p<0.0001; as determined by paired Student’s t tests (f). All data are representative of two independent experiments.
-
Figure 4—source data 1
Source data for Figure 4f.
- https://doi.org/10.7554/eLife.44245.013
Figure 4—figure supplement 1
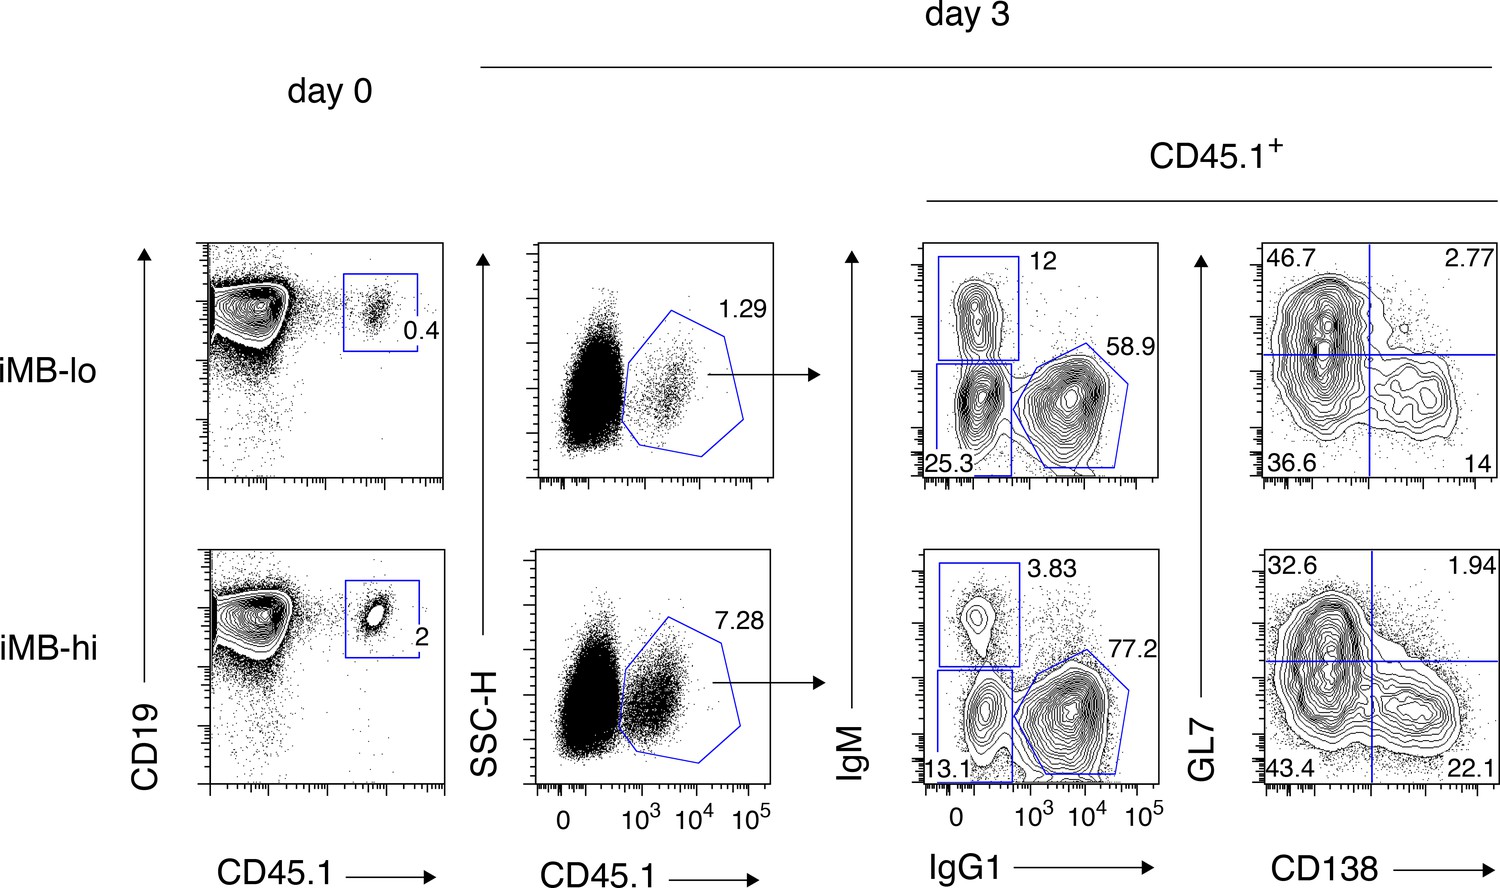
A gating strategy for IgM+ and IgG1+ cells used in Figure 4b.
Spleen cells containing donor-derived (CD45.1+) iMB cells (left) were cultured as shown in Figure 4a,b. FCM profiles of the gated iMB cell-derived cells on day 3, with the gating strategy for the cell fractions used in Figure 4b, are shown (right). The analysis on day 2 in Figure 4a was gated in the same manner.
Figure 5 with 1 supplement
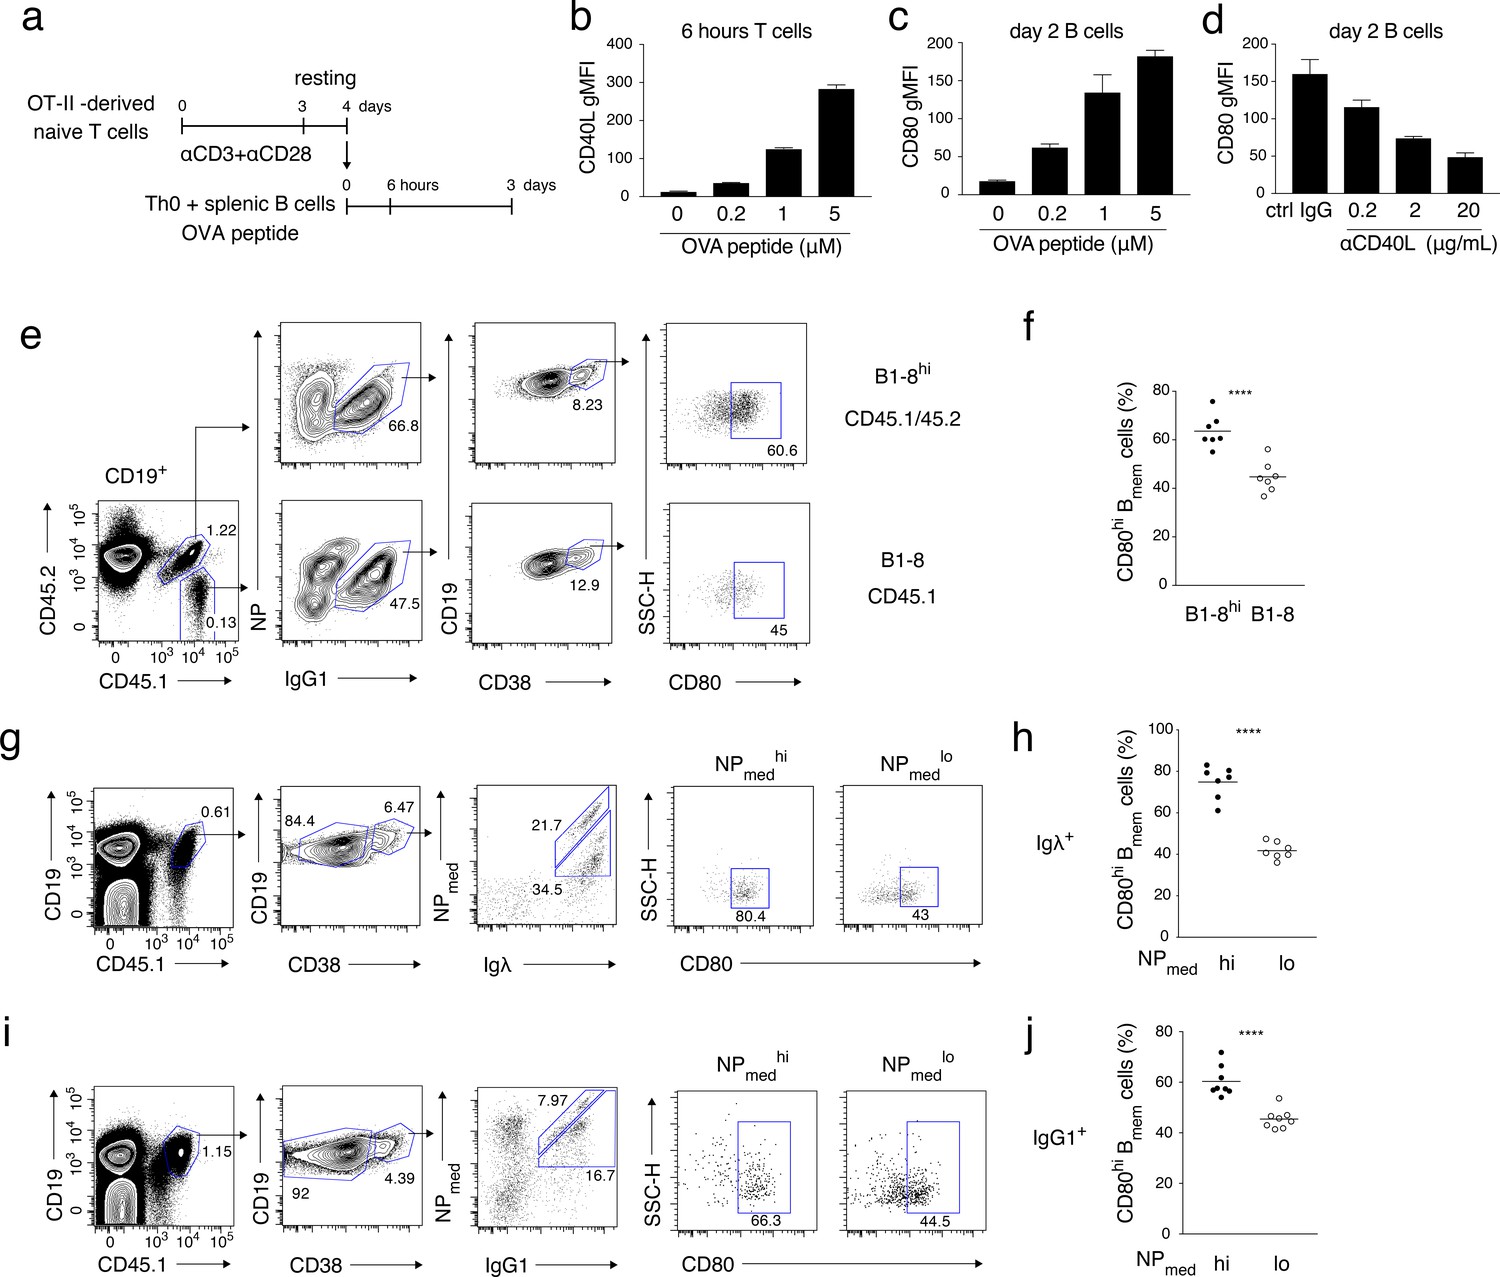
High-affinity B cells preferentially differentiate into CD80hi Bmem cells, possibly through stronger induction of CD40L on cognate T cells.
(a–d) OT-II-derived Th0 cells and splenic B cells were co-cultured with the indicated concentration of OVA peptide for 6 hr or 2 days and analyzed by FCM. (a) An outline of the procedure for the T-B co-culture (see Materials and methods). (b) Expression levels of CD40L on CD4+ T cells after 6 hr co-culture are presented as gMFI (mean + s.d. of triplicates). (c) Expression levels of CD80 on CD19+ B cells after 2 days co-culture are presented as gMFI (mean + s.d. of triplicates). (d) Expression levels of CD80 on B cells after 2 days co-culture with 5 μM OVA peptide in the presence of the indicated concentration of anti-CD40L blocking Ab. Data are shown as in (c). (e, f) 1 × 10⁵ NP+ splenic B cells from B1-8hi ki (CD45.1/45.2) or B1-8 ki (CD45.1) mice were co-transferred into the recipient B6 mice, which were immunized with NP-CGG in alum on the next day and analyzed by FCM 7 days later. (e) Representative FCM data showing the gating strategy. (f) The frequency (%) of CD80hi among IgG1+ Bmem cells (CD19+ CD38+) derived from either B1-8hi ki or B1-8 ki cells is plotted (n = 7). (g–j) B6 mice transferred with B1-8 ki B cells and immunized as in (e, f) were analyzed by FCM at 10 days after immunization. (g, i) Representative FCM data showing the gating strategy. (h, j) The frequencies (%) of CD80hi cells among NPmedhi or NPmedlo cells in Igλ+ (h) or IgG1+ (j) Bmem cells (CD19+ CD45.1+ CD38+), gating of each as shown in (g) and (i), respectively (n = 8). The mean of the values in each group is indicated by a horizontal bar (f, h, j). ****, p<0.0001; as determined by paired Student’s t tests (f, h, j). All data are representative of two independent experiments except (f, h, j), where data from two independent experiments are combined.
-
Figure 5—source data 1
Source data for Figure 5b, c, d, f, h, j.
- https://doi.org/10.7554/eLife.44245.016
Figure 5—figure supplement 1
Representative FCM profile data from the analyses shown in Figure 5b–d.
https://doi.org/10.7554/eLife.44245.015
Figure 6 with 1 supplement

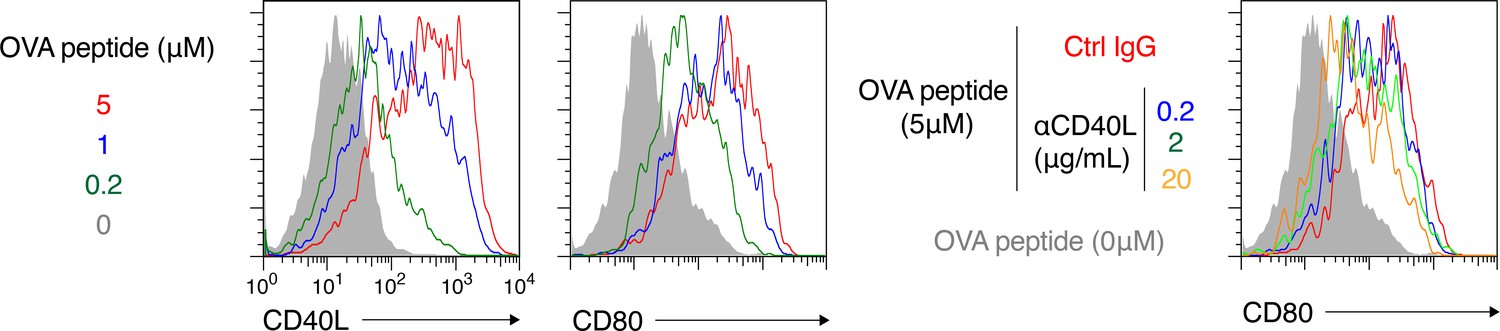
NF-κB signaling is involved in CD80hi Bmem cell development.
(a) Constitutively active (CA) variants of Akt, IKKβ or MKK4 were retrovirally transduced into B cells cultured on 40LB-lo feeder cells (iGB-lo cells) on day 2 of the culture. The expression of CD80 on the gated IgG1+ CD138− infection-marker-positive iGB-lo cells was then analyzed by FCM on day 5. The number on each histogram indicates gMFI. (b) Cytoplasmic and nuclear lysates from B cells stimulated with CD40 mAb (1 or 10 mg/ml) for the indicated time periods were analyzed by immunoblotting using Abs against c-Rel and p65/RelA. Tubulin and Lamin B were used as loading controls for cytoplasmic or nuclear proteins, respectively. (c) B cells cultured on 40LB-hi feeder cells (iGB-hi cells) were transduced with shCtrl, shRel, or shRela retroviral vectors, each carrying a GFP gene as an infection marker. Three days after the transduction, the expression of Rel and Rela mRNA in the sorted GFP+ cells was analyzed by qRT-PCR (mean + S.D. of triplicates). (d) Expression of CD80 on the GFP+ IgG1+ CD138− iGB-hi cells analyzed by FCM at 3 days after gene transduction, as in (c). (e, f) The iGB-hi cells transduced with the knock-down constructs as shown in (c,d) were transferred into γ-irradiated mice, spleens of which were analyzed by FCM 2 weeks later. (e) Outline of the experimental procedure. (f) Representative FCM data showing the the expression of CD80 (above) and the frequency (%) of CD80hi cells (bottom; n = 3) in the gene-transduced iMB cells (CD19+ CD45.1+ CD38+ GFP+) formed in the recipients’ spleens. (g, h) In vivo activated B cells derived from B1-8hi ki mice were transduced with shCtrl or shRela vectors, as described in the Materials and methods, and the resultant B cells (1 × 10⁶) were transferred into WT B6 mice. The recipient mice were immunized with NP-CGG in alum on the next day. Splenocytes from these mice were analyzed by FCM at 10 days after immunization. (g) Outline of the experimental procedure. (h) Representative FCM data showing the gating strategy (left). The frequencies (%) of CD80hi cells among donor-derived, vector-transduced, and class-switched Bmem cells (CD45.1+ NP+ GFP+ IgM− CD19+ CD38+) at 10 days after immunization (right; n = 4). The mean of the values in each group is indicated by a horizontal bar (f, h). *, p<0.05; **, p<0.01; ***, p<0.001; as determined by unpaired Student’s t tests. All data are representative of two independent experiments.
-
Figure 6—source data 1
Source data for Figure 6c, f and h.
- https://doi.org/10.7554/eLife.44245.019
Figure 6—figure supplement 1
Gating strategies for the analyses in Figure 6d and f, and comlementary data for Figure 6h.
(a) A representative FCM data showing the gating strategy for the gene-transduced IgG1+ CD138− iGB cells analyzed in Figure 6d. (b) Representative FCM data showing the gating strategy for the gene-transduced iMB cells analyzed in Figure 6f. (c) The frequencies of GC B cells (CD19+ CD38−) in the donor-derived, antigen-specific, class-switched, gene-transduced B cells (CD45.1+ NP+ IgM− GFP+) (left), and the frequencies of CD80lo cells in the gene-transduced Bmem cells (CD45.1+ NP+ GFP+ IgM− CD19+ CD38+), for the mice shown in Figure 6h (n = 4).
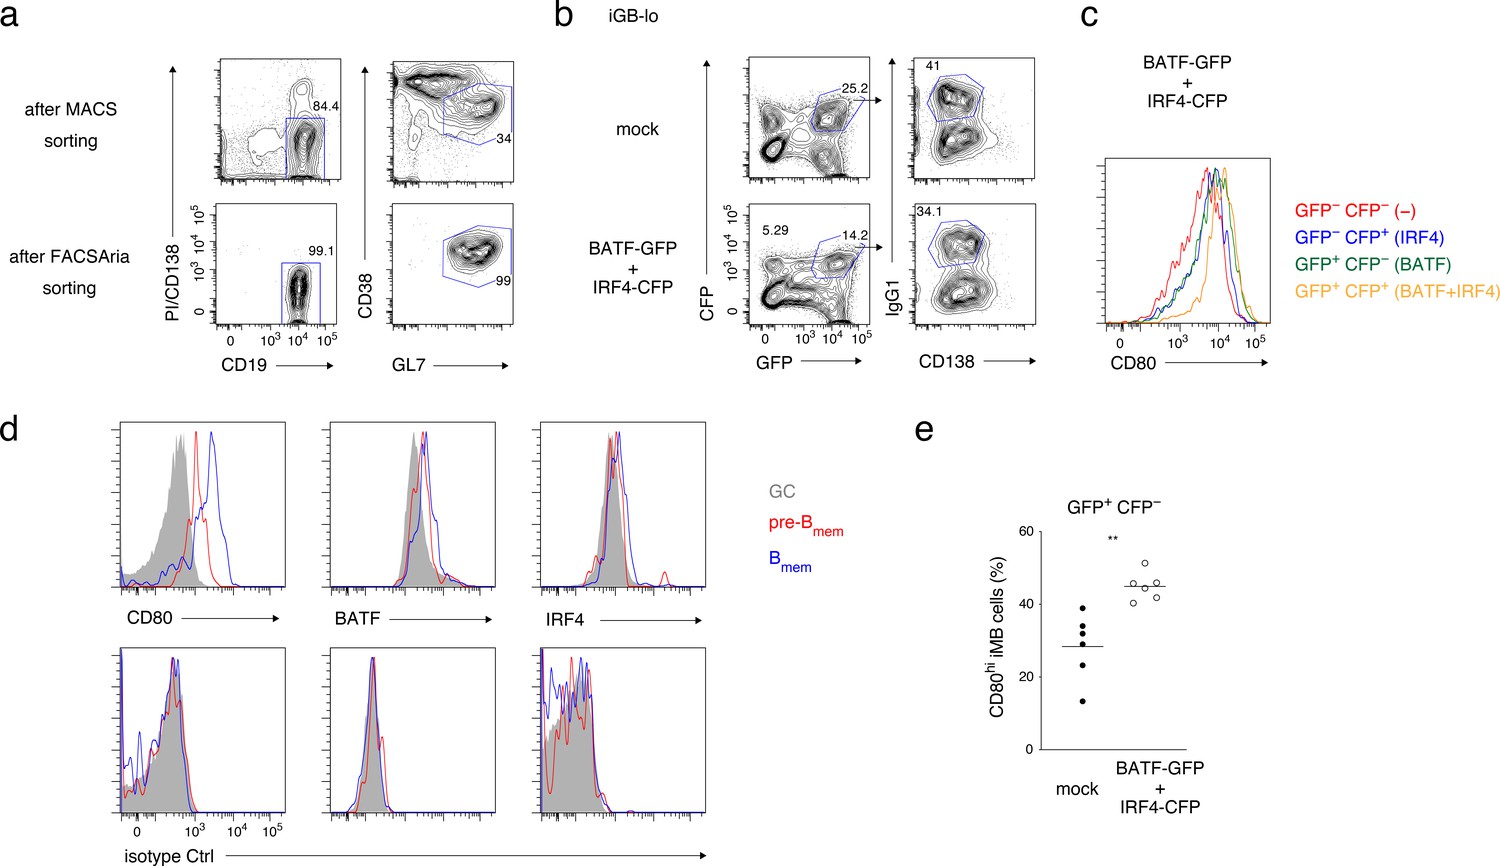
Figure 7 with 1 supplement
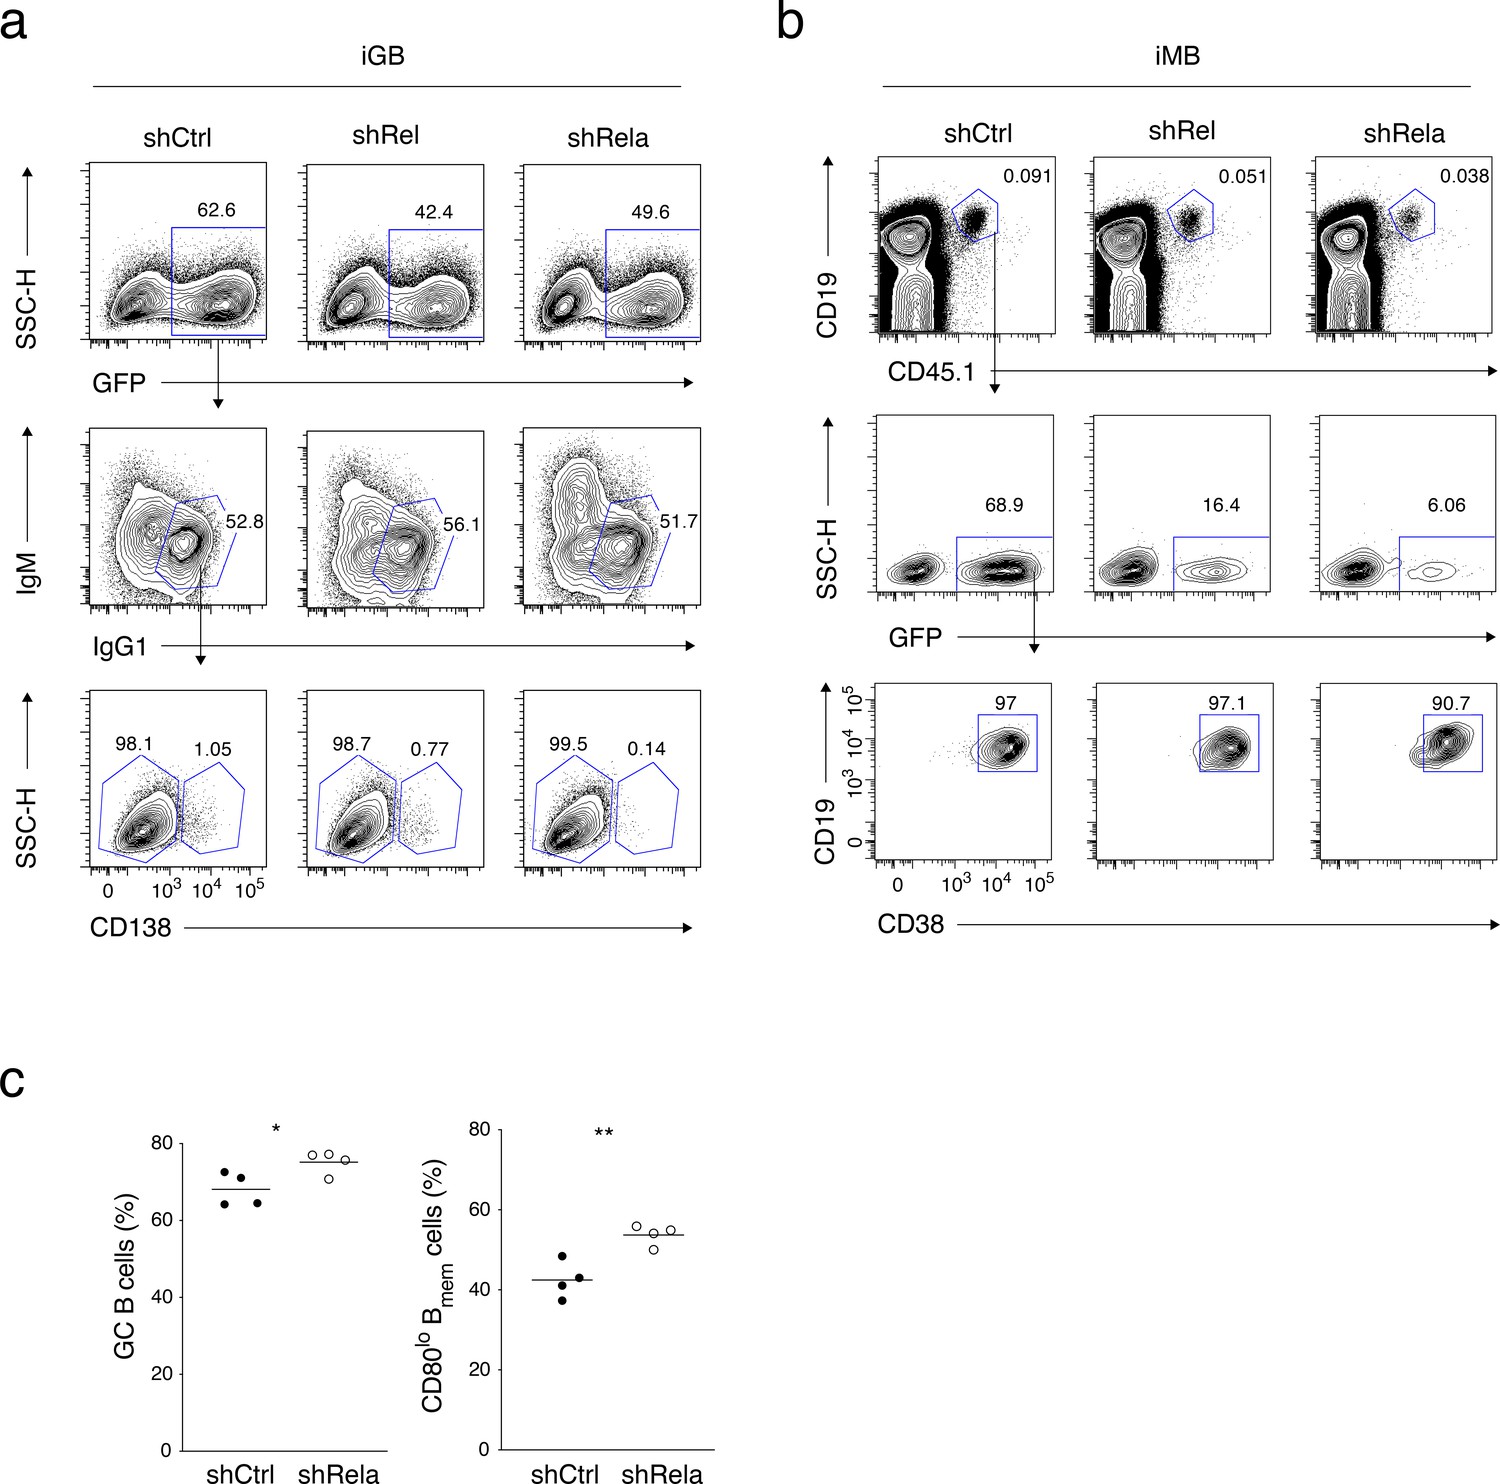
CD40-induced BATF may be involved in CD80hi Bmem cell development.
(a, b) GC B cells (CD19+ CD138− CD38− GL7+) were sorted from splenocytes of mice at 7 days after immunization with NP-CGG in alum and cultured without (−) or with the addition of the following reagents for 6 hr: anti-IgM plus anti-IgG Abs (αBCR, 10 μg/ml or 1 μg/ml), anti-CD40 Ab (αCD40, 10 μg/ml or 1 μg/ml), IL-4 (10 ng/ml), IL-21 (10 ng/ml) or BAFF (10 ng/ml). Expression of the indicated proteins in these B cells (CD19+ CD138−) was analyzed by intracellular staining followed by FCM. (a) Representative FCM data. (b) gMFIs of the histograms shown in (a). Data are mean + s.d. of triplicates. (c) Splenic B cells cultured on 40LB-lo feeder cells (iGB-lo) were transduced with a mock vector or with the indicated vectors expressing each factor fused with ERT2 (generated as described in the Materials and methods) on day 2 of the culture, and then treated with vehicle (EtOH) alone or with 4-OHT from day 3 to day 5. The expression of CD80 on these cells was analyzed on day 5, and shown as in (a). (d) iGB-lo cells were transduced with the indicated combination of the ERT2–fusion vectors and treated with 4-OHT as in (c). The CD80 expression on these cells is shown as in (c). (e) Splenic B cells were cultured with anti-CD40 Ab (20 μg/ml) for 2 days without (−) or with an IKKβ inhibitor (BAY11-7082). Expression of the indicated proteins in these cells was analyzed by FCM. The shadowed histograms represent the cells cultured with medium alone. (f, g) Splenic B cells from B1-8 ki CD45.1 mice were transferred into WT B6 mice, which were immunized with NP-CGG in alum on the next day. At 10 days after immunization, splenocytes from the recipients were analyzed by FCM. (f) A representative data showing the gating strategy. (g) gMFI of the indicated proteins in the donor-derived GC B cells (CD19+ CD45.1+ IgM− GL7+ Ephrin B1+ CD38−), pre-Bmem cells (CD19+ CD45.1+ IgM− GL7+ Ephrin B1+ CD38+), and Bmem cells (CD19+ CD45.1+ IgM− GL7− CD38+) (n = 5). (h–j) iGB-lo cells were transduced with the retroviral vectors expressing ERT2-BATF-ires-GFP and ERT2-IRF4-ires-CFP (BATF-GFP +IRF4 CFP), or with empty vectors expressing GFP and CFP (mock) on day 2 of culture treated with 4-OHT from day 3 to day 5, and then transferred into γ-irradiated mice. Two weeks after the transfer, spleen cells of the recipient mice were analyzed by FCM. (h) Outline of the experimental procedure. (i) A representative data showing the gating strategy. (j) The frequency (%) of CD80hi cells in the ERT2-BATF gene-transduced iMB cells formed in the recipients’ spleens (CD19+ CD45.1+ CD38+ GFP+) (n = 6). The mean of the values in each group is indicated by a horizontal bar (g, j). *, p<0.05; **, p<0.01; as determined paired Student’s t tests. All data are representative of two independent experiments except (j), in which data from two independent experiments are combined.
-
Figure 7—source data 1
Source data for Figure 7b, g and j.
- https://doi.org/10.7554/eLife.44245.022
Figure 7—figure supplement 1
Supplementary data for Figure 7.
(a) GC B cells magnetically enriched from splenocytes of the mice immunized 1 week previously (top) and further purified by fluorescence-activated cell sorting (FACS) sorting (bottom) were used for the analyses in Figure 7a. (b) Representative FCM data of iGB-lo cells on day 5 of the culture shown in Figure 7h. (c) The expression of CD80 on the indicated populations of IgG1+ iGB-lo cells shown in (b). (d) A representative FCM data for the analyses in Figure 7g. Cells were stained extra- (CD80) or intra-cellularly (BATF, IRF4) with antibodies against the indicated proteins (top) or with isotype-matched control antibodies (bottom). (e) The frequency of CD80hi Bmem cells in GFP+ CFP− fractions of iMB cells, as defined in the second panels from the left in Figure 7i, and in the experiment in Figure 7h–j. Legend for Supplementary file 1.
Figure 8
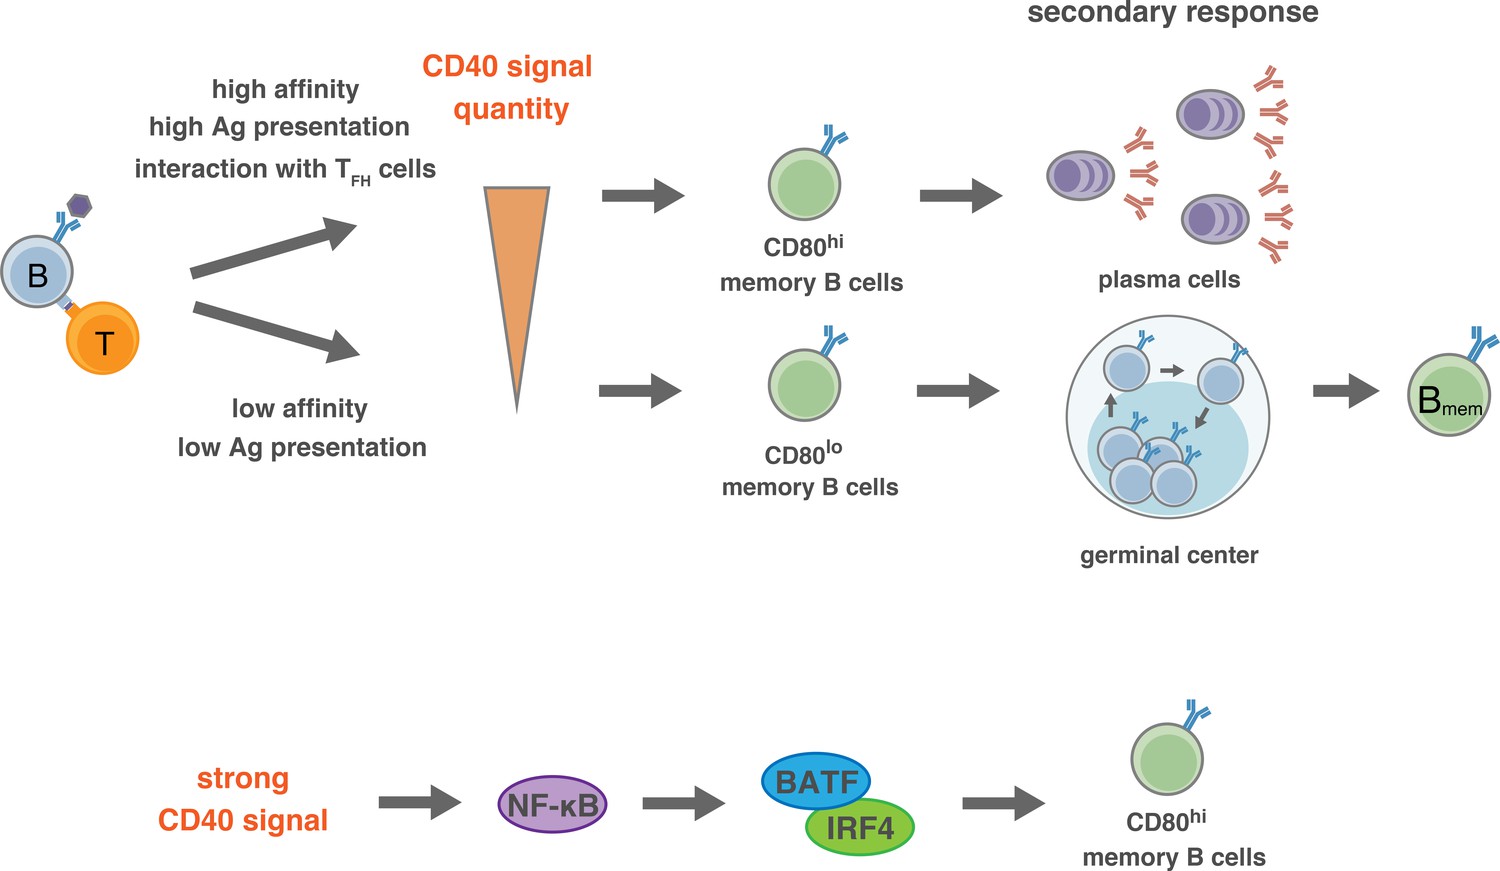
Proposed model for the generation of CD80hi and CD80lo Bmem cells.
(Top) In the pre-GC phase of the primary response, the BCR affinity to antigen or the amount of available antigen determine the quantity of antigen presentation to T cells, and the extent of the induction of CD40L on T cells. Thus, the strength of CD40 signaling in B cells is determined by the interacting T cells, which then directs the differentiation fate to distinct Bmem subsets: relatively stronger CD40 signal commits B cells towards CD80hi Bmem cells, whereas weaker CD40 signal commits B cells towards CD80lo Bmem cells. After GC formation, TFH cells, being able to express a high level of CD40L after TCR stimulation, strongly stimulate CD40 on relatively high-affinity B cells and facilitate their differentiation to CD80hi Bmem cells. (Bottom) Activation of NF-κB, and the downstream BATF–IRF4 heterodimer, may transmit the strong CD40 signaling into a mechanism that facilitates the differentiation towards CD80hi Bmem cells.
Tables
Key resources table
| Reagent type (species) or resource | Designation | Source or reference | Identifiers | Additional information |
|---|---|---|---|---|
| Genetic reagent (M. musculus) | B1-8ki | Lam et al., 1997 | Dr. Rajewsky (Max Delbrück Center for Molecular Medicine) | |
| Genetic reagent (M. musculus) | B1-8hiki | Shih et al., 2002 | IMSR Cat# JAX:007775; RRID:IMSR_JAX:007775 | Dr. Nussenzweig (The Rockefeller University) |
| Genetic reagent (M. musculus) | Bcl6flox | Kaji et al., 2012 | IMSR Cat# RBRC05663; RRID:IMSR_RBRC05663 | Dr. Takemori (RIKEN) |
| Genetic reagent (M. musculus) | Cd4-Cre | Lee et al., 2001 | IMSR Cat# JAX:017336; RRID:IMSR_JAX:017336 | Dr. Kubo (Tokyo University of Science) |
| Genetic reagent (M. musculus) | Cd40lg−/− | Xu et al., 1994 | RRID:MGI:2449454 | Dr. Flavell (Yale School of Medicine) |
| Genetic reagent (M. musculus) | Igκ−/− | Chen et al., 1993 | Dr. Tsubata (Tokyo Medical and Dental University) | |
| Genetic reagent (M. musculus) | OT-II | Barnden et al., 1998 | IMSR Cat# JAX:004194; RRID:IMSR_JAX:004194 | Dr. Kubo (Tokyo University of Science) |
| Cell line (M. musculus) | 40LB | Nojima et al., 2011 | Dr. Kitamura (Tokyo University of Science) | |
| Cell line (M. musculus) | 40LB-hi | Takatsuka et al., 2018 | Dr. Kitamura (Tokyo University of Science) | |
| Cell line (M. musculus) | 40LB-lo | this paper | Dr. Kitamura (Tokyo University of Science) | |
| Cell line (M. musculus) | 40LB-mid | this paper | Dr. Kitamura (Tokyo University of Science) | |
| Antibody | rat monoclonal anti-mouse CD40; FGK4.5 | Bio X Cell | Bio X Cell Cat# BE0016-2; RRID:AB_1107647 | 250 μg |
| Antibody | armenian hamster monoclonal anti-mouse CD40L; MR-1 | Noelle et al., 1992 | ATCC Cat# HB-11048; RRID:CVCL_8964 | 1 mg/kg; Dr. Abe (Tokyo University of Science) |
| Sequence-based reagent | shRNA | this paper | See Supplementary file 1 | |
| Software, algorithm | FlowJo | https://www.flowjo.com/solutions/flowjo | RRID:SCR_008520 | |
| Software, algorithm | GraphPad Prism | https://graphpad.com | RRID:SCR_002798 |
Additional files
-
Supplementary file 1
The list of antibodies and reagents used in this study.
- https://doi.org/10.7554/eLife.44245.024
-
Transparent reporting form
- https://doi.org/10.7554/eLife.44245.025
Download links
A two-part list of links to download the article, or parts of the article, in various formats.
Downloads (link to download the article as PDF)
Open citations (links to open the citations from this article in various online reference manager services)
Cite this article (links to download the citations from this article in formats compatible with various reference manager tools)
The quantity of CD40 signaling determines the differentiation of B cells into functionally distinct memory cell subsets
eLife 8:e44245.
https://doi.org/10.7554/eLife.44245


