Megakaryocyte emperipolesis mediates membrane transfer from intracytoplasmic neutrophils to platelets
- Brigham and Women’s Hospital, Harvard Medical School, United States
- Brigham and Women's Hospital and Harvard Medical School, United States
- Boston Children’s Hospital, Harvard Medical School, United States
- University of Utah, United States
- Centre de Recherche du Centre Hospitalier Universitaire de Québec, Faculté de Médecine de l’Université Laval, Canada
Figures
Figure 1 with 1 supplement

Visualization of murine and human emperipolesis by confocal microscopy.
(A) Whole-mount images of mouse bone marrow stained with anti-CD41 (green), anti-Ly6G (red) and anti-CD31/CD144 (white). Arrowheads show internalized neutrophils or other Ly6Gneg bone marrow cells (right image). Three-dimensional reconstitutions and confirmation of cell internalization are shown in Video 1. (B) Cells from human bone marrow aspirate were stained with anti-CD41 (green) and anti-CD66b (red). (C) Murine MKs were co-cultured with marrow cells overnight. Cells were stained with anti-CD41 (green) and anti-CD18 (red). (D) Human MKs generated from marrow CD34+ cells were co-cultured with circulating neutrophils overnight. Cells were stained with anti-CD41 (green) and anti-CD15 (red). (A-D) DNA was visualized with Draq5 or Hoechst (blue), arrowheads represent internalized neutrophils, scale bars represent 20μm, representative of at least 3 independent experiments.
Figure 1—figure supplement 1
Visualization of murine and human emperipolesis by confocal microscopy.
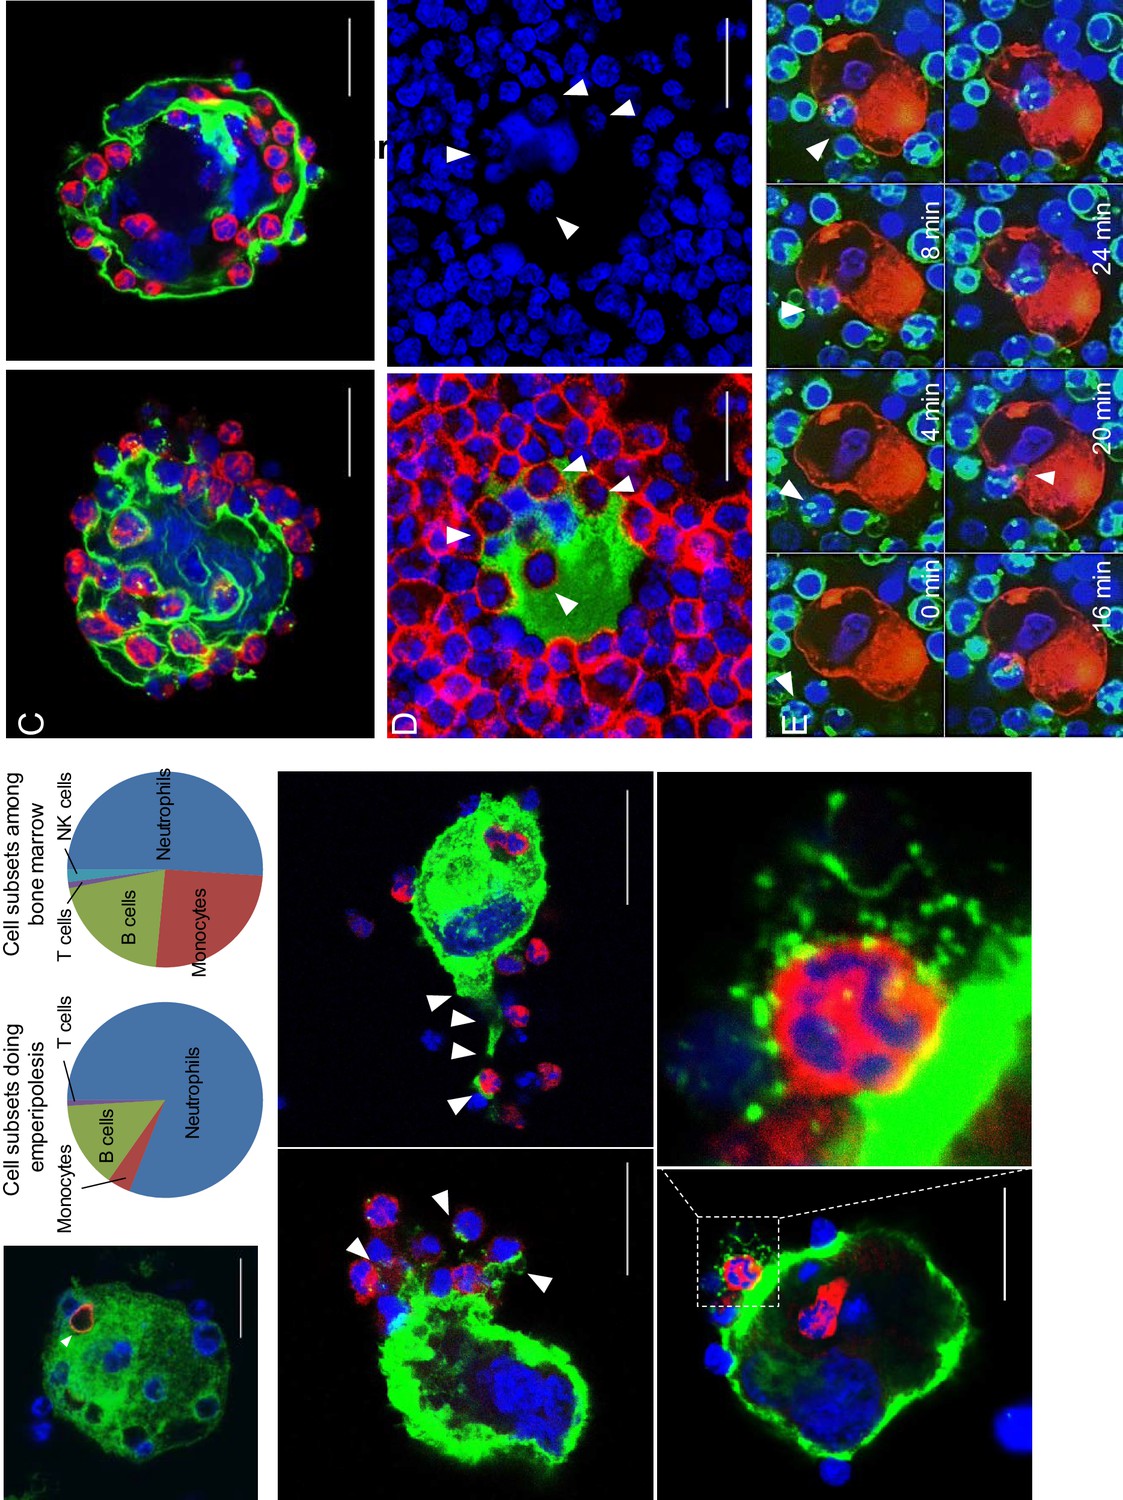
(A) Murine MKs and marrow cells were co-cultured and stained with anti-CD41 (green), anti-Ly6G (blue), and either anti-CD3ε, -B220 (red), -CD115, -NK1.1, or anti-Kit (red). Left: confocal images showing a B cell and neutrophils inside an MK. Middle: marrow cell subsets undergoing emperipolesis. Right: cell subset percentages after overnight incubation in culture medium. (B-C) After co-culture, cells were stained with anti-CD41 (green), anti-CD18 or –Ly6G (red) and Draq5 (DNA, blue). (B) Examples of MK tethers surrounding neutrophils or other marrow cells (see also Video 2). (C) MKs containing more than 20 neutrophils. (D) Cells from human bone marrow aspirate were stained with anti-CD41 (green), anti-CD66b (red), and Draq5 (blue). The image on the right shows DNA staining only, allowing visualization of neutrophils near the MK nucleus (can also be observed in Figure 1B, and in mouse in Video 1). (E) Murine MKs stained with PKH26 (red) and marrow cells stained with PKH67 (green) were co-cultured in the presence of DraqV for time-lapse spinning disk microscopy. (see also Video 3). (A-E) Representative of at least three experiments.
Figure 2
In vitro modeling of emperipolesis reveals a rapid multi-stage process.
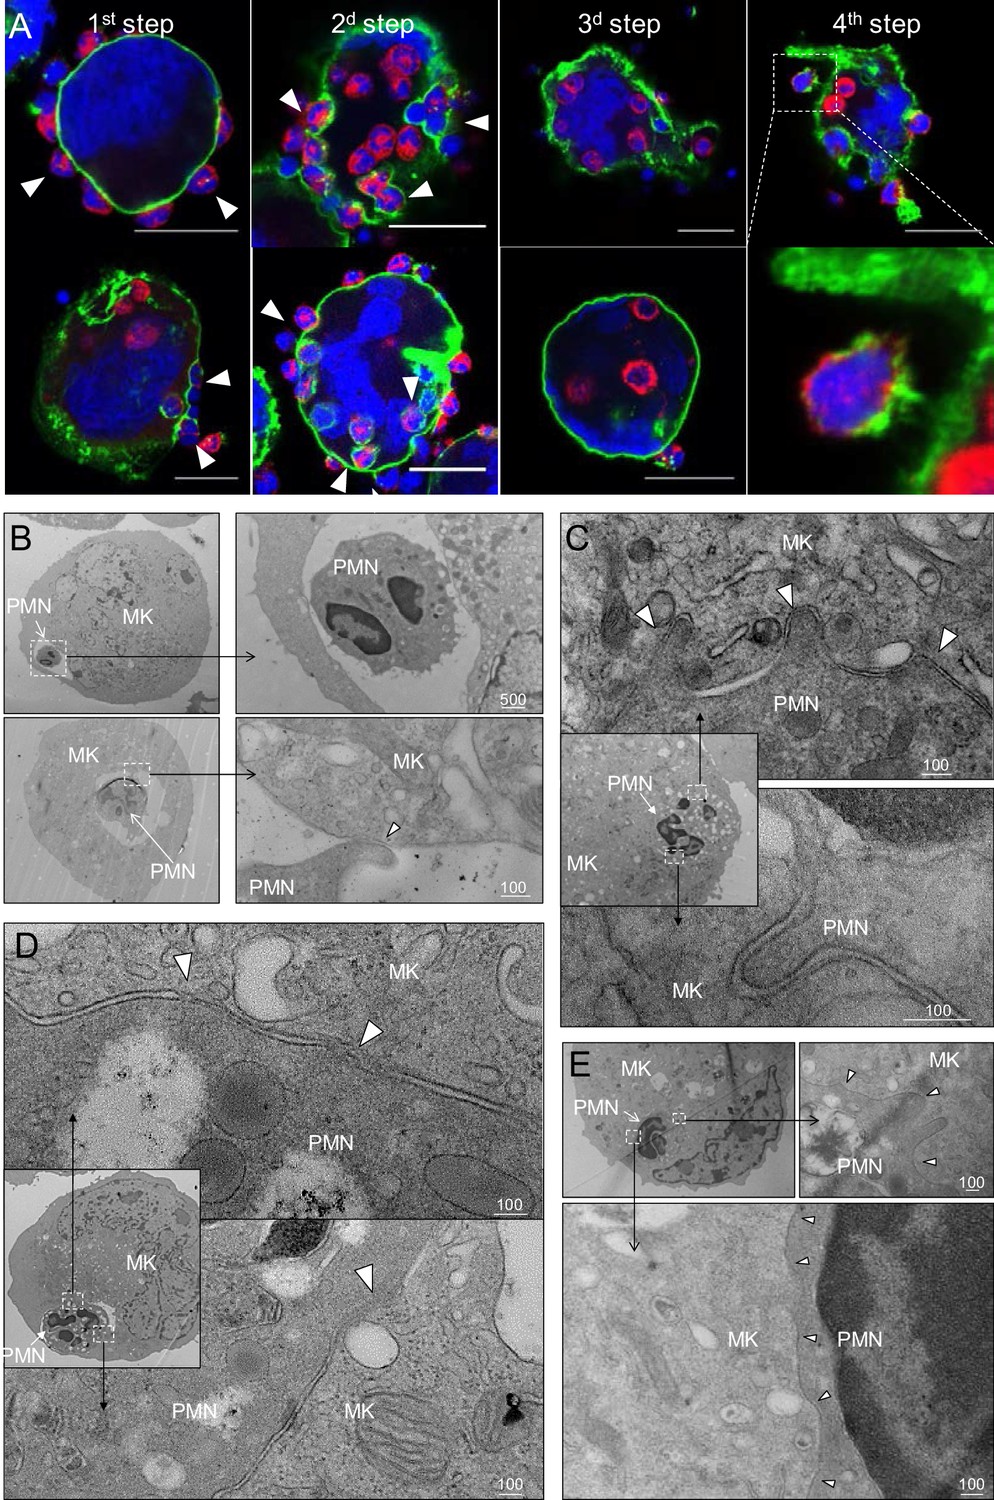
(A) Confocal images showing different steps of emperipolesis. Green: CD41, Red: CD18, Blue: DNA. Scale bars represent 20μm. (B-E) Cells were stained with OsO4 after emperipolesis assay for electron microscopy observation. (B) Neutrophils inside MK vacuoles. Some neutrophil surface protrusions make contact with the emperisome membrane (arrowhead). (C-D) Close interaction between neutrophil and emperisome membrane forming a two-membrane leaflet structure. (C) Protrusions from neutrophils that extend inside the MK cytoplasm (arrowheads). (D) Demarcation between emperisome membrane and neutrophil membrane disappears (arrowheads). (E) Neutrophil and MK are separated by a single membrane (arrowheads). (B-E) Scale bars in nm, representative of at least 3 independent experiments.
Figure 3 with 2 supplements

Emperipolesis is mediated by active actin cytoskeleton rearrangement and in part through β2-integrin/ICAM-1/ezrin.
(A) MKs and marrow cells were co-cultured in the presence of 1μM nocodazole, latrunculin A, cytochalasin D, or control vehicle. (B) MKs or marrow cells were treated with latrunculin A or cytochalasin D for two hours. After thorough washings, cells were co-cultured with untreated marrow cells or MKs, respectively. (A-B) Cells are stained with anti-CD41, -CD18 or -Ly6G and Draq5, and observed by confocal microscopy. Histograms show percentages of MKs containing at least one neutrophil. At least 150 (A) or 500 (B) MKs per condition were counted; pool of 3 independent experiments (See Figure 3—source data 1) (C) Cells are stained with anti-CD41 (green), anti-CD18 (blue) and phalloidin (red). DNA is visualized with Hoechst (gray). Images show F-actin on MK surface where neutrophils are attached (upper photos), around neutrophils encapsulated in CD41+ vacuoles (middle photos) or free within MKs (lower photos). (D-G) Emperipolesis assay was performed (A) in the presence of 10μg/ml anti-CD18 or corresponding isotype control rat IgG1 (B) using marrow cells from WT versus CD18-deficient mice or (C) using MKs from WT versus ICAM-1-deficient mice, or (D) in the presence of 1μM of ezrin inhibitor NSC668394. (A-D) Histograms show percentages of MKs containing at least one neutrophil. At least 350 MKs per condition were counted; pool of 2 (F), 3 (E), or 4 (D and G) independent experiments. (See Figure 3—source data 1) H. After co-culture, cells are stained with anti-CD41 (white), anti-ezrin (green) and anti-Ly6G (blue). Arrows show ezrin clustering on the MK surface. Red asterisks show MKs without detectable ezrin. (I) Cells are stained with anti-CD41 (gray), -ezrin (green), -ICAM-1 (red), -Ly6G (blue). Arrows show ICAM-1/ezrin co-localization on the MK surface. Lower photo is a magnification of the dashed white region. (Hand I). Scale bars represent 20μm, representative of at least 3 independent experiments.
-
Figure 3—source data 1
Source data for Figure 3.
- https://doi.org/10.7554/eLife.44031.014
Figure 3—figure supplement 1
Emperipolesis is mediated by active actin cytoskeleton rearrangement and in part through β2-integrin/ICAM-1/ezrin.
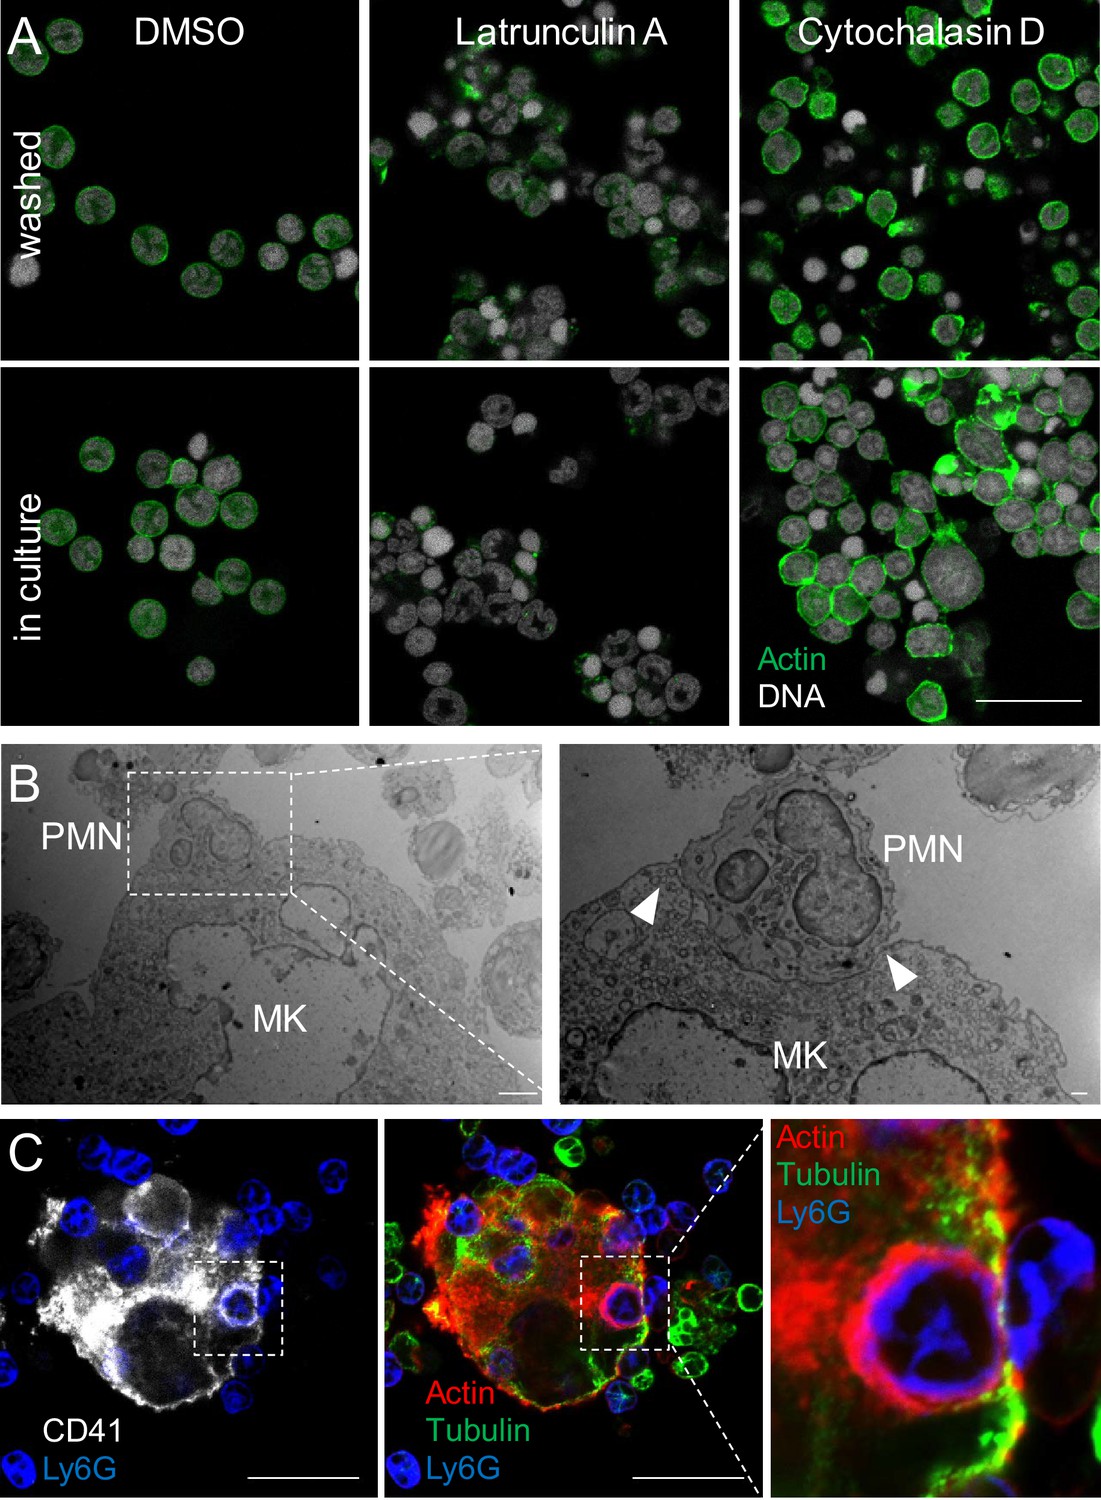
(A) Marrow cells were treated with 1 µM latrunculin A, cytochalasin D, or DMSO. After 2 hr, cells were either washed thoroughly to remove inhibitors and cultured overnight (upper photos) or left in culture in the presence of the inhibitors (lower photos). Images show a strong disruption of F-actin in cells treated with latrunculin A, and bright actin aggregates distributed irregularly within the cells with cytochalasin D, as reported (Khajah et al., 2015; Rubtsova et al., 1998). (B) Electron microscopy images showing the formation of a cup on MK surface. Scale bars: 2 μm (left) and 500 nm (right). (C) After co-culture, cells were stained with anti-CD41 (white), anti-Ly6G (blue), anti-tubulin (green). Actin was visualized with phalloidin (red). (A and C). Scale bars represent 20 μm. (A-C) Representative of at least three experiments.
Figure 3—figure supplement 2
Emperipolesis is mediated by active actin cytoskeleton rearrangement and in part through β2-integrin/ICAM-1/ezrin.
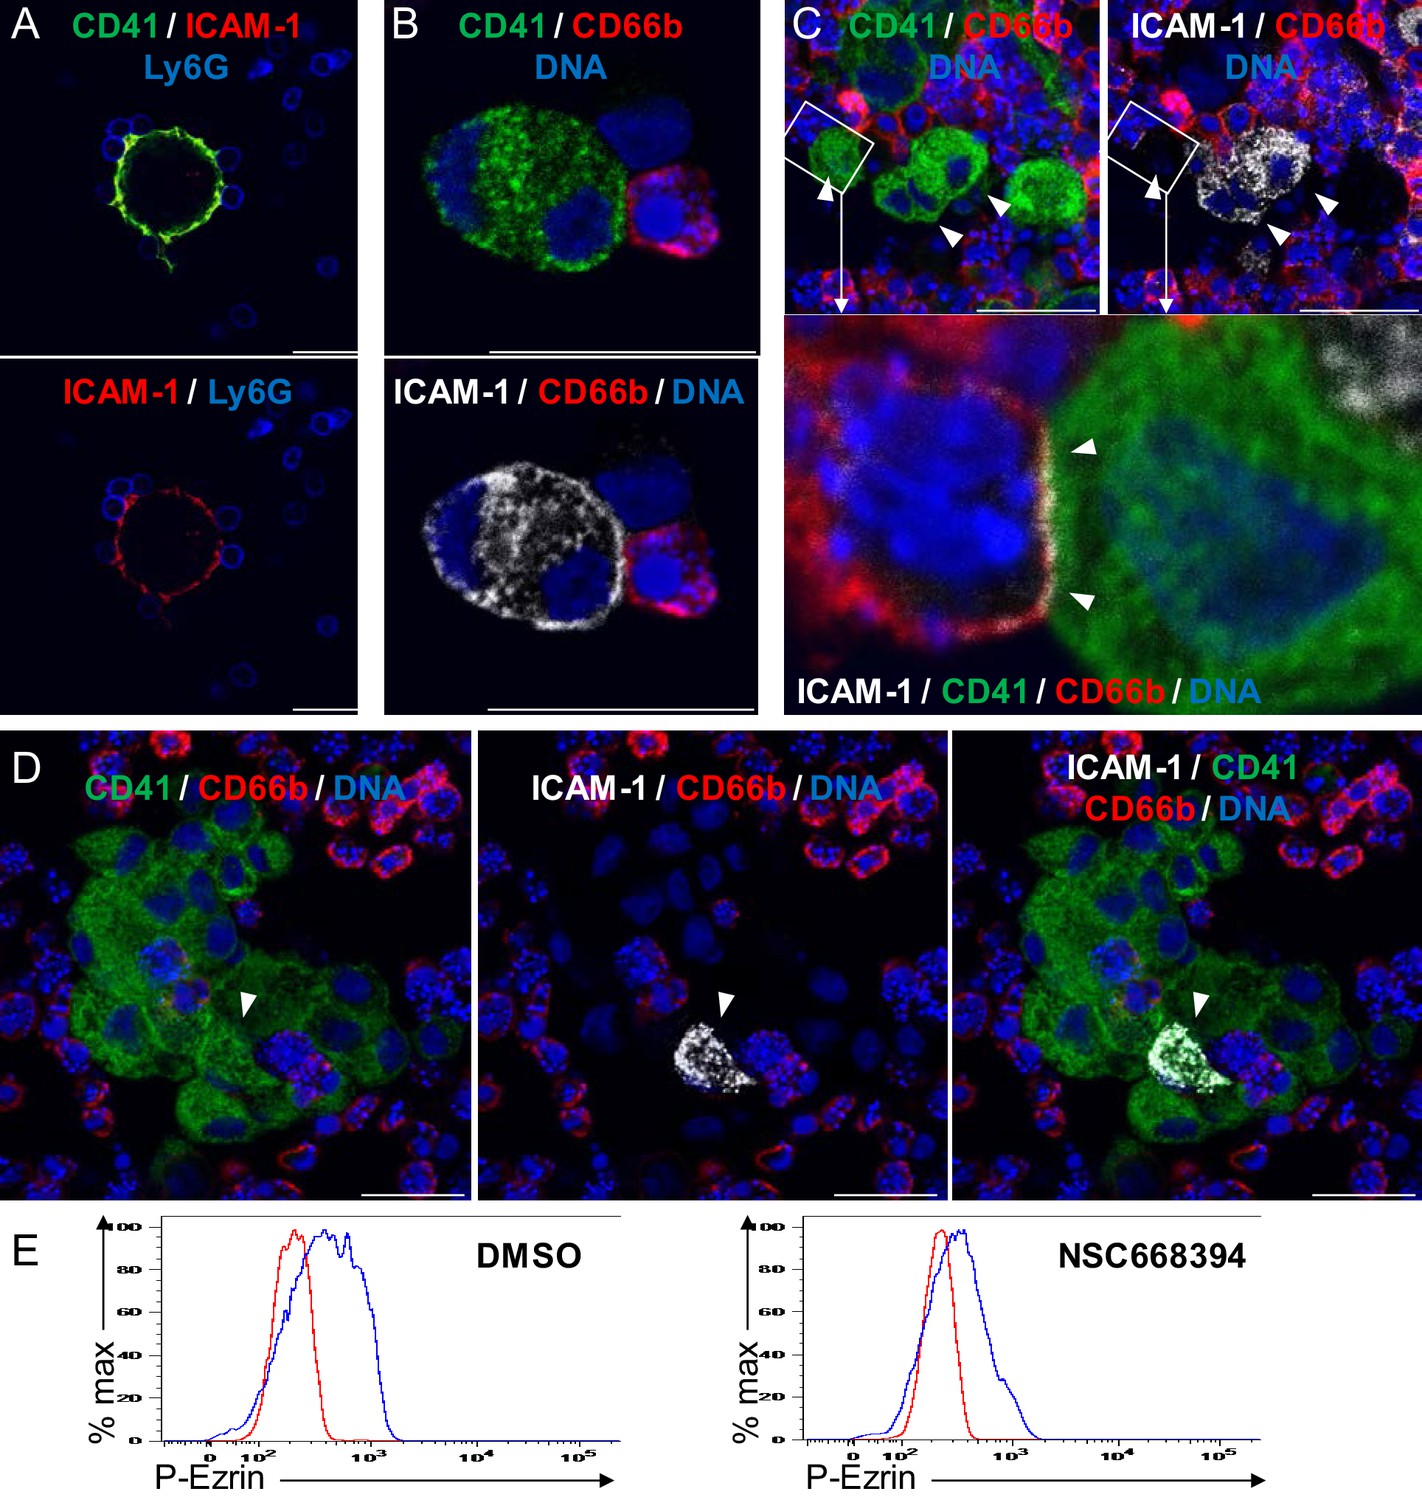
(A) MKs generated from murine marrow were co-cultured with marrow cells. (B-D) MKs generated from human CD34+ mobilized cells were co-cultured with peripheral blood neutrophils. (A-D) After fixation, cells were stained with anti-CD41, anti-Ly6G or -CD66b, and anti-ICAM-1. DNA was visualized with Hoechst. ICAM-1 was observed on a fraction of murine and human MKs (~5%, arrowheads), principally those engaged with in cell-cell contact with marrow cells. Scale bars represent 20 μm. (E) Marrow cells were treated overnight with DMSO (left) or 1 µM of the ezrin inhibitor NSC668394 (right), PFA-fixed, permeabilized and incubated with an anti-phosphorylated ezrin antibody or a rabbit isotype control overnight at 4C. After washing, cells were incubated with AF488-conjugated anti-rabbit Ab. Histograms show phospho-ezrin MFI (blue) vs. isotype control MFI (red). (A-E) Representative of at least three experiments.
Figure 4 with 1 supplement
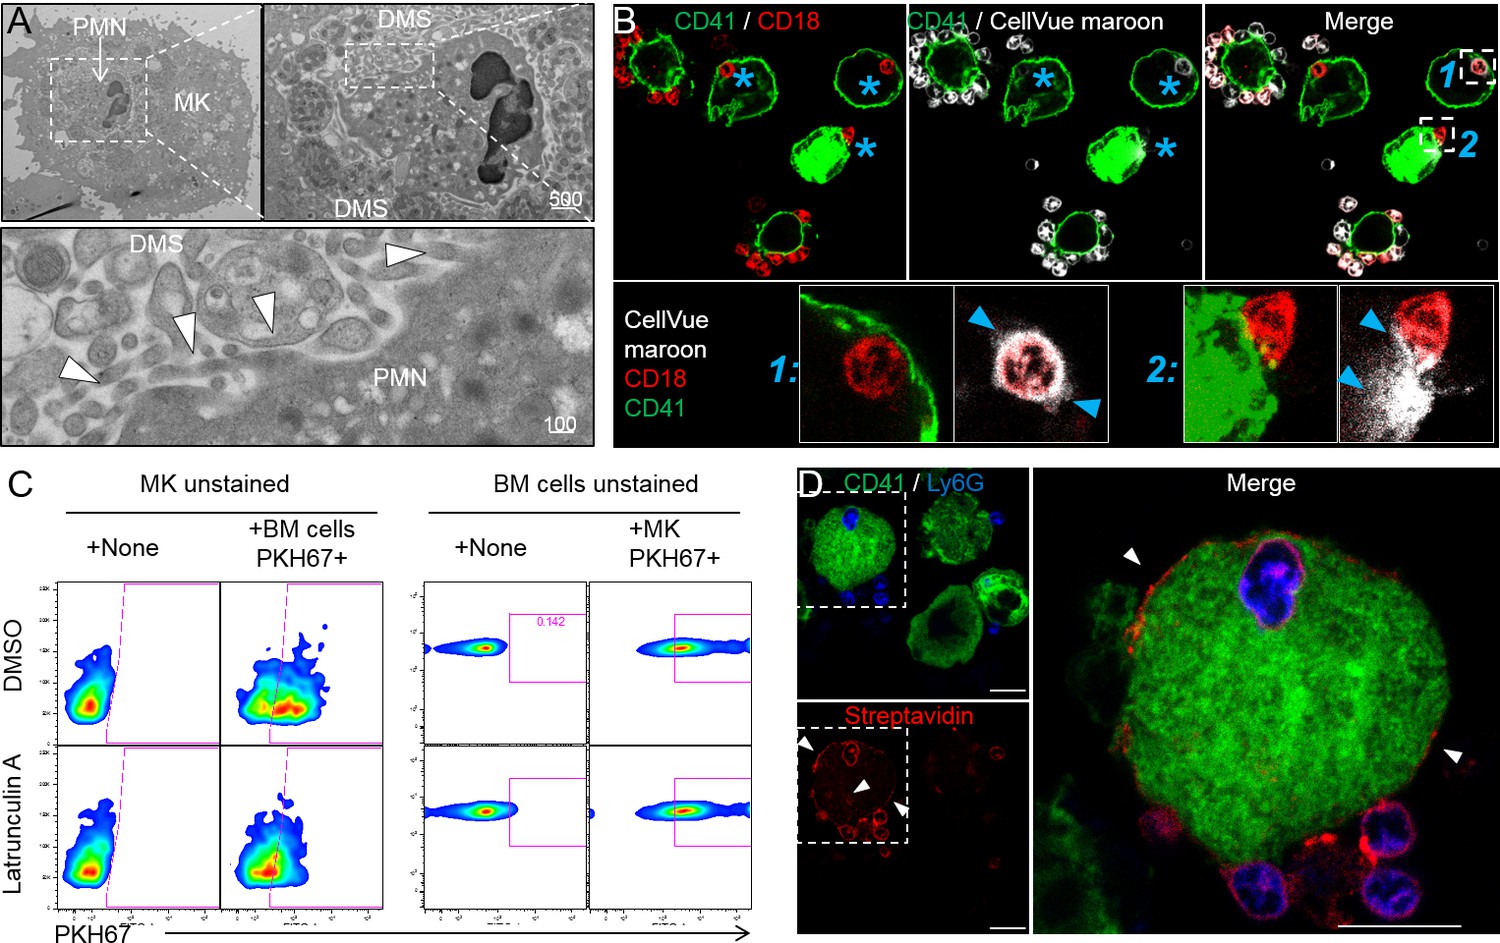
Emperipolesis mediates membrane transfer from neutrophil to megakaryocyte.
(A) Cells were stained with OsO4 after emperipolesis assay for electron microscopy observation. Images show a membrane continuity between neutrophil and DMS (arrowheads). (B) Bone marrow cells were stained with CellVue Maroon prior to co-culture with MKs. Confocal microscopy shows a loss of CellVue Maroon fluorescence in neutrophils engaged in emperipolesis (blue asterisks). Lower photos show details for the two neutrophils (1) and (2) on the upper right photo (transfer of CellVue Maroon inside MKs, blue arrowheads). (C) MKs and marrow cells were co-cultured with 1μM latrunculin A or DMSO. Left panels: marrow cells are previously stained with PKH67, dot plots show PKH67 fluorescence on CD41+ MKs. Right panels: MKs are previously stained with PKH67, dot plots show PKH67 fluorescence on Ly6G+ neutrophils. (D) Surface proteins of marrow cells were biotinylated prior to emperipolesis assay. After fixation, cells were incubated with AF594-streptavidin (red). Asterisks show the presence of biotinylated proteins on MK surface and DMS. B and D: Scale bars represents 20µm, representative of at least 3 independent experiments.
Figure 4—figure supplement 1
Emperipolesis mediates membrane transfer from neutrophil to megakaryocyte.
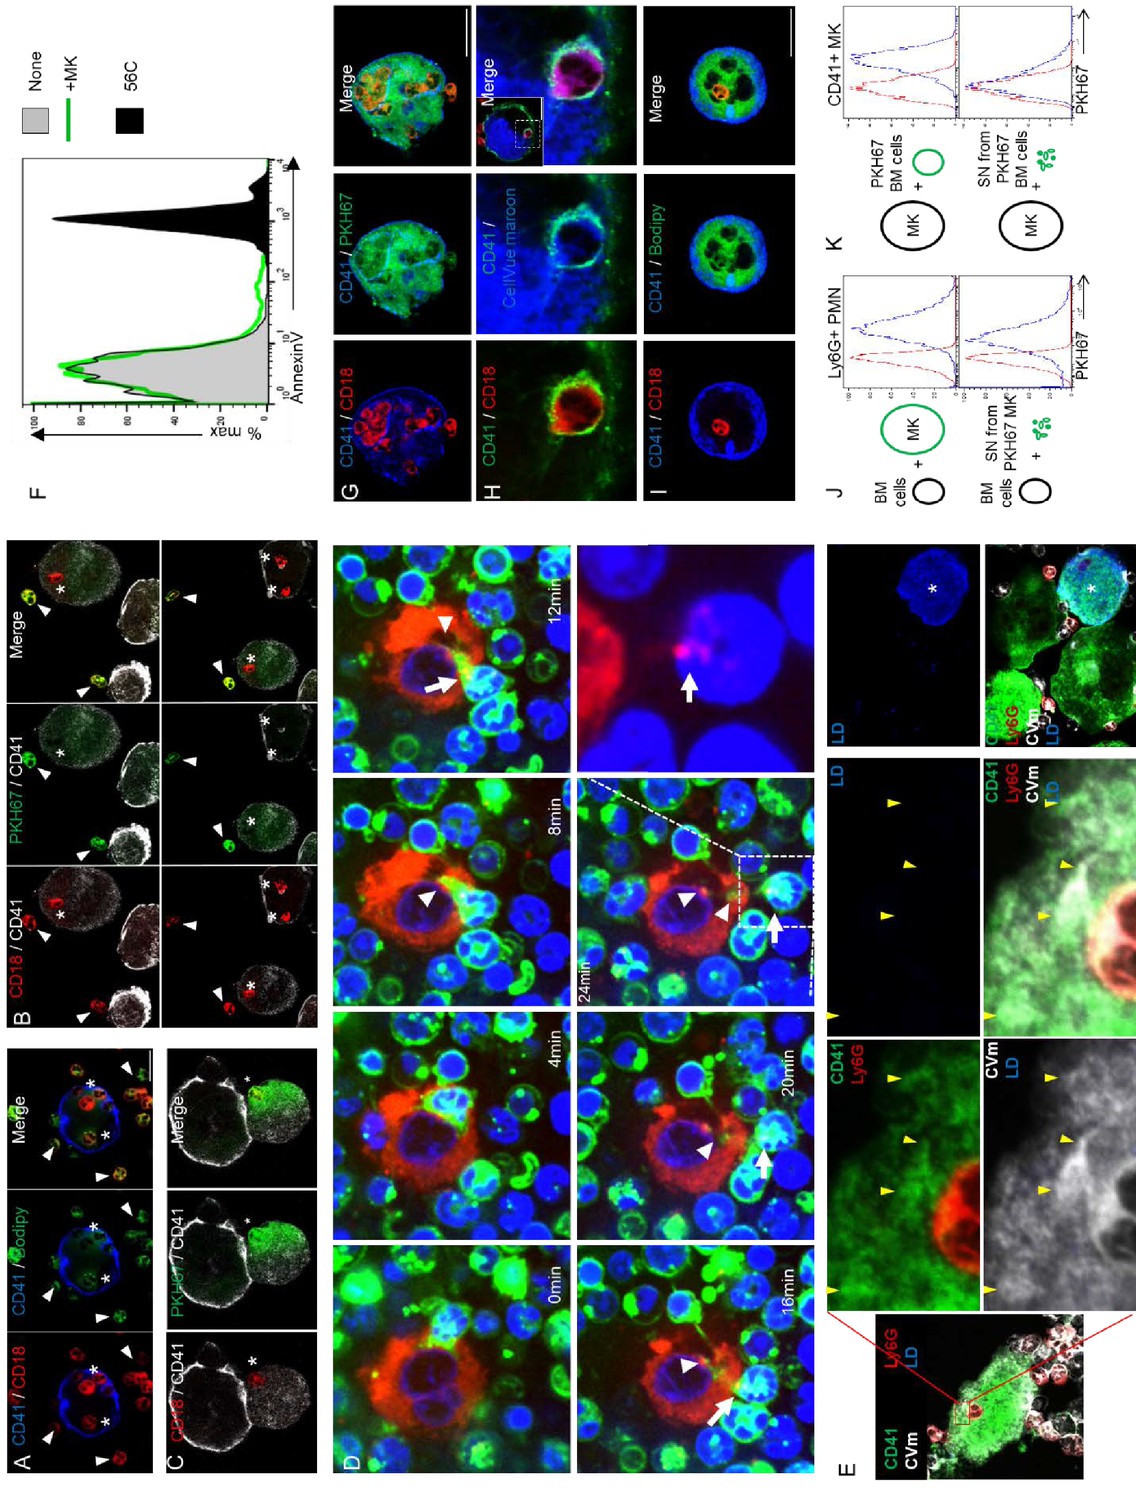
Marrow cells were stained with Bodipy (A) or PKH67 (B and C) prior to the emperipolesis assay. Confocal microscopy shows a loss of lipid stain fluorescence in neutrophils engaged emperipolesis (asterisk). Arrowheads show cells with intact PKH67 fluorescence. (C) Enhanced green settings reveal PKH67 within MKs, with an appearance of diffusion into cytoplasm. (D) Murine MKs stained with PKH26 (red) and marrow cells stained with PKH67 (green) are co-cultured in the presence of DraqV. Time-lapse spinning disk microscopy revealed a rapid passage of a green neutrophil through an MK, leaving green membrane behind (arrowheads). MK red membrane is observed on the neutrophil after emperipolesis (arrows and lower right photo without green staining). (see also Video 4). (E) Bone marrow cells were stained with CellVue Maroon prior to co-culture with MKs, as in Figure 4B. 2 µM of labelled lactadherin (LD, also known as MFGE8) was added in the culture. Confocal microscopy show a transfer of CellVue maroon (white) to the MK DMS (green). The absence of LD binding (blue) demonstrates that phosphatidylserine is not externalized during the process. Right photo: apoptotic MK (asterisk) from the same experiment as a control of LD binding. Representative of 2 experiments. (F) Bone marrow cells are cultured without (gray) or with MKs (green histograms). After overnight coculture, cells are stained with Annexin V. Histograms show Annexin V MFI on Ly6G+ neutrophils. As control of Annexin V binding, cells were heated at 56C for 10 min (black histogram). Representative of 2 experiments. (G-I) MKs were stained with (G) PKH67, (H) CellVue Maroon, or (I) Bodipy prior to co-culture with marrow cells. Confocal microscopy shows co-localization between lipid stain and neutrophil membrane. (J) Marrow cells were cultured with PKH67+ MKs (upper panel) or supernatant (SN) from PKH67+ MK culture (lower panel). Histograms show PKH67 MFI on Ly6G+ neutrophils after culture with unstained MK/SN (red histograms) or PKH67+ MK/SN (blue histograms). (K) MKs were cultured with PKH67+ marrow cells (upper panel) or supernatant from PKH67+ marrow cell culture (lower panel). Histograms show PKH67 MFI on CD41+ MKs after culture with unstained marrow cells/SN (red histograms) or PKH67+ marrow cells/SN (blue histograms). (J and K) Representative of at least three experiments.
Figure 5 with 1 supplement
Neutrophil membranes transferred in emperipolesis emerge on circulating platelets.
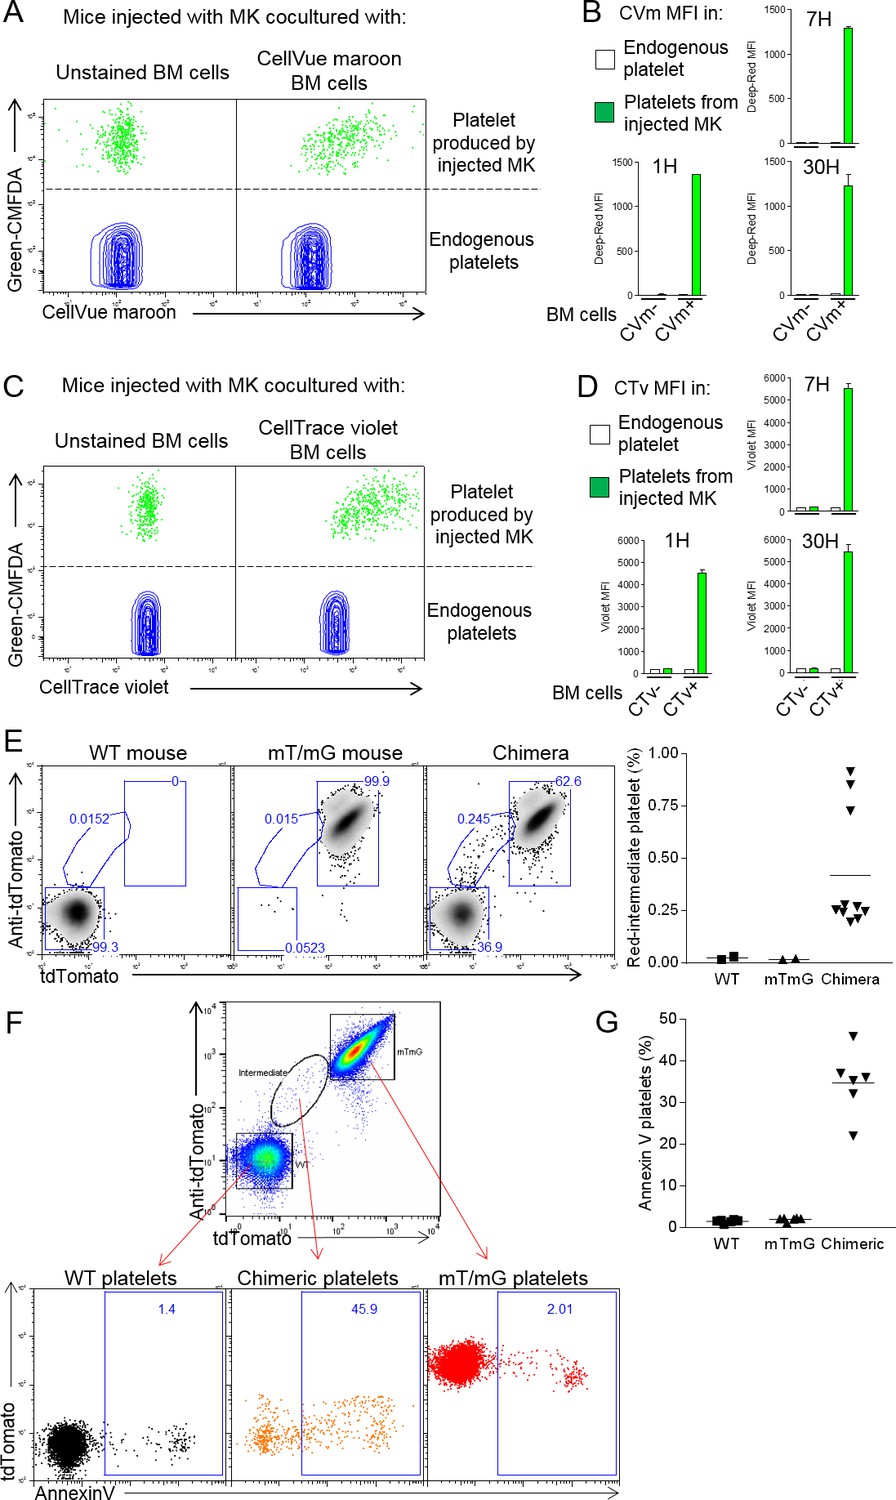
(A) CMFDA+ MKs are co-cultured with either CellVue maroon (CVm) or unstained marrow cells, and injected i.v. (Figure 5—figure supplement 1A). Circulating CD41+ platelets were analyzed serially by flow cytometry. Dot plots show CVm MFI among CMFDA- platelets (endogenous) and CMFDA+ platelets (produced by injected MKs). (B) CellVue maroon MFI on endogenous platelets versus platelets produced by injected MKs over time. (C-D) Same as (B-C) but marrow cells were stained with the protein stain CellTrace violet (CTv) prior to co-culture with CMFDA+ MKs. (E-F) CD45.1 mice were lethally irradiated and engrafted for 4 weeks with a mix of WT and mT/mG marrow. Circulating platelets were fixed, permeabilized and stained with anti-tdTomato. (E) Left: representative dot plots of tdTomato and anti-tdTomato MFI in circulating platelets from WT, mT/mG, and chimera mice. Right: frequency of the red-intermediate population among total platelets, representative of 3 independent experiments. Note that this population underestimates the true post-emperipolesis population because it detects only mT/mG→WT events, not WT→WT, mT/mG→mT/mG, and WT→mT/mG. (F) Annexin V MFI in WT, mT/mG, and chimeric platelets (control for binding specificity in Figure 5—figure supplement 1G). (G) Frequency of Annexin V positive events among WT, mTmG and chimeric platelets. (F-G) Representative of 3 experiments.
Figure 5—figure supplement 1
Neutrophil membranes transferred in emperipolesis emerge on circulating platelets.
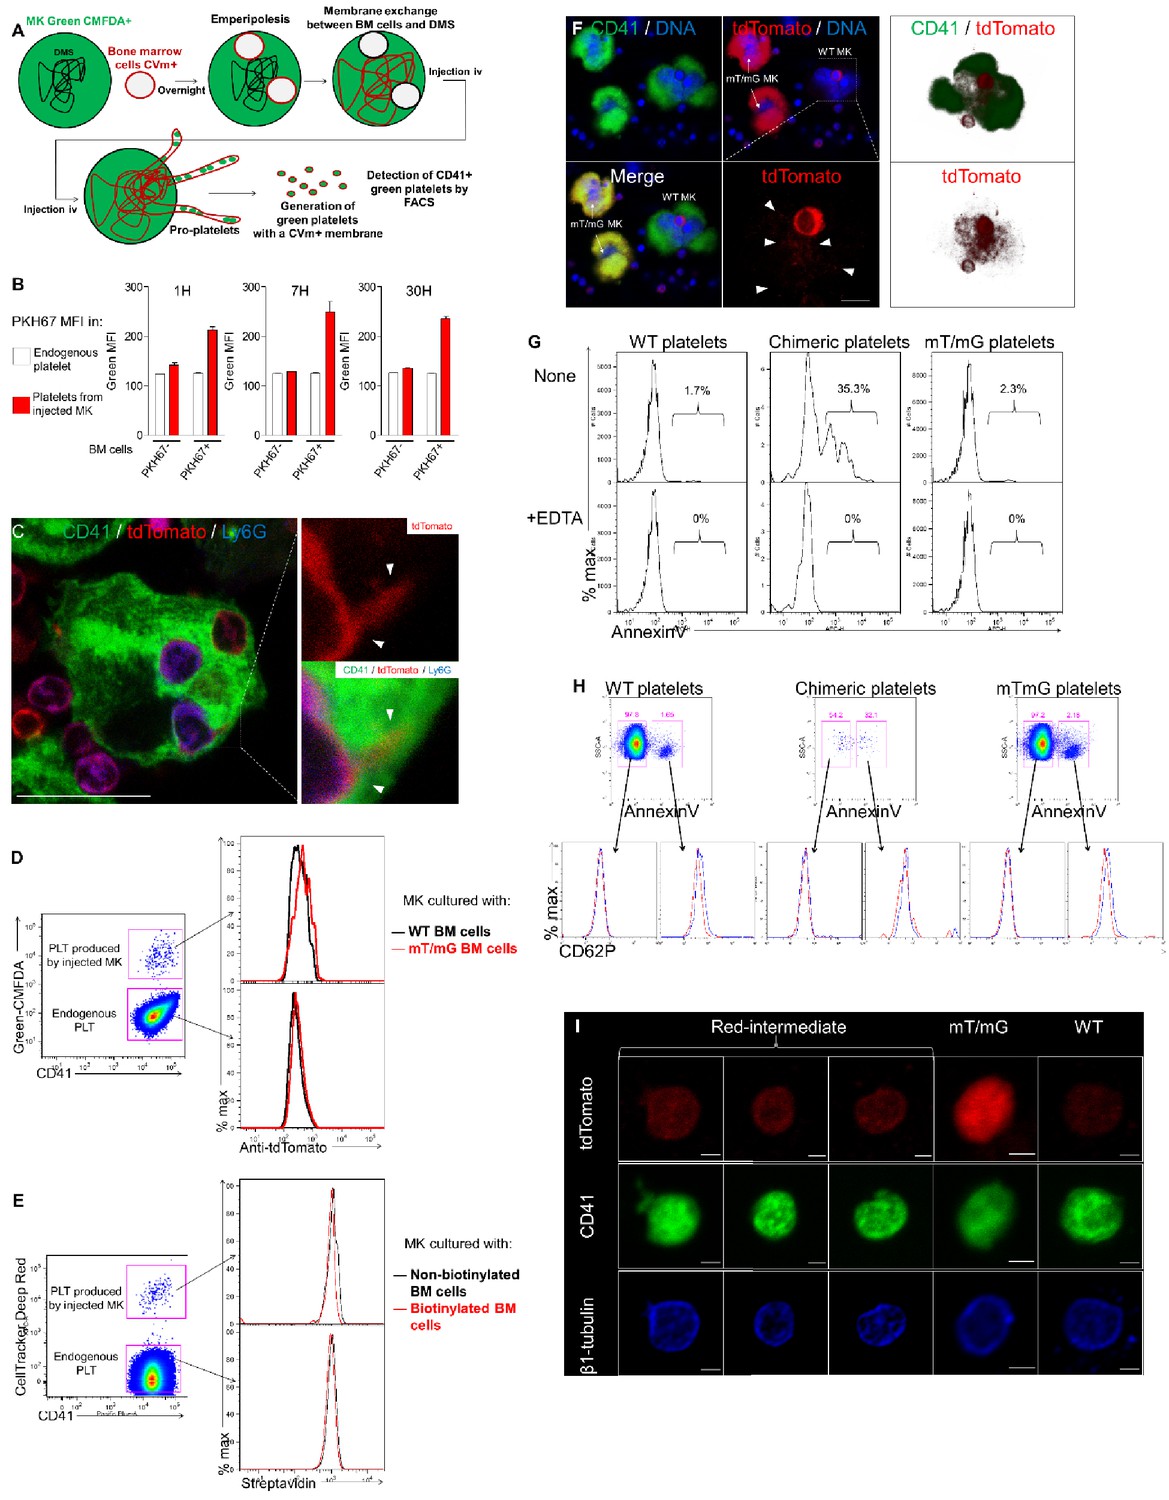
(A) Experimental design for platelet production in vivo. MKs are stained with green-CMFDA to monitor platelet production. CMFDA+ MKs are co-cultured with marrow cells stained with CellVue maroon (far-red lipid stain). If membrane transfer occurs from neutrophil to MK DMS, MKs injected i.v. will produce green platelets bearing far-red (CellVue maroon+) membrane. Tail vein sampling was performed at different time points in the presence of heparin, and fluorescence on green platelets was studied by flow cytometry. (B) Same as in Figure 5A and B, but MKs are stained with CellTracker Deep Red instead of green-CMFDA, and marrow cell membrane is stained with PKH67 instead of CellVue maroon. Presence of PKH67 on platelet surface is studied by flow cytometry. (C) MKs were co-cultured overnight with marrow cells from mT/mG mice. Cells were stained for CD41 (green), Ly6G (blue) and tdTomato (red). Images show the appearance of tdTomato +Ly6G- signal within MKs. (D) MKs stained with green-CMFDA and co-cultured with WT or mT/mG BM cells were injected i.v. After 1 hr, circulating platelets are fixed and stained with an anti-tdTomato antibody. Right: Green-CMFDA stain distinguishes platelets produced by injected MKs from endogenous platelets. Left: tdTomato MFI on platelets in mice injected with MKs co-cultured with WT cells (black histogram) or mT/mG cells (red histograms). Representative of 2 experiments. (E) MKs stained with Cell Tracker Deep Red and co-cultured with surface-biotinylated BM cells were injected i.v. After 1 hr, circulating platelets were stained with Dylight 488-streptavidin. Right: Cell Tracker Deep Red stain distinguishes platelets produced by injected MKs from endogenous platelets. Left: Streptavidin MFI on platelets in mice injected with MKs co-cultured with non-biotinylated (black histogram) or biotinylated marrow cells (red histograms). Representative of 2 experiments. (F) Bone marrow from chimeric mice was flushed directly into PFA, and cells were stained with CD41 (green) and tdTomato (red). DNA is visualized with Hoechst. Right: 2 mT/mG MKs and 1 WT MK containing a mT/mG marrow cell are shown. tdTomato signal is detected around the mT/mG cell (lower right photo). Right: 3D reconstitution of tdTomato signal inside the WT MK. (G-H) Platelets from chimeric mice were incubated with Annexin V as in Figure 5F. (G) Annexin V binding in the presence or not of 5 mM EDTA. Histograms show Annexin V MFI on WT, mT/mG and chimeric platelets (H) CD62P expression on Annexin V + and Annexin V- populations on WT, chimeric and mT/mG platelets. Red histograms: anti-CD62P, Blue histograms: isotype control. (G-H) Representative of at least three experiments. (I) Platelets from chimeric mice were sorted basted on tdTomato expression and stained with anti-CD41 (green) an anti-β1 tubulin (blue). Representative of 2 experiments. Scale bars represents 1 µm.
Figure 6 with 1 supplement
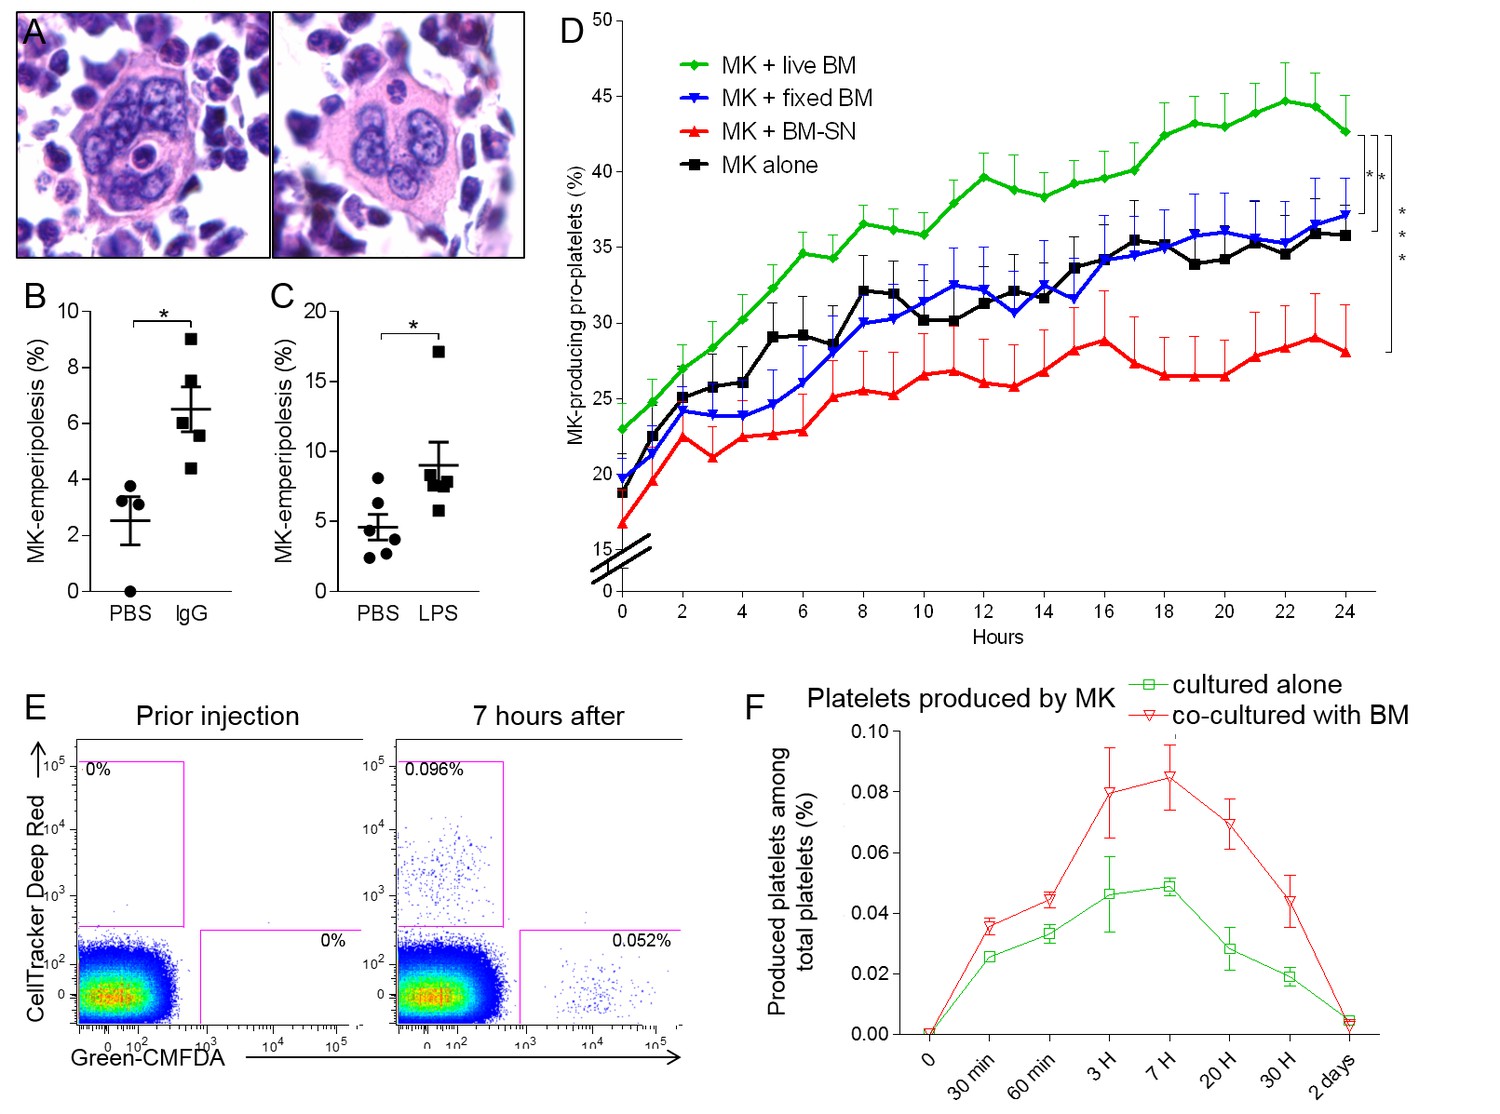
Emperipolesis contributes to platelet production.
(A) Bone sections stained with H and E showing MK containing one neutrophil in an emperiosome (left) or without evident vacuole (right). (B) Tg-FcγR2a mice are treated with HA-IgG for 7 days. Percentage of MKs containing at least one neutrophil was calculated in bone sections, n=4-5 mice per group (See Figure 6—source data 1). (C) Mice were treated with PBS or 25μg LPS i.p. After 3 days, the percentage of MKs containing at least one neutrophil is calculated in bone sections, n=6 mice per group (See Figure 6—source data 1). (D) MKs were cultured alone (black line) or with SN from marrow cell culture (red line), fixed marrow cells (blue line) or live marrow cells (green line). MKs were then enriched and cultured in TPO medium. MKs producing pro-platelets over time were quantitated using IncuCyte. None vs. live marrow: p=0.015; marrow-SN vs. live marrow: p=0.0002; fixed marrow vs. live marrow: p=0.014. Pooled from 5 independent experiments (See Figure 6—source data 1). (E-F) MKs stained with Green-CMFDA or CellTracker Deep Red are either co-cultured or not with marrow cells, mixed together 1:1 and injected i.v. (Figure 6—figure supplement 1C). After different time points, circulating platelets positive for Green-CMFDA or CellTracker Deep Red are detected by flow cytometry. (E) Representative dot plots of green vs. red staining on CD41+ platelets. (F) Frequency of green vs. red population of platelets over time, n=3 mice per group, representative of 4 independent experiments (See Figure 6—source data 1).
-
Figure 6—source data 1
Source data for Figure 6.
- https://doi.org/10.7554/eLife.44031.021
Figure 6—figure supplement 1
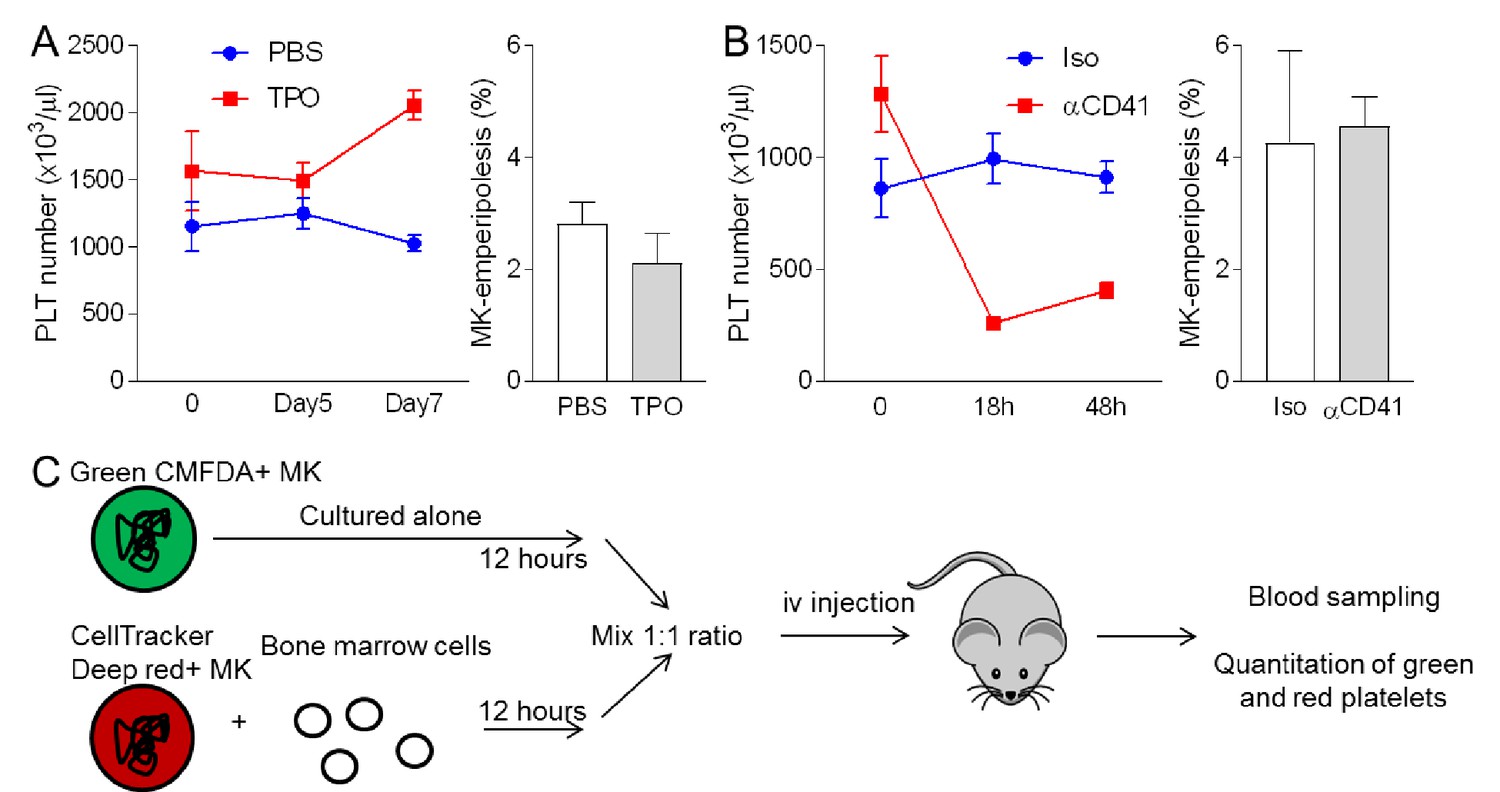
Emperipolesis contributes to platelet production.
(A) Mice were injected daily with PBS or 0.5 µg rmTPO i.v. for 3 days, and bones were harvested after 7 days. (B) Mice were injected with 5 µg anti-CD41 or isotype control i.p. and bones were harvested after 2 days. (A-B) Left: circulating platelet count over time after TPO (A) or anti-CD41 (B) treatment. Right: percentages of MKs containing neutrophil in bone sections stained with H and E. n = 3 females (A) and three males (B) per group, at least 400 MKs per group were counted. (C) Experimental procedure for MK engraftment (Figure 6E and F). Briefly, MKs stained with Green-CMFDA or CellTracker Deep Red were cultured alone or with marrow cells, respectively. After 12 hr incubation, MKs were counted and mixed at a 1:1 ratio. At least 200,000 MKs per recipient were injected i.v.
Figure 7
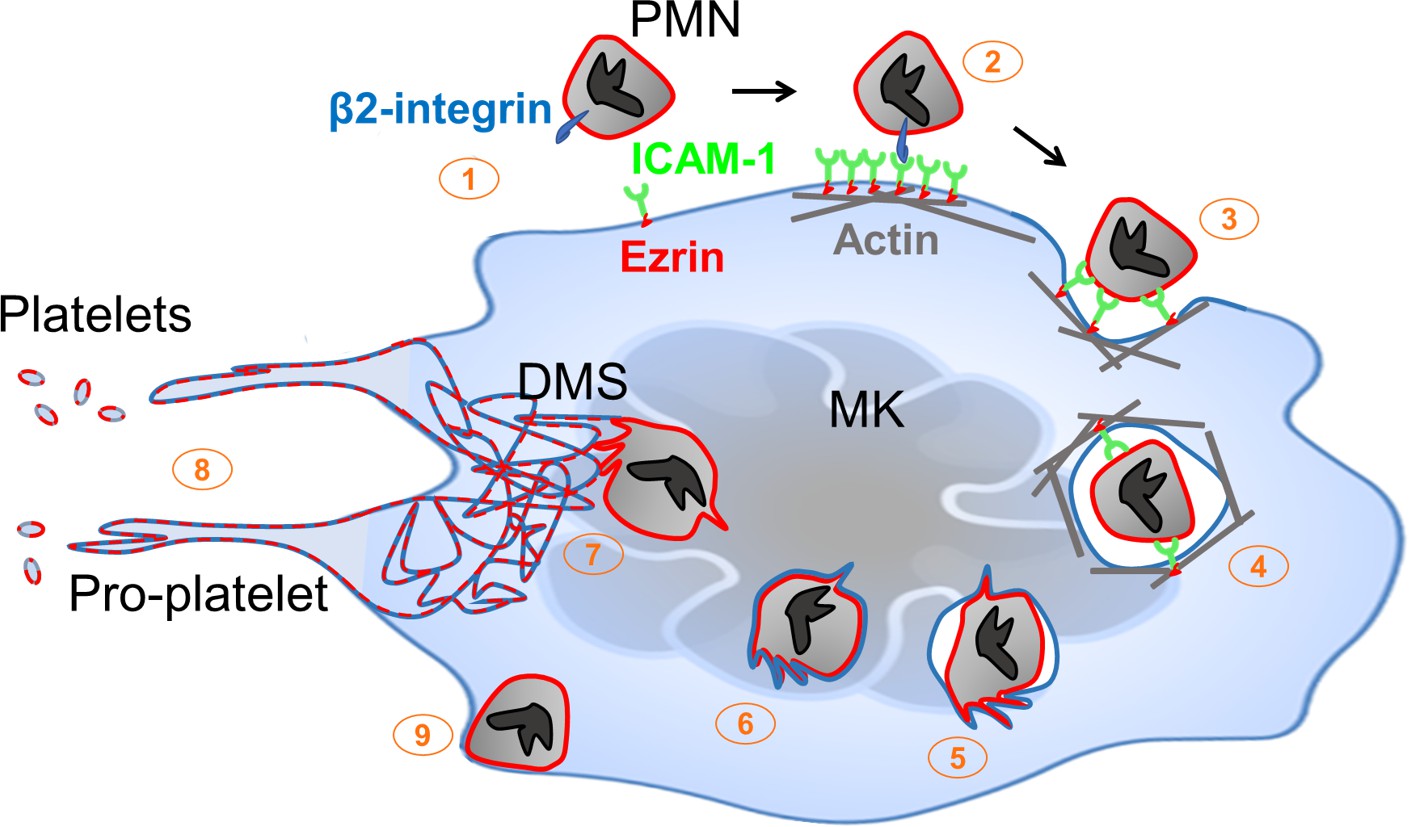
Neutrophil transit through megakaryocytes in emperipolesis mediates membrane transfer and enhanced platelet production – proposed model.
(1) Neutrophils expressing β2 integrin and MKs expressing ICAM-1 are positioned to engage, including via MK tethers. (2) ICAM-1 ligation by neutrophil β2-integrins induces ICAM-1/ezrin pair translocation and clustering, as in transendothelial migration (Ley et al., 2007). (3) Formation of a trans-MK cup in an actin-dependent manner. (4) Neutrophil entry into MK vacuole (“emperisome”). (5-6) Neutrophil and emperisome membranes become closely apposed. Neutrophil and emperisome membranes may merge at some locations. Emperisome membrane disappears, enabling neutrophil entry into the MK cytoplasm. (7) Neutrophil translocates to DMS where membrane fusion occurs, transferring neutrophil membrane and protein. (8) Production of platelets containing neutrophil membrane. (9) Egress of viable neutrophil from MK.
Author response image 1

Marrow cells were treated with 1µM latrunculin A, cytochalasin D, or DMSO.
Inhibitors were either left in culture (A), or thoroughly washed after 2 hours (B). After overnight incubation, cells were permeabilized and stained with labelled phalloidin. Left: Phalloidin MFI on Ly6G+ neutrophils, representative of 3 experiments. Right: Phalloidin MFI expressed as a percentage of control (DMSO condition), n=3.
Author response image 2

Bone marrowcells were stained with CellVue Maroon prior to co-culture with MKs, as in Figure 4B.
2µM of labelled lactadherin (LD, also known as MFGE8) was added in the culture. Confocal microscopy show a transfer of CellVue maroon (white) in the MK DMS (green). The absence of LD binding (blue) demonstrates that phosphatidylserine is not externalized during the process. LD positive cell is shown in Figure 4—figure supplement 1E. Representative of 2 experiments.
Videos
Video 1
Emperipolesis within murine bone marrow.
Three-dimensional reconstitution of murine marrow, showing MKs (green) neutrophils (red), bone marrow sinusoids (white), and DNA (blue). Green, red or blue fluorescence are removed occasionally to visualize neutrophils inside MK or MK tethers. The three animations correspond to the three images shown in Figure 1A.
Video 2
Neutrophil enters megakaryocyte - formation of a trans-megakaryocyte cup.
MKs stained with PKH67 (green) were co-cultured with marrow cells stained with PKH26 (red) in the presence of Draq5 (DNA, blue). Video shows the formation of a transcellular cup on the MK surface allowing neutrophil entry.
Video 3
Megakaryocyte tethers and neutrophil entry into a CD41+ vacuole.
MKs stained with anti-CD41 (green) were co-cultured with marrow cells from mT/mG mice (red) in the presence of Draq5 (DNA, blue). Video shows a neutrophil on the MK surface, attached by MK tethers, followed by a rapid entry through a CD41+ membrane. A few minutes after its entry, the neutrophil exits at the bottom of the field of view.
Video 4
Neutrophil exits megakaryocyte.
MKs stained with anti-CD41 (green) were co-cultured with marrow cells from mT/mG mice (red) in the presence of Draq5 (DNA, blue). A neutrophil is present inside MK, but without interposed CD41+ membrane. Neutrophil exits MK and remains attached on its surface. Video obtained with a laser scanning confocal microscope.
Video 5
Transfer of membrane during rapid emperipolesis.
MKs stained with PKH67 (green) were co-cultured with marrow cells stained with PKH26 (red) in the presence of Draq5 (DNA, blue). Video shows a neutrophil entering and rapidly transiting through a MK, leaving green membrane behind. Green or red fluorescence is removed at some time points to visualize bi-directional membrane transfer.
Video 6
Transfer of membrane during long-lasting emperipolesis.
MKs stained with PKH67 (green) were co-cultured with marrow cells stained with PKH26 (red) in the presence of Draq5 (DNA, blue). Video shows a neutrophil residing within an MK. Green or red fluorescence is removed at some time points to visualize bi-directional membrane transfer.
Additional files
-
Transparent reporting form
- https://doi.org/10.7554/eLife.44031.023
Download links
A two-part list of links to download the article, or parts of the article, in various formats.
Downloads (link to download the article as PDF)
Open citations (links to open the citations from this article in various online reference manager services)
Cite this article (links to download the citations from this article in formats compatible with various reference manager tools)
Megakaryocyte emperipolesis mediates membrane transfer from intracytoplasmic neutrophils to platelets
eLife 8:e44031.
https://doi.org/10.7554/eLife.44031


