Genetic dissection of the different roles of hypothalamic kisspeptin neurons in regulating female reproduction
- University of Michigan, United States
Figures
Figure 1 with 1 supplement

AVPV kisspeptin neurons from KERKO mice are less excitable compared to those from control mice and are not regulated by estradiol.
(a) Representative extracellular recordings for cells from control and KERKO mice from ovary-intact, OVX and OVX +E groups. (b) Individual values and mean ± SEM firing frequency of cells from control (white circles) and KERKO groups (black circles). (c) representative depolarizing (magenta,+20 pA, 500 ms) and hyperpolarizing (black, −20 pA, 500 ms) firing signatures for cells from control and KERKO mice in ovary-intact (left), OVX (middle) and OVX +E (right) groups; black arrows indicate rebound bursts and red arrows indicate depolarization-induced bursts (DIB). Initial membrane potential was 70 ± 2 mV. (d) and (e) percent of cells exhibiting DIB (d) or rebound (e) bursts; cells per group is shown within the bar. (f) Input-output curves for cells from control and KERKO mice; ovary-intact (left), OVX (middle) and OVX +E (right). *p<0.05.
Figure 1—figure supplement 1
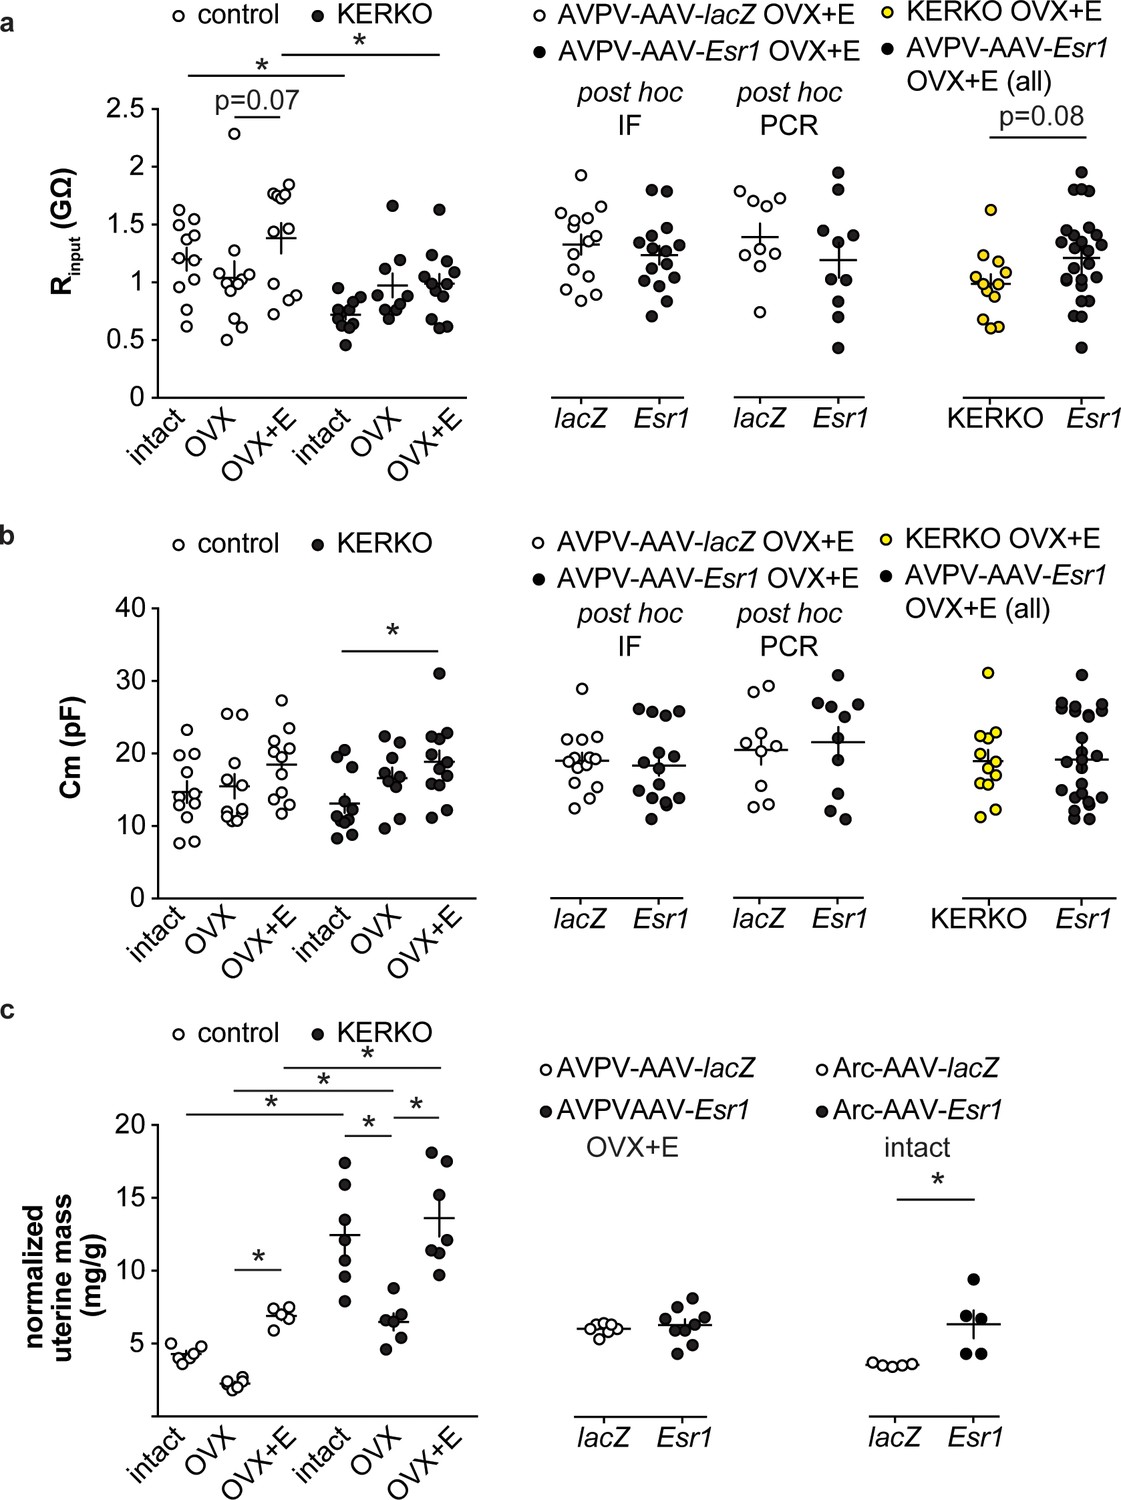
Recording parameters and uterine mass.
(a) Individual values and mean ± SEM input resistance (Rinput, a) and cell capacitance (Cm, b) for AVPV kisspeptin neurons in control and KERKO mice (left), in mice with AAV vector delivered to AVPV region (middle with Esr1 status confirmed by either immunofluorescence (IF) single-cell qPCR (PCR) post hoc), and in AVPV-AAV-Esr1 infected mice (combined detection methods) vs KERKO mice (right). (c) Individual values and mean ± SEM normalized uterine mass (uterine mass/body mass, mg/g) of control and KERKO mice (left), of mice with AAV delivered to AVPV region, OVX +E (middle), and of mice with AAV delivered to arcuate region, intact (right). *p<0.05. The lack of a significant drop in the ratio is likely attributable to the short duration post OVX (2 days).
Figure 2
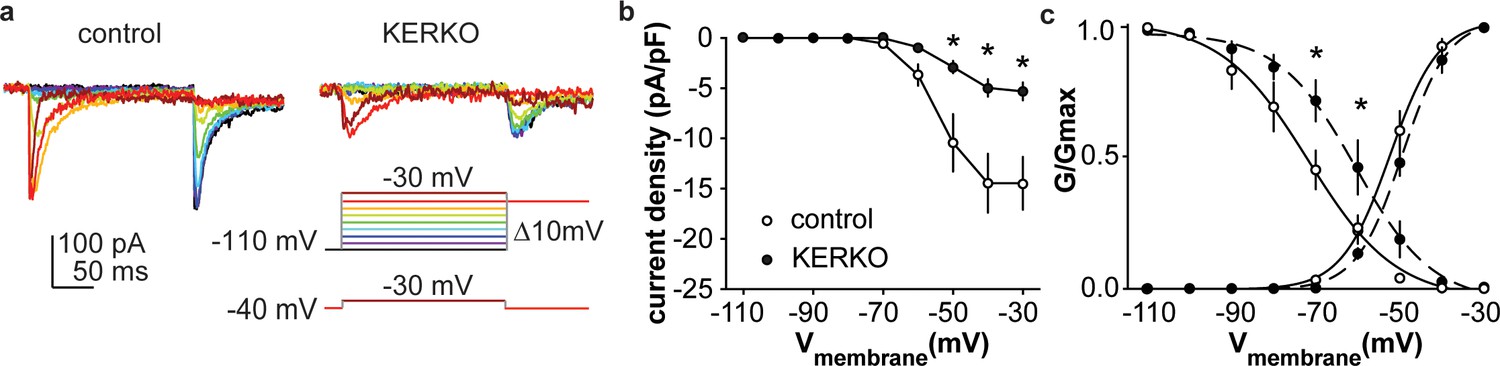
T-type calcium currents are reduced in AVPV kisspeptin neurons from KERKO compared to control mice.
(a) Voltage protocol (bottom right) and representative IT in control (left) and KERKO groups (right). (b) Mean ± SEM IT current density in control (white symbols) and KERKO groups (black symbols). (c) Voltage dependence of IT conductance activation and inactivation in cells from control and KERKO mice. *p<0.05.
Figure 3 with 1 supplement
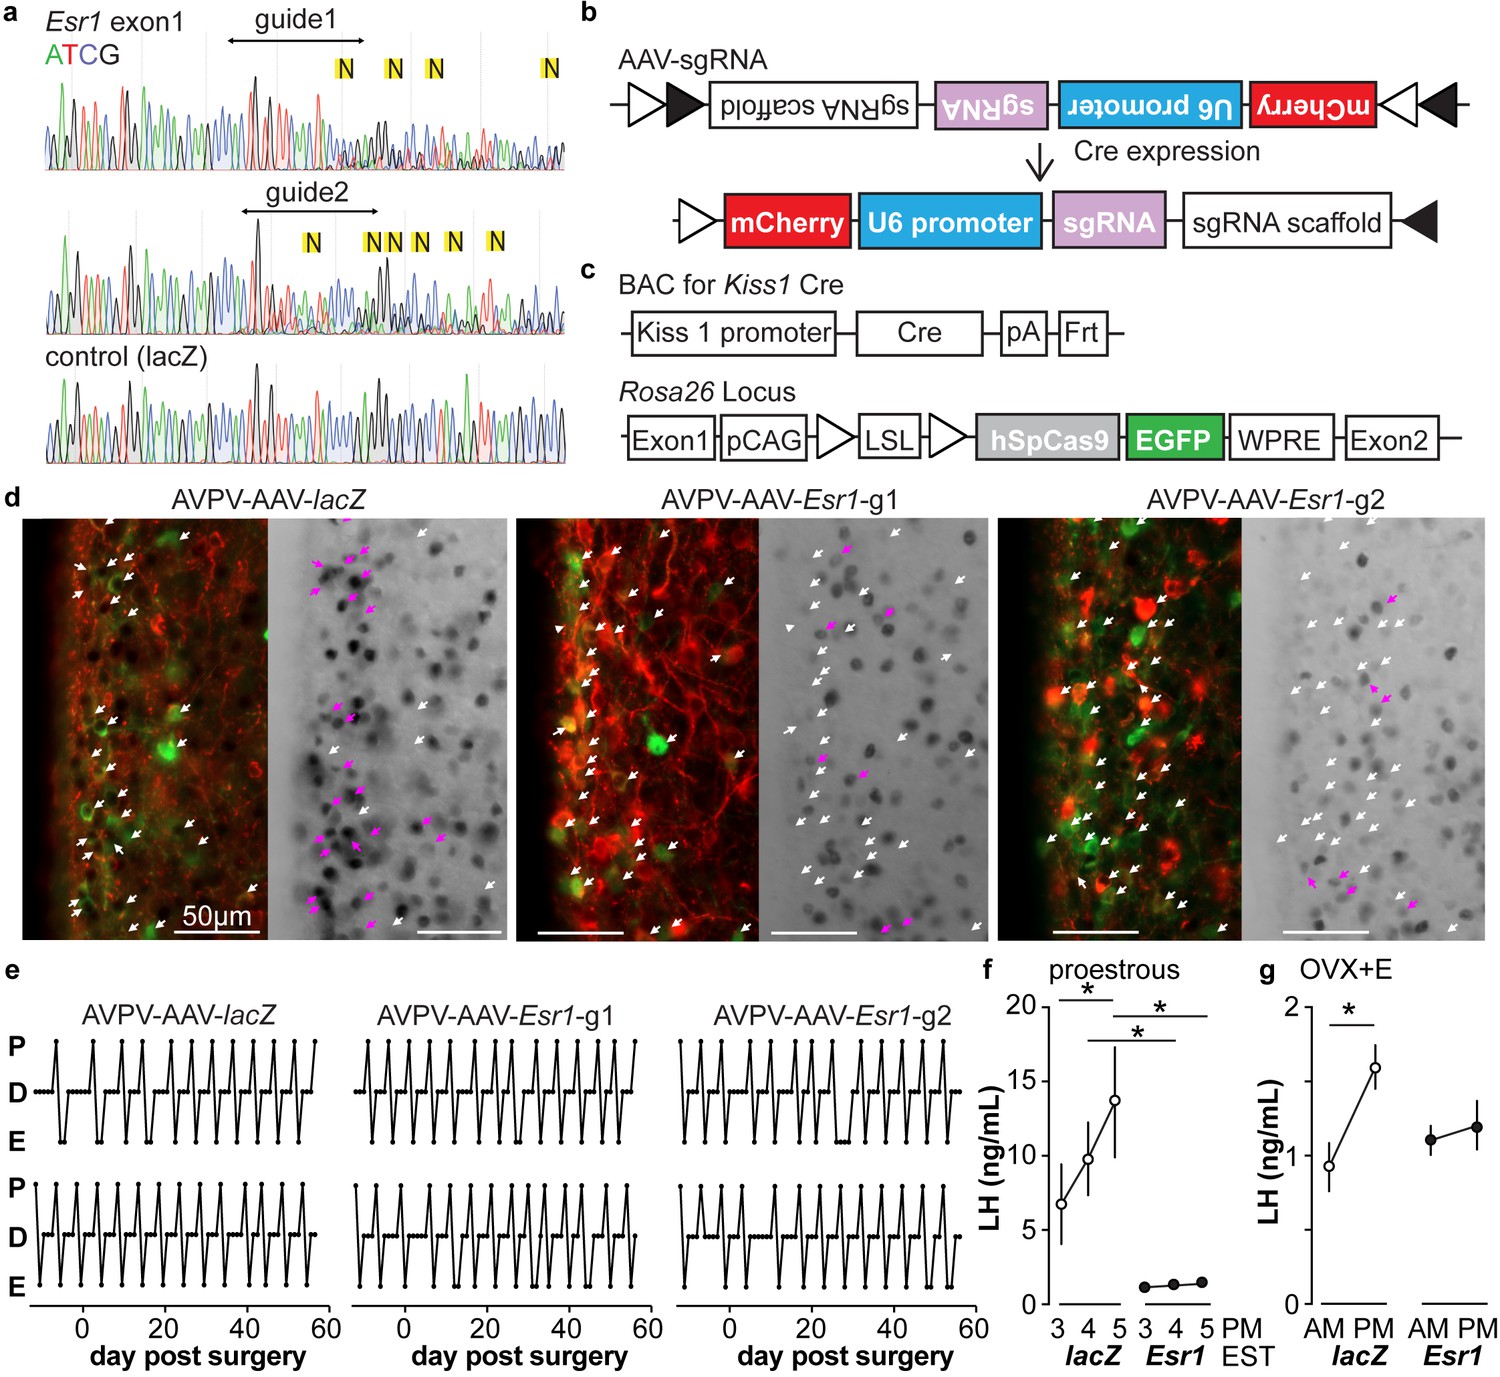
In vitro and in vivo validation of AVPV-AAV-Esr1 guides.
(a) Sequencing from C2C12 cells transiently transfected with lentiCRISPR v2 with sgRNAs targeting Esr1 (guide 1 [g1] top, guide 2 [g2] middle) or lacZ. N in yellow highlight indicates peak on peak mutations. (b) and (c) Schematic representation of (b) the Cre-inducible AAV vector delivering sgRNAs and (c) Kiss1-cre Cas9-loxp Stop-Gfp mice. (d) AVPV-AAV-lacZ, -Esr1 g1 or g2 were bilaterally delivered to the AVPV region (see Figure 3—figure supplement 1). Brain sections were processed to detect GFP (green), mCherry (red) and ERα (black), dual GFP/mCherry detection indicates infection of kisspeptin neuron (white arrows, left panel of each pair). AVPV-AAV-Esr1 infected AVPV kisspeptin neurons exhibit decreased ERα expression compared to AVPV-AAV-lacZ infected cells (right panel of each pair, white arrows indicate ERα-negative, magenta arrows indicate ERα-positive infected cells). (e) Representative reproductive cycles of mice that received AAV-lacZ, g1 or g2; E, estrus; D, diestrus; P, proestrus; day 0 is the day of stereotaxic surgery. (f) Mean ± SEM proestrous LH surge measured at 3, 4, and 5 pm EST in AVPV-AAV-lacZ and AVPV-AAV-Esr1 mice (mice receiving g1 or g2 combined). (g) Mean ± SEM estradiol-induced LH surge measured at 9 am and 5 pm EST from AAV-lacZ and AAV-Esr1 OVX + E mice (mice receiving g1 or g2 were combined).
Figure 3—figure supplement 1
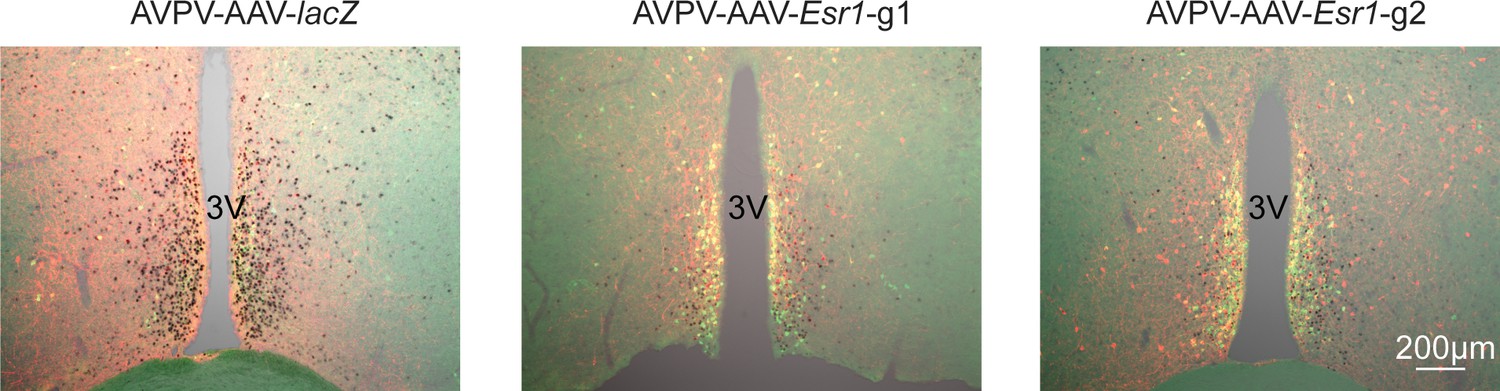
Bilateral delivery of AAV-lacZ, and AAV-Esr1 (g1 and g2) to AVPV of adult female mice.
Immunofluorescence was used to detect GFP (green), mCherry (red) and immunohistochemistry to detect ERα (black).
Figure 4 with 1 supplement
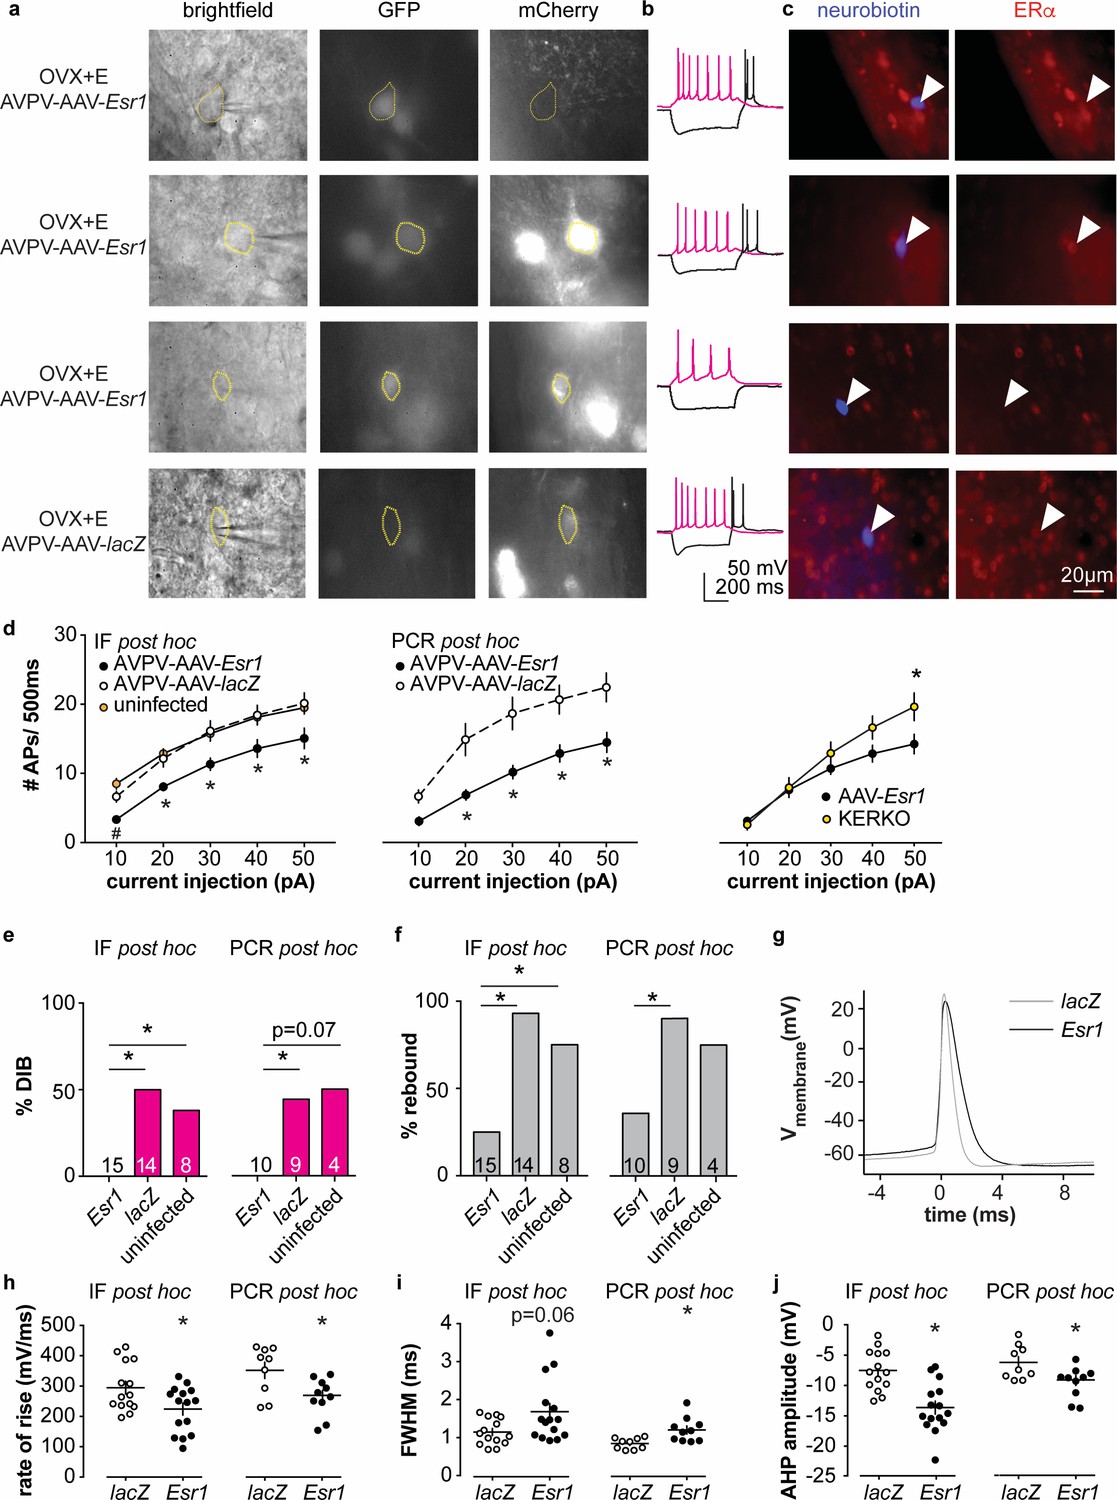
Decreased excitability of AVPV kisspeptin neurons in AVPV-AAV-Esr1 knockdown mice.
(a–c) whole-cell recording and immunofluorescence (IF) post hoc identification of ERα in recorded cells in OVX + E AVPV-AAV-Esr1 infected mice. (a) visualization during recording; (b) representative depolarizing (+20 pA, magenta) and hyperpolarizing (−20 pA, black) firing signatures. (c) neurobiotin (blue) and ERα (red) staining after photobleaching of GFP and mCherry signals. From top to bottom: cells not infected by AVPV-AAV-Esr1 and immunopositive for ERα; cells infected by AVPV-AAV-Esr1 but still immunopositive for ERα; cells infected by AAV-Esr1 and not immunopositive for ERα; cells infected by AVPV-AAV-LacZ and immunopositive for ERα. (d) left, input-output curves of infected cells with undetectable ERα in AAV-Esr1 (third row in a-c, black circle), cells infected by AVPV-AAV-lacZ (bottom row in a-c, white circle, n = 14), and cells not infected by AAV (top row in a-c, orange circle); middle, input-output curves from a separate set of cells in which Esr1 status was confirmed by single-cell qPCR post hoc (AAV-Esr1 black circle; AAV-lacZ, white circle); right, input-output curve of AVPV-AAV-Esr1 knockdown (black circle) vs KERKO (yellow circle) cells. (e,f) percent of cells exhibiting DIB (e) or rebound bursts (f). Cells per group is shown within or on top of the bar. (g), representative action potentials at the rheobase from lacZ vs Esr1 infected cells. (h–j) individual values and mean ± SEM rate of rise (h) full width at half maximum (FWHM) (i) and afterhyperpolarization potential amplitude (AHP) (j). *p<0.05 vs all other groups; # p<0.05 vs uninfected.
Figure 4—figure supplement 1

Single-cell qPCR for mRNA from AVPV kisspeptin neurons in mice with AAV vector delivered to AVPV region.
Bar graphs show percentage of cell positive for each gene. *p<0.05, Fisher’s exact test.
Figure 5 with 1 supplement
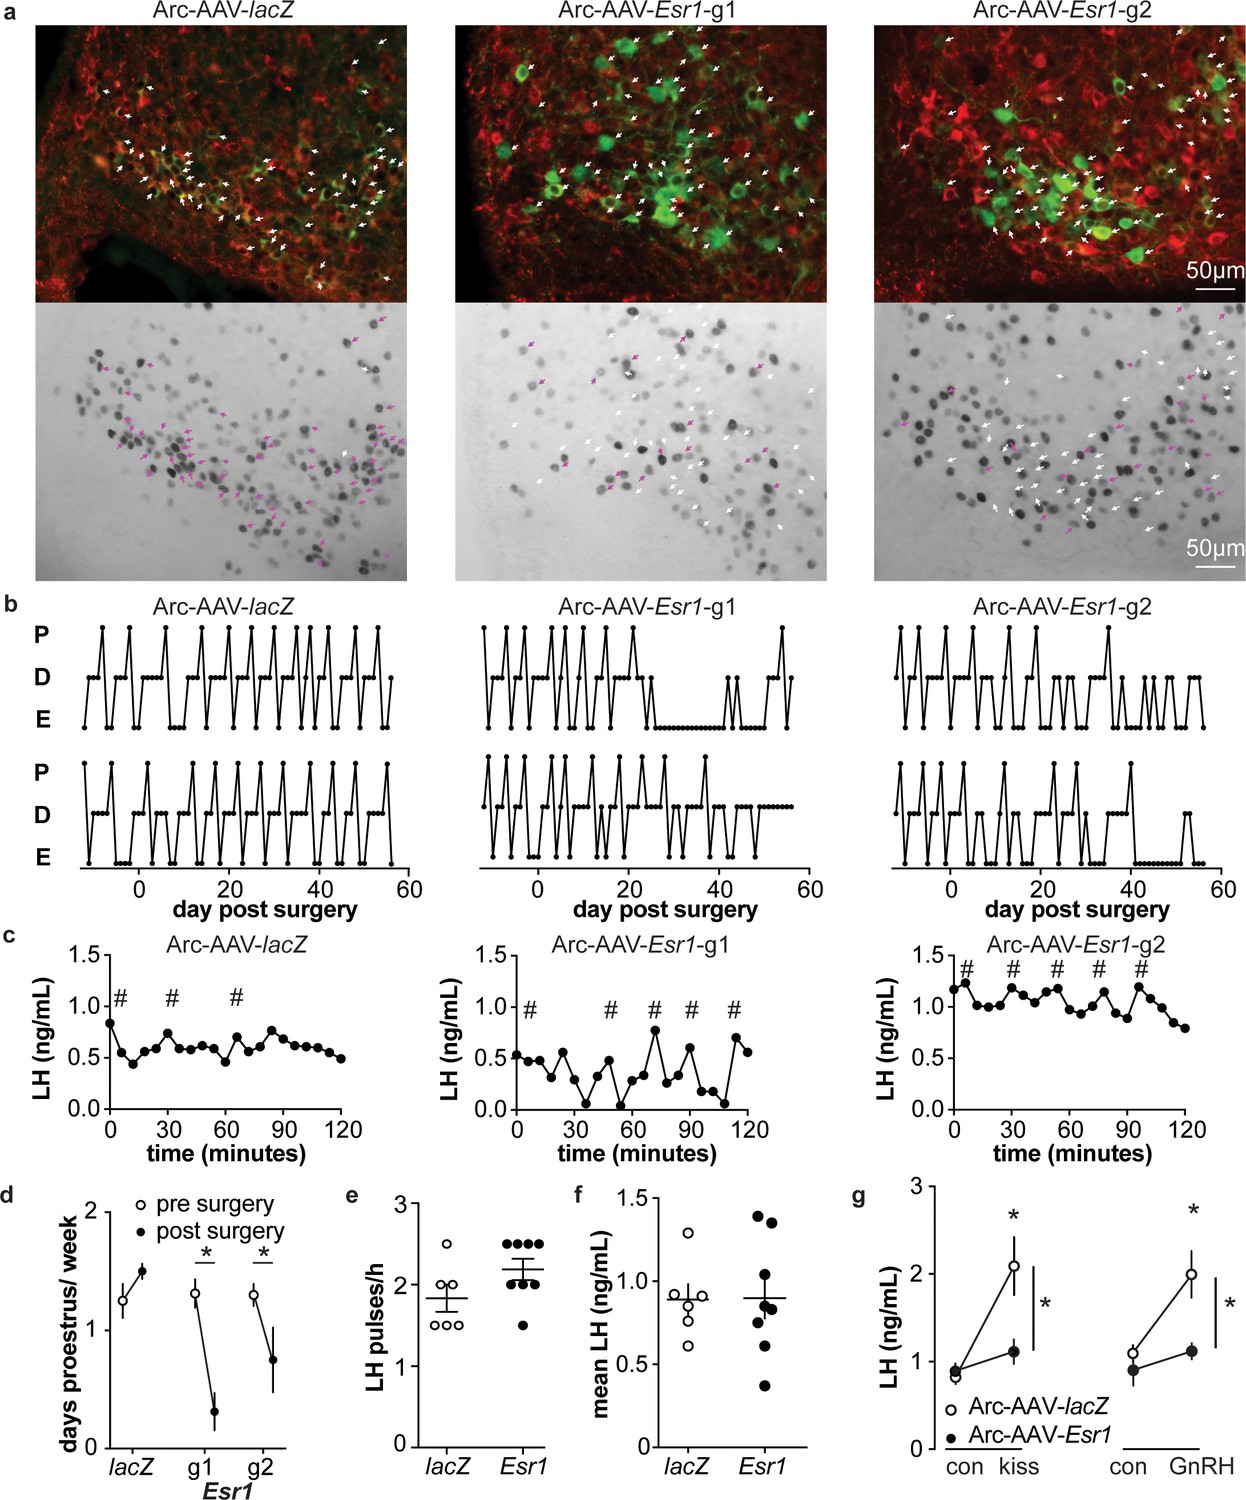
Deletion of ER in arcuate kisspeptin neurons.
(a) Arc-AAV-lacZ and Arc-AAV-Esr1 (g1 or g2) were bilaterally delivered to arcuate region (see Figure 5—figure supplement 1). Brain sections were processed to detect GFP (green), mCherry (red) and ERα (black). Arc-AAV-Esr1 infected arcuate kisspeptin neurons exhibit decreased ERα expression compared to Arc-AAV-lacZ infected cells (bottom panel of each pair, white arrows indicate ERα-negative, magenta arrows indicate ERα-positive infected cells). (b) representative reproductive cycles of mice that received Arc-AAV-lacZ, -Esr1 g1 or g2; E, estrus; D, diestrus; P, proestrus. Day 0 indicates the day of stereotaxic surgery. (c) pulsatile LH release in Arc-AAV-lacZ, -Esr1 g1 or g2 mice, # indicate pulse detected by Cluster analysis (Veldhuis and Johnson, 1986). (d) Mean ± SEM days/week in proestrus before (from day −12 to day 14) and after infection (day 29 to day 56) in mice receiving Arc-AAV-lacZ, -Esr1 g1 or g2. (e) Individual values and mean ± SEM LH pulses/h. (f) Individual means and mean ± SEM mean LH over the entire pretreatment sampling period. (g) Mean ± SEM LH before (con) and 15 min after kisspeptin (kiss) injection (left) and before (con) and 15 min after GnRH injection (right). *p<0.05.
Figure 5—figure supplement 1

Bilateral delivery of AAV-lacZ, and AAV-Esr1 (g1 and g2) to arcuate of adult female mice.
Immunofluorescence was used to detect GFP (green), mCherry (red) and immunohistochemistry to detect ERα (black).
Figure 6
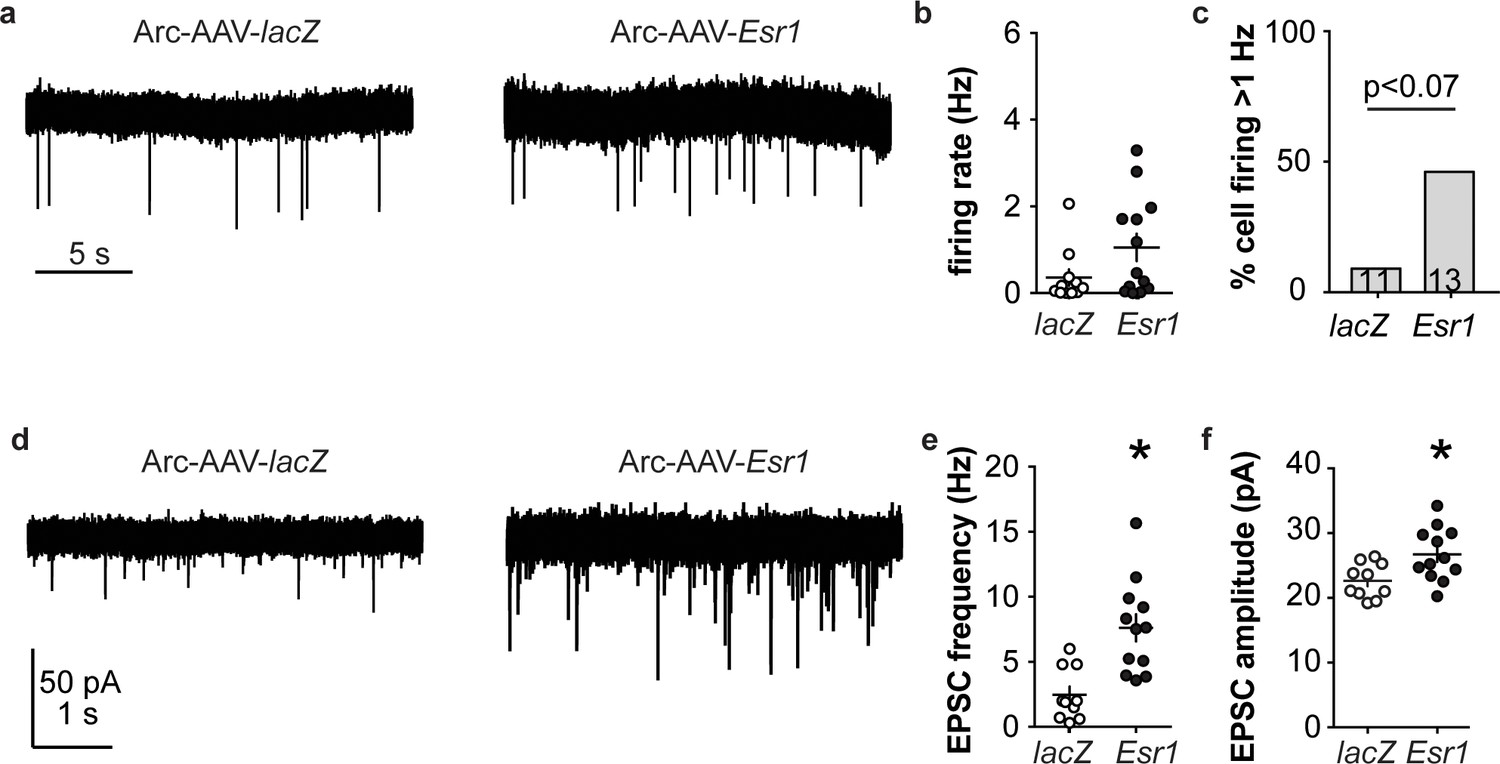
Esr1 knockdown in arcuate kisspeptin neurons alters cellular physiology.
(a) Representative extracellular recordings of firing rate. (b), (c) individual values and mean ± SEM firing rate (b) and percent of cells with firing rate >1 Hz (c); cells per group shown in bars. (d) representative whole-cell recordings of EPSCs. (e, f) individual values and mean ± SEM of EPSC frequency (e) and amplitude (f). *p<0.05.
Figure 7
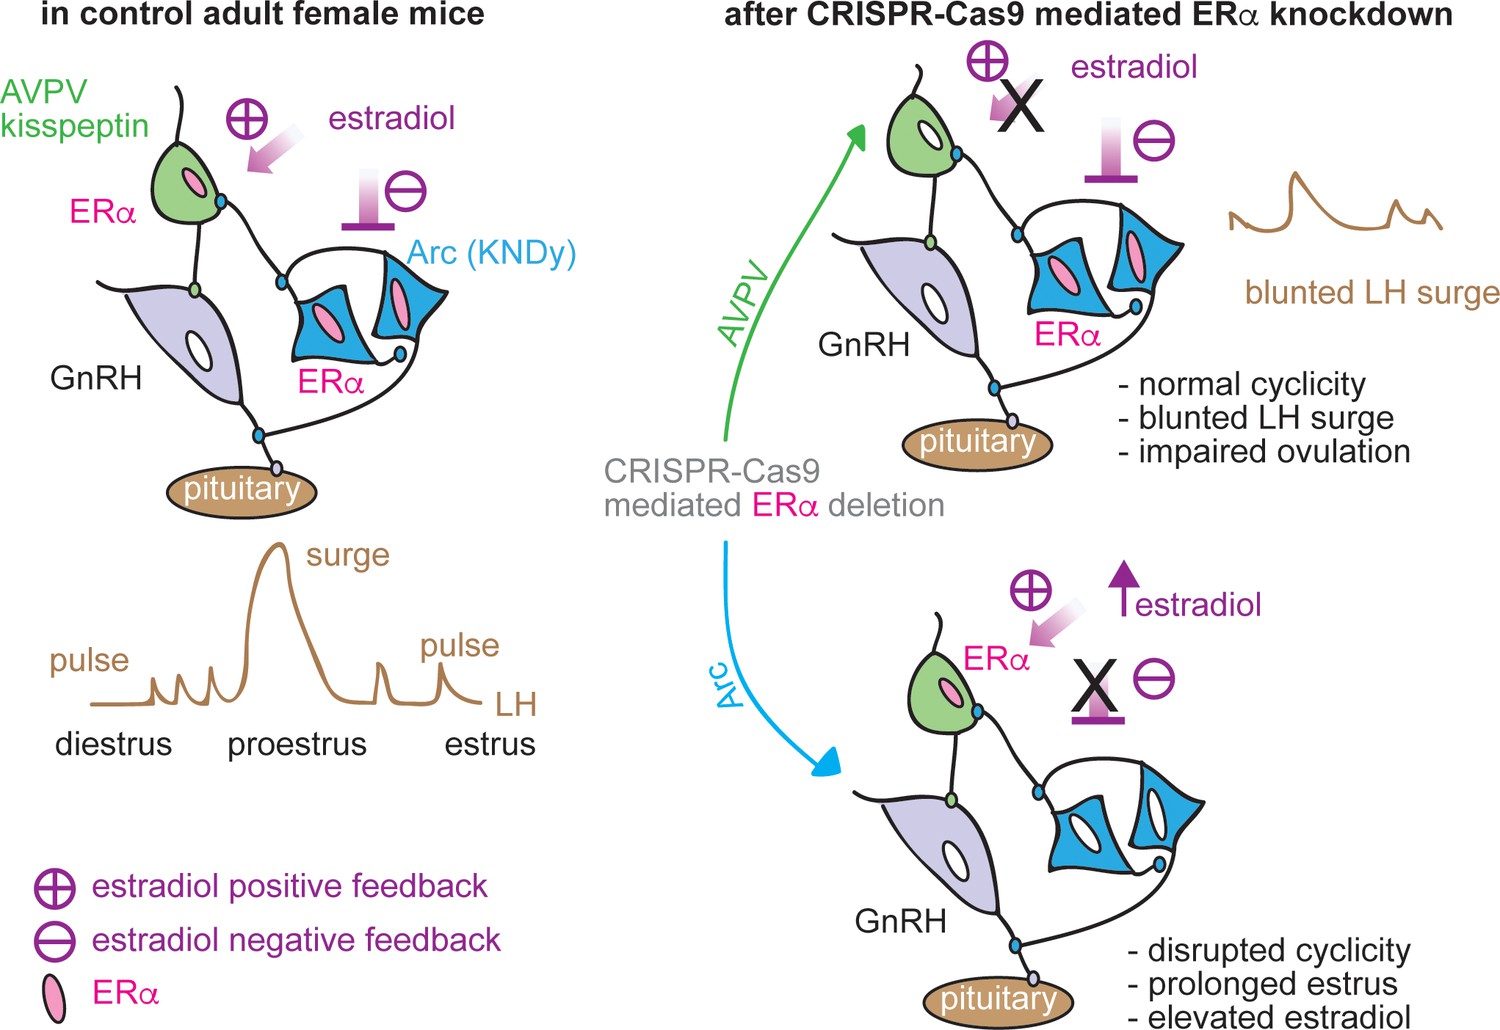
Schematic diagram of estradiol feedback regulation on ERα in AVPV and arcuate kisspeptin neurons in adulthood.
Knockdown of ERα in AVPV kisspeptin neurons blunted LH surge but did not alter reproductive cyclicity whereas knockdown of ERα in arcuate kisspeptin neurons disrupted the cyclicity.
Tables
Table 1
Statistical parameters for two-way ANOVA.
https://doi.org/10.7554/eLife.43999.005| Parameter | Figure | Factor 1 | Factor 2 | Interaction |
|---|---|---|---|---|
| Firing frequency | Figure 1b | steroid F (2, 57)=14.7 * | genotype F (1, 57)=40.1 * | F (2, 57)=6.2 * |
| Input-output curve | Figure 1f intact OVX OVX + E | current F (4, 80)=242.7 * F (4, 72)=138.6 * F (4, 84)=182.2 * | genotype F (1, 20)=8.2 * F (1, 18)=0.8 F (1, 21)=6.6 * | F (4, 80)=0.6 F (4, 72)=0.7 F (4, 84)=1.5 |
| IT current density | Figure 2b | voltage F (8, 104)=39.74 * | genotype F (1, 13)=11.1 * | F (8, 104)=9.4 * |
| IT normalized conductance | Figure 2c activation inactivation | voltage F (8, 104)=494.7 * F (8, 104)=195.8 * | genotype F (1, 13)=3.2 F (1, 13)=4.5 * | F (8, 104)=1.5 F (8, 104)=3.1 * |
| LH | Figure 3f Figure 3g | AAV type F (1, 12)=29.8 * F (1, 13)=0.3 | time F (2, 24)=2.1 F (1, 13)=35.8 * | F (2, 24)=1.8 F (1, 13)=19.5 * |
| Input-output curve | Figure 4d IF post hoc PCR post hoc AAV-Esr1 vs KERKO | current F (4, 136)=165.5 * F (4, 68)=123 * F (4, 100)=154.7 * | AAV type F (2, 34)=7.2 * F (1, 17)=12.5 * F (1, 25)=2.1 | F (8, 136)=0.7 F (4, 68)=4.3* F (4, 100)=7.2 |
| Days proestrus/week | Figure 5d | time F (1, 12)=13.6 * | AAV type F (2, 12)=5.8 * | F (2, 12)=10.0 * |
| LH | Figure 5g kisspeptin GnRH | injection F (1, 12)=34.8 * F (1, 12)=20.0 * | AAV type F (1, 12)=4.7 # F (1, 12)=7.0 * | F (1, 12)=17.1 * F (1, 12)=7.5 * |
| steroids | genotype | interaction | ||
| Input resistance | Figure 1—figure supplement 1a | F (2, 59)=2.6 | F (1, 59)=13.2 * | F (2, 59)=2.0 |
| Cell capacitance | Figure 1—figure supplement 1b | F (2, 59)=5.2 | F (1, 59)=0.1 * | F (2, 59)=0.4 |
| Normalized uterine mass | Figure 1—figure supplement 1c | F (2, 30)=19.9 * | F (1, 30)=80.0 * | F (2, 30)=2.4 |
-
*p<0.05, # p=0.05
Table 2
Statistical parameters for two group comparisons.
For normally distributed data, two-tailed unpaired Student’s t-test; for non-normally distributed data, two-tailed Mann-Whitney U test.
| Parameter | Figure | T or U, df |
|---|---|---|
| V1/2 activation slope V1/2 inactivation slope inactivation | in the text, control vs KERKO IT kinetics | t = 1.7, 13 t = 0.01, 13 t = 2.5, 13 t = 1.6, 13 |
| rate of rise IF rate of rise PCR FWHM IF FWHM PCR AHP amplitude IF AHP amplitude PCR | Figure 4h Figure 4i Figure 4j | t = 2.5, 27 t = 2.7, 17 U = 62 t = 3.1, 17 t = 4.4, 27 t = 2.7, 27 |
| LH pulses/h | Figure 5e | t = 1.7, 12 |
| Mean LH | Figure 5f | t = 0.05, 12 |
| Firing rate | Figure 6b | U = 45.5 |
| EPSC frequency | Figure 6e | t = 4.0, 20 |
| EPSC amplitude | Figure 6e | t = 2.7, 20 |
| Input resistance lacZ vs Esr1 IF, lacZ vs Esr1 PCR, KERKO vs Esr1 | Figure 1—figure supplement 1a | t = 0.7, 27 t = 1.0, 17 t = 1.8, 35 |
| Cell capacitance lacZ vs Esr1 IF, lacZ vs Esr1 PCR, KERKO vs Esr1 | Figure 1—figure supplement 1b | t = 0.4, 27 t = 0.3, 17 t = 0.3, 35 |
| Normalized uterine mass lacZ vs Esr1 AVPV lacZ vs Esr1 arcuate | Figure 1—figure supplement 1c | t = 0.5, 14 t = 2.9, 8 |
-
*p<0.05, # p=0.05
Table 3
Specificity of the Esr1 sgRNAs and off-target predictions by Feng Zhang’s guide design tool software (http://crispr.mit.edu); Benchling analysis (https://benchling.com/academic) produced a subset of these results.
https://doi.org/10.7554/eLife.43999.010| sgRNA | *Specificity score | & mismatches (MMs) between sgRNA and gene locus | Gene | # Off-target score | Locus | |
|---|---|---|---|---|---|---|
| Esr1-g1 | 90 | 4MMs [2:9:11:12] | NM_013870 | Smtn | 0.2 | chr11:+3417882 |
| 4MMs [5:10:13:19] | NM_009728 | Atp10a | 0.2 | chr7:−66040030 | ||
| 4MMs [4:9:15:20] | NM_023805 | Slc38a3 | 0.1 | chr9:+107561207 | ||
| 4MMs [7:8:15:19] | NM_001037764 | Rai1 | 0.1 | chr11:+60003351 | ||
| 4MMs [3:10:13:14] | NM_053193 | Cpsf1 | 0.1 | chr15:−76426196 | ||
| Esr1-g2 | 73 | 4MMs [4:8:11:12] | NM_001024560 | Snx32 | 0.4 | chr19:+5495979 |
| 4MMs [2:4:5:16] | NM_001194923 | Cldn18 | 0.3 | chr9:+99617489 |
-
*Values range from 1 to 100 index to assess the specificity of a guide, with 100 being the most specific guide.
&4MMs [2:9:11:12] indicates nucleotides 2, 9, 11, 12 of the sgRNA do not match the ‘off target’ gene locus.
-
#Off-target score values range from 0 to 100, with 100 being the value for the target Esr1 gene.
Table 4
Primer probes used for single-cell qPCR.
https://doi.org/10.7554/eLife.43999.013| IDT prime time qPCR probe assay | Transcript | Forward 5'−3' | Reverse 5'−3' | Probe 5'−3' | Amplicon (bp) | Accession no. | Location |
|---|---|---|---|---|---|---|---|
| Mm.PT.58.42702897 | Cacna1g | CTCAACTGTATCACCATCGCTA | AAGACTGCCGTGAAGATGT | CGCCCCAAAATTGACCCCCAC | 101 | NM_009783 | 4446–4546 |
| Mm.PT.58.15908160 | Cacna1h | GACACTGTGGTTCAAGCTCT | TTATCCTCGC TGCATTCTAGC | ACCTTGGTCTTCTTTTCATGCTCCTGT | 122 | NM_021415 | 5565–5686 |
| Mm.PT.58.9567566 | Cacna1i | CATCACCTTCATCATCTGCCT | CCTCCAGCACAAAGACAGT | ACCAGCCTACATCCCTAGAGACAGC | 125 | NM_001044308 | 4914–5038 |
| Mm.PT.58.41764708 | Esr1 | GCTCCTTCTCATTCTTTCCCA | TCCAGGAGCAGGTCATAGAG | CCATGCCTTTGTTACTCATGTGCCG | 108 | NM_007956 | 1768–1865 |
| Mm.PT.58.16981577 | Esr2 | CCTCCTGATGCTTCTTTCTCAT | TCGAAGCGTGTGAGCATTC | TCCATGCCCTTGTTACTGATGTGCC | 133 | NM_207707 | 1829–1961 |
| Mm.PT.58.30501833 | Hcn1 | GCGTTATCACCAAGTCCAGTA | CAGTAGGTATCAGCTCGGACA | CTCCGAAGTAAGAGCCATCTGTCAGC | 115 | NM_010408 | 1913–2027 |
| Mm.PT.58.7963736 | Hcn2 | CTTCACCAAGATCCTCAGTCTG | GGTCGTAGGTCATGTGGAAA | TGCGGCTATCACGGCTCATCC | 98 | NM_008226 | 935–1032 |
| Mm.PT.58.7999585 | Hcn3 | GCCTCACTGATGGATCCTACT | TCAAGCACCGCATTGAAGT | ACCTATTGTCGCCTCTACTCGCTCA | 130 | NM_008227 | 1546–1675 |
| Mm.PT.58.43863085 | Hcn4 | GCTGATGGCTCCTATTTTGGA | TCATTGAAGTTGTCCACGCT | AAGTATCCGCTCTGACGCTGGC | 116 | NM_001081192 | 2614–2729 |
| Mm.PT.45.16269514 | Kiss1 | CTGCTTCTCCTCTGTGTCG | TTCCCAGGCATTAACGAGTTC. | CGGACTGCTGGCCTGTGGAT | 105 | NM_178260 | 66–170 |
| Mm.PT.47.10254276 | Pgr | CGCCATACCTTAACTACCTGAG | CCATAGTGACAGCCAGATGC | AGATTCAGAAGCCAGCCAGAGCC | 124 | NM_008829 | 2230–2353 |
| Mm.PT.51.17048009.g | Syn1 | CTTGAGCAGATT GCCATGTC | ACCTCAATAATGTGATCCCTTCC | ACGTGTCTACCCACAACTTGTACCTG | 131 | NM_013680 | 1159–1289 |
| Mm.PT.58.33106186 | Th | CCCTACCAAGATCAAACCTACC | CTGGATACGAGAGGCATAGTTC | TGAAGCTCTCTGACACGAAGTACACCG | 96 | NM_009377 | 1298–1393 |
Key resources table
| Reagent type (species) or resource | Designation | Source or reference | Identifiers | Additional information |
|---|---|---|---|---|
| Mus musculus, C57BL/6J | Kiss1-ires-Cre | PMID 26862996 | Dr. Martin Myers, University of Michigan | |
| Mus musculus, C57BL/6J | Esr1 loxp | PMID 17785410 | Dr. Martin Myers, University of Michigan | |
| Mus musculus, C57BL/6J | Kiss1-cre | Dr. Carol Elias/Jackson Labs | JAX 023426 | |
| Mus musculus, C57BL/6J | Cas9-stop loxp | Jackson Labs | Jax 024858; RRID:IMSR_JAX:024858 | |
| Mus musculus, C57BL/6J | Rosa26-EYFP | Jackson Labs | Jax 006148; RRID:IMSR_JAX:006148 | |
| Mus musculus myoblast, C3H | C2C12 myoblast | ATTC | Cat # CRL 1772 | Dr. Daniel Michele, University of Michigan |
| Antibody | rabbit anti-ERα | Millipore | #06-935 | dil. 1:10000 |
| Antibody | rat anti-mCherry | Invitrogen | M11217 | dil. 1:5000 |
| Antibody | chicken anti-GFP | Abcam | ab13970 | dil. 1:2000 |
| Recombinant DNA reagent | AAV8-hsyn-dio-sg RNA_lacZ-mCherry | this paper | Custom Order | UNC-viral core |
| Recombinant DNA reagent | AAV8-hsyn-dio-sg RNAEsr1_g1-mCherry | this paper | Custom Order | UNC-viral core |
| Recombinant DNA reagent | AAV8-hsyn-dio-sg RNAEsr1_g2-mCherry | this paper | Custom Order | UNC-viral core |
| Recombinant DNA reagent | plasmid LentiV2-sgRNA-Esr1_g1 | this paper | built on lentiCRISPRv2; Addgene Cat #52961 | |
| Recombinant DNA reagent | plasmid LentiV2-sgRNA-Esr1_g2 | this paper | built on lentiCRISPRv2; Addgene Cat #52961 | |
| Recombinant DNA reagent | plasmid LentiV2-sgRNA-lacZ | this paper | built on lentiCRISPRv2; Addgene Cat #52961 | |
| Commercial assay or kit | ABC amplification | Vector Laboratories | Cat # PK-6100 | |
| Chemical compound, drug | CNQX | Sigma-Aldrich | Cat # 1045 | |
| Chemical compound, drug | APV | Tocris | Cat # 0106 | |
| Chemical compound, drug | picrotoxin | Sigma-Aldrich | Cat # P1675 | |
| Chemical compound, drug | TTX | Tocris | Cat # 1069 | |
| Chemical compound, drug | 10% Neutral Buffered Formalin | Fisher Scientific | Cat # 22899402 | |
| Chemical compound, drug | Hydrogen Peroxide | Sigma | Cat # 216763 | |
| Chemical compound, drug | LHRH | Bachem | Cat # H4005 | |
| Chemical compound, drug | kisspeptin | Phoenix | Cat # 048-56 | |
| Chemical compound, drug | Neurobiotin | Vector Labs | Cat # SP-1120 | |
| Software, algorithm | Igor Pro | Wavemetrics | https://github.com/defazio2/LWeLifeRepo |
Table 5
Number of cells (n) and number of mice (N) in each experiment.
For AAV-injected mice, only animals with bilateral hits are included.
| Figure 1a, b | Control | KERKO | ||
|---|---|---|---|---|
| Intact n = 12, N = 7 | Intact n = 11, N = 6 | |||
| OVX n = 10, N = 5 | OVX n = 11, N = 4 | |||
| OVX + E n = 10, N = 6 | OVX + E n = 9, N = 5 | |||
| Figure 1c–f, Figure 1—figure supplement 1a left, 1b left | Control | KERKO | ||
| Intact n = 11, N = 4 | Intact n = 11, N = 5 | |||
| OVX n = 11, N = 5 | OVX n = 9, N = 4 | |||
| OVX + E n = 11, N = 7 | OVX + E n = 12, N = 5 | |||
| Figure 2 | Control | KERKO | ||
| n = 8, N = 4 | n = 7, N = 4 | |||
| Figure 3d,e | AVPV-AAV-lacZ | AVPV-AAV-Esr1g1 | AVPV-AAV-Esr1g2 | |
| N = 3 | N = 3 | N = 4 | ||
| Figure 3f | AVPV-AAV- lacZ | AVPV-AAV-Esr1 | ||
| N = 6 | N = 8 (g1 N = 4, g2 N = 4) | |||
| Figure 3g | AVPV-AAV- lacZ | AVPV-AAV-Esr1 | ||
| N = 6 | N = 9 (g1 N = 5, g2 N = 4) | |||
| Figure 4d–j and Figure 1—figure supplement 1a middle, 1b middle | IF post hoc | PCR post hoc | ||
| Esr1 n = 15, N = 5 | Esr1 n = 10, N = 4 | |||
| lacZ n = 14, N = 4 | lacZ n = 9, N = 3 | |||
| uninfected n = 8, N = 4 | uninfected n = 4, N = 2 | |||
| Figure 5a–d | Arc-AAV-lacZ | Arc-AAV-Esr1g1 | Arc-AAV-Esr1g2 | |
| N = 6 | N = 4 | N = 4 | ||
| Figure 5e–g | Arc-AAV-lacZ | Arc-AAV-Esr1 | ||
| N = 6 | N = 8 (g1 N = 4, g2 N = 4) | |||
| Figure 6a–c | Arc-AAV-lacZ | Arc-AAV-Esr1 | ||
| n = 11, N = 5 | n = 13, N = 5 | |||
| Figure 6d–f | Arc-AAV-lacZ | Arc-AAV- Esr1 | ||
| n = 10, N = 5 | n = 12, N = 5 | |||
| Figure 1—figure supplement 1a left, 1b right | KERKO | AVPV-AAV-Esr1 | ||
| n = 12, N = 5 | n = 25, N = 9 | |||
| Figure 1—figure supplement 1c left | Control | KERKO | ||
| Intact N = 6 | Intact n = 11, N = 7 | |||
| OVX N = 6 | OVX n = 11, N = 6 | |||
| OVX + E N = 5 | OVX + E n = 9, N = 7 | |||
| Figure 1—figure supplement 1c middle | AVPV-AAV-lacZ | AVPV-AAV-Esr1 | ||
| N = 7 | N = 9 | |||
| Figure 1—figure supplement 1c middle | Arc-AAV-lacZ | Arc-AAV-Esr1 | ||
| N = 5 | N = 5 | |||
| Figure 4—figure supplement 1 | AVPV-AAV-lacZ | AVPV-AAV-Esr1 | ||
| n = 16, N = 5 | n = 23, N = 5 (g1 N = 3, g2 N = 2) | |||
Additional files
-
Transparent reporting form
- https://doi.org/10.7554/eLife.43999.019
Download links
A two-part list of links to download the article, or parts of the article, in various formats.
Downloads (link to download the article as PDF)
Open citations (links to open the citations from this article in various online reference manager services)
Cite this article (links to download the citations from this article in formats compatible with various reference manager tools)
Genetic dissection of the different roles of hypothalamic kisspeptin neurons in regulating female reproduction
eLife 8:e43999.
https://doi.org/10.7554/eLife.43999


