ParB dynamics and the critical role of the CTD in DNA condensation unveiled by combined force-fluorescence measurements
- Centro Nacional de Biotecnología, Consejo Superior de Investigaciones Científicas, Spain
- University of Bristol, United Kingdom
Abstract
Bacillus subtilis ParB forms multimeric networks involving non-specific DNA binding leading to DNA condensation. Previously, we found that an excess of the free C-terminal domain (CTD) of ParB impeded DNA condensation or promoted decondensation of pre-assembled networks (Fisher et al., 2017). However, interpretation of the molecular basis for this phenomenon was complicated by our inability to uncouple protein binding from DNA condensation. Here, we have combined lateral magnetic tweezers with TIRF microscopy to simultaneously control the restrictive force against condensation and to visualise ParB protein binding by fluorescence. At non-permissive forces for condensation, ParB binds non-specifically and highly dynamically to DNA. Our new approach concluded that the free CTD blocks the formation of ParB networks by heterodimerisation with full length DNA-bound ParB. This strongly supports a model in which the CTD acts as a key bridging interface between distal DNA binding loci within ParB networks.
https://doi.org/10.7554/eLife.43812.001Introduction
Faithful segregation of bacterial chromosomes is mediated by partition systems that are classified depending on the type of NTPase involved (Gerdes et al., 2010). Type I partition systems, also known as ParABS include an ATPase motor protein, ParA, responsible for the movement of the replicated chromosomes to the distal pole of the cell, a DNA binding protein ParB, and a centromere-like DNA sequence, parS (Funnell, 2016). This type of partition system has been described in many bacteria, including Bacillus subtilis, where it is involved in chromosome segregation and sporulation (Mierzejewska and Jagura-Burdzy, 2012) (Yamaichi and Niki, 2000) (Sharpe and Errington, 1996) (Lin and Grossman, 1998) (Lee and Grossman, 2006). Importantly, the discovery that B. subtilis Structural Maintenance of Chromosome (SMC) proteins are loaded by ParB at parS sites in vivo and that parS sites act as condensation centers highlights the critical role played by ParB in chromosome organisation (Gruber and Errington, 2009) (Sullivan et al., 2009) (Umbarger et al., 2011) (Broedersz et al., 2014) (Taylor et al., 2015). Interestingly, apart from the specific binding to partition sites, ParB proteins can also bind non-specifically to DNAs spreading several kilobases around parS sites (Breier and Grossman, 2007) (Murray et al., 2006). This spreading is achieved by a limited number of ParB protomers, which has been rationalised by models of ParB-mediated bridging and condensation of DNA supported by in vitro analysis (Graham et al., 2014) (Taylor et al., 2015) (Fisher et al., 2017) (Broedersz et al., 2014) (Sanchez et al., 2015). The generation of these ‘ParB networks’ in vivo necessarily requires the presence of specific and non-specific DNA-binding domains in ParB as well as multimerisation interfaces between ParB proteins. Recent work has begun to unpick the structural basis for formation of these networks and has implicated both the N- and C-terminal domains in forming and maintaining bridging interactions (Leonard et al., 2004) (Fisher et al., 2017) (Song et al., 2017) (Chen et al., 2015).
In our previous work (Fisher et al., 2017), we studied the role of the C-terminal domain (CTD) of ParB in its multimerisation and DNA condensation. In particular, we confirmed its dimeric stoichiometry and identified a novel intermolecular non-specific DNA-binding site across the positively-charged β-sheet face of the CTD of ParB, which was critical for DNA condensation. We also showed that the presence of an excess of the CTD prevented DNA condensation by ParB and induced disruption of ParB networks in vitro and in vivo. This led us to propose three possible scenarios to explain CTD-mediated condensation inhibition (Figure 1). One possibility is that the CTD simply competes for the binding sites in the DNA molecule (Figure 1B, DNA-binding competition model). In this way, the CTD would displace ParB from the DNA and thus prevent DNA condensation, provided the CTD cannot condense DNA on its own. Another possible scenario is that the CTD is able to heterodimerise with free ParB in solution and these heterodimers are deficient for DNA binding, which directly impedes condensation (Figure 1C, DNA-binding inhibition model). Finally, it is possible that the CTD interacts with DNA-bound ParB, forming heterodimers that cannot condense but which may remain bound to DNA (Figure 1D, CTD capping model). This deficiency in condensation could be caused by the CTD ‘capping’ the ParB dimerisation interfaces.
Figure 1
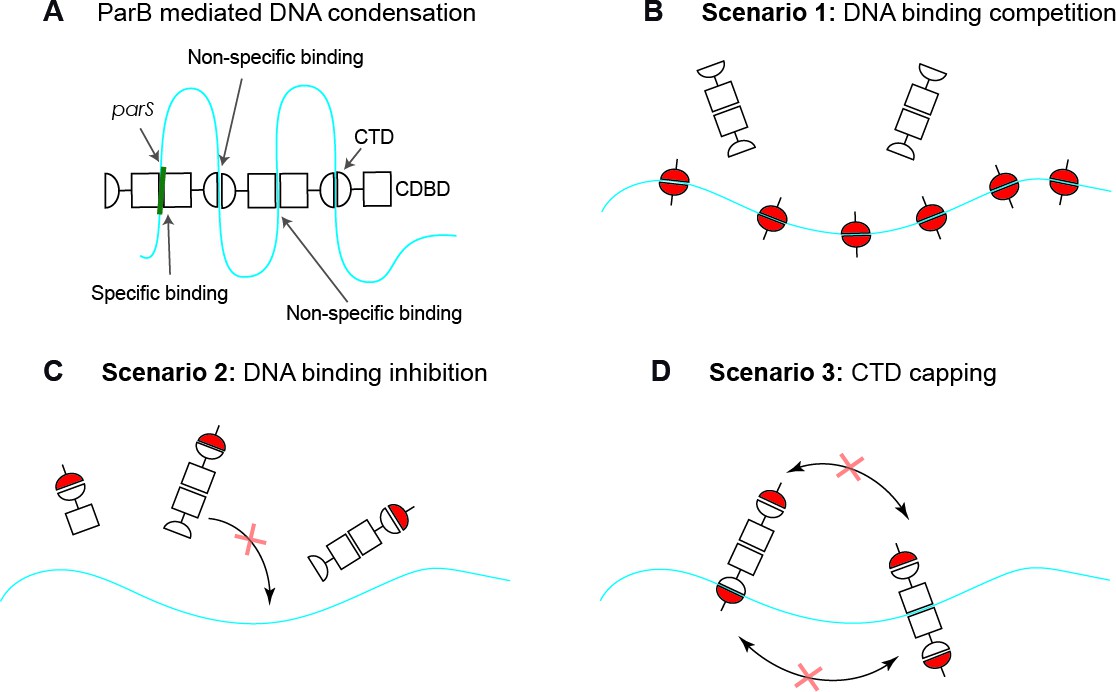
Possible scenarios for CTD-induced decondensation of ParB-DNA networks.
(A) Model for ParB network formation and condensation via ParB-DNA and ParB-ParB interactions. ParB monomers comprise a central DNA-binding domain (CDBD) with specific and possibly non-specific DNA-binding activities and a carboxy-terminal domain (CTD) with non-specific DNA-binding capacity. The amino terminal domain (NTD) is not represented on the scheme for clarity. (B) In scenario 1, the CTD can bind dsDNA competing for the DNA-binding sites, displacing full length ParB and therefore de-condensing the DNA. (C) In scenario 2, the CTD can exchange with full length ParB forming heterodimers in free solution that are inactive so can no longer exchange with the ParB-DNA network. (D) In scenario 3, the CTD forms heterooligomers with DNA-bound ParB which retain DNA-binding activity but are not able to condense DNA because bridging interactions are ‘capped’ by the CTD. Possible scenarios for CTD-induced decondensation of ParB-DNA networks.
Our previous experiments with CTD variants defective for DNA binding suggested that ParB-network disruption was unlikely to be mediated by direct competition for DNA binding sites (Fisher et al., 2017). However, because the ParB binding and DNA condensation signals were tightly coupled (Taylor et al., 2015) (Fisher et al., 2017), it was not possible to separate ParB binding from condensation or to correlate both measurements in parallel. This precluded a direct test of our favoured capping model, which predicts (uniquely) that the free CTD will inhibit DNA condensation but not DNA binding. For instance, in ensemble experiments using electrophoretic mobility shift assays and ParB-protein-induced fluorescence enhancement assays, the signal reported is concomitant to protein binding and condensation (Taylor et al., 2015). The same happens in single-molecule stretch-flow fluorescence experiments (Graham et al., 2014) requiring the use of condensation-deficient mutants to determine the kinetic parameters of DNA binding (Song and Loparo, 2015). Additionally, in stretch-flow experiments, condensation is restricted to the free end of the molecule due to a decreasing force gradient along the DNA. Magnetic Tweezers (MT) experiments overcome some of these difficulties in that the applied force is uniform and can be used to prevent DNA condensation. It is therefore possible to measure DNA condensation when the force is decreased to permissive levels (Taylor et al., 2015). Nonetheless, in MT it is not possible to visualise and determine the degree of protein binding to DNA molecules. Here, we have combined lateral MT with total internal reflection fluorescence (TIRF) microscopy (Madariaga-Marcos et al., 2018) to simultaneously control the force applied to DNA and to visualise ParB proteins by fluorescence. This allowed us to directly challenge the three possible scenarios to explain the condensation inhibition mechanism of the CTD of ParB. In addition, the combination of our MT-TIRF device with multilaminar flow technology facilitated the rapid exposure of DNA to different protein concentrations and provided a method to precisely capture the kinetics of binding and unbinding events. The experimental platform used here allowed us to confirm that the inhibition of ParB condensation by the free CTD occurs without displacement of full length ParB from DNA. Our data indicates that the free CTD of ParB blocks the formation of ParB networks via a dominant negative effect on a key protein-protein bridging interface.
Results and discussion
A new method for monitoring ParB DNA binding under conditions that are non-permissive for DNA condensation
We laterally stretched single ~24 kbps DNA molecules lacking the parS sequence (see Materials and methods) (Figure 2A) using a home-built magnet holder that can pull DNA molecules from one side (Madariaga-Marcos et al., 2018). This device can apply forces of ~1 pN on 1 μm beads, which is sufficient to prevent condensation of DNA upon introduction of ParB. We produced a fluorescent variant of ParB labelled with Alexa Fluor 488 (ParB2S68C-AlexaFluor488, hereafter ParB2AF), which retained wild-type DNA-binding properties in our established bulk assays (Figure 2—figure supplement 1). This allowed us to visualise protein binding while stretching the DNA at forces non-permissive for condensation (Figure 2B). Injection of the protein in the flow cell resulted in a gradual increase of fluorescence concomitant to the arrival and non-specific binding of the protein to the DNA (Video 1). Note, however, that sometimes a fraction of the DNA closer to the magnetic bead remained invisible in the fluorescence signal (Video 2). This is as expected and is due to the limited penetration of the excitation light produced by TIRF, the tilting angle of the DNA (≤5⁰), the attachment point of the DNA at the bead, and the fixed bead orientation under the magnetic field.
Figure 2 with 2 supplements see all

Combined lateral MT and TIRF microscopy to study ParB-DNA interactions.
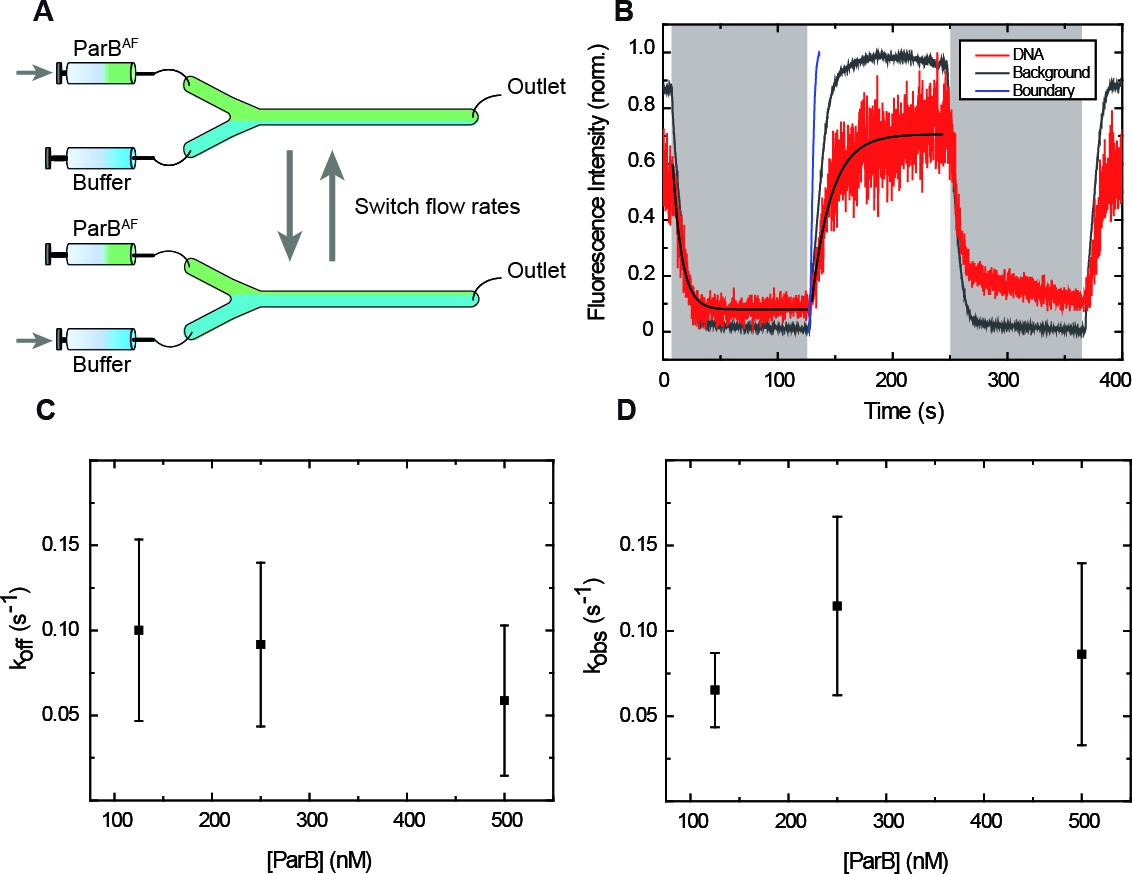
(A) Cartoon of the MT-TIRF setup used to visualise ParB-DNA interactions at the single-molecule level with controlled external force. A magnet pulls laterally on the distal end of a DNA molecule which is anchored to the coverslip. Fluorescently labelled ParBAF is excited in TIRF mode using 488 nm laser light and the emitted light is collected by an EM-CCD (Madariaga-Marcos et al., 2018). (B) TIRF image showing a laterally stretched DNA molecule under a force of 1 pN and in the presence of 500 nM ParBAF. Beads showed fluorescence due to additional binding of DNA molecules, which are further labelled by non-specifically bound ParBAF proteins. (C) Intensity of several DNA molecules (n = 15) in the presence of 500 nM ParBAF as a function of time. Even though the integrated intensity changes from molecule to molecule, intensity remains constant for more than 100 s, suggesting a dynamic and fast exchange between DNA-bound ParBAF and free ParBAF in the media. (D) Kymograph from the same experimental data shown in (B) highlighting changes in intensity along the DNA molecule through the entire experiment supporting the continuous exchange of the protein. Kymographs varied from molecule to molecule. All experiments were conducted in ParB reaction buffer supplemented with 4 mM Mg2+.
-
Figure 2—source data 1
Fluorescence intensity of 15 DNA molecules in the presence of 500 nM ParBAF as a function of time.
- https://doi.org/10.7554/eLife.43812.006
Video 1
Movie showing that ParBAF binding increases the intensity along a DNA molecule.
Flow rate of 250 µl/min. Movie is 5X accelerated.
Video 2
Movie showing that intensity remains constant when imaging a ParBAF coated DNA molecule (250 nM).
Movie is 5X accelerated.
The integrated intensity in the area of a DNA molecule remained constant for the longest time points tested (2 min) in the absence of an oxygen scavenger system, suggesting a continuous and fast exchange of ParB proteins with the surrounding media (Figure 2C). The integrated intensity differs between molecules due to the fraction of DNA imaged, which depends on the anchoring point of the DNA on the bead. This was further confirmed in kymographs taken along the DNA that showed variations in fluorescence intensity with time (Figure 2D, Video 1). As expected, we did observe a gradual decrease of fluorescence intensity when the protein was removed from free solution by flowing buffer alone (Video 3 and Figure 2—figure supplement 2A). Control experiments crosslinking ParB with formaldehyde indicated a photobleaching half-life time for Alexa Fluor of around 28 s, much shorter than the duration of our measurements (Figure 2—figure supplement 2B). The rapid exchange of the protein was further confirmed in fluorescence recovery after photobleaching (FRAP) experiments. They consisted of photo-bleaching all ParBAF molecules included in the visualisation area inside the TIRF field by using a high-laser power pulse, and then monitoring the fluorescence recovery of the protein-DNA complex in the presence of 250 nM ParBAF (Video 4 and Figure 2—figure supplement 2C). Altogether, these experiments demonstrate the dynamic interaction of ParB with DNA under forces that are non-permissive for condensation.
Video 3
Movie showing that the intensity of DNA coated with 250 nM ParBAF decays flowing buffer (250 µl/min).
Movie is 5X accelerated.
Video 4
Movie showing that the intensity of DNA coated with 250 nM ParBAF is recovered in FRAP experiment.
Movie is 5X accelerated.
Association and dissociation kinetics of ParB measured at non-permissive forces for condensation
Prompted by the observation of fast ParBAF exchange, we attempted to elucidate the kinetics of the non-specific binding and unbinding of ParBAF. The simplest approach would be to repeatedly exchange protein-containing and protein-free buffer and to monitor changes in the fluorescence signal over time. However, the arrival of the protein at the site of interest in single-channel flow cells is gradual, typically requires tens of seconds to reach equilibrium, and it is difficult to assign arrival times (Gollnick et al., 2015; Liu et al., 2013). Although this effect can be minimised by using high flow velocities, it nevertheless would affect the measured kinetics of protein association. Moreover, flowing at high rates increases the force applied on the DNA as a result of the drag force on the bead and can lead to structural distortions of the DNA duplex, ultimately interfering with protein binding (Xiao et al., 2011).
In order to reduce reagent exchange times and the contribution of the flow on the total force on the DNA, we developed a fast buffer exchange system based on multilaminar flow cells (Liu et al., 2013) (Tan et al., 2007) (Brouwer et al., 2018). We used flow cells with two inlets, where two reagents are introduced (i.e. protein and buffer), and a single outlet (Figure 3A). The dimensions of our flow cells and the flow rates we used (≤500 µl/min) ensure a laminar flow regime under which the two reagents do not significantly mix (Materials and methods) (Brewer and Bianco, 2008). Fast alternation between buffer and protein was achieved by varying the flow rates of the syringes (190 µl/min and 10 µl/min) and maintaining a constant flow rate in the central channel (200 µl/min). This reduced reagent switching times, and allowed us to assign reagents arrival times while keeping a low total force (~3.5 pN) on the DNA (Materials and methods) which is non-permissive for condensation by ParB. Furthermore, protein concentrations could be accurately controlled as the DNA was exposed within a few seconds (see below) to the condition of interest, allowing one to measure association and dissociation constants.
Figure 3 with 2 supplements see all
ParB binding and unbinding kinetics.
(A) Scheme of the multilaminar flow system employed to fast-exchange of buffers. The fluid cell contains two inlets and a single outlet. Switching the velocities of both channels shifts the boundary of laminar flows resulting in the fast exchange of buffers. (B) Normalised integrated fluorescence intensity for a representative DNA molecule in a laminar-flow experiment with 250 nM ParBAF as a function of time (red) and for an equivalent background area (gray). Buffer injection (shadowed area) is correlated with decreasing intensity. Best fit curves to obtain (Equation 3) and (Equation 2) are shown. Boundary exchange with fluorescein is also shown for comparative purposes (Figure 3—figure supplement 1D). (C) Unbinding rate measured at different initial ParB concentrations, obtained from fitting individual curves as shown in B, and then averaged at different concentrations. The values obtained are in the order of values published before (Song et al., 2016). (D) Observed binding rate measured at different ParB concentrations, calculated as . Errors are SD. (n ~ 15-30 molecules). All experiments were conducted in ParB reaction buffer supplemented with 4 mM Mg2+.
-
Figure 3—source data 1
Normalised integrated fluorescence intensity for a representative DNA molecule in a laminar-flow experiment with 250 nM ParBAF as a function of time.
- https://doi.org/10.7554/eLife.43812.014
To characterise the switching between the two reagents, we first took advantage of magnetic tweezers to track a bead as it was driven by the flow alternation. We measured beads in both vertical (Figure 3—figure supplement 1A) and lateral (Figure 3—figure supplement 1B) configurations and demonstrated that changes in flow velocities correlate with the movement of the bead in the transverse direction. Importantly, the direction of the pulling force (x axis) was not disturbed when flow rates were switched (Figure 3—figure supplement 1B). Then, to directly monitor the boundary shifting, we measured fluorescence intensity changes in the background using a buffer containing 5 mM fluorescein at different flow rates (Figure 3—figure supplement 1C and D). Our results concluded that the boundary achieves a complete shifting in ~6.5 s.
We measured cycles of protein binding and unbinding by switching between channels containing ParBAF and buffer (Figure 3B, Video 5). The fluorescence intensity decreased when buffer was flowed (shadowed area) and it was recovered by the introduction of ParBAF. Note that despite the limitation of fluid exchange kinetics, the binding curve of ParBAF on the DNA was readily different from that of the background. We performed experiments at different protein concentrations to elucidate the kinetics of ParB (Figure 3—figure supplement 2). The binding of ParB to DNA can be formulated as (Goodrich and Kugel, 2007):
(1)
with and being the binding and unbinding rate constants, respectively. This is a simple model which cannot account for cooperativity in binding nor potential nucleation intermediates, and hence it may not capture the detailed (un)binding kinetics of ParB. However, it is still useful for semi-quantitative analysis of binding rates as well as for direct comparison of the values at different conditions. Moreover, the dynamics of the system can be easily solved assuming that the concentration of ParB remains constant in time (). This is a reasonable assumption, since in our single-molecule experiments we expect an excess of protein compared with DNA binding sites, and our measurement is much longer than the boundary shifting time. Then, the final expression for protein binding reads:
(2)
where states for the fluorescence signal and the observed binding rate is defined as by . Similarly, the unbinding kinetics can be obtained by considering [ParB] = 0, and giving:
(3)
where is the initial fluorescence intensity (Goodrich and Kugel, 2007).
Video 5
Movie showing the laminar flow switching assay.
250 nM ParBAF binding increases intensity along a DNA molecule and unbinding decreases it (total flow rate 200 µl/min). Movie is 5X accelerated.
The measured binding constant (~0.1 s−1) was independent of the protein concentration and slightly lower than the previously reported value for the condensation-deficient ParB mutant ParBR82A, ~0.16 s−1 (Song et al., 2016). This might reflect localised condensation events in the wild type protein (Figure 3C). This is particularly relevant at the high concentrations used (≥500 nM), where ParB-ParB interactions are favored likely resulting in local condensates, which prevent unbinding of the protein. Regarding we observed a saturation effect at high concentrations (Figure 3D). This cannot be explained by limitations in the temporal resolution of our assay (acquisition rate ~10 s−1) and we therefore favour the idea that it is limited by our fluid exchange kinetics. Nevertheless, the saturation observed can also be explained by rate limiting events after the formation of a collision complex (which are not considered in our simple model). We therefore considered values obtained at low protein concentration to estimate (see Materials and methods). Our estimation (~4 x 10⁵ M−1 s−1) was one order of magnitude below a published value for a mutant ParB, ~2.1 x 10⁶ M−1 s−1 (Song et al., 2016) This discrepancy may reflect a different binding mechanism of the wild-type ParB protein employed here compared to the condensation-defective mutant, and/or simply the limitations of our laminar-flow-based technology.
The C-terminal domain of ParB does not compete for DNA binding with full length ParB in Mg2+ conditions
Motivated by previous work reporting a non-specific DNA binding of the free CTD of ParB and its important role in DNA condensation (Fisher et al., 2017), we investigated the effect of an excess of CTD in the ParBAF binding/unbinding reaction. Our previous work indicated distinct DNA-binding mechanisms for ParB in the presence of Mg2+ or EDTA (Taylor et al., 2015). In particular, the specific binding of the protein was only observed in Mg2+, while the non-specific binding was promoted by the presence of EDTA, especially at low ParB concentrations. In the work described below, we carried out assays in both Mg2+ and EDTA conditions and measured and for full length ParB, and for ParB in the presence of free CTD.
For full length ParB, protein:DNA complexes were observed under both conditions (Figure 2B and Figure 4—figure supplement 1A), but we measured a lower in EDTA conditions compared to Mg2+ conditions (Figure 4A, Figure 4—figure supplement 2, Table 1). The observed binding rate () did not show statistically significant differences between EDTA and Mg2+ (Figure 4A, Table 2). To result in similar observed binding rates and considering the definition of , we infer that the association rate constant is higher in the presence of EDTA than in Mg2+. In summary, and in agreement with our published observations (Fisher et al., 2017), we conclude that the presence of EDTA strengthens interactions between ParB and non-specific DNA.
Figure 4 with 2 supplements see all
ParB binding kinetics in the presence and absence of Mg2+and the effect of the free CTD.
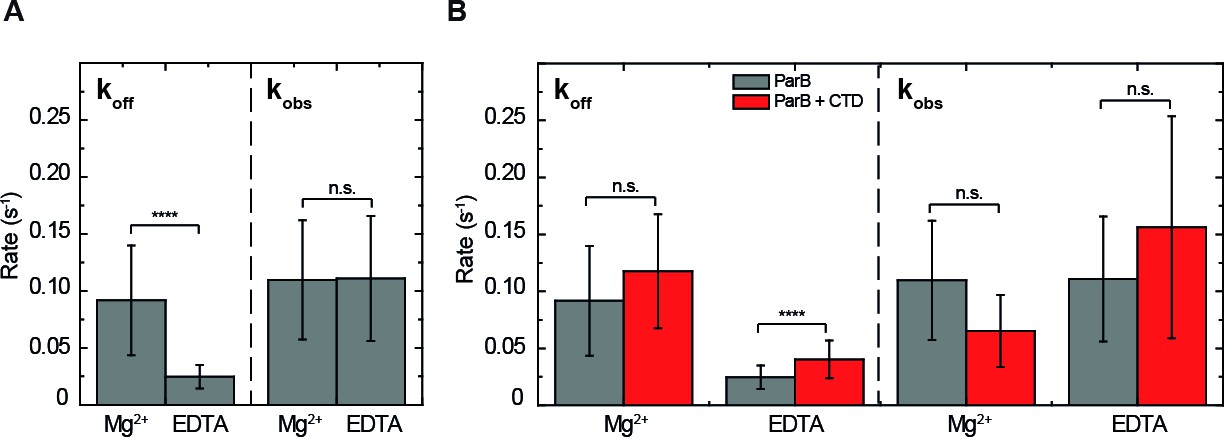
(A) Unbinding rate and observed binding rate values for 250 nM ParBAF. We observed a reduction in (slower unbinding) in the case of EDTA but no significant difference was observed in values. (B) Unbinding rate and observed binding rate values for 250 nM ParBAF in the presence (red) and absence (gray) of 2.5 µM CTD, in Mg2+– or EDTA–containing buffer. We report faster unbinding in the presence of the CTD in EDTA. No effect of the CTD in the unbinding rate was observed in Mg2+ buffer, according to Student’s t-test. No significant difference was observed in values in the presence or absence of the CTD in both Mg2+ and EDTA conditions. All errors are SD. (n ~ 12-28 molecules). Data were accounted for statistical differences following a Student's t-test (see Table 1 for p-values and Table 2 for p-values).
Table 1
Student’s t-test p-values for values.
https://doi.org/10.7554/eLife.43812.019| WT - Mg2+ | WT + CTD Mg2+ | WT - EDTA | WT + CTD - EDTA | |
|---|---|---|---|---|
| WT – Mg2+ | 1 | 0.1235 | 5E-4 | 0.0019 |
| WT + CTD Mg2+ | 1 | 0 | 0 | |
| WT - EDTA | 1 | 6E-5 | ||
| WT + CTD - EDTA | 1 |
Table 2
Student’s t-test p-values for values.
https://doi.org/10.7554/eLife.43812.020| WT - Mg2+ | WT + CTD Mg2+ | WT - EDTA | WT + CTD - EDTA | |
|---|---|---|---|---|
| WT - Mg2+ | 1 | 0.079 | 0.9542 | 0.1139 |
| WT + CTD Mg2+ | 1 | 0.0243 | 0.0103 | |
| WT - EDTA | 1 | 0.1129 | ||
| WT + CTD - EDTA | 1 |
We next produced a fluorescently labeled CTD protein (CTDAF) and studied its binding to DNA in the presence of EDTA or Mg2+ (Figure 2—figure supplement 1). We observed protein:DNA complexes at high CTDAF concentrations (10 μM) in the presence of EDTA but no complexes were visible in the presence of a magnesium-containing buffer at the same concentration (Figure 4—figure supplement 1A). The fluorescence intensity of CTDAF complexes remained constant over time, suggesting continuous and rapid exchange between bound and free CTD proteins (Figure 4—figure supplement 1B and Video 6). Further experiments, where CTDAF complexes were photobleached, confirmed the rapid exchange of the protein in a similar manner to ParBAF (see Figure 4—figure supplement 1C and D for data and discussion). Altogether, these results show that the CTD of ParB can bind and unbind rapidly from DNA, but only under EDTA conditions. This implies that the free CTD will not inhibit the interactions of full length ParB with DNA by simple competition under Mg2+ conditions. We next tested this more directly.
Video 6
Movie showing that intensity remains constant when imaging 10 µM CTDAF, similar to ParBAF.
Movie is 5X accelerated.
In the presence of excess free CTD and under Mg2+ conditions, the and values for full length ParB were indeed unchanged when compared to full length ParB alone (Figure 4B). An excess of the CTD in EDTA-containing buffer facilitated ParBAF unbinding, yielded a higher (Figure 4B, Figure 4—figure supplement 2), and resulted in lower intensity CTDAF-DNA complexes. Therefore, as expected based on the properties of the free CTD alone, it can compete for DNA but only under EDTA conditions, which are not considered to have any particular biological relevance.
These results strongly suggest that scenarios 1 and 2 (Figure 1) can be discounted, because the CTD does not reduce DNA binding by full length ParB under Mg2+ conditions. However, these experiments were performed at restrictive forces to uncouple binding and condensation. At permissive forces, the Mg2+ conditions would support condensation. We next investigated the dominant negative effect of the free CTD under conditions that were permissive for condensation.
The free CTD prevents ParB-dependent condensation at permissive forces without affecting its binding to DNA
Previous experiments showed that an excess of the CTD of ParB prevents the condensation of DNA tethers and also promotes decondensation of preformed ParB-DNA networks (Fisher et al., 2017). However, as mentioned, we could not unequivocally distinguish between the possible mechanisms for condensation prevention, because binding and condensation could not be uncoupled. Here, using our MT-TIRF setup we could apply changes in force in a controlled way while at the same time visualising ParB binding and condensation.
We first monitored the condensation activity of ParBAF in a buffer supplemented with Mg2+. Condensation events were initiated by ParBAF by reducing the force from 1 to 0.2 pN and were directly visualised by fluorescence microscopy in laterally stretched DNA molecules (Figure 5A, Video 7). This process could be stopped by increasing the force (see Video 8) but could not be reversed, possibly due to a strong interaction of the protein with the surface and the smaller range of available forces applied by the lateral magnet in comparison to previous conventional MT experiments (Taylor et al., 2015). In general, the condensation process did not show any brighter features along the DNA that could be associated with the formation of large loops or the presence of nucleation regions (Figure 5A, Video 7). Nevertheless, we should keep in mind that our setup has a limited resolution of about 1 kbp as determined from measurements on single fluorophores (data not shown). Therefore, local condensation at scales lower than this could not be resolved.
Figure 5
Competition of the CTD in ParB binding and unbinding kinetics, and effects in condensation.
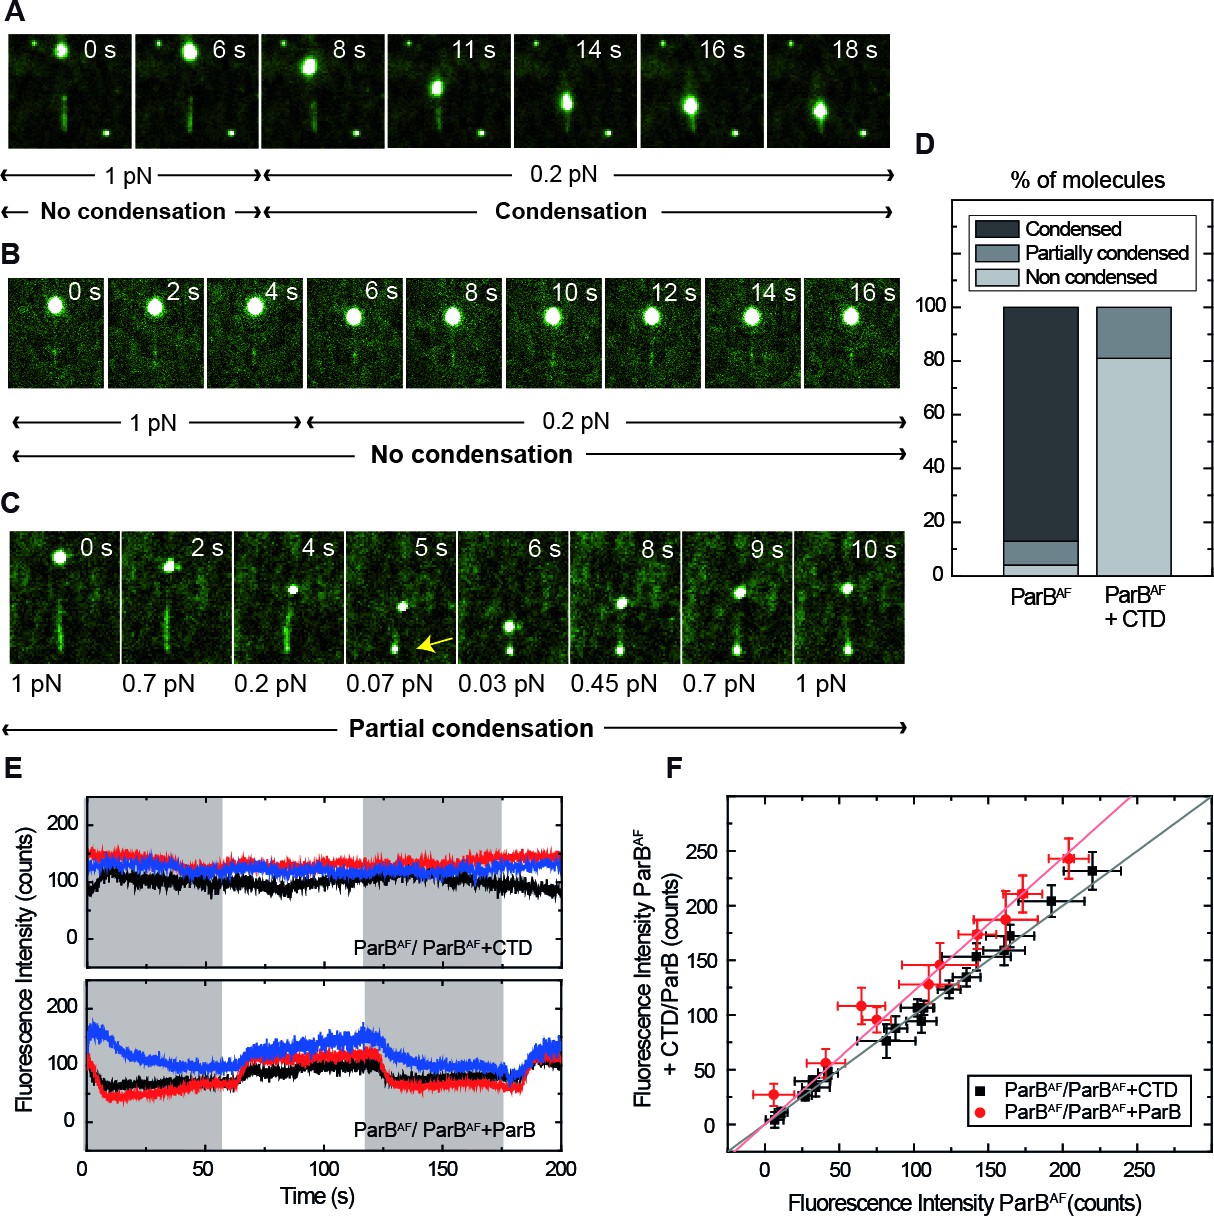
(A) Visualisation of condensation of a single DNA molecule induced by 250 nM ParBAF binding. The volume of the bead causes the DNA to be slightly tilted with respect to the surface such that emission of fluorescence is limited by the penetration depth of the excitation field. The DNA does not condense while held at non-permissive force of 1 pN. However, as in conventional magnetic tweezers experiments, at a permissive force of 0.2 pN a progressive reduction of the DNA length is observed. (B) Condensation experiment as in Figure 5A but in the presence of 2.5 μM non-fluorescent CTD showing that at a constant force of 0.2 pN, ParB is not able to condense to the inhibition of the CTD. Co-incubation with the CTD does not inhibit ParB binding to DNA, as indicated by clearly visible fluorescence filaments. (C) Condensation experiment as in Figure 5B. The CTD inhibits ParB-dependent DNA condensation, even at forces as low as 0.07 pN. Note that some residual condensation was observed at very low forces, visible at the anchoring point (arrow) as shown by the bright dot. (D) Percentage of DNA molecules that were condensed (more than 90% extension reduction), partially condensed or not condensed by ParBAF (less than 10% extension reduction), in the presence (n = 47) or absence of an excess of the CTD (n = 36). (E) Integrated fluorescence intensity in a laminar flow experiment. Intensity remains constant throughout the cycles of ParBAF and ParBAF + CTD (shadowed area), indicating that the excess of CTD is not competing for the binding sites on the DNA, but rather ‘capping’ the DNA-bound ParBAF. Intensity changes when alternating ParBAF with a combination of ParBAF and unlabelled ParB (shadowed areas). (F) Integrated intensity of ParBAF plotted versus the integrated intensity of ParBAF + CTD or ParBAF + ParB. ParBAF + CTD shows a slope of 1.00 ± 0.02 corresponding to unchanged intensity, while ParBAF + ParB shows a slope of 1.23 ± 0.02. (n ~ 10–16 molecules). All experiments were conducted in ParB reaction buffer supplemented with 4 mM Mg2+.
-
Figure 5—source data 1
Integrated fluorescence intensity for 3 molecules throughout the cycles of ParBAF and ParBAF +CTD (constant intensity) or ParBAF and ParBAF +unlabelled ParB (intensity changes).
- https://doi.org/10.7554/eLife.43812.023
Video 7
Movie showing that 250 nM ParBAF is able to condense DNA under permissive forces.
Movie is 5X accelerated.
Video 8
Movie showing that 250 nM ParBAF does not decondense upon force increase, contrary to ParB in previously published magnetic tweezers assays.
Movie is 5X accelerated.
In vivo studies have shown that a very small number of ParB molecules are actually responsible for chromosome segregation in the bacterial cell (Graham et al., 2014). Inside the cell, the entire chromosome and all ParB dimers are of course compartmentalised leading to a situation in which [ParB] and [DNA-binding sites] are both well above the Kd values we observe for DNA binding, but are present in a stoichiometry such that there are many more DNA-binding sites than there are ParB dimers. Thus, ParB presumably ends up in foci around parS because of the high-affinity interaction between ParB and its specific site mediated by the HTH domain. This situation cannot possibly be achieved in vitro and in order to observe ParB:DNA binding we had to raise [ParB] to concentration over 100 nM. The minimum concentration tested that resulted in condensation was 250 nM ParBAF.
We repeated condensation experiments using 250 nM ParBAF in the presence of 2.5 μM CTD in Mg2+ conditions (Figure 5B, Video 9). Only a very small fraction of DNA molecules showed some degree of condensation. Indeed, the time-lapse in Figure 5C (Video 10) shows that, even though the DNA molecule remains fully coated by ParBAF, it did not condense, even at very low (permissive) forces. For the totality of molecules analyzed in this study, (47 in the case of ParBAF and 36 in the case of ParBAF + CTD), we found that 83% of the molecules were condensed by ParBAF, whereas only 19% were condensed when the CTD was also present (Figure 5D). Moreover, when condensation was observed in the presence of the CTD, it was never complete. Typically, the extension of the molecule was not recovered upon re-application of high force, and a bright dot appeared at the anchoring point. The fact that normal condensation data (i.e. those collected with full length wild-type ParB only) do not show any such condensation foci (Figure 5A) and that the brighter dot in the CTD experiment appears at the anchoring point, suggests that this represents non-specific binding of the DNA to the surface that cannot be prevented at the low applied forces. The same bright dot was sometimes observed in the case of ParBAF at forces non-permissive for condensation, confirming our hypothesis (Video 11). We conclude that the presence of free CTD has converted the full length ParB into a form that can still bind, but can no longer condense DNA, which can only be explained by the capping model (Figure 1D).
Video 9
Movie showing that 250 nM ParBAF in the presence of an excess of CTD (2.5 µM) is not able to condense DNA.
Movie is 5X accelerated.
Video 10
Movie showing that 250 nM ParBAF in the presence of an excess of CTD (2.5 µM) is not able to condense DNA even in the absence of magnetic force.
Movie is 5X accelerated.
Video 11
Movie showing that a bright dot sometimes appears at the anchoring point of a DNA molecule in the presence of 250 nM ParBAF.
Movie is 5X accelerated.
We performed additional experiments using our laminar-flow system combined with direct visualisation of DNA-protein complexes. We switched between a buffer containing 250 nM ParBAF and another containing 250 nM ParBAF and 2.5 μM CTD in Mg2+ conditions, whilst keeping the DNA stretched with lateral MT. The period of buffer exchange (T=60 s) is long enough to account for protein exchange since we measured a for ParBAF of 0.08 s−1, corresponding to an occupation half-time of around 9 s (Figure 3C). Importantly, the intensity did not decrease when the conditions were switched from ParB alone to ParB co-incubated with CTD (Figure 5E, upper panel), again confirming a lack of competition for the DNA binding sites. Additionally, a control experiment where we substituted the excess of CTD for an equivalent excess of unlabelled ParB displayed a noticeable decrease in intensity attributed to the expected competition for DNA-binding sites between non-fluorescent ParB and ParBAF (Figure 5E, lower panel). To quantify this effect, we represented the average integrated intensity of ParBAF against the average integrated intensity of ParBAF + CTD/ParB for several molecules (Figure 5F). A deviation from a slope ~1 indicates changes in fluorescence intensity as a result of the competition for DNA-binding sites, validating the capability of our assay to qualitatively resolve differences in protein binding. Together, these results allowed us to conclude that condensation is impeded (or decondensation promoted) by the CTD as a result of capping a ParB-ParB dimerisation interface (Figure 1D).
Conclusions
Here, we have built upon our previous work to incorporate MT and TIRF microscopy to visualise the formation of ParB-DNA complex structures at controlled forces that can be either permissive or non-permissive for condensation. Our novel approach allowed us to visualise the dynamic nature of the ParB binding with evidence for fast and continuous exchange of proteins with the surrounding media. This dynamic behavior is consistent with results described not only for BsParB (Graham et al., 2014) (Taylor et al., 2015) (Song et al., 2017) (Fisher et al., 2017), but also for plasmid ParB (Debaugny et al., 2018; Sanchez et al., 2015) (Le Gall et al., 2016), and for other proteins, at the single molecule level (Gibb et al., 2014). Implementation of a multilaminar flow exchange system to the combined MT-TIRF setup provided a measurement of binding and unbinding reactions in the presence of the free CTD leading to the conclusion that it only affects binding and unbinding of ParB in a buffer supplemented with EDTA. Fluorescence experiments with the CTD in a buffer supplemented with Mg2+ strongly supported a mechanism for its dominant negative effect involving decondensation by direct disruption of ParB-ParB interfaces. Interestingly, the fact that the CTD prevents condensation by capping a dimerisation interface strongly suggests that the CTD in the full length ParB in solution is somehow inaccessible, unlike the DNA-bound ParB. This could explain why multimeric forms of ParB are not found in solution. The mechanism by which the CTD becomes accessible upon DNA binding is unclear and will be the subject of future research.
Materials and methods
Combined lateral MT-TIRF apparatus
Request a detailed protocolExperiments were performed in two MT-TIRF setups similar to one described before (Madariaga-Marcos et al., 2018). In brief, 488 nm laser source (Vortran Stradus) was focused on the back focal plane of a high numerical aperture objective (Olympus UAPON TIRF 100×). We used two separate detectors to visualise the emission of the fluorophores in the sample and the magnetic beads; an EM-CCD temperature-controlled camera (Andor Ixon Ultra 897/Andor Ixon Ultra 888) and a CCD or CMOS camera (Pulnix 6710 CL/Mikrotron MC1362) for bright-field video microscopy. Lateral Magnetic Tweezers consisted of a pair of permanent magnets (Q-05-05-02-G, Supermagnete) connected to a linear motor (Piezomotor). The MT setup was controlled by a custom-written code in Umbarger et al. (2011). Fluorescence camera was controlled by Andor Solis software.
Flow cells (simple and double channel)
Request a detailed protocolIn this work, two kinds of flow cells were used (with one or two inlets). In both cases, glass coverslips (Menzel-Gläser, #1) were cleaned by 30 min of sonication in acetone followed by 30 min in isopropanol, and dried using compressed air. The clean surface was coated with 1% polystyrene dissolved in toluene. The top cover glass contained two or three holes drilled with a laser engraver, as well as two-inlet paraffin wax (Parafilm M, Bernis USA) gaskets (VLS2.30, Universal Laser Systems). One-inlet gaskets were manually cut. The two cover glass slides and a gasket were sandwiched and heated up for a few seconds at 120°C to assemble the flow cell. The cells were then incubated with an Antidigoxigenin (25 ng/μl) solution (Roche) overnight at 4°C and were passivated for at least 2 hr using BSA (NEB). The cells were stored in a humid and sealed container at 4°C until further use.
DNA substrate (λ/2)
Request a detailed protocolλ/2 molecules were fabricated as described elsewhere (Madariaga-Marcos et al., 2018) (Camunas-Soler et al., 2013). Briefly, CosR-tail and CosL-tail oligonucleotides were biotin tailed and the XbaI-A oligonucleotide was digoxigenin tailed using Terminal Transferase (NEB) and either BIO-dUTP or DIG-dUTP (Roche). The modified oligonucleotides were purified using a Qiaquick nucleotide removal kit (Qiagen). N6-Mehtyladenine-free λ DNA (NEB) was cleaved with XbaI, giving two ~ 24 kbp fragments. These fragments and the tailed oligonucleotides in addition to the XbaI-B oligonucleotide were subsequently annealed and ligated overnight using T4 DNA ligase (NEB).
Protein purification and labelling
Request a detailed protocolB. subtilis ParB and the truncated CTD variant were recombinantly overexpressed in E. coli and subsequently purified using no extrinsic tags as described previously (Taylor et al., 2015) (Fisher et al., 2017).
ParB contains no native cysteine residues and so design of point substituted variants for covalent coupling to maleimide-conjugated fluorophores was pursued. Mutation S68C was selected because it is located in a surface-accessible putative loop region of poorly conserved sequence and length. ParBS68C was purified as described for the wild type protein with an additional labelling step. Following elution from a Hiload 16/600 Superdex S75 gel filtration column (equilibrated in the absence of DTT), pooled concentrate was added to a 1 mg aliquot of Alexa Fluor 488 C5 Maleimide (Invitrogen) at a molar ratio of 1:5. This reaction was rotated end-over-end at 4°C for 16 hr before quenching by the addition of DTT to 5 mM. The conjugate solution was then loaded onto a Hiload 16/600 Superdex S75 gel filtration column (in the presence of 1 mM DTT), to separate labeled ParB (ParBAF) and free fluorophore. ParBAF was pooled and concentrated before storage as described for wild type ParB. Apparent labelling efficiency was assessed by spectrophotometry as described by the vendor, by comparing the absorbance from the protein and the Alexa Fluor 488 dye, including a correction factor for absorbance of the dye at 280 nm (0.11). Native and collision-induced dissociation (CID) or electron-transfer dissociation (ETD) MS were used to assess labelling efficiency and stoichiometry, and to confirm covalent attachment of the fluorophore (not shown). ParBAF was fluorescently labelled at an approximate efficiency of 2 dyes per ParB monomer.
Similarly, the structure of the CTD dimer (PDB ID: 5NOC) was used to design a suitable site for cysteine substitution and fluorophore attachment. The residue S278 was selected as it is found in a relatively unconserved region located at the end of the final α-helix. Labelling reactions were performed as described before with the following modifications. Prior to labelling, the purified protein was treated with freshly prepared TCEP (at a final concentration of 1 mM), at room temperature for 1 hr with end-over-end rotation. A near stoichiometric molar ratio (~1:1.5) of the maleimide-conjugate dye was used over a 16 hr reaction course. Purification, quantification and storage of the protein-fluorophore conjugate were completed as described before (Fisher et al., 2017). CTDAF was labelled with a final efficiency of 0.82 dyes per CTD monomer.
ParB/CTD binding and visualisation experiments
Request a detailed protocolTethers of λ/2 DNA molecules were obtained by mixing DNA with 1 μm size magnetic beads (Dynabeads, MyOne streptavidin, Invitrogen) in a buffer containing 100 mM NaCl, 50 mM Tris (pH 7.5), 0.2 mg/ml BSA, and 0.1% Tween 20, supplemented with 4 mM MgCl2 (ParB reaction buffer) or supplemented with 1 mM EDTA (ParB-EDTA reaction buffer). DNA molecules were laterally stretched at non-permissive forces for condensation (over 1 pN). Then, 250 nM ParBAF or 10 µM CTDAF was injected into the cell at a flow rate of 250 µl/min and the DNA molecules were imaged using Andor Solis software. Images were acquired at a frequency of 9.52 Hz, using an EM level of 100 and cooling the sensor to −60 or −80°C. For condensation experiments, the lateral magnet was moved away from the flow cell to apply a force of 0.2 pN, while recording the fluorescence image. Fluorescence data analysis was performed in Andor Solis and Origin and movies were generated using ImageJ. For representation, images were exported from Andor Solis as 8-bit gray tiff files. First, a background was subtracted using a 50 pixel radius (sliding paraboloid, smoothing disabled) and then brightness and contrast were adjusted by visual inspection to enhance the signal. Finally, a custom look up table in green scale was applied. For the production of videos, fluorescence movies were exported as RGB single tiff files and assembled as videos using a custom ImageJ script (Source code 1 provided). Both biological (new sample preparations from a fresh stock aliquot) and technical (single-molecule measurements) repeats were undertaken.
Multichannel laminar-flow experiments for kinetics measurements
Request a detailed protocolTethers of λ/2 DNA were obtained by mixing DNA with 1 µm sized superparamagnetic beads in ParB or ParB-EDTA buffer supplemented with 1 mM Trolox, 20 mM glucose, 8 µg/ml glucose oxidase and 20 µg/ml catalase. The mixture was incubated and then flowed into the flow cell. After tethers were formed, unbound beads were extensively washed away. Tethers were laterally stretched at a force of 1 pN using lateral magnets. Fluorescence images were acquired using Andor Solis software. Images were acquired at a frequency of 9.52 Hz, using the EM level of 100 and cooling the sensor to −60 °C. 4000 frames were recorded. Syringes were controlled with the neMESYS UserInterface software. Briefly, a square-wave pattern was set for syringes to alternate flow-rates between 10 and 190 µl/min, keeping the flow-rate in the central channel to 200 µl/min. Employed ParBAF concentrations were 125, 250 and 500 nM and CTDAF was 10 µM. Data analysis was performed using Andor Solis and Origin. For each molecule of interest, a main region of interest (ROI) was selected around the DNA molecule in Andor Solis. Four additional ROIs around the main ROI were also selected for background correction by subtracting the mean intensity of the four ROIs to the DNA ROI (in counts). Intensities were then analyzed in Origin. was estimated by fitting the first two points (corresponding to 125 nM and 250 nM) on Figure 3D to the equation , which yielded a value of ~3.95 x 10⁵ M−1 s−1.
Maximum Reynolds number in our microfluidic device
Request a detailed protocolThe Reynolds number is calculated as:
(4)
where is the average linear velocity at the applied flow ( ≈ 10−3 m s−1 for the maximum flow rate of 200 µl/min), the dynamic viscosity of the fluid (10−3 Pa s) and the density of the fluid (1 g cm−3). We can determine the equivalent hydrodynamic radius of a square duct as , where and are the height and the width of the cross section of the liquid cell, respectively. In this case, ≈ 200 μm and ≈ 3 mm and we obtain a radius ≈ 188 μm. This gives a Reynolds number of ≈ 0.001 << 2000. Consequently, our system is always under laminar flow conditions.
Calculation of the total force exerted on the DNA molecule while flowing under lateral magnetic pulling
Request a detailed protocolThe total force applied to the DNA is the sum of two components, the magnetic force exerted by the magnets and the drag force applied by the flow (Madariaga-Marcos et al., 2018):
(5)
The experiments reported here were done at a 1 pN pulling force, . The drag force was deduced from the flow rate using a previously measured curve of force versus flow rate, in flow stretch assays . This led to a total force .
Fluorescence recovery after photobleaching (FRAP) experiments
Request a detailed protocolWe laterally stretched DNA tethers at a force of 1 pN. We then flowed 250 nM (or 1 µM for comparison with CTDAF) ParBAF. The imaging protocol consisted of imaging a DNA molecule at a low laser power for 200 frames before increasing the laser power for 100 frames to photobleach all ParBAF molecules. Fluorescence recovery was then allowed for 1200 frames at the initial laser power. Images were acquired at a frequency of 9.52 Hz, with an EM gain of 100 and with the sensor cooled to −60 or −80°C. The area (ROI) around each DNA molecule was analyzed using Andor Solis. Integrated fluorescence intensities were analysed using Origin.
Data availability
Data generated or analysed during this study are included in the manuscript and supporting files. Representative source data files are included as Videos. Analysis procedures are included in Materials and methods.
References
-
A conserved mechanism drives partition complex assembly on bacterial chromosomes and plasmidsMolecular Systems Biology 14:e8516.https://doi.org/10.15252/msb.20188516
-
ParB partition proteins: complex formation and spreading at bacterial and plasmid centromeresFrontiers in Molecular Biosciences 3:44.https://doi.org/10.3389/fmolb.2016.00044
-
Protein dynamics during presynaptic-complex assembly on individual single-stranded DNA moleculesNature Structural & Molecular Biology 21:893–900.https://doi.org/10.1038/nsmb.2886
-
BookBinding and Kinetics for Molecular BiologistsCold Spring Harbor Laboratory Press.
-
ParB spreading requires DNA bridgingGenes & Development 28:1228–1238.https://doi.org/10.1101/gad.242206.114
-
Bacterial partition complexes segregate within the volume of the nucleoidNature Communications 7:e12107.https://doi.org/10.1038/ncomms12107
-
A network of cis and trans interactions is required for ParB spreadingNucleic Acids Research 45:7106–7117.https://doi.org/10.1093/nar/gkx271
-
Building bridges within the bacterial chromosomeTrends in Genetics 31:164–173.https://doi.org/10.1016/j.tig.2015.01.003
-
Specific and non-specific interactions of ParB with DNA: implications for chromosome segregationNucleic Acids Research 43:719–731.https://doi.org/10.1093/nar/gku1295
-
Force-driven unbinding of proteins HU and fis from DNA quantified using a thermodynamic maxwell relationNucleic Acids Research 39:5568–5577.https://doi.org/10.1093/nar/gkr141
Article and author information
Author details
Julene Madariaga-Marcos

Mark Simon Dillingham
Fernando Moreno-Herrero
Funding
Basque Government (PRE_2013_11_1174)
- Julene Madariaga-Marcos
Biotechnology and Biological Sciences Research Council (1363883)
- Gemma LM Fisher
Wellcome (100401)
- Mark Simon Dillingham
Wellcome (077368)
- Mark Simon Dillingham
Agencia Estatal de Investigación (BFU2017-83794-P)
- Fernando Moreno-Herrero
H2020 European Research Council (681299)
- Fernando Moreno-Herrero
The funders had no role in study design, data collection and interpretation, or the decision to submit the work for publication.
Acknowledgements
We are thankful for financial support from AEI/FEDER, UE (BFU2017-83794-P) and from European Research Council (ERC) under the European Union’s Horizon2020 Research and Innovation programme (grant agreement no. 681299). JM-M acknowledges a predoctoral PhD fellowship from the Basque Country Government Department of Education, Language Policy and Culture (ref. PRE_2013_11_1174). GLMF was supported by the Biotechnology and Biological Sciences Research Council (1363883). MSD was supported by the Wellcome Trust (100401 and 077368).
Version history
- Received: November 23, 2018
- Accepted: March 9, 2019
- Version of Record published: March 25, 2019 (version 1)
Copyright
© 2019, Madariaga-Marcos et al.
This article is distributed under the terms of the Creative Commons Attribution License, which permits unrestricted use and redistribution provided that the original author and source are credited.
Metrics
-
- 1,412
- Page views
-
- 161
- Downloads
-
- 14
- Citations
Article citation count generated by polling the highest count across the following sources: PubMed Central, Crossref, Scopus.
Download links
A two-part list of links to download the article, or parts of the article, in various formats.
Downloads (link to download the article as PDF)
Open citations (links to open the citations from this article in various online reference manager services)
Cite this article (links to download the citations from this article in formats compatible with various reference manager tools)
ParB dynamics and the critical role of the CTD in DNA condensation unveiled by combined force-fluorescence measurements
eLife 8:e43812.
https://doi.org/10.7554/eLife.43812
Further reading
-
- Chromosomes and Gene Expression
Splicing is the stepwise molecular process by which introns are removed from pre-mRNA and exons are joined together to form mature mRNA sequences. The ordering and spatial distribution of these steps remain controversial, with opposing models suggesting splicing occurs either during or after transcription. We used single-molecule RNA FISH, expansion microscopy, and live-cell imaging to reveal the spatiotemporal distribution of nascent transcripts in mammalian cells. At super-resolution levels, we found that pre-mRNA formed clouds around the transcription site. These clouds indicate the existence of a transcription-site-proximal zone through which RNA move more slowly than in the nucleoplasm. Full-length pre-mRNA undergo continuous splicing as they move through this zone following transcription, suggesting a model in which splicing can occur post-transcriptionally but still within the proximity of the transcription site, thus seeming co-transcriptional by most assays. These results may unify conflicting reports of co-transcriptional versus post-transcriptional splicing.
-
- Chromosomes and Gene Expression
- Genetics and Genomics
Heterogeneity in endothelial cell (EC) sub-phenotypes is becoming increasingly appreciated in atherosclerosis progression. Still, studies quantifying EC heterogeneity across whole transcriptomes and epigenomes in both in vitro and in vivo models are lacking. Multiomic profiling concurrently measuring transcriptomes and accessible chromatin in the same single cells was performed on six distinct primary cultures of human aortic ECs (HAECs) exposed to activating environments characteristic of the atherosclerotic microenvironment in vitro. Meta-analysis of single-cell transcriptomes across 17 human ex vivo arterial specimens was performed and two computational approaches quantitatively evaluated the similarity in molecular profiles between heterogeneous in vitro and ex vivo cell profiles. HAEC cultures were reproducibly populated by four major clusters with distinct pathway enrichment profiles and modest heterogeneous responses: EC1-angiogenic, EC2-proliferative, EC3-activated/mesenchymal-like, and EC4-mesenchymal. Quantitative comparisons between in vitro and ex vivo transcriptomes confirmed EC1 and EC2 as most canonically EC-like, and EC4 as most mesenchymal with minimal effects elicited by siERG and IL1B. Lastly, accessible chromatin regions unique to EC2 and EC4 were most enriched for coronary artery disease (CAD)-associated single-nucleotide polymorphisms from Genome Wide Association Studies (GWAS), suggesting that these cell phenotypes harbor CAD-modulating mechanisms. Primary EC cultures contain markedly heterogeneous cell subtypes defined by their molecular profiles. Surprisingly, the perturbations used here only modestly shifted cells between subpopulations, suggesting relatively stable molecular phenotypes in culture. Identifying consistently heterogeneous EC subpopulations between in vitro and ex vivo models should pave the way for improving in vitro systems while enabling the mechanisms governing heterogeneous cell state decisions.


