Human VPS13A is associated with multiple organelles and influences mitochondrial morphology and lipid droplet motility
- University of Groningen, University Medical Center Groningen, The Netherlands
- Groningen Research Institute of Pharmacy (GRIP), Faculty of Science and Engineering, University of Groningen, The Netherlands
- Wellcome Trust Centre for Human Genetics, United Kingdom
- Tufts University, United States
Figures
Figure 1 with 1 supplement
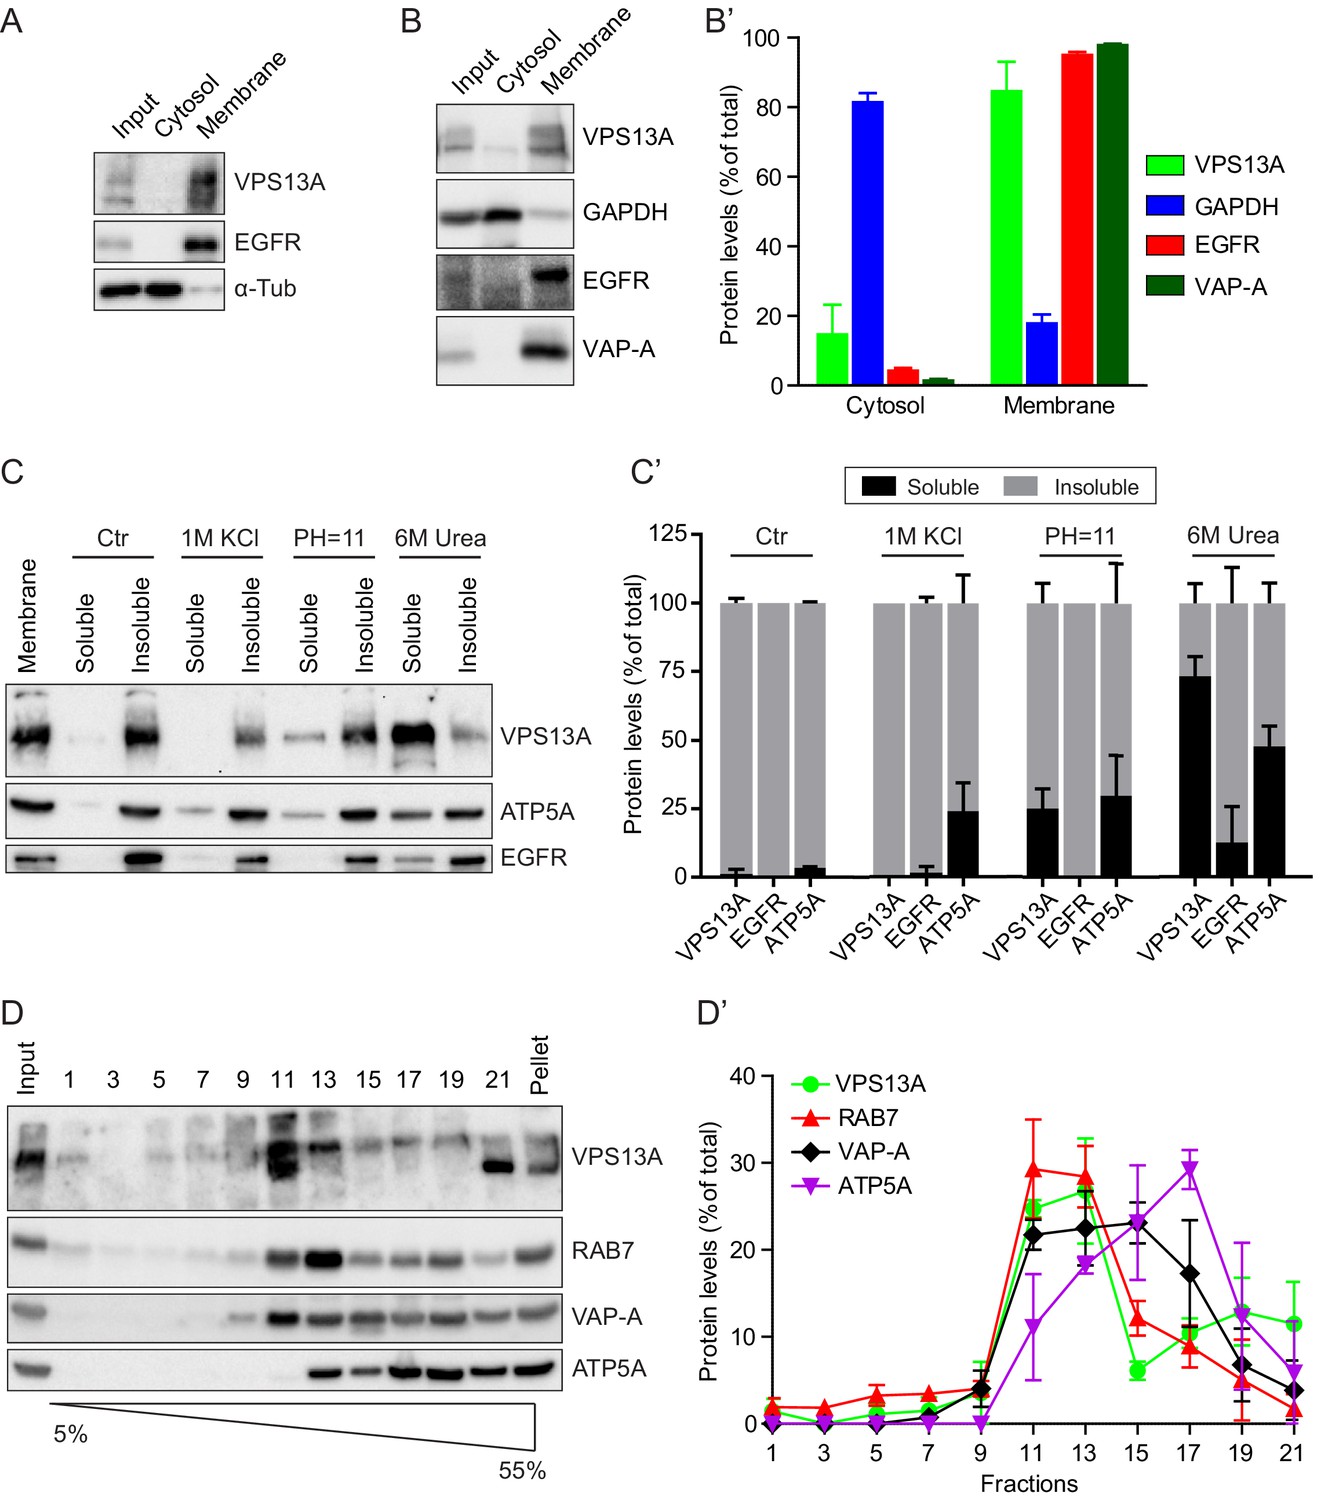
VPS13A is enriched in membrane fractions and is peripherally associated to membranes.
(A) Light membrane fractions from HeLa cell homogenates were separated by centrifugation in a cytosolic and a membrane fraction. Equal amounts of proteins were processed for immunoblot analysis of VPS13A, EGFR and α-tubulin. (B) Digitonin extraction of cytosolic proteins in HEK293T cells were immunoblotted for the indicated proteins. The amount of protein was quantified using ImageJ and presented as a percentage of the total (B’). (C) Membrane fractions of HeLa cells were prepared as in A and subjected to different chemical agents to extract proteins from membranes. Equal amount of proteins were processed for immunoblotting using antibodies against VPS13A, EGFR and ATP5A. The amount of protein was quantified using ImageJ and presented as a percentage of the total (C’) (D) Sucrose gradient fractionation from HeLa cells. HeLa cells were lysed in detergent free buffer and separated in 5–55% sucrose gradients by high speed centrifugation. After TCA precipitation, fractions were processed for immunoblotting using antibodies against VPS13A, VAP-A, RAB7 and ATP5A. Quantification of protein band intensities in D was performed using ImageJ and plotted as percentage of the total (D’). In B’, C’, D’, error bars, mean ±s.e.m (n = 3).
Figure 1—figure supplement 1

Scan of original blots for Figure 1.
https://doi.org/10.7554/eLife.43561.003
Figure 2 with 2 supplements
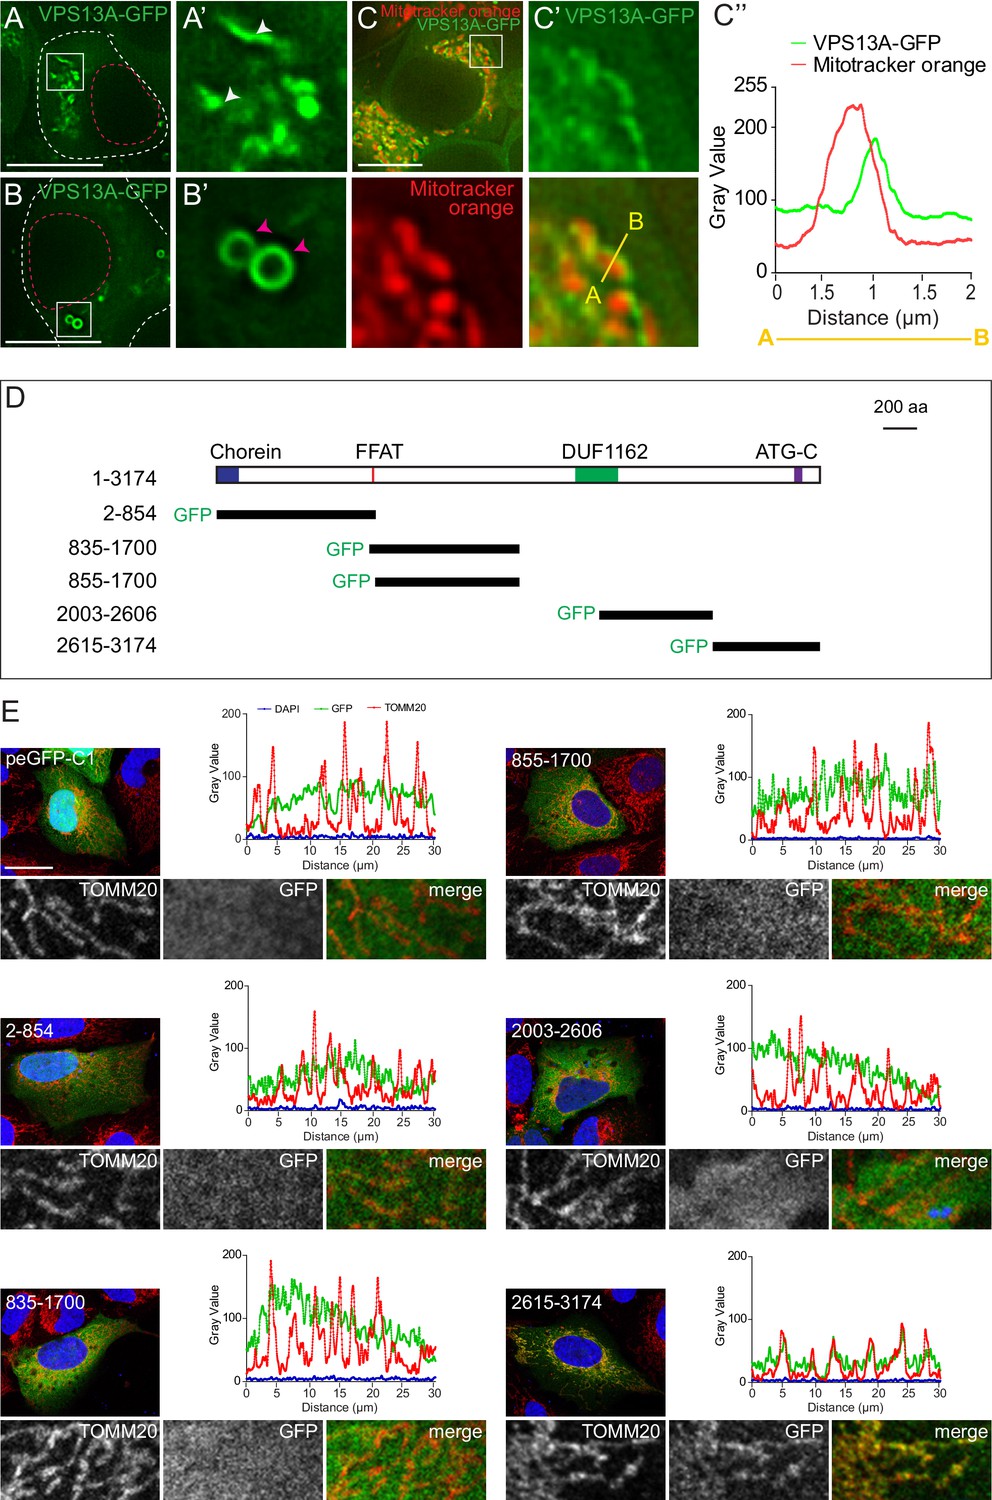
VPS13A is localized at mitochondria via its C-terminal domain.
(A,B) HEK293T cells were transfected with VPS13A-GFP and the GFP signal was visualized using confocal microscopy. White arrowheads show reticular structures (A, A’) and magenta arrowheads show vesicular structures (B, B’). Cell borders are marked by white dashed lines and the nucleus is marked by magenta dashed lines. (C) Single stack image from a time-lapse recording of HEK293T cells expressing VPS13A-GFP for 48 hr (Video 1). Mitochondria were labeled using Mitotracker orange. C’, C’ Line scan analysis of VPS13A-GFP and Mitotracker orange indicates the peri-mitochondrial localization of VPS13A. (D) Schematic representations of full length VPS13A and N-terminally GFP tagged VPS13A fragments. Numbers denote the first and last amino acid positions. (E) GFP-VPS13A (green) constructs represented in D were overexpressed in U2OS cells for 24 hr. Cells were stained for TOMM20 (red) and DAPI (blue). Line scan co-localization analysis was done for all channels. Scale bars = 10 µm (A–C) and 25 µm (E).
Figure 2—figure supplement 1

VPS13A colocalizes with mitochondria but not with the endocytic compartment.
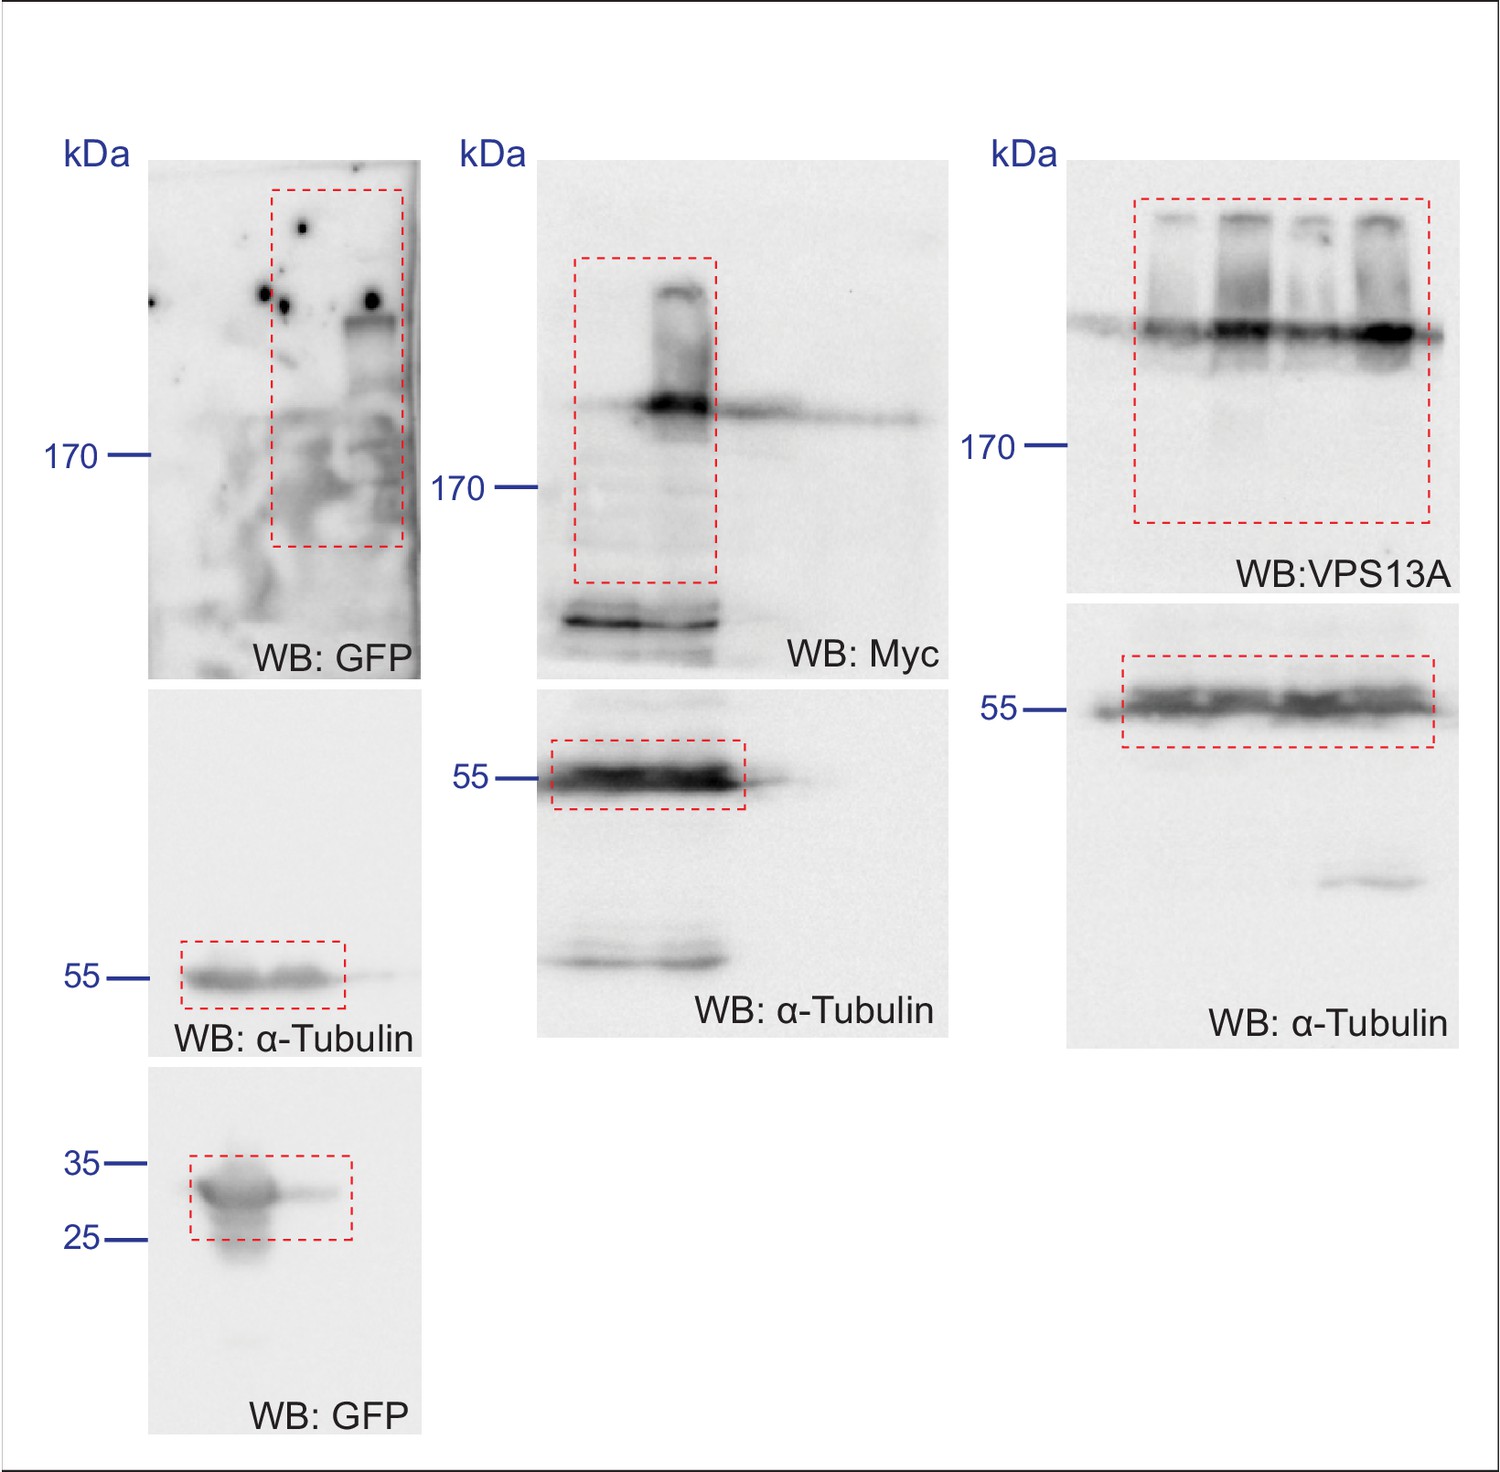
(A) 48 hours after transfection with either VPS13A-Myc or VPS13A-GFP, HEK293T cells were processed for immunoblotting using antibodies against VPS13A and -Tubulin. peGFP-C1 transfected or non-transfected (NT) cells were used as controls. Note the enrichment of VPS13A in both VPS13A-Myc or VPS13A-GFP lanes. (B) Quantification of protein bands detected with anti-VPS13A antibody in A. The ratio of VPS13A to -tubulin was normalized to NT cells. Error bars, mean ± s.e.m (n=3), two-tailed unpaired Student’s t-test was used (*P ≤ 0.05, **P≤0.01). C-F HEK293T cells were co-transfected with VPS13A-Myc and with GFP-Rab5 Q79L (C), GFP-Rab7 Q67L (D), LAMP1-GFP (E) or mCherry FYCO1 (F). Cells were stained with anti-myc (C-E, red; F, green) and DAPI (blue). Bottom panels (C’-F’ show a magnification of the inset in top panels. Scale bars = 10 µm (C–F’).
Figure 2—figure supplement 2
Scan of original blots for Figure 2—figure supplement 1.
https://doi.org/10.7554/eLife.43561.006
Figure 3 with 4 supplements
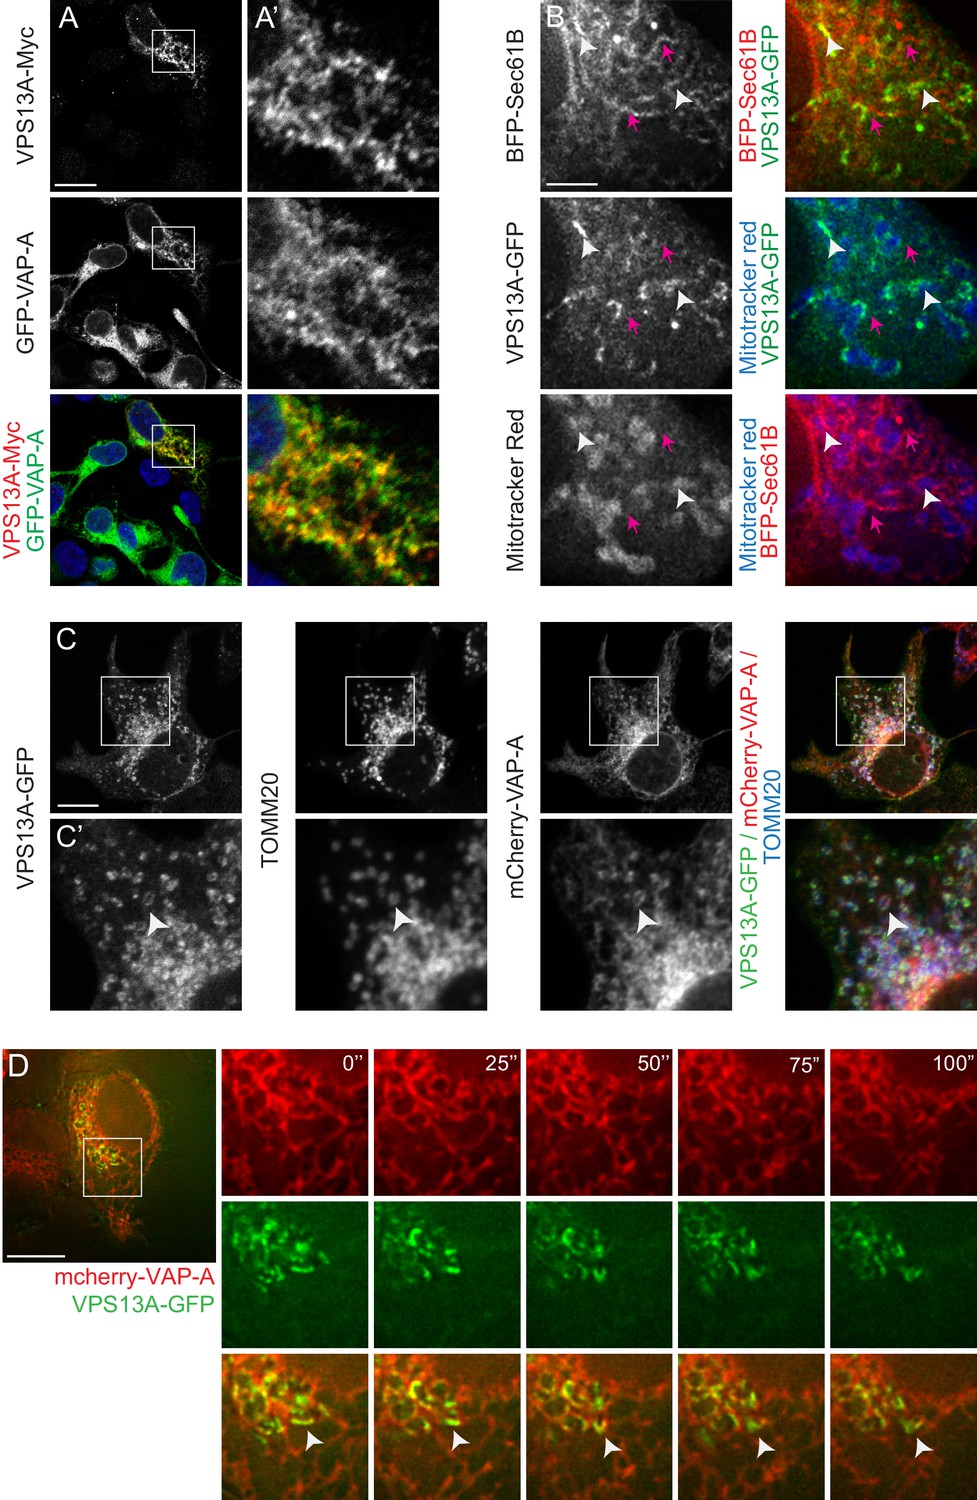
VPS13A is localized at the ER-mitochondria interface.
(A) HEK293T cells were co-transfected with VPS13A-Myc and the ER marker GFP-VAP-A. Cells were stained with anti-Myc (red) and DAPI (blue). A’ shows higher magnification of the inserts in A. (B) Representative single stack image of HEK293T cells expressing the ER marker BFP-Sec61B and VPS13A-GFP. Mitochondria were labeled using Mitotracker red. White arrowheads indicate the enrichment of VPS13A at the ER-mitochondria interface. Magenta arrows indicate BFP-Sec61B positive ER tubules, negative for VPS13A-GFP and not in close association with mitochondria. (C) Representative single stack image of HEK293T cells expressing mCherry-VAP-A (ER marker) and VPS13A-GFP. Mitochondria were labeled using TOMM20 antibody. White arrowheads indicate the enrichment of VPS13A at areas positive for ER and mitochondria markers. C’ shows higher magnification of the insert in C. (D) Representative time-lapse images of HEK293T cells expressing VPS13A-GFP and mCherry-VAP-A for 48 hr (Video 2). White arrowheads points to continuous dynamic associations of VPS13A-GFP and mCherry VAP-A. Scale bars = 10 μm (A, C, D), and 2 μm (B).
Figure 3—figure supplement 1
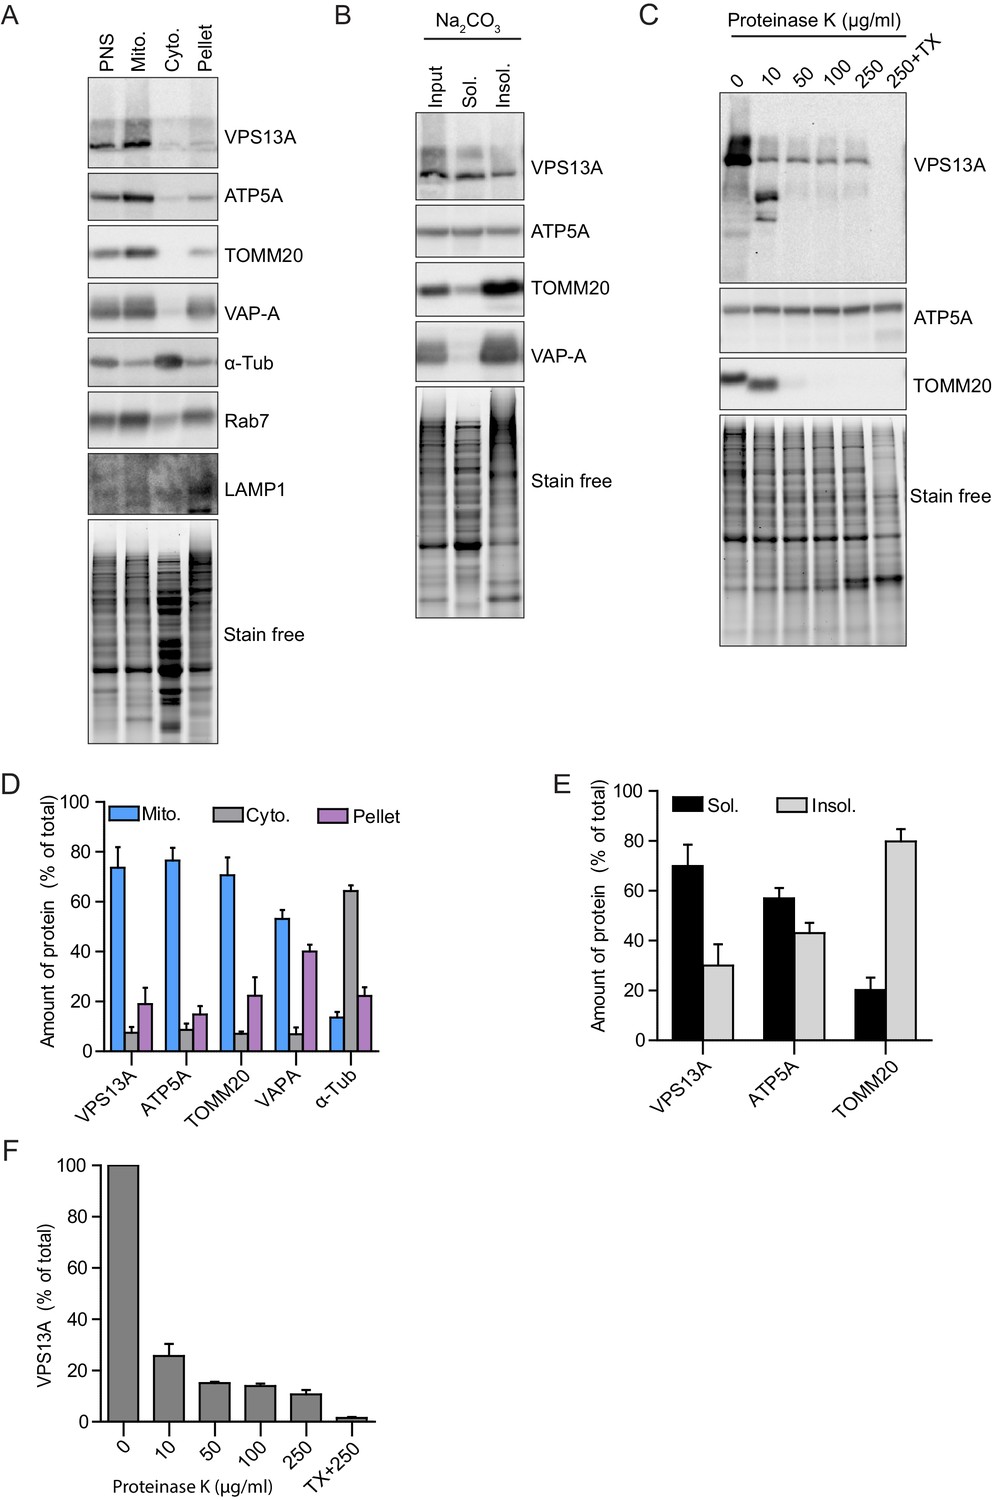
VPS13A is enriched in fractions of the outer mitochondria membrane.
(A) Crude mitochondria, cytosolic and microsomal fractions (pellet) were isolated from HeLa cells. Equal amounts of proteins were processed for Western blot analysis and detected with antibodies against indicated proteins. PNS = post nuclear supernatant. For all blots (A–C) the total protein is also shown with the ‘stain free’ gel.”Stain free’: to this gel a trihalo compound is added which binds to tryptophan amino acids and enhances fluorescence’s when exposed to UV-light. (B) The crude mitochondria fraction isolated from HeLa cells was treated with Na2CO3 to extract peripheral membrane proteins. Soluble and insoluble fractions were separated by centrifugation. Equal amounts of proteins were processed for Western blot analysis and detected with antibodies against indicated proteins. (C) The crude mitochondria fraction described in A was treated with different concentrations of Proteinase K. Equal amounts of proteins were processed for Western blot analysis and detected with antibodies against indicated proteins. (D–F) Quantification of protein band intensities in A-C was performed using ImageJ and plotted as percentage of the total. For Figure (C) only the VPS13A band was quantified. Error bars, mean ±s.e.m (n = 3).
Figure 3—figure supplement 2

Scan of original blots for Figure 3—figure supplement 1.
https://doi.org/10.7554/eLife.43561.010
Figure 3—figure supplement 3
VPS13A interacts with VAP-A in human cells.
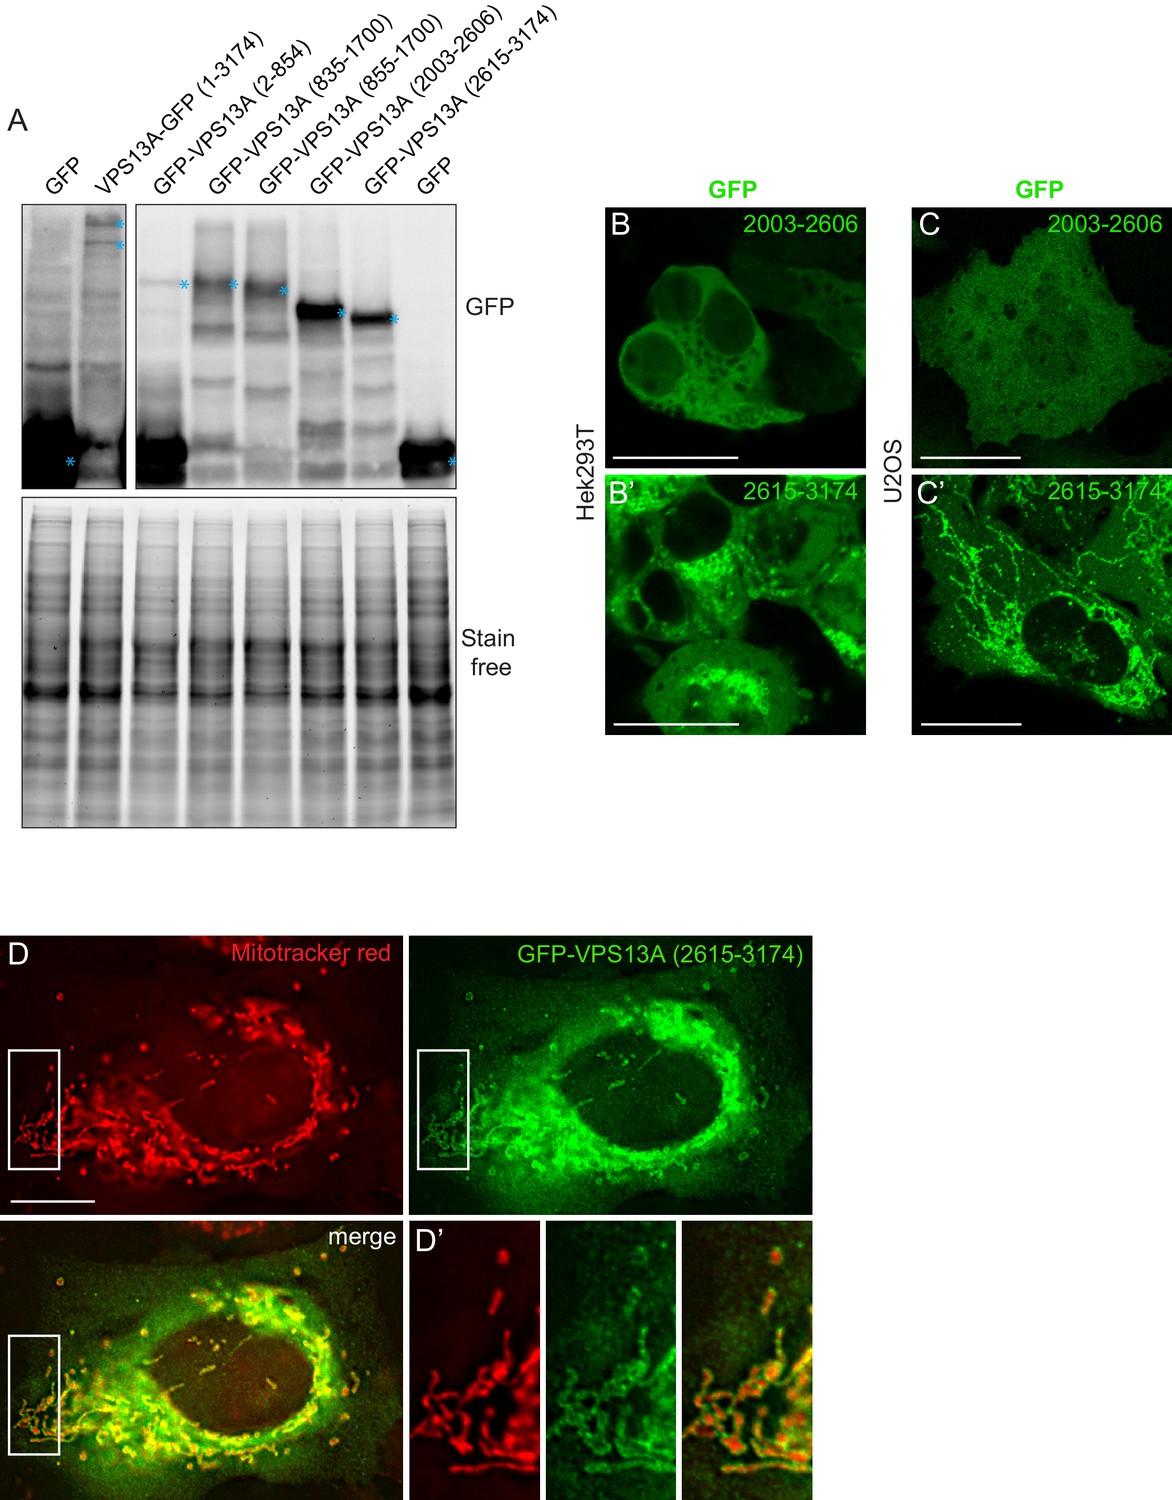
(A) GFP-VPS13A constructs presented in Figure 2D–E were overexpressed in HEK293T cells for 24 hr. Cell lysates were processed for immunoblot analysis using an antibody against GFP. peGFP-C1 (GFP) expressing cells were used as a control. The stain free gel is shown as a loading control. B,C GFP-VPS13 (2003–2606) and GFP-VPS13A (2615–3174) constructs were expressed in either HEK293T cells (B/B’) or U2OS cells (C/C’). Note the differences in mitochondria morphology in both cell types. (D) U2OS cells expressing GFP-VPS13A (2615–3174) for 24 hr were stained with Mitotracker Red. D’ shows a higher magnification of the insert in D. Cells were co-transfected with mCherrySec61 (B/C) and BFP-Sec61 (D/D’) (not shown). Scale bars = 25 μm (B–C’) and 10 μm (D–D’).
Figure 3—figure supplement 4

Scan of original blots for Figure 3—figure supplement 3.
https://doi.org/10.7554/eLife.43561.012
Figure 4 with 4 supplements
Direct interaction of VPS13A and VAP-A.
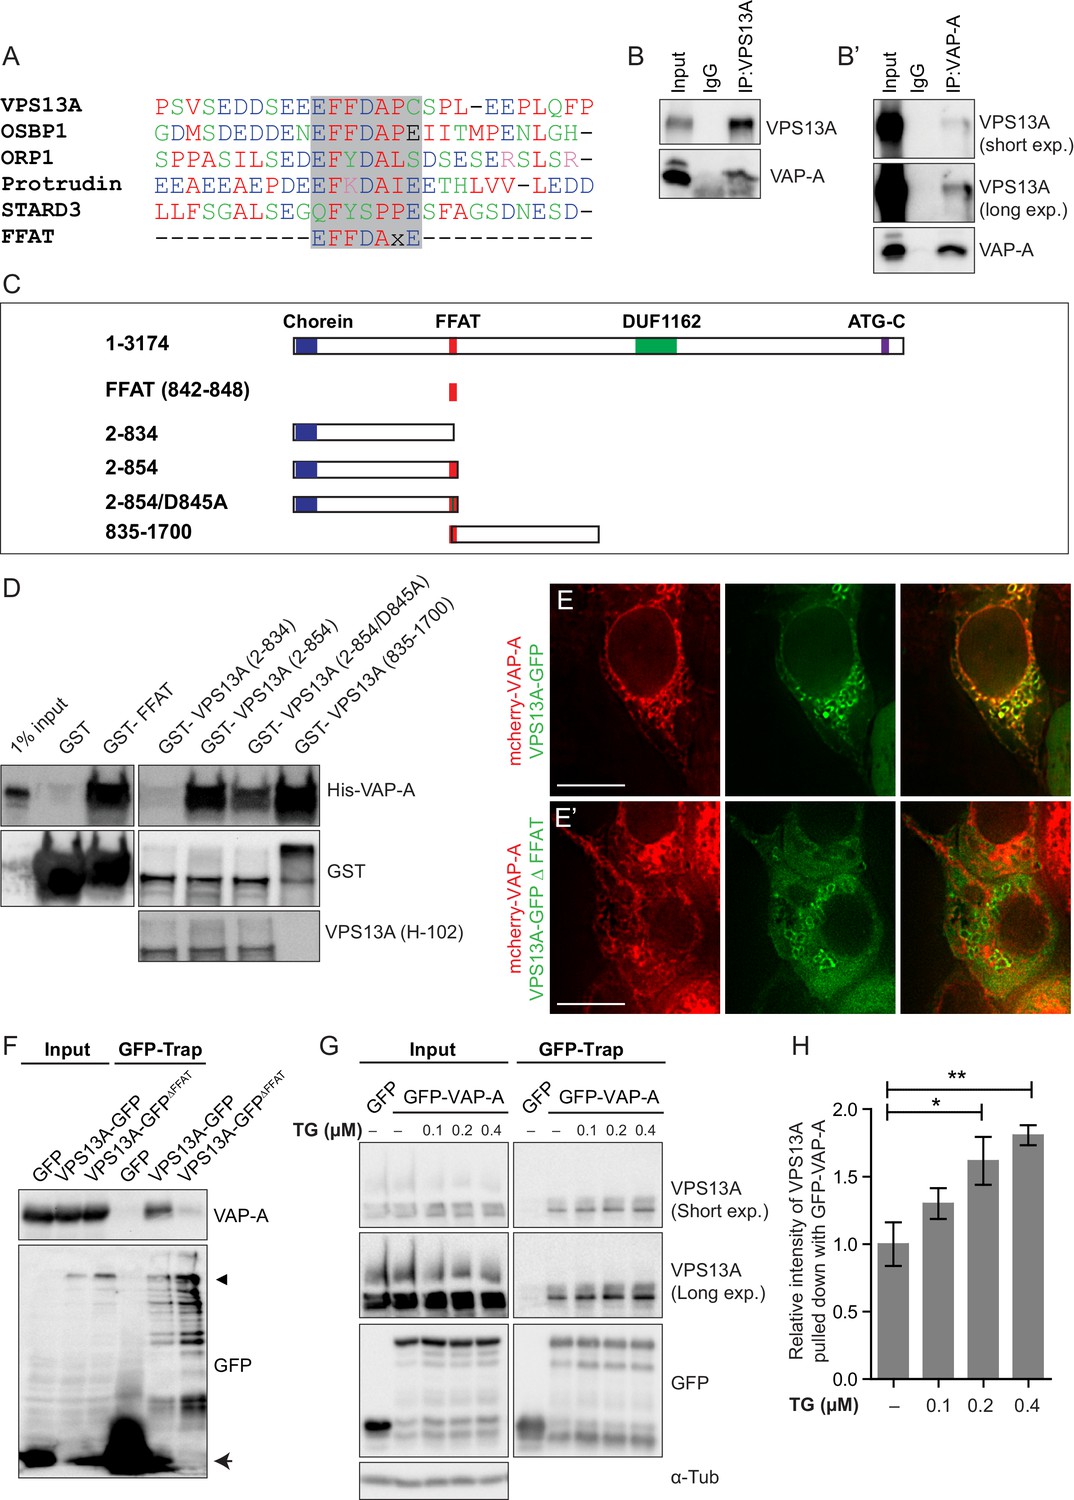
(A) Amino acid sequence alignment of VPS13A-FFAT and four other FFAT containing proteins. The FFAT containing region (gray box) of each protein was selected and aligned using ClustalW multiple alignment tool. (B) Endogenous VPS13A was immunoprecipitated from HeLa cells using an anti-VPS13A antibody. Rabbit IgG was used as a control. (B’) Endogenous VAP-A was immunoprecipitated from HeLa cells using an anti-VAP-A antibody. Goat IgG was used as a control. Indicated proteins were detected by immunoblotting. (C) Schematic representations of bacterially expressed GST tagged VPS13A fragments used for the in vitro binding assays in D. (D) In vitro binding assay using 6xHis-VAP-A and GST-fusions of VPS13A fragments (depicted in C) expressed in E.Coli. GST-fusion proteins were enriched on Sepharose beads and incubated with equal amounts of bacterial lysate containing 6xHis-VAP-A. GST alone used as a control. Samples were immunoblotted against VAP-A, GST and N-terminal VPS13A (H-102). (E) Representative single stack image of HEK293T cells expressing mCherry-VAP-A (red) and VPS13A-GFP (E) or VPS13A-GFP ΔFFAT (E’). A yellow signal in the overlay indicates a close association between VPS13A-GFP and VAP-A (E) and the absence of a yellow signal indicates the absence of a close association between VPS13A-GFP ΔFFAT and VAP-A (E’). (F) GFP tagged full length VPS13A and VPS13A ΔFFAT were transiently expressed in HEK293T cells. Cell lysates were immunoprecipitated using a GFP-trap assay. GFP alone was used as a control. Indicated proteins were detected by immunoblotting. Arrowhead indicates the VPS13A-GFP band and arrow indicates free GFP band. (G) GFP-VAP-A was immunoprecipitated from HeLa cells treated with different concentrations of Thapsigargin (TG) for 6 hr. DMSO was used as control. Indicated proteins were detected by immunoblotting. (H) Densitometric quantification of protein bands in G. The ratio of immunoprecipitated VPS13A was normalized to the respective amount of GFP-VAP-A. Cells treated with DMSO were used as controls. Data above (B, D, F) represents (n = 3), in H, error bars, mean ±s.e.m (n = 3), two-tailed unpaired Student’s t-test was used (*p≤0.05, **p≤0.01). Scale bars = 10 μm (E, E’).
Figure 4—figure supplement 1
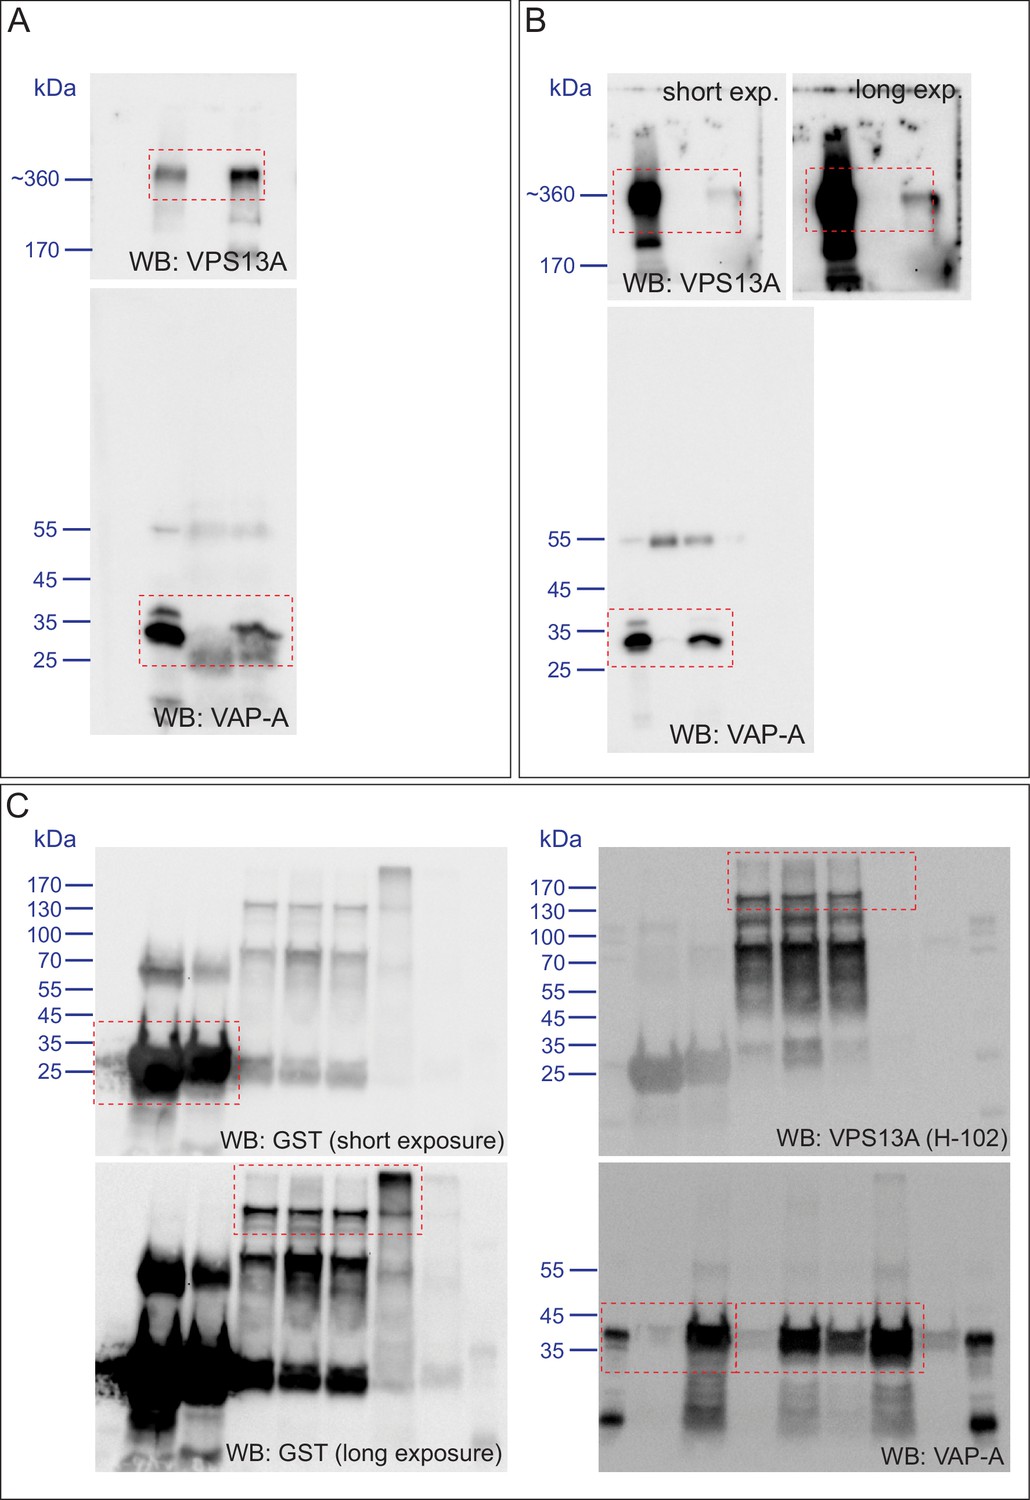
Scan of original blots for Figure 4.
https://doi.org/10.7554/eLife.43561.015
Figure 4—figure supplement 2
Scan of original blots for Figure 4.
Figure legend as in Figure 4 and Western blot analysis was performed for VAP-B.
Figure 4—figure supplement 3
VPS13A interacts with VAP-A.
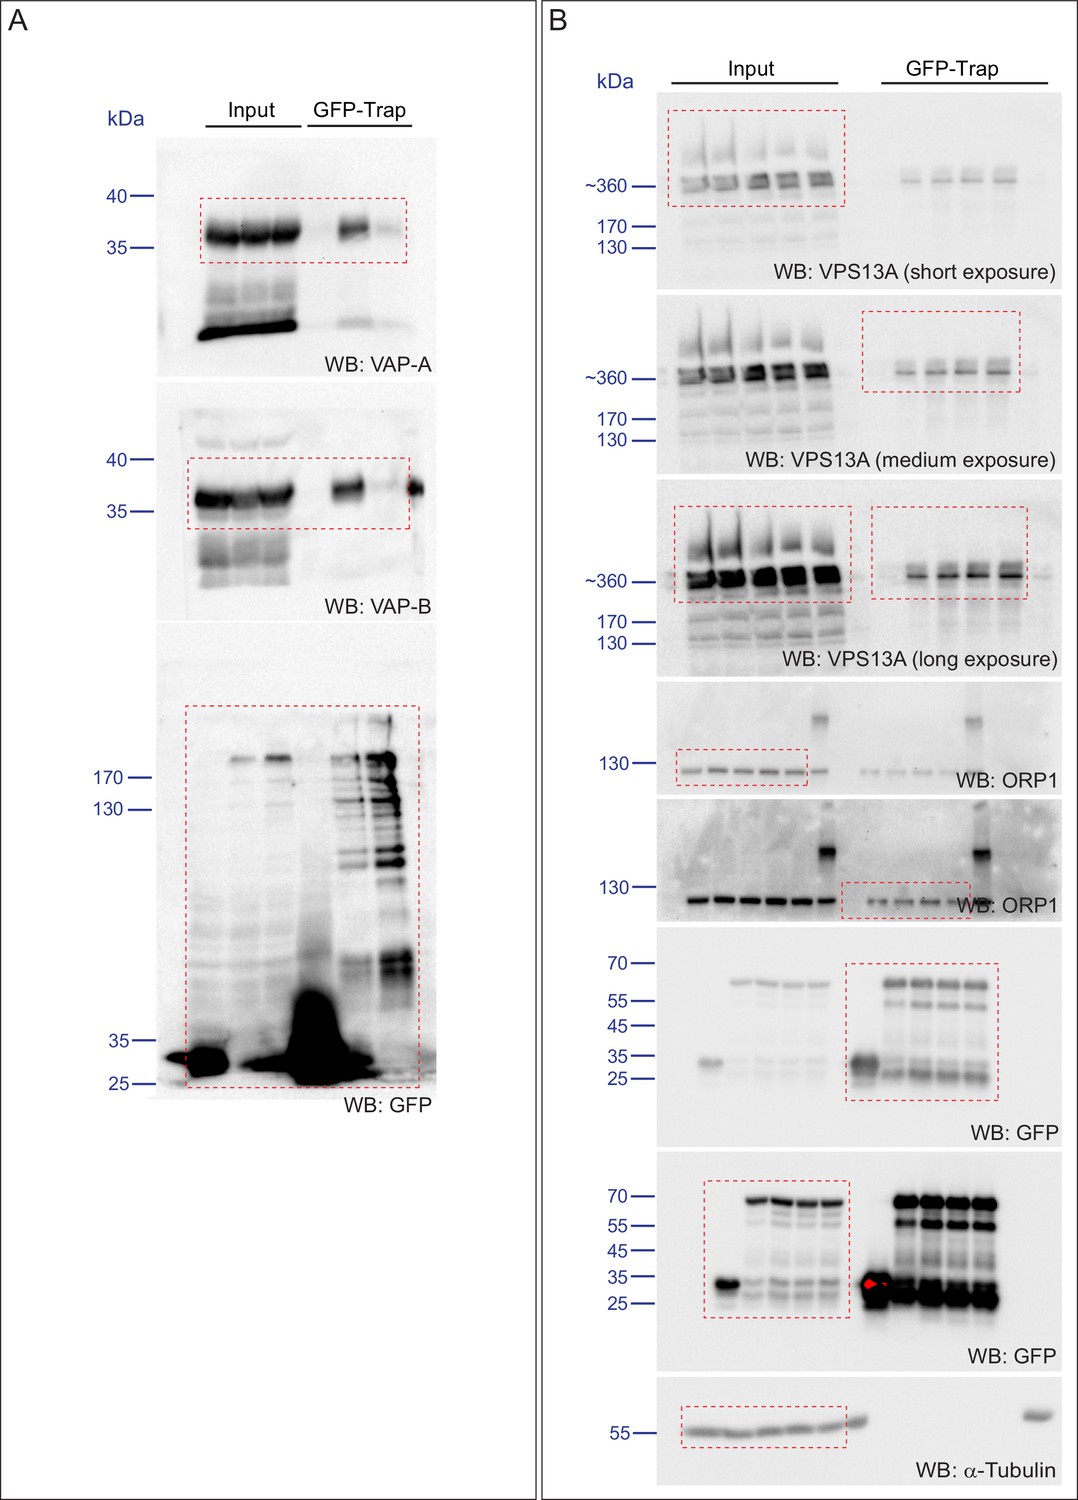
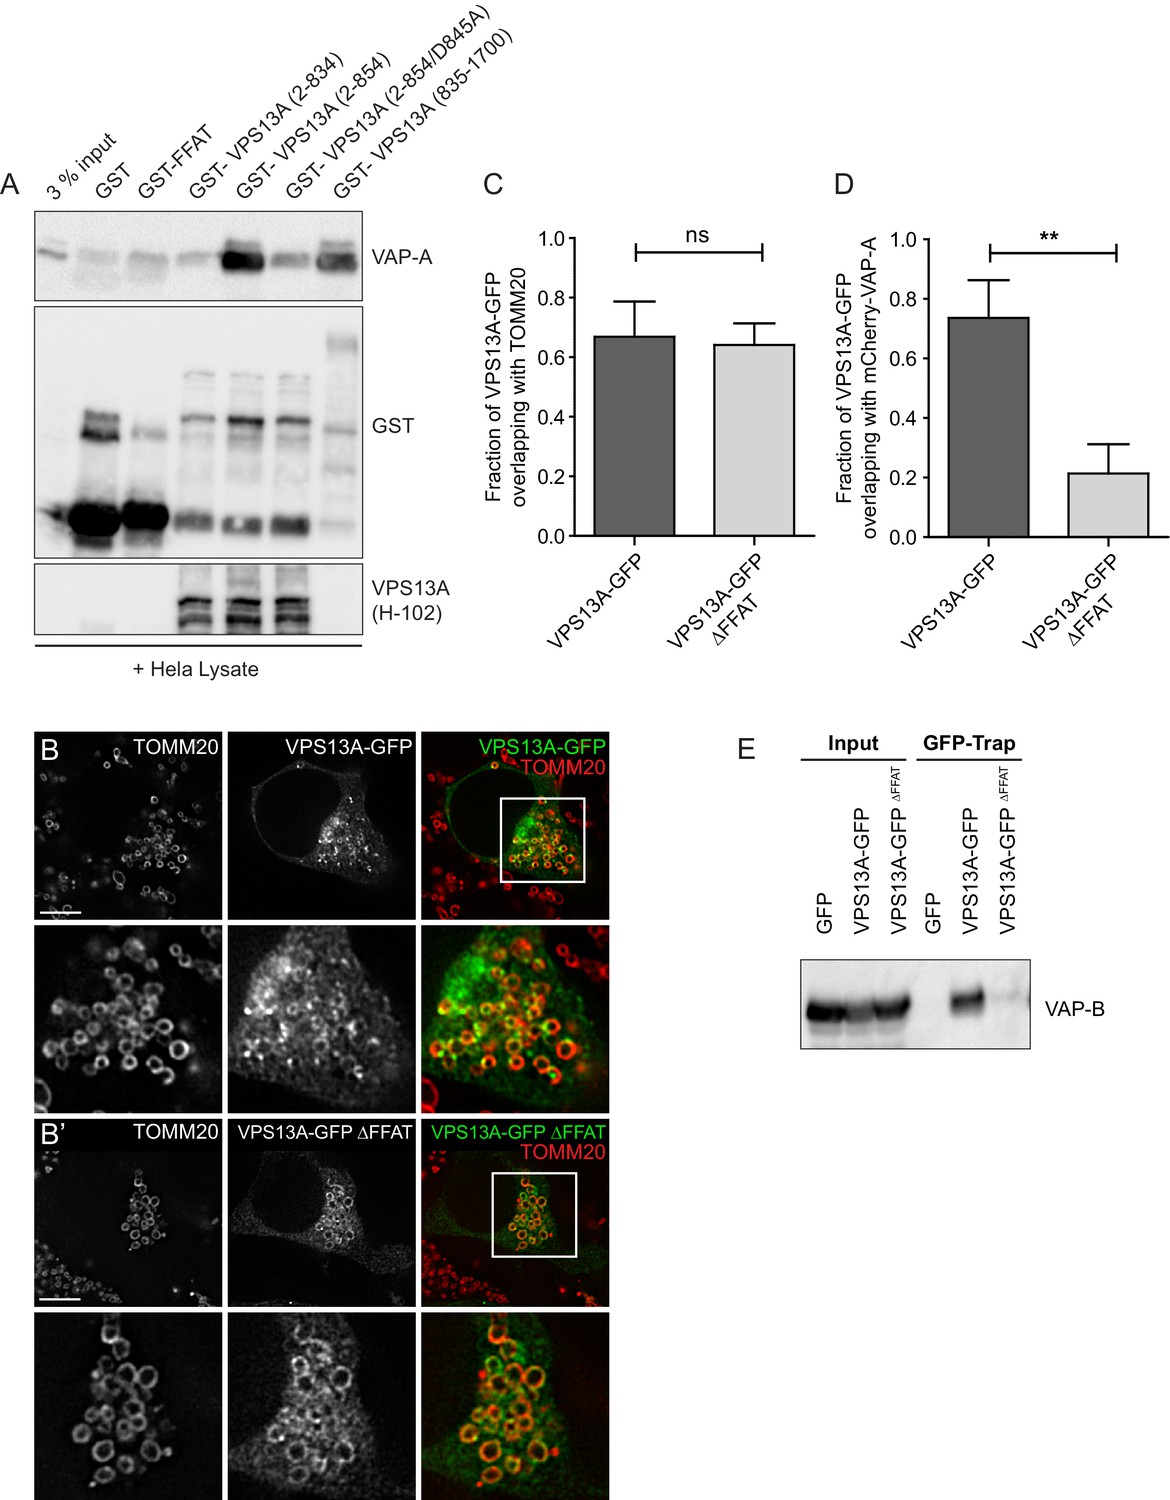
(A) GST-fusion proteins of VPS13A fragments expressed in E.Coli were enriched on Sepharose beads and incubated with equal amounts of HeLa cell lysate. GST alone was used as a control. Samples were immunoblotted against VAP-A, GST and N-terminal VPS13A (H-102). (B) Full length VPS13A-GFP (B) or VPS13A∆FFAT-GFP (B’) were expressed in HEK293T cells and mitochondria were marked using an antibody against TOMM20. The yellow signal in the overlay represents sites of close association between mitochondria and the VPS13A-GFP. Cells were co-transfected with BFP-Sec61 (not shown). (C) HEK293T cells were transfected with VPS13A-GFP or VPS13A∆FFAT-GFP and stained for TOMM20. The fraction of the GFP signal overlapping the TOMM20 signal was quantified with ImageJ using the JACoP plugin. (D) HEK293T cells were transfected with VPS13A-GFP or VPS13A∆FFAT-GFP and mCherry-VAP-A. The fraction of the GFP signal overlapping the mCherry signal was quantified with ImageJ using the JACoP plugin. Error bars (C, D), mean ±s.e.m (n = 3), two-tailed unpaired Student’s t-test was used (**p≤0.01). (E) Full length VPS13A-GFP, VPS13A∆FFAT-GFP or peGFP-C1 (as a control) were expressed in HEK293T cells and immunoprecipitated using a GFP-trap assay. Samples from Figure 4F were co-analysed for the presence of VAP-B. Scale bar = 10 µm (B/B’).
Figure 4—figure supplement 4

Scan of original blots for Figure 4—figure supplement 3.
https://doi.org/10.7554/eLife.43561.018
Figure 5 with 3 supplements
Depletetion of VPS13A results in less elongated mitochondria and impaired mitophagy.
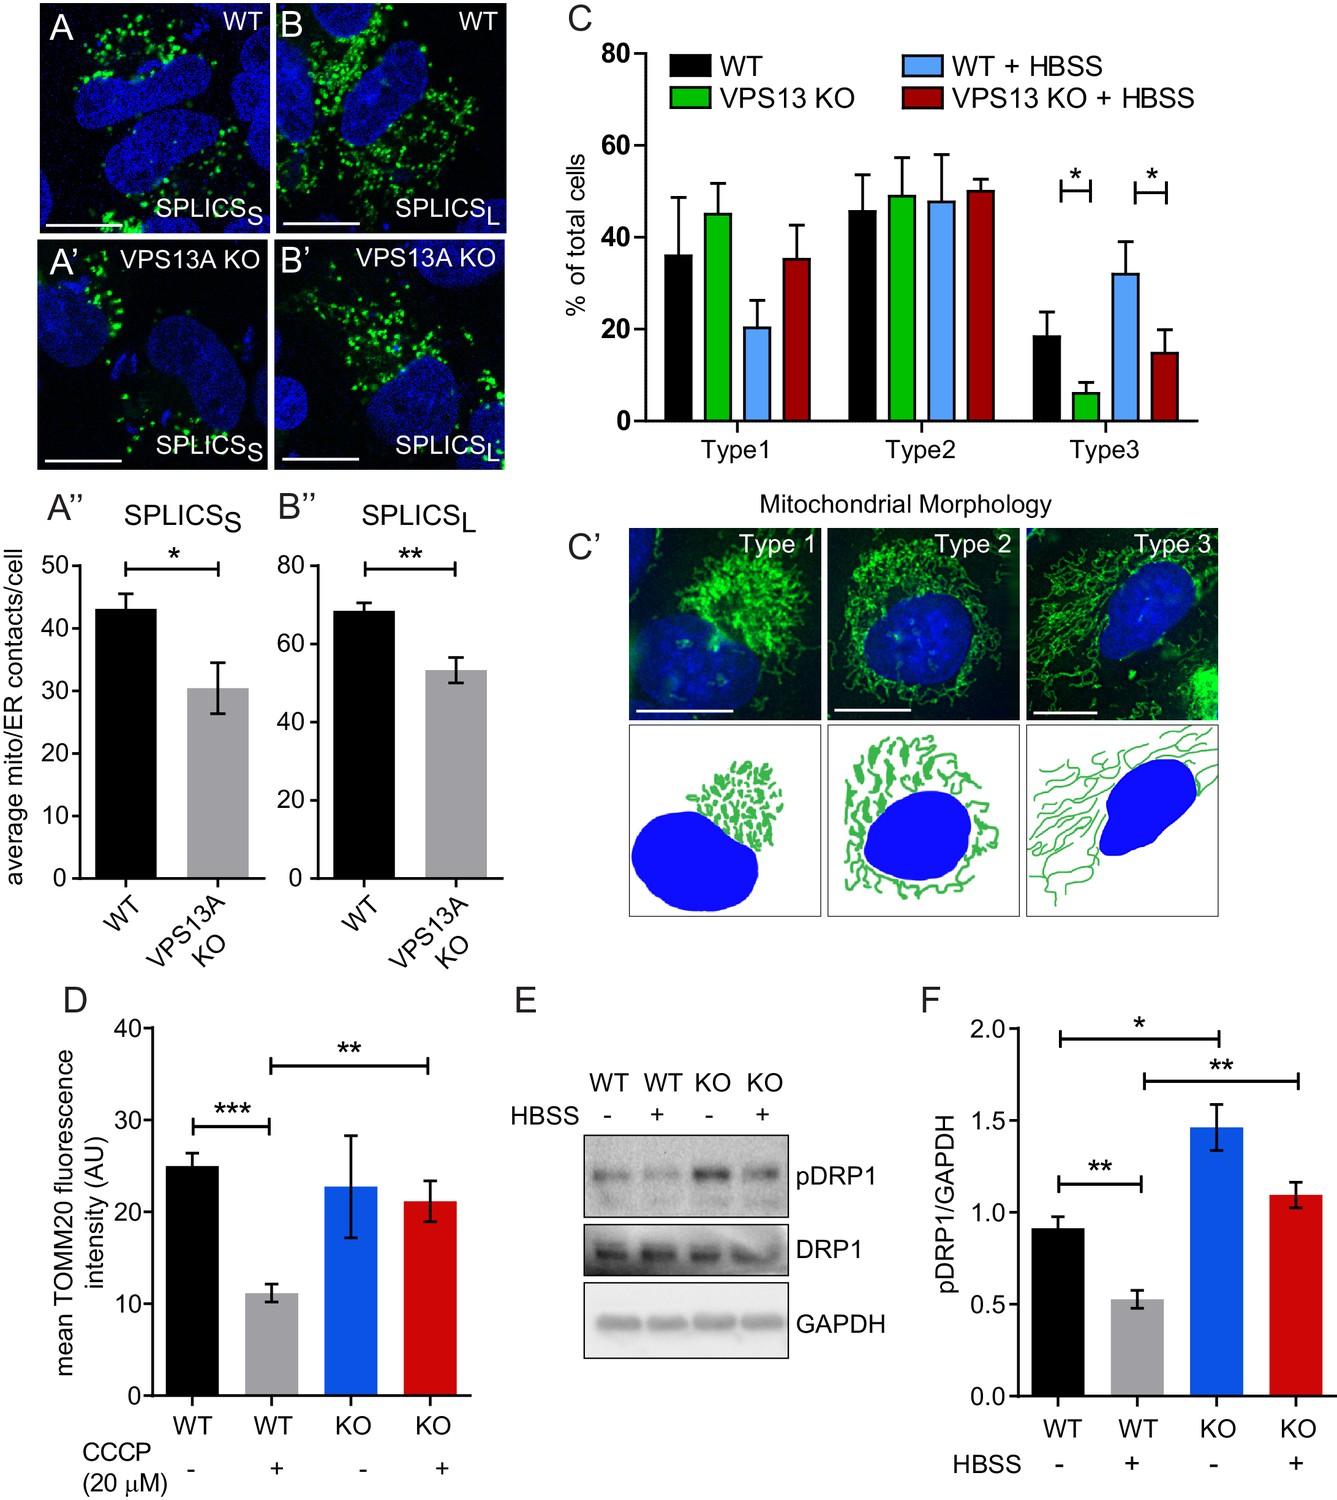
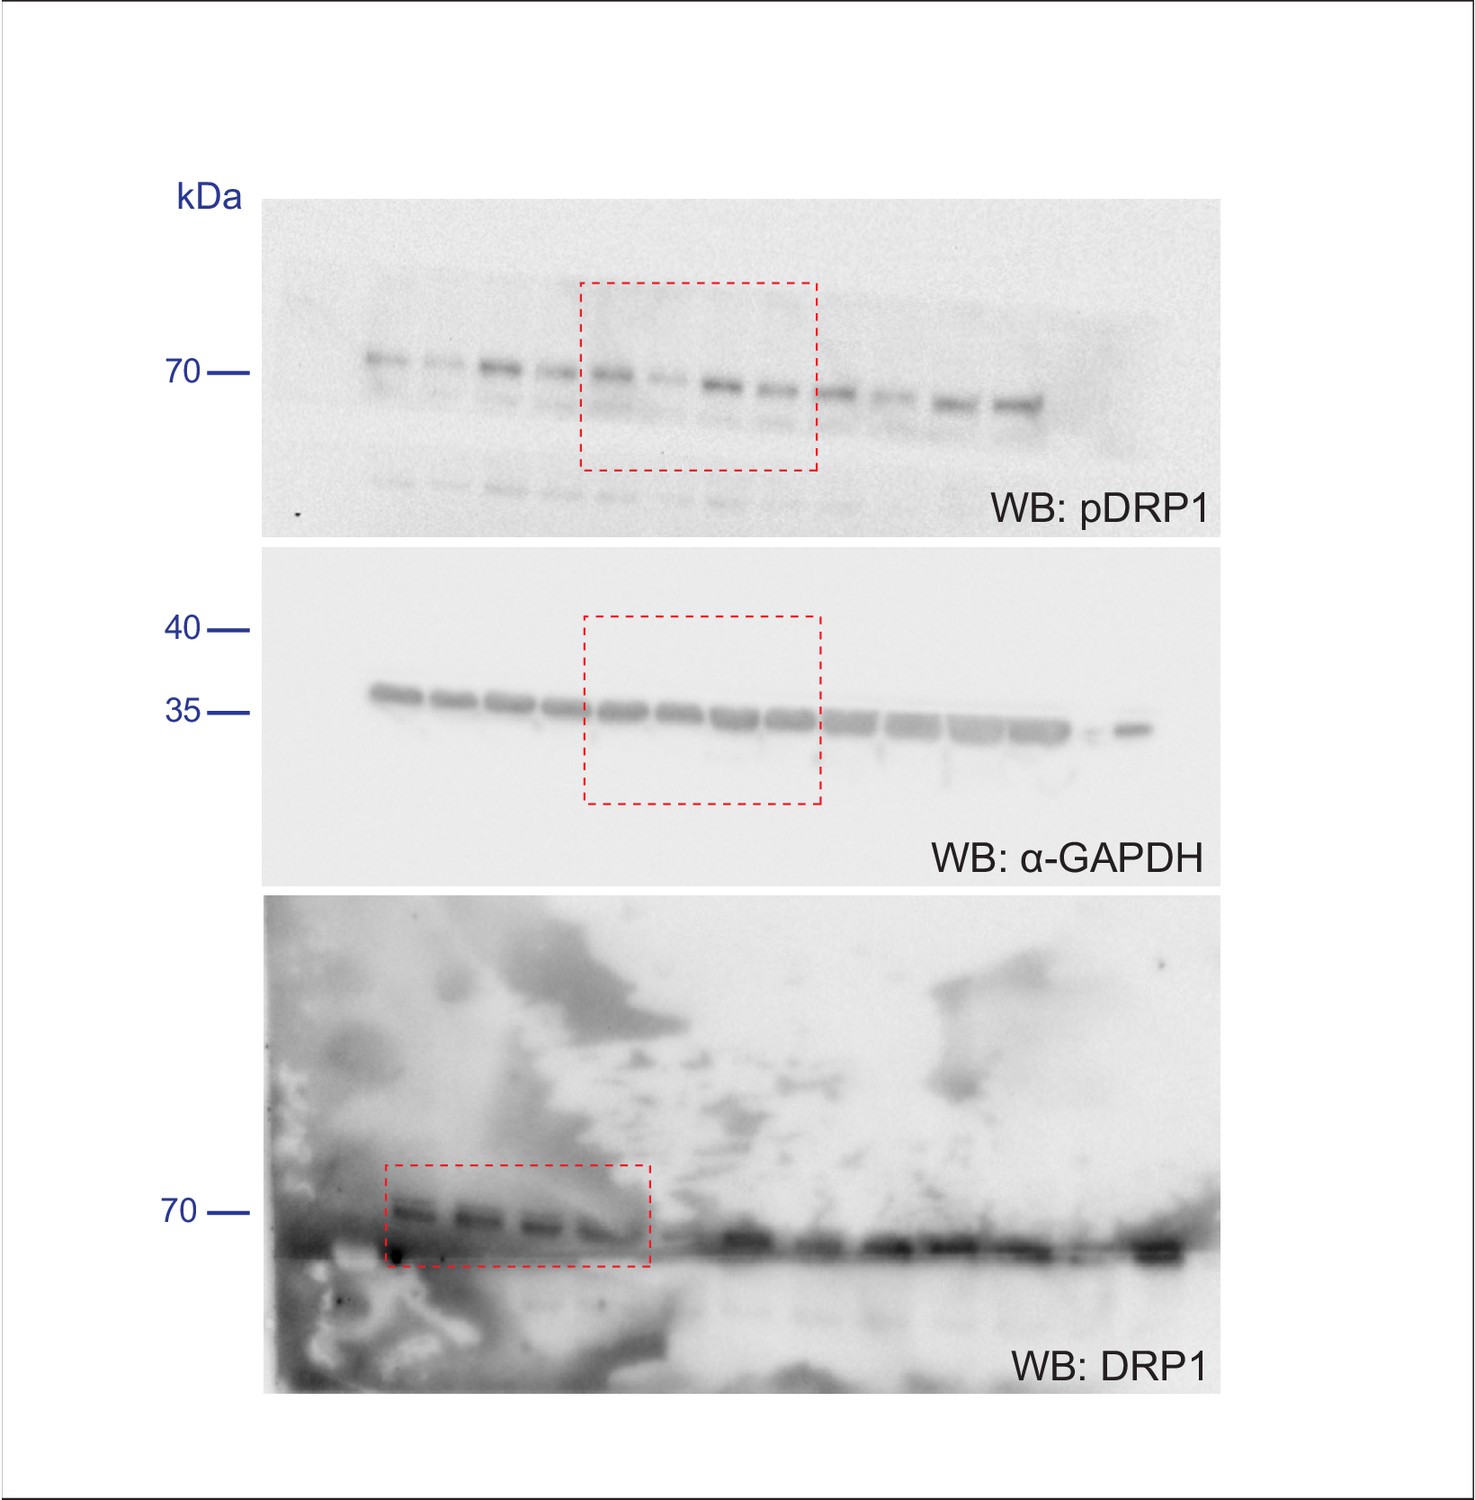
(A–B) Representative images of control MRC5 cells (WT) (A, B) and VPS13 KO MRC5 cells (A’, B’) transfected with SPLICSS (A, A’) or SPLICSL (B, B’) to detect narrow (~8–10 nm) or long (~40–50 nm) distance ER-mitochondria contact sites respectively. A’, B’. Quantification of narrow and long distance contact sites in WT and VPS13A KO MRC5 cells. Error bars, mean ±s.e.m (n = 3 (A”) and n = 5 (B”)), two-tailed unpaired Student’s t-test was used (*p≤0.05, **p≤0.01). (C) Quantification of the mitochondria morphology of cells cultured under normal conditions (control) or under starved conditions (HBSS). WT and VPS13A KO MRC5 cells, were stained for the mitochondria marker TOMM20 (red) and DAPI (blue). For the quantification three cell-types with different mitochondrial appearances were pre-defined, type 1 cells with short, fragmented, densely packed mitochondria, type 2 cells with a mixture of round densely packed and more tubulated and less densely packed mitochondria and type 3 cells with tubulated dispersed and long mitochondria. Typical images and schematics are provided(C’). Error bars, mean ±s.e.m (n = 3), two-tailed unpaired Student’s t-test was used (*p≤0.05). (D) Mitophagy assay of control MRC5 (WT) and VPSA13 KO cells. The cells were transfected with FLAG-Parkin, which allows for the removal of damaged mitochondria and were treated with DMSO (control) or 20 µM CCCP (inducing mitochondria damage). After the transfection/treatment the cells were stained for the mitochondria marker TOMM20 and the mean fluorescence TOMM20 intensity was measured exclusively in FLAG-Parkin positive cells. The decrease in TOMM20 fluorescence after CCCP represents mitophagy. Error bars, mean ±s.e.m (n = 3), two-tailed unpaired Student’s t-test was used (**p≤0.01, ***p≤0.001). (E,F) In control and starved (HBSS) MRC5 WT and VPS13A KO cells levels of pDRP1 and total DRP1 were determined by immunoblotting using GAPDH as a loading control (E). Quantification of protein band intensities in F was performed using ImageJ and plotted as a ratio of pDRP to GAPDH (F). Error bars, mean ±s.e.m (n = 3), two-tailed unpaired Student’s t-test was used (*p≤0.05, **p≤0.01, ***p≤0.001). Scale bars = 10 μm (A, A’, B, B’, C’).
Figure 5—figure supplement 1
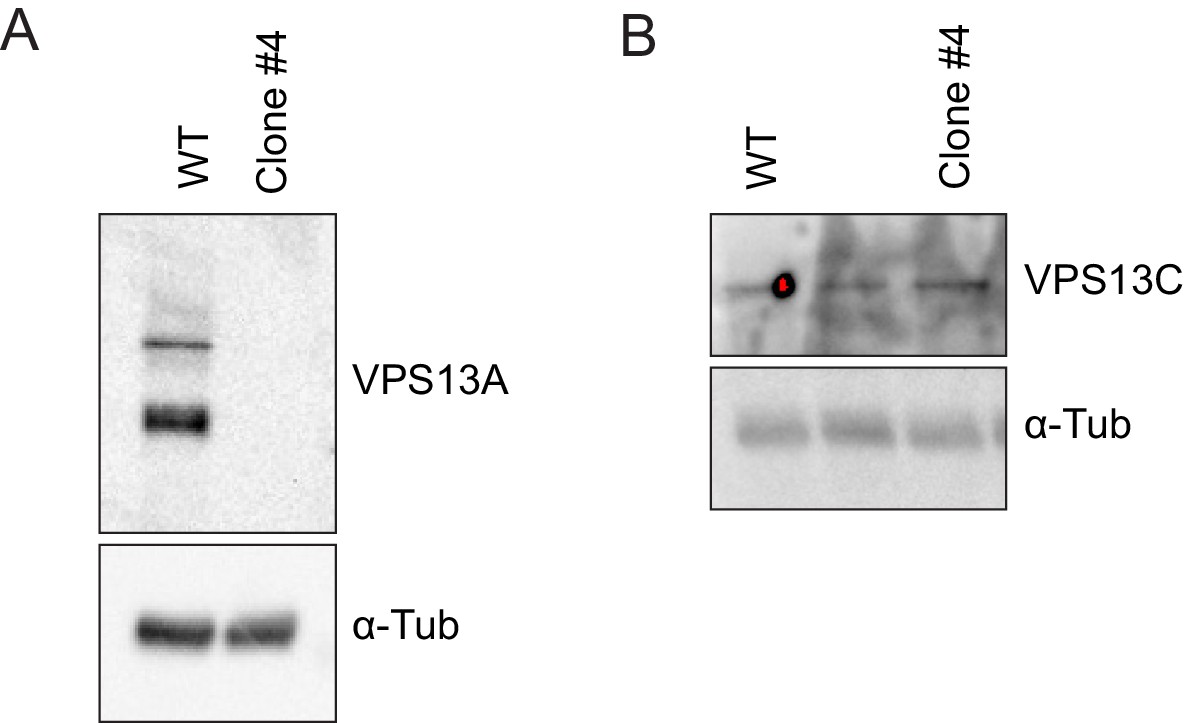
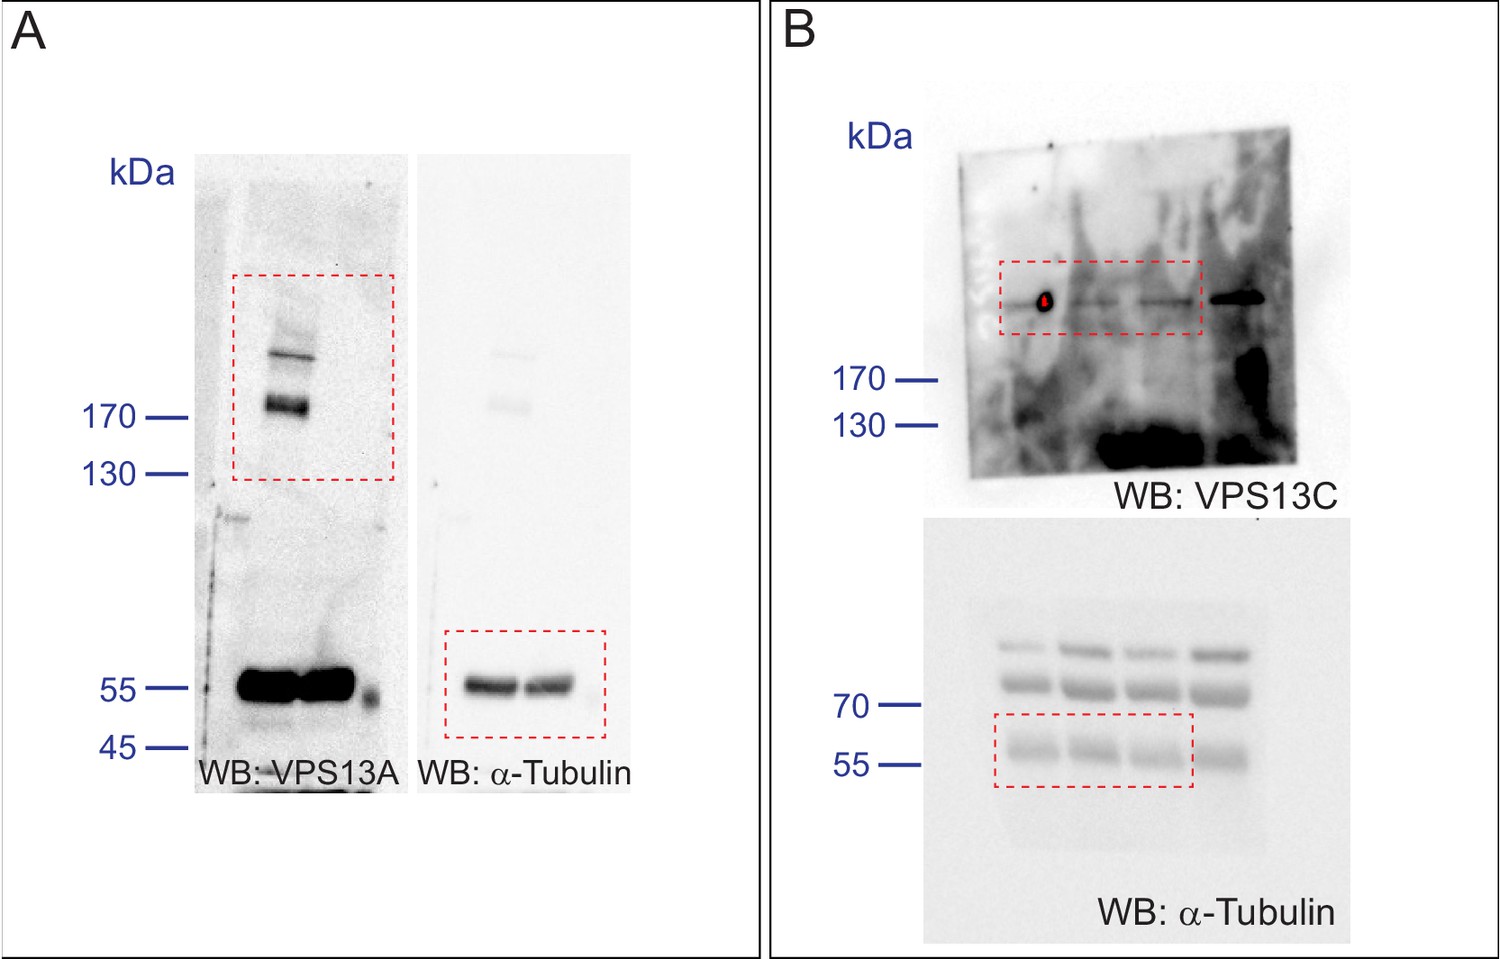
Validation of the VPS13A mutant cell line (VPS13A KO).
(A, B) Control (WT) and VPS13A KO MRC5 cells were analysed by Western blot analysis for the presence or absence of VPS13A (A) and VPS13C (B). α-Tubulin was used as a control.
Figure 5—figure supplement 2
Scan of original blots for Figure 5—figure supplement 1.
https://doi.org/10.7554/eLife.43561.021
Figure 5—figure supplement 3
Scan of original blots for Figure 5.
https://doi.org/10.7554/eLife.43561.022
Figure 6 with 1 supplement
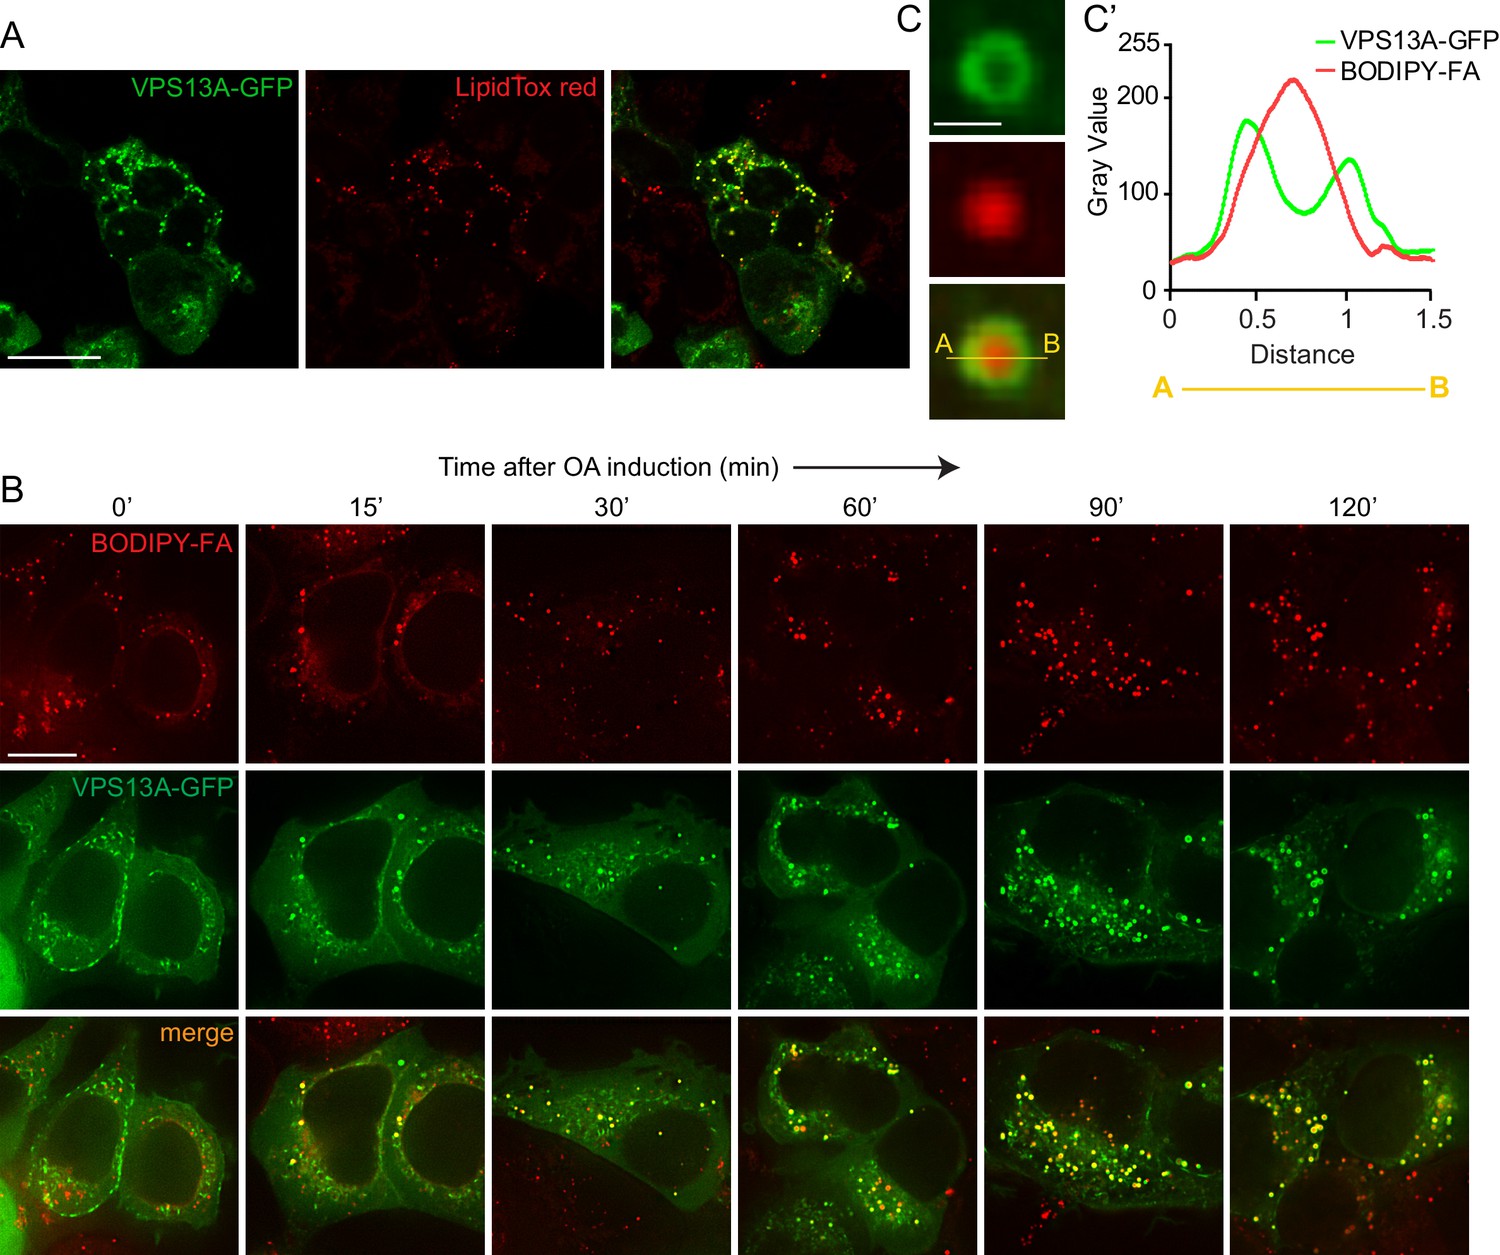
VPS13A decorates Lipid droplets.
(A) HEK293T cells were transfected with VPS13A-GFP for 24 hr and Lipidtox red was used as a marker for LDs. (B) HEK293T cells transfected with VPS13A-GFP for 48 hr were pulsed with 1 μM BODIPY-FA (red) at 37°C for 30 min followed by a chase in medium containing 500 uM OA for 2 hr at 37°C. (C) A close-up image of a LD in a cell taken from B in vivo is shown. Line profile analysis across the LD showed the enrichment of the VPS13A-GFP signal on the periphery of the LD (C’). Scale bar = 1 μm. Scale bars = 10 μm (A, B) and 1 μm (C).
Figure 6—figure supplement 1
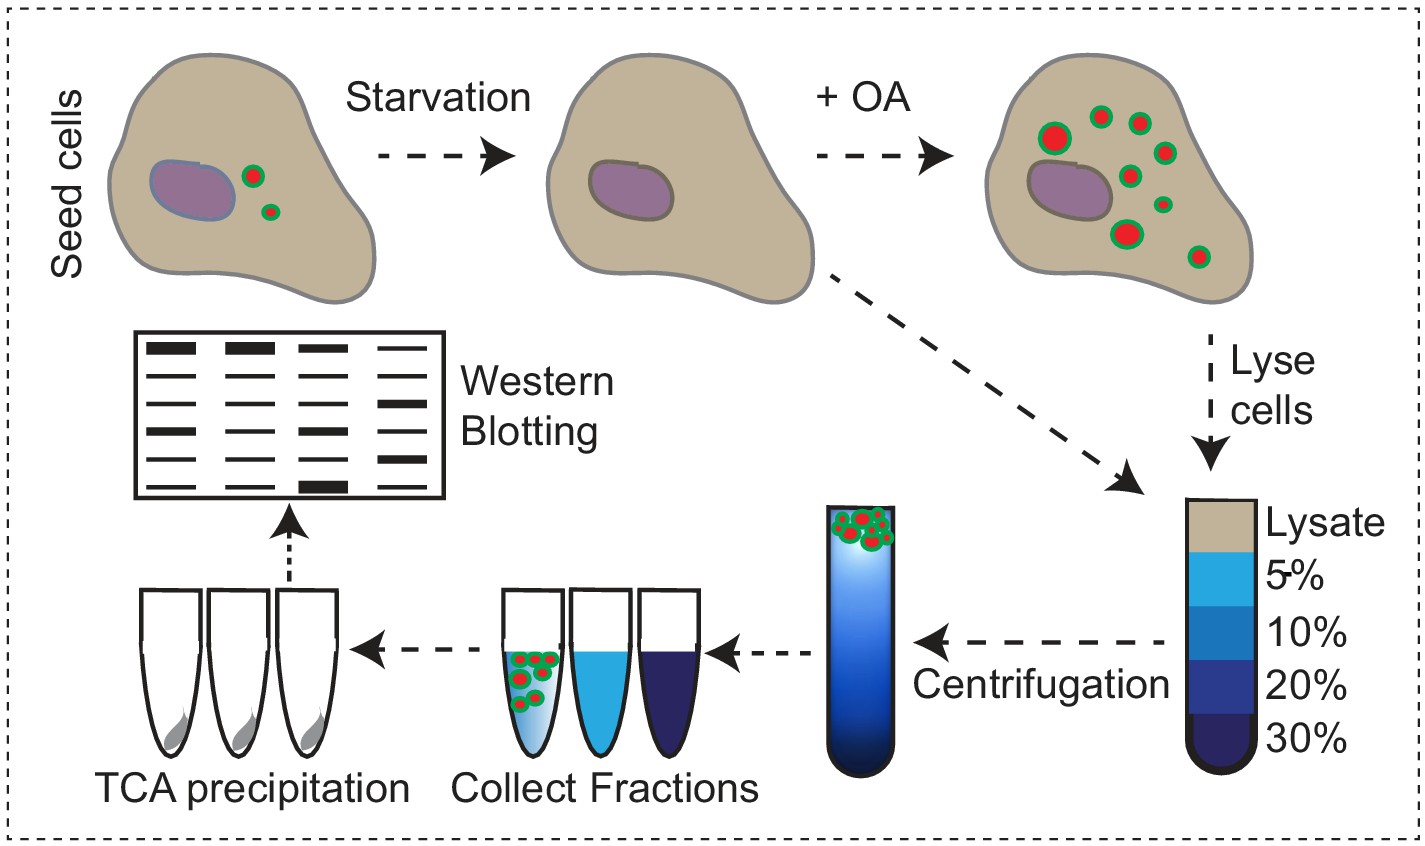
Endogenous VPS13A is enriched at fractions containing LDs upon OA induction Workflow of LDs isolation and sucrose gradient fractionation.
FBS starved HeLa cells were processed or were subsequently incubated for 24 hr with 500 µM OA in FBS free medium, lysed and fractionated in 5–30% sucrose density gradients. Proteins in collected fractions were concentrated by TCA precipitation and subsequently separated by SDS- PAGE.
Figure 7 with 4 supplements
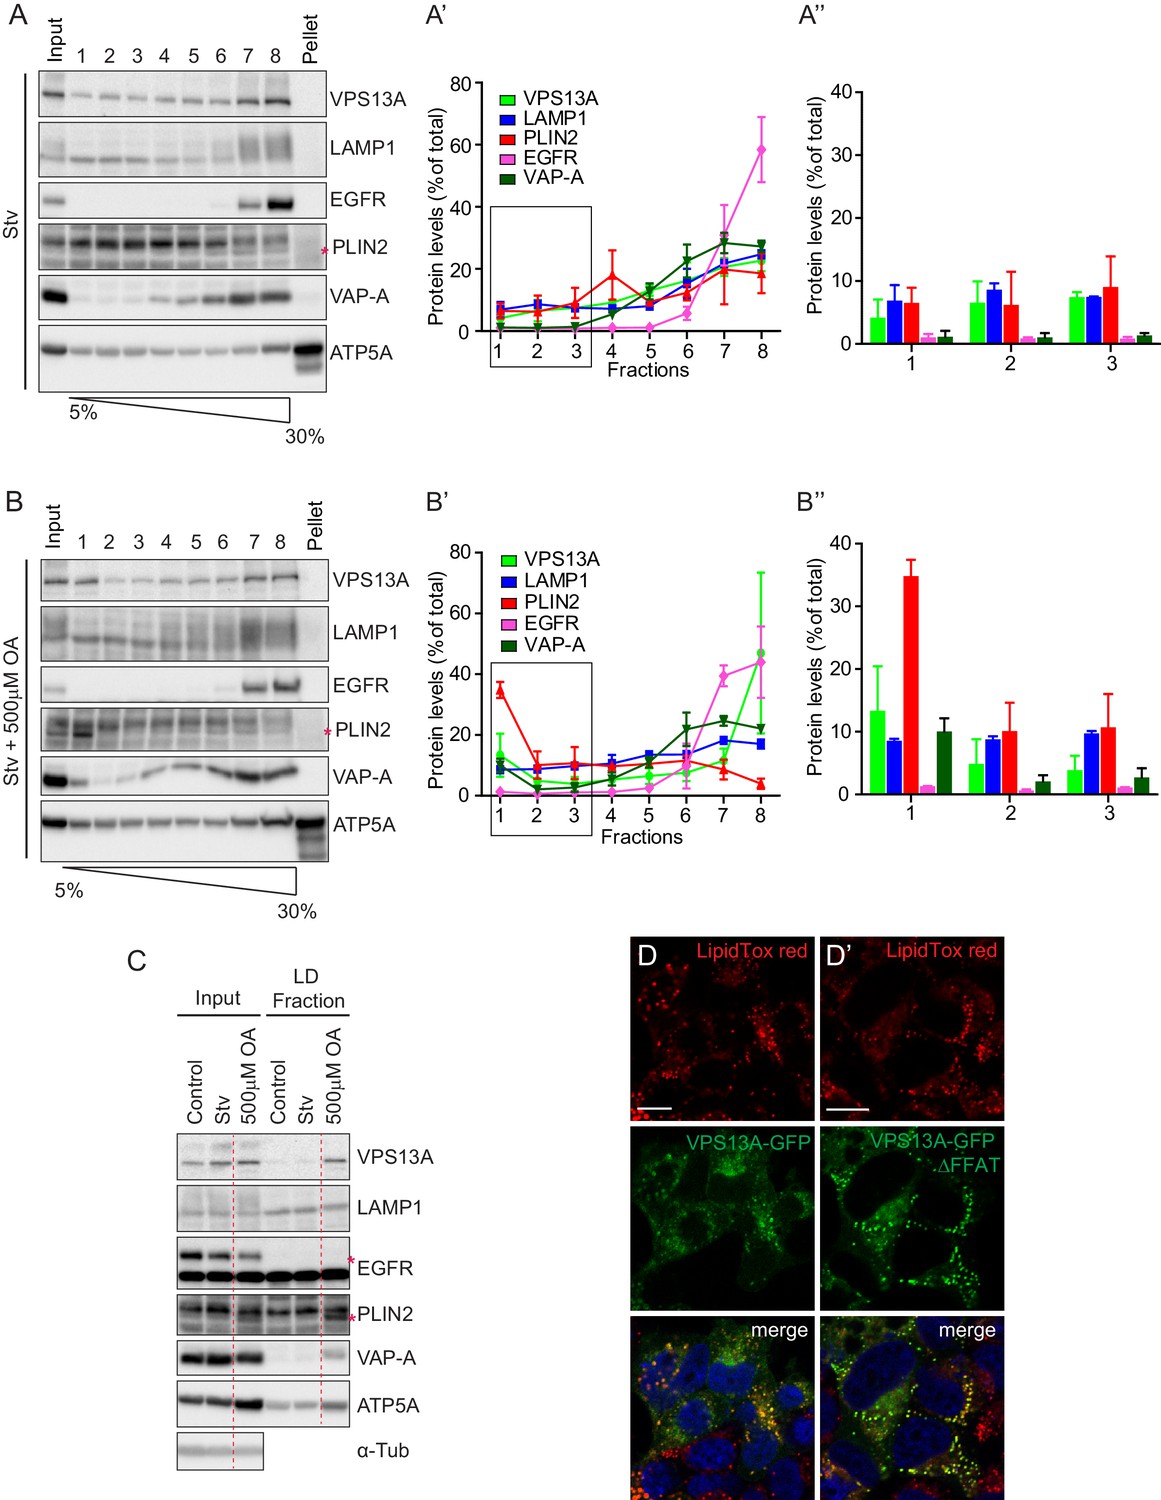
Endogenous VPS13A is enriched in LDs containing fractions.
(A) FBS starved HeLa cells were processed as described in Figure 6—figure supplement 1. Fractions with equal amounts of proteins were processed for Western blot analysis and specific protein levels were detected using antibodies for VPS13A, LAMP1, EGFR, PLIN2, VAP-A and ATP5A. Quantification of protein band intensities in A was performed using ImageJ and plotted as percentage of the total (A’). A’ shows a close-up of values of the top three light sucrose density fractions of A. In A’and A’, error bars, mean ±s.e.m (n = 3). (B) FBS starved Hela cells were incubated with 500 μM OA and processed as described under A and as in Figure 6—figure supplement 1. Quantification of protein band intensities in B was performed using ImageJ and plotted as percentage of the total (B’). B’ shows a close-up of values of the top three lowest sucrose density fractions. In B’and B’, error bars, mean ±s.e.m (n = 3). (C) HeLa cells were either grown in complete medium (Control), FBS starved (Stv, as in A) or further incubated with 500 μM OA and processed as described in Figure 6—figure supplement 1. LDs were isolated from the top fraction. Equal amounts of proteins were resolved by Western Blot and detected using antibodies for VPS13A, LAMP1, EGFR, PLIN2, VAP-A, ATP5A and α-Tubulin. Specific bands are indicated with an asterisks D) Representative single stack image of HEK293T cells expressing VPS13A-GFP (D) or VPS13A-GFP Δ FFAT (D’). Cells were incubated with 500 μM OA for 3 hr. LDs stained with LipidTox red. Scale bar = 10 μm (D).
Figure 7—figure supplement 1

Scan of original blots for Figure 7.
https://doi.org/10.7554/eLife.43561.026
Figure 7—figure supplement 2
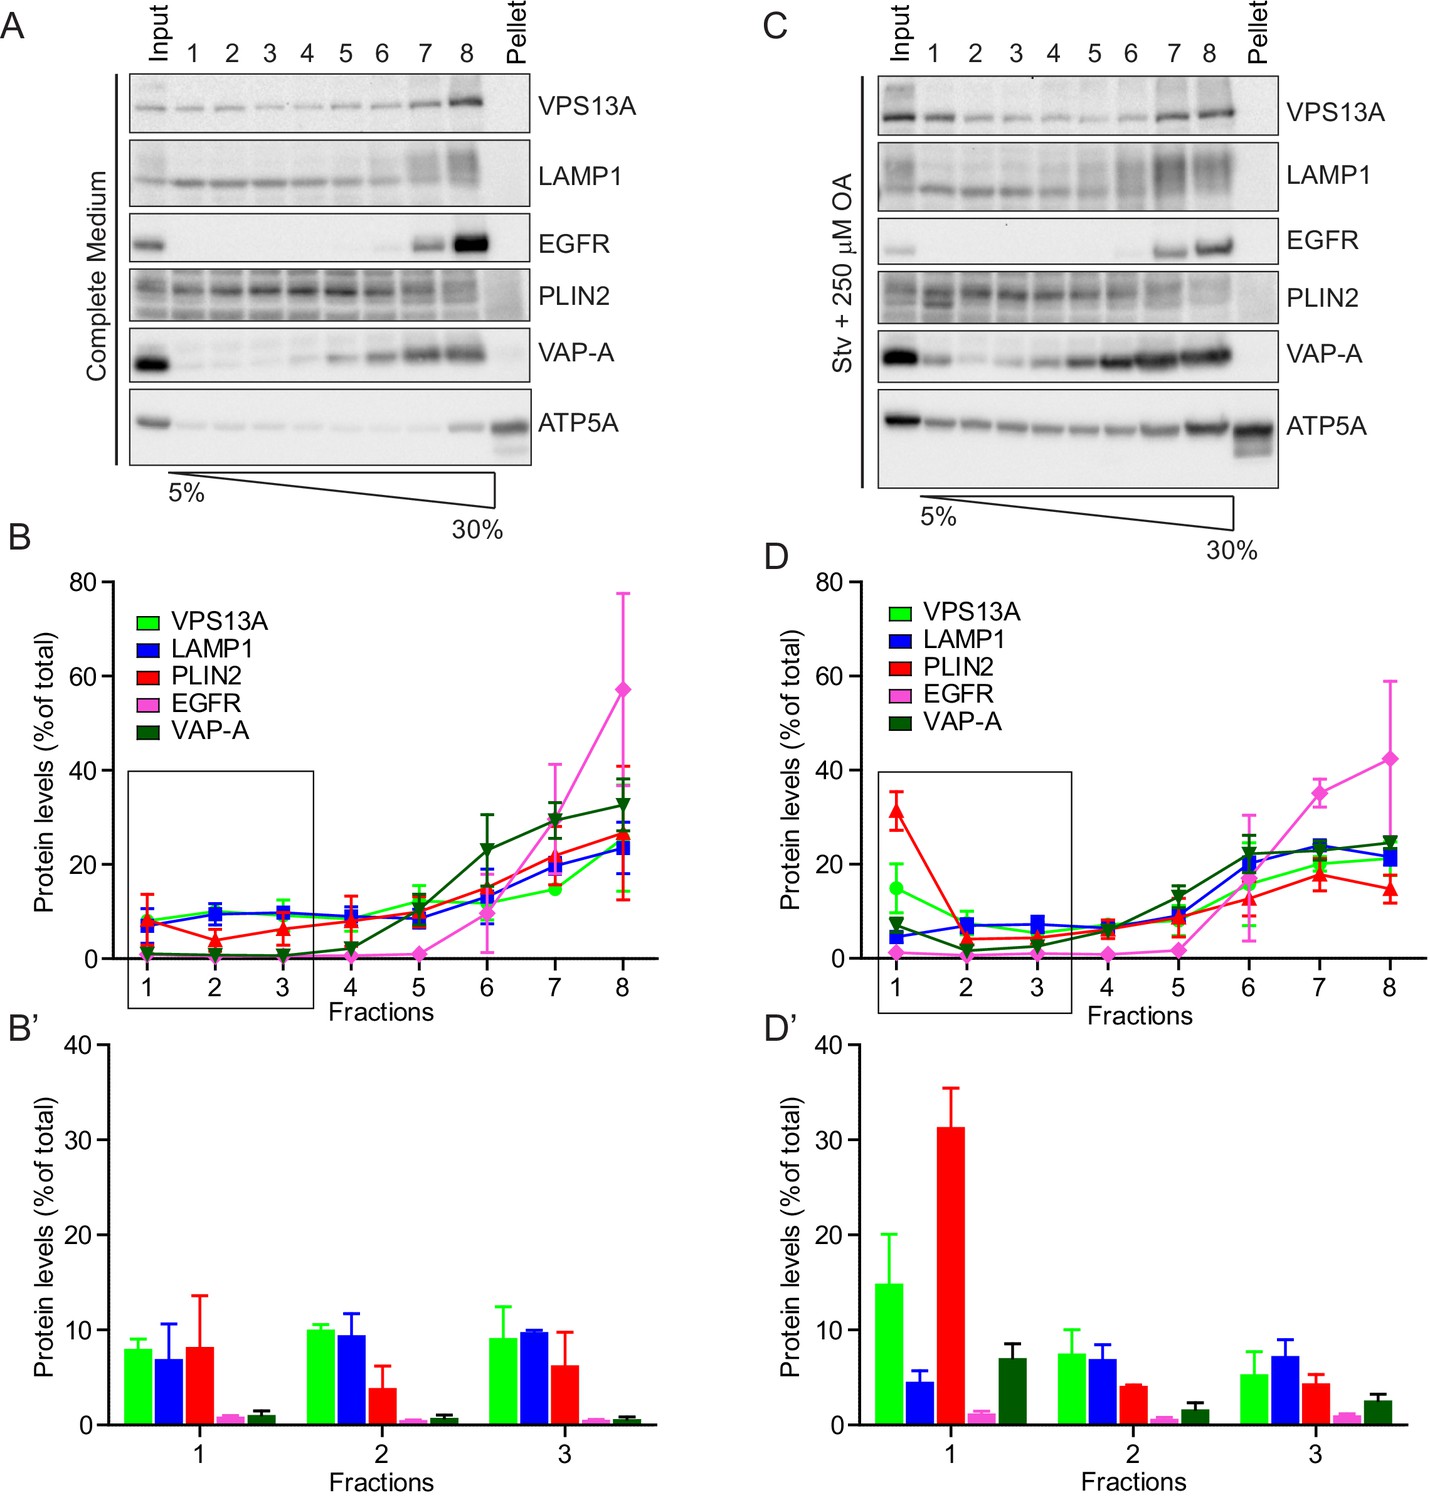
Endogenous VPS13A is enriched at fractions containing LDs upon OA induction.
(A) HeLa cells grown in complete medium were fractionated on sucrose gradient and processed as described in Figure 6. Equal amounts of proteins were detected by immunoblotting for VPS13A, LAMP1, EGFR, PLIN2, VAP-A and ATP5A. (B) Quantification of protein band intensities in C was performed using ImageJ and plotted as percentage of the total. B’ shows a close-up of the values of the top three fractions. Error bars, mean ±s.e.m (n = 3) (C) FBS starved HeLa cells were further incubated with 250 µM OA and processed as described in A. Equal amounts of proteins were processed for Western blot analysis using antibodies for VPS13A, LAMP1, EGFR, PLIN2, VAP-A and ATP5A. (D) Quantification of protein band intensities in E was performed using ImageJ and plotted as percentage of the total. D’ shows a close up of the values of the top three fractions. In B, D and F error bars, mean ±s.e.m (n = 3).
Figure 7—figure supplement 3
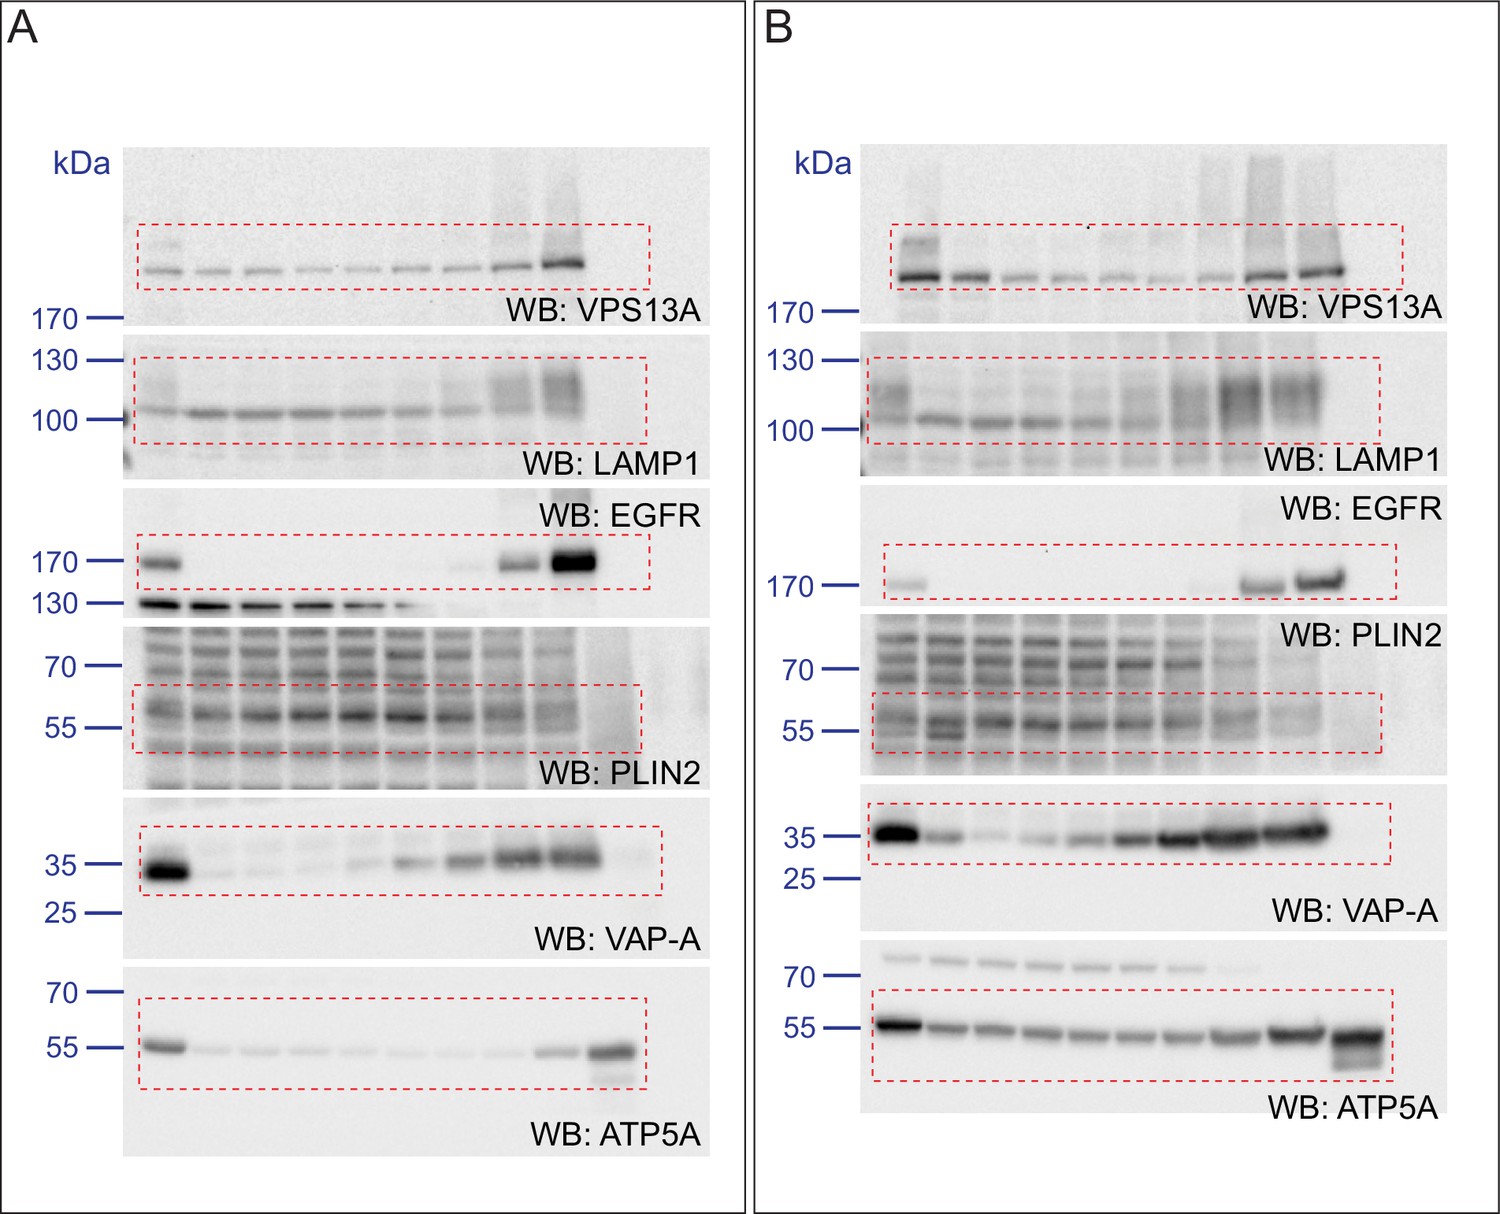
Scan of original blots for Figure 7—figure supplement 2.
https://doi.org/10.7554/eLife.43561.028
Figure 7—figure supplement 4
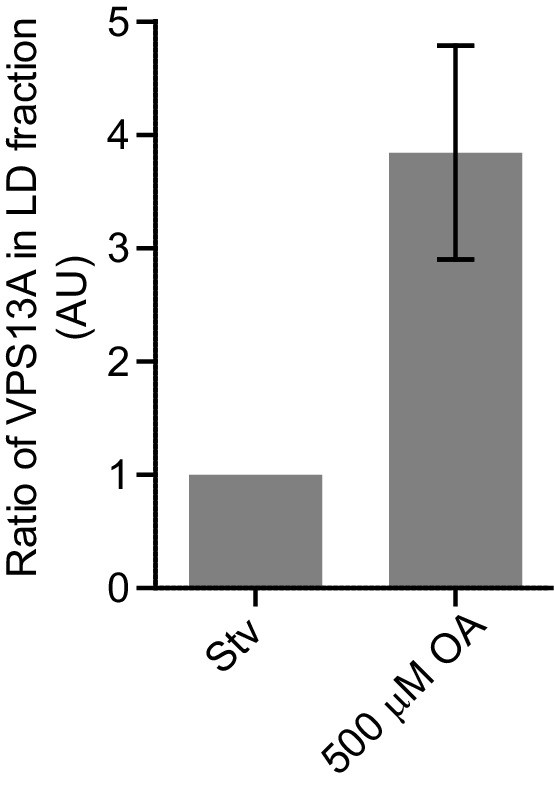
Endogenous VPS13A is enriched at fractions containing LDs upon OA induction.
Ratio of VPS13A in the LD fraction in starved (Stv) (Figure 7A) and OA fed cells (Figure 7B). The amount of VPS13A Stv is set to 1.
Figure 8
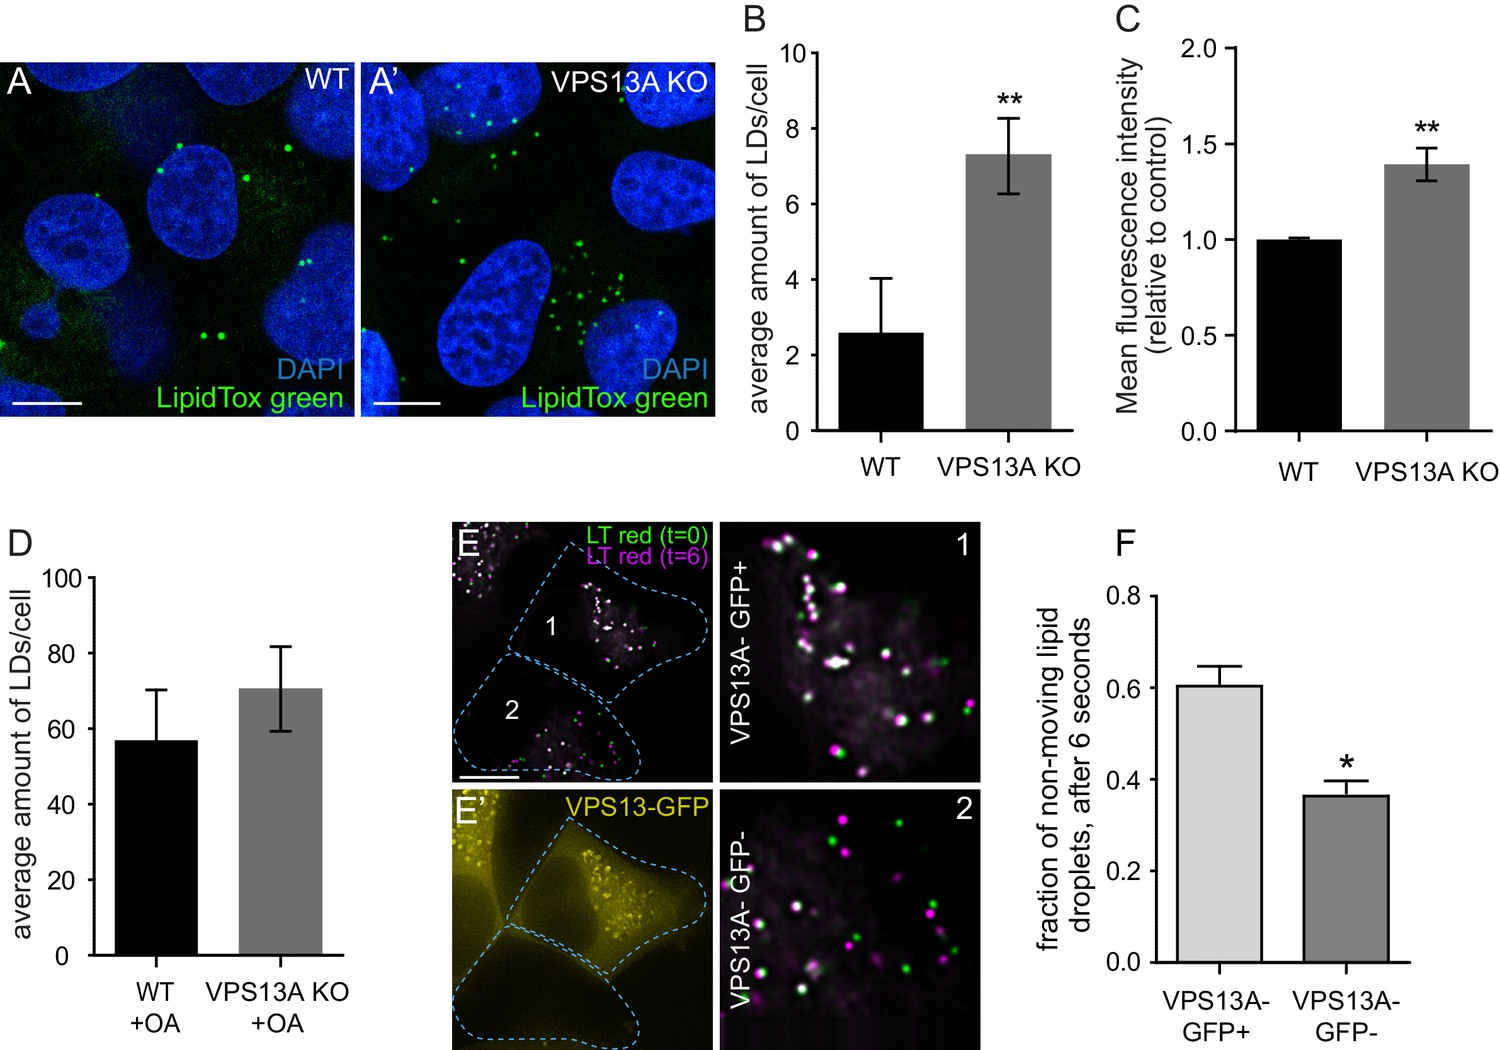
VPS13A negatively regulates LD mobility.
(A) WT (A) and VPS13A KO MRC5 cells (A’) were stained with LipidTox green for LDs (green) and the nuclear marker DAPI (blue) and imaged by confocal microscopy. (B) Quantification of LD numbers in A. Error bars, mean ±s.e.m (n = 3), two-tailed unpaired Student’s t-test was used (*p≤0.05, **p≤0.01). (C) WT and VPS13A KO MRC5 cells were stained with Nile red and intensity was measured using FACS. Error bars, mean ±s.e.m (n = 3), two-tailed unpaired Student’s t-test was used (*p≤0.05, **p≤0.01). (D) WT and VPS13A KO MRC5 cells were exposed to 500 µM OA for 16 hr. Afterwards cells were stained with LipidTox green to visualize LDs and LD numbers were quantified. Error bars, mean ±s.e.m (n = 3), two-tailed unpaired Student’s t-test was used. (E) HEK293T cells were transfected with VPS13A-GFP and stained with LipidTox red to visualize LDs in vivo. Images with a time interval of 6 s were recorded of VPS13-GFP positive (cell 1) and adjacent VPS13-GFP negative (cell 2) cells. The locations of LDs at t = 0 are indicated in green, the locations of the same LDs at t = 6 s are indicated in magenta (E). If the LD did not move between time frames, the overlapping signal (green and magenta) is white. The VPS13A signal is shown in E’: Cell one is transfected with VPS13A-GFP; Cell two is a non-transfected cell. (F) Quantification of the fraction of non-moving (white) LDs compared to the total number of LDs in VPS13A-GFP positive or VPS13A-GFP negative cells. Error bars, mean ±s.e.m, two tailed unpaired Student’s t-test was used (*p≤0.05). Scale bars = 10 µm (A, A’, E,).
Figure 9 with 1 supplement
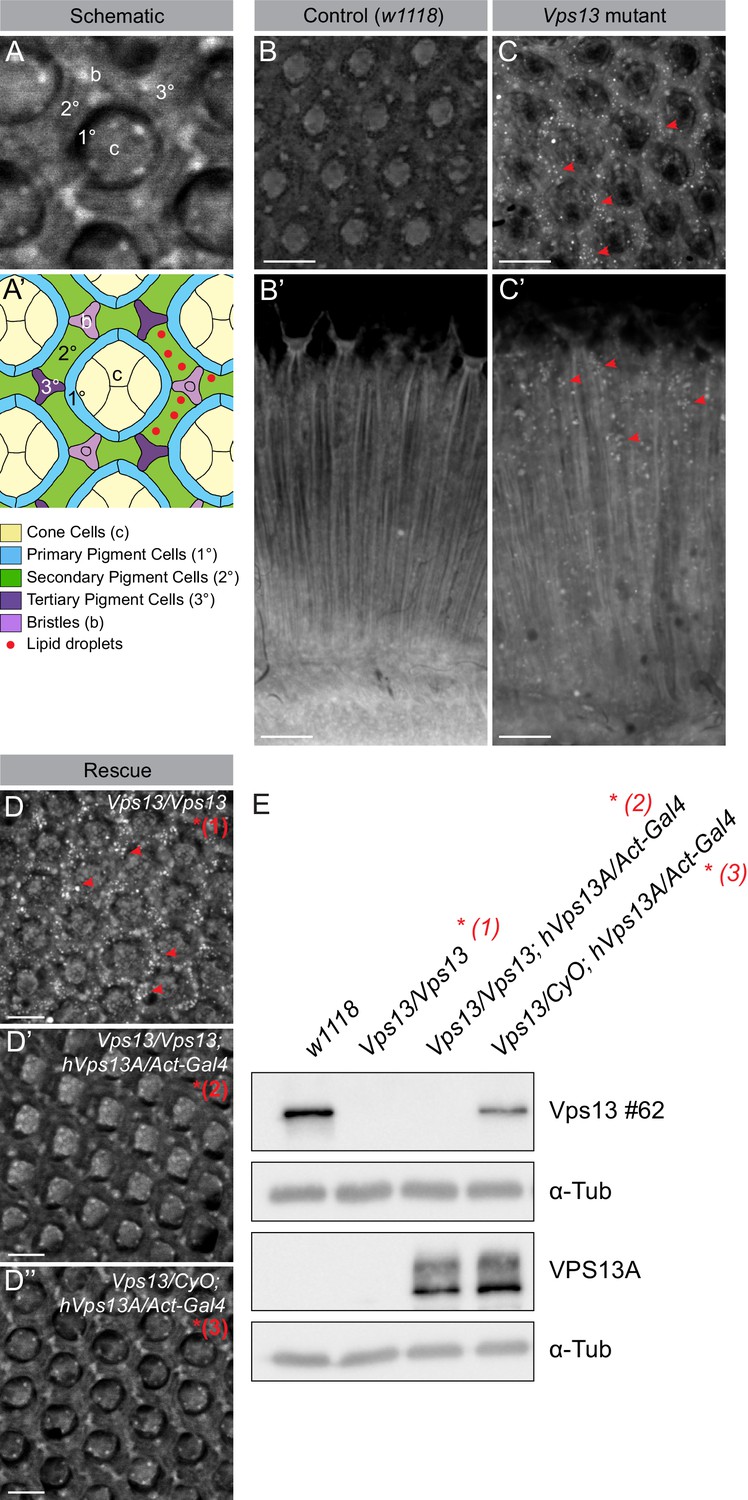
Vps13A mutants show a lipid droplet phenotype in the Drosophila adult eye, which can be rescued by ectopic expression of the human VPS13A.
(A) Optical section (A) and schematic (A’) of a Drosophila adult ommatidium, taken at the height of the cone cells (Ready, 1989). Cone cells (c), pigment cells (1°, 2°, 3°) and bristles (b) are indicated in different colors. Naturally occurring or (in mutants) ectopically accumulating LDs (red circles) are found in the pigment cells (Liu et al., 2015; Liu et al., 2017). (B,C) Optical cross-section and longitudinal section through the adult eye of Drosophila control (B/B’) and Vps13 homozygous mutant flies (C/C’) at day 5 past eclosion. Nile Red was used to reveal the presence of LDs (red arrow heads) in the pigment cells. (D) Optical cross-sections through the adult eye of Vps13 homozygous mutant flies, control flies and Vps13 homozygous mutant flies expressing human VPS13A at day 3 after eclosion. Nile Red was used to detect LDs. D:Vps13/Vps13, (=Vps13 homozygous mutant). D’: Vps13/Vps13;hVPS13A/Act-Gal4 (=Vps13 homozygous mutant expressing human VPS13A). D’: Vps13/+;UAS-hVPS13A/Act-Gal4 (heterozygous for Vps13 expressing human VPS13A). (E) Western blot to demonstrate the absence of Drosophila Vps13 in mutant flies and the expression of human VPS13A in the rescued Drosophila Vps13 mutant background. Samples marked with a red asterisk were used for the Nile Red staining in the rescue experiment (D–D’’). Scale bars = 10 μm (B–D).
Figure 9—figure supplement 1
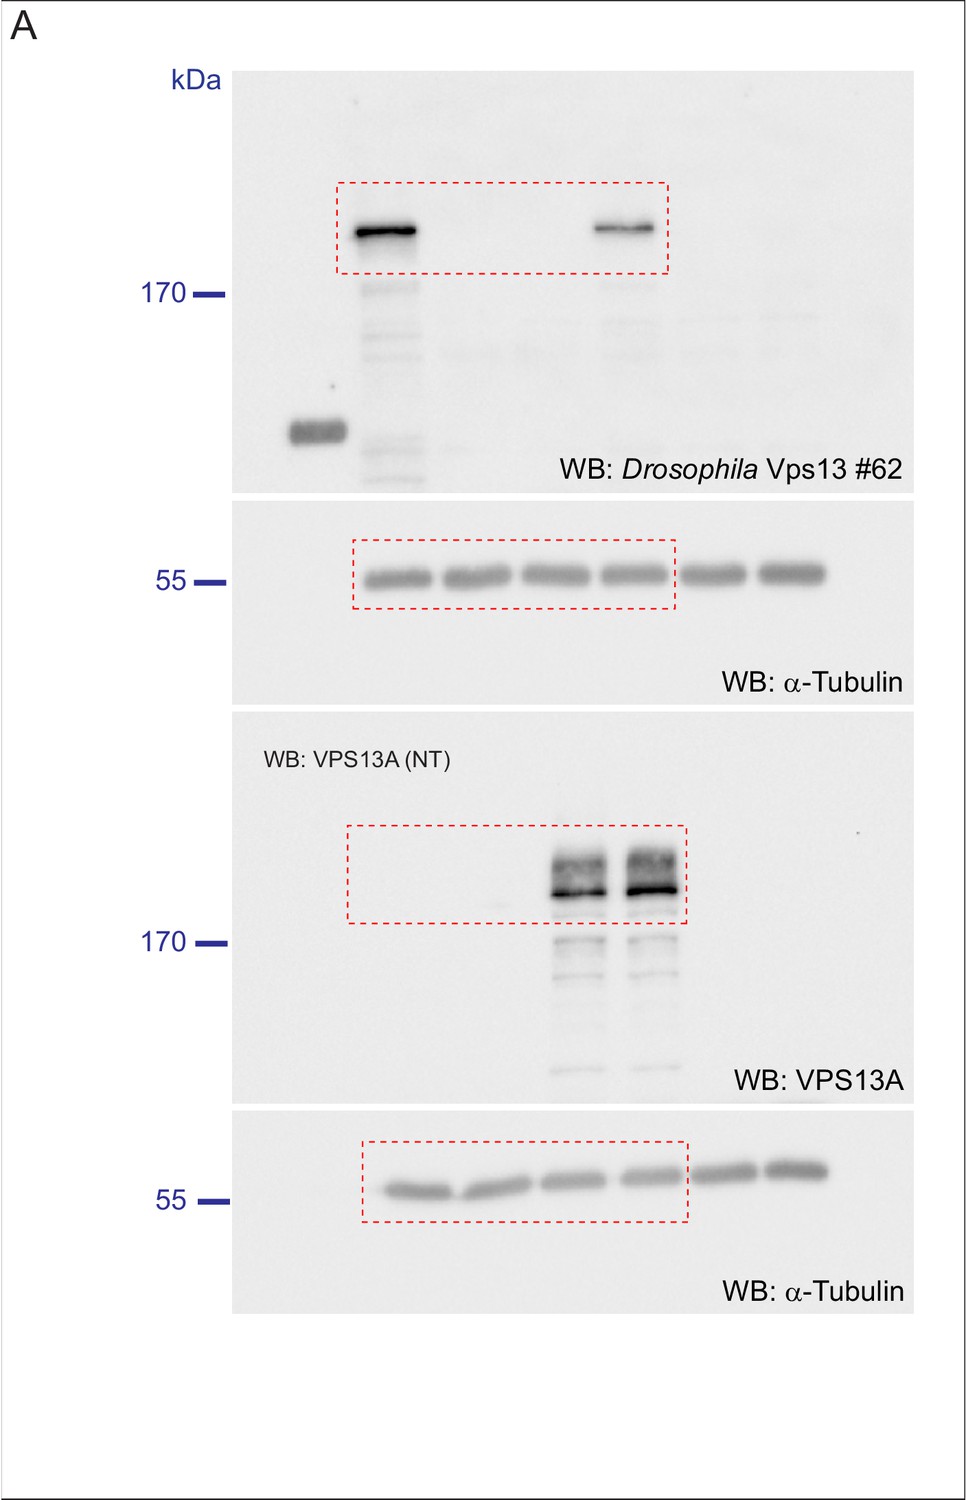
Scan of original blots for Figure 9.
https://doi.org/10.7554/eLife.43561.033
Figure 10
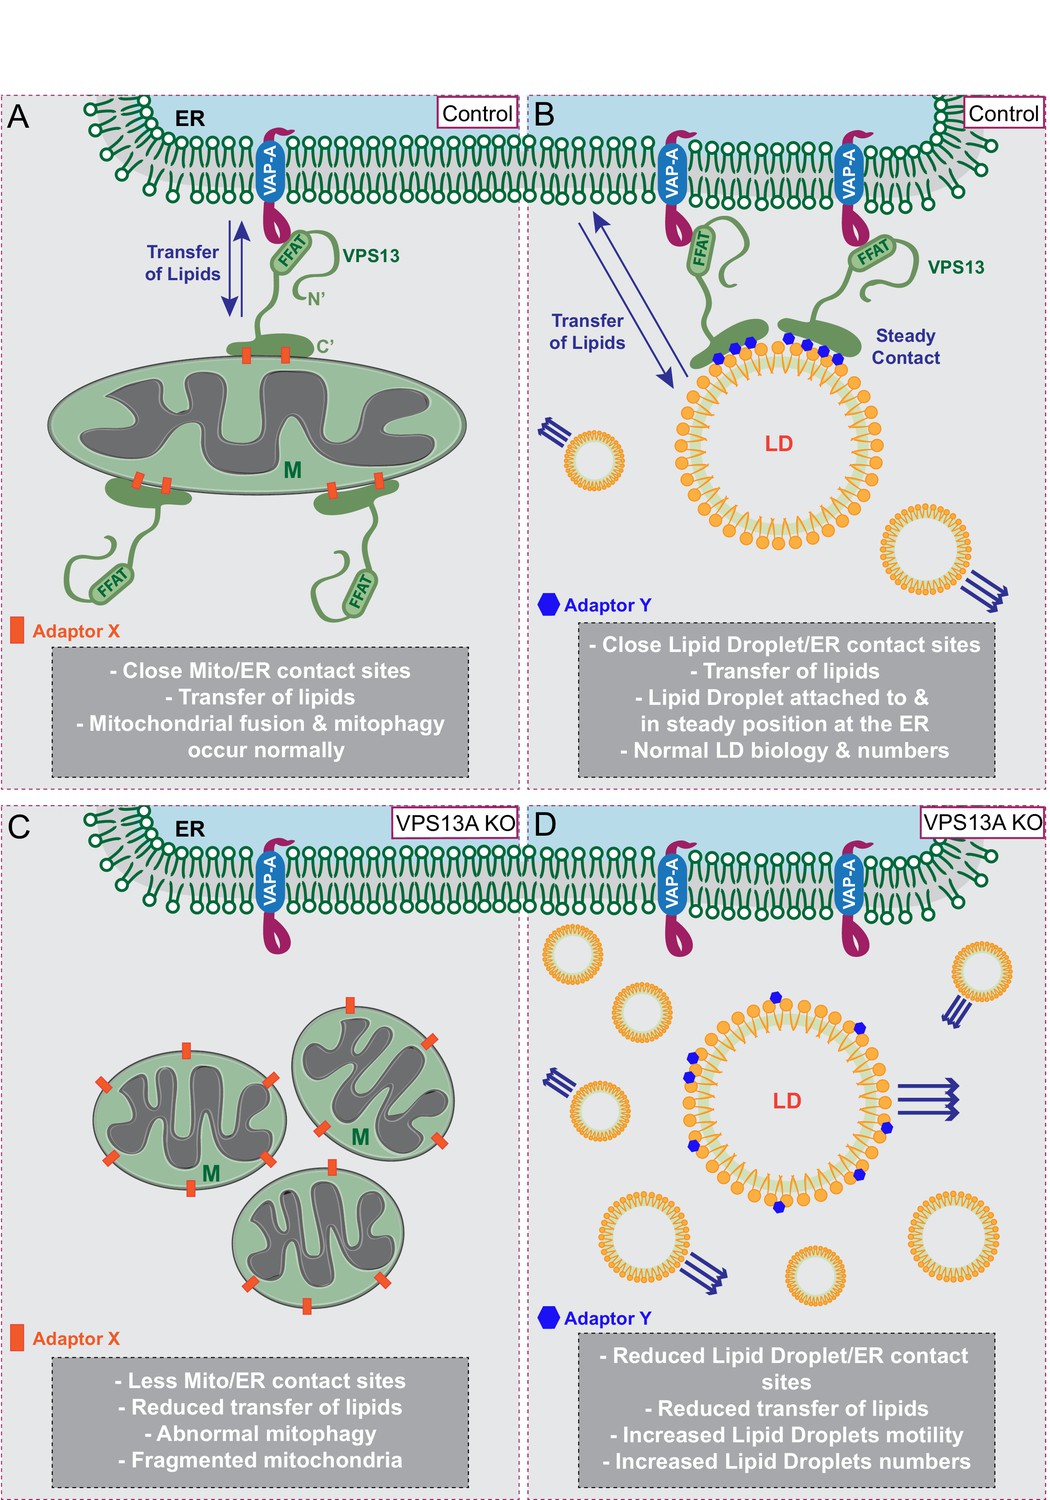
Proposed model for VPS13A function.
(A) Under normal growth conditions VPS13A is localized at the ER-mitochondria contact sites where it is anchored to VAP-A through its FFAT domain and via its C-terminal region it is associated with mitochondria, most likely via mitochondria specific adaptor proteins. VPS13A at this location may facilitate the transfer of lipids between ER and mitochondria and mitochondria fusion and mitophagy occur normally. (B) Under normal conditions VPS13A is also associated to LD, an association mediated via LD specific adaptor proteins. Via VPS13A LD are associated to the ER and VPS13A facilitate the transfer of lipids between ER and LDs. The VPS13A mediated ER-lipid connection halts LD movement. (C) Depletion of VPS13A leads to impaired lipid transfer between ER and mitochondria, leading to abnormal function of mitochondria which become less elongated. (D) Depletion of VPS13A also leads to disconnection of LD and the ER, leading to increased movement and reduced degradation of LD, resulting in increased LD numbers.
Videos
Video 1
HEK 293 T cells overexpressing VPS13-GFP were incubated with mitotracker orange for 20 min.
Time lapse images were taken every 500 milliseconds and the video is played at 10 frames per second.
Video 2
HEK 293 T cells overexpressing VPS13-GFP and mCherry-VAP-A were imaged lapse images were taken every 5 s.
The video is played at five frames per second.
Video 3
HEK 293 T cells overexpressing VPS13-GFP were incubated with 500 uM for 3 hr.
LDs were stained with LipidTox red to visualize and time lapse images were taken every 600 milliseconds. The video is played at 10 frames per second.
Tables
Key resources table
| Reagent type (species) or resource | Designation | Source or reference | Identifiers | Additional information |
|---|---|---|---|---|
| Antibody | Flag (rabbit polyclonal) | Sigma | F7425 | IF (1:500) |
| Antibody | Myc (mouse monoclonal) | Enzo Life Science | ADI-MSA-110-F | IF (1:500) WB (1:1000) |
| Antibody | TOMM20 (mous monoclonal) | BD biosciences | 612278 | IF (1:200) WB (1:1000) |
| Antibody | Normal Goat IgG (goat polyclonal) | Santacruz | sc-2028 | IP (1:200) |
| Antibody | Normal rabbit IgG (rabbit polyclonal) | Santacruz | sc-2027 | IP (1:200) |
| Antibody | VAP-A (goat polyclonal) | Santacruz | sc-48698 | IP (1:100) WB (1:1000) |
| Antibody | VAP-B (rabbit polyclonal) | Sigma | HPA013144 | IP (1:100) WB (1:1000) |
| Antibody | VPS13A (rabbit polyclonal) | Sigma | HPA021652 | IP (1:100) WB (1:1000) |
| Antibody | ATP5A (mouse monoclonal) | Abcam | ab14748 | WB (1:5000) |
| Antibody | a-Tubulin (mouse monoclonal) | Sigma | T5168 | WB (1:5000) |
| Antibody | EGFR (rabbit polyclonal) | Santacruz | SC-03-G | WB (1:1000) |
| Antibody | GAPDH (mouse monoclonal) | Fitzgerald | 10R-G109A | WB (1:10000) |
| Antibody | GFP (mouse monoclonal) | Clontech | 632381 | WB (1:5000) |
| Antibody | GST (mouse monoclonal) | Santacruz | sc-138 | WB (1:1000) |
| Antibody | LAMP1 (mouse monoclonal) | Abcam | ab25630 | WB (1:1000) |
| Antibody | DRP1 (rabbit monoclonal) | cell signaling | 8570 s | WB (1:500) D6C7 |
| Antibody | pDRP1 (rabbit polyclonal) | cell signaling | 3455 s | WB (1:1000) ser616 |
| Antibody | PLIN2 (rabbit polyclonal) | Abcam | ab78920 | WB (1:1000) |
| Antibody | RAB7 (mouse monoclonal) | Abcam | ab50533 | WB (1:1000) |
| Antibody | Vps13 #62 (rabbit polyclonal) | PMID:28107480 | WB (1:1000) | |
| Antibody | VPS13A (rabbit polyclonal) | Sigma | HPA021662 | WB (1:1000) |
| Antibody | VPS13A (H-102) (rabbit polyclonal) | Santacruz | sc-367262 | WB (1:1000) |
| Antibody | VPS13C (rabbit polyclonal) | Sigma | HPA043507 | WB (1:1000) |
| Other | Nile Red | Thermo Fisher Scientific | N1142 | FACS (1:500) |
| Other | BODIPY-FA | Thermo Fisher Scientific | D3835 | IF 1 µM |
| Other | LipidTox-green | Thermo Fisher Scientific | H34475 | IF (1:200) |
| Other | LipidTox-red | Thermo Fisher Scientific | H34476 | IF (1:200) |
| Other | Mitotracker Orange | Thermo Fisher Scientific | M-7510 | 100 nM (live) and 200 nM (fixed) |
| Other | Mitotracker Red | Thermo Fisher Scientific | M-7512 | 100 nM (live) and 200 nM (fixed) |
| Other | Nile Red | Thermo Fisher Scientific | N1142 | IF (1:1000) |
| Other | DAPI | Thermo Fisher Scientific | 62247 | 0.2 µg/ml |
| Recombinant DNA reagent | Lamp1-GFP | Addgene | 34831 | |
| Recombinant DNA reagent | mCherry-FYCO1 | PMID:25855459 | ||
| Recombinant DNA reagent | GFP-Rab5 Q79L | Addgene | 28046 | |
| Recombinant DNA reagent | GFP-Rab7 Q67L | Addgene | 28049 | |
| Recombinant DNA reagent | BFP-Sec61B | Addgene | 49154 | |
| Recombinant DNA reagent | mCherry-Sec61B | Addgene | 49155 | |
| Recombinant DNA reagent | peGFP-C1 | Clontech | discontinued | |
| Recombinant DNA reagent | peGFP-N1 | Clontech | 6085–1 | |
| Recombinant DNA reagent | VPS13-GFP (FL) | this paper | Progentiors:PCR VPS13-myc and pEGFP-N1; VPS13-myc | |
| Recombinant DNA reagent | VPS13-Myc (FL) | PMID:28107480 | ||
| Recombinant DNA reagent | VPS13-GFP- DFFAT | this paper | mutagenesis on VPS13-GFP | |
| Recombinant DNA reagent | VPS13-GFP2–854 | this paper | Progentiors: PCR VPS13-GFP; pEGFP-C1 | |
| Recombinant DNA reagent | VPS13-GFP835–1700 | this paper | Progentiors: PCR VPS13-GFP; pEGFP-C1 | |
| Recombinant DNA reagent | VPS13-GFP 855–1700 | this paper | Progentiors: PCR VPS13-GFP; pEGFP-C1 | |
| Recombinant DNA reagent | VPS13-GFP 2003–2606 | this paper | Progentiors: PCR VPS13-GFP; pEGFP-C1 | |
| Recombinant DNA reagent | VPS13-GFP2615–3174 | this paper | Progentiors: PCR VPS13-GFP; pEGFP-C1 | |
| Recombinant DNA reagent | pGEX5×2 | GE Healthcare | 28954554 | |
| Recombinant DNA reagent | GST-FFAT | this paper | Progentiors: oligo FFAT domain;pGEX5×2 | |
| Recombinant DNA reagent | GST-VPS13A (2-834) | this paper | Progentiors: PCR VPS13-GFP; pGEX5×2 | |
| Recombinant DNA reagent | GST-VPS13A (2-854) | this paper | Progentiors: PCR VPS13-GFP; pGEX5×2 | |
| Recombinant DNA reagent | GST-VPS13A (2–854/D845A) | this paper | mutagensis on GST-VPS13 (2-854) | |
| Recombinant DNA reagent | GST-VPS13A (835–1700) | this paper | Progentiors: PCR, VPS13-GFP; pGEX5×2 | |
| Recombinant DNA reagent | pET28a | EMD Biosciences | 69864–3 | |
| Recombinant DNA reagent | GFP-VAP-A | this paper | Progentiors: PCR pET28a-VAP-A; pEGFP-C1 | |
| Recombinant DNA reagent | mCherry-VAP-A | this paper | Progentiors:PCR pET28a-VAP-A; mCherry-tubuline | |
| Recombinant DNA reagent | pET28a-VAPA | this paper | Progentiors: PCR cDNA Hek293T; pET28a | |
| Recombinant DNA reagent | SPLICSs | PMID: 29229997 | ||
| Recombinant DNA reagent | SPLICSL | PMID: 29229997 | ||
| Recombinant DNA reagent | OMM-GFP1-10 | PMID: 29229997 | ||
| Recombinant DNA reagent | FLAG-Parkin | PMID: 12937272 | ||
| Recombinant DNA reagent | pSpCas9(BB) −2A-Puro (PX459) | Addgene | 48139 | |
| Recombinant DNA reagent | mCherry-tubuline | PMID: 15558047 | ||
| Cells (human) | Hek293T | ATCC | CRL-3216 | |
| Cells (human) | HeLa S3 | ATCC | CCL-2.2 | |
| Cells (human) | U2OS | ATCC | HTB-96 | |
| Cells (human) | MRC5 WT | (MRC-5 SV2) ECACC 84100401 PMID: 6313714 | ||
| Cells (human) | MRC5 Clone 4 MRC5-SV2_A01-01t_A2b | A. Velayos-Baeza | ||
| Chemical compound, drug | Oleic acid | Sigma | O3008 | |
| Chemical compound, drug | Thapsigargin | Merck Millipore | 586005 | |
| Chemical compound, drug | Carbonyl cyanide 3-chlorophenylhydrazone (CCCP) | Sigma | C2759 | |
| Chemical compound, drug | Proteinase K (recombinant), PCR grade | Fermentas | EO0491 | |
| Commercial assay or kit | Gibson assembly master mix | NEB | E2611 | |
| Chemical compound, drug | HBSS, calcium magnesium | Thermo Fisher Scientific | 14025092 | |
| Commercial assay or kit | QuickChange Site Directed Mutagenesis Kit | Agilent | 200519 | |
| Commercial assay or kit | Glutathione Sepharose 4B (10 ml) | GE healthcare | 17-0756-01 | |
| Commercial assay or kit | GFP-Trap_MA | Chromotek | gtma-20 | |
| chemical compound, drug | polyethylenimine (PEI) | Polysciences | 23966 | |
| Commercial assay or kit | protein A/G plus agarose beads | Santa Cruz | sc-2003 | |
| Genetic reagent (D. melanogaster) | w1118 | Bloomington Drosophila Stock Center | 3605 | FlyBase symbol: w[1118] |
| Genetic reagent (D. melanogaster) | VPS13 (c03628) | Harvard | c03628 | FlyBase symbol: PBac{PB}Vps13c03628/CyO |
| Genetic reagent (D. melanogaster) | hVPS13 | PMID:28107480 | ||
| Genetic reagent (D. melanogaster) | Act-Gal4 | Bloomington Drosophila Stock Center | 3954 | y1w*;P{w[+mC]=Act5 C-GAL4}17bFO1/TM6B, Tb |
Additional files
-
Transparent reporting form
- https://doi.org/10.7554/eLife.43561.036
Download links
A two-part list of links to download the article, or parts of the article, in various formats.
Downloads (link to download the article as PDF)
Open citations (links to open the citations from this article in various online reference manager services)
Cite this article (links to download the citations from this article in formats compatible with various reference manager tools)
Human VPS13A is associated with multiple organelles and influences mitochondrial morphology and lipid droplet motility
eLife 8:e43561.
https://doi.org/10.7554/eLife.43561


