The unfolded protein response and endoplasmic reticulum protein targeting machineries converge on the stress sensor IRE1
- Howard Hughes Medical Institute, United States
- University of California, San Francisco, United States
- Harvard Medical School, United States
Figures
Figure 1 with 2 supplements
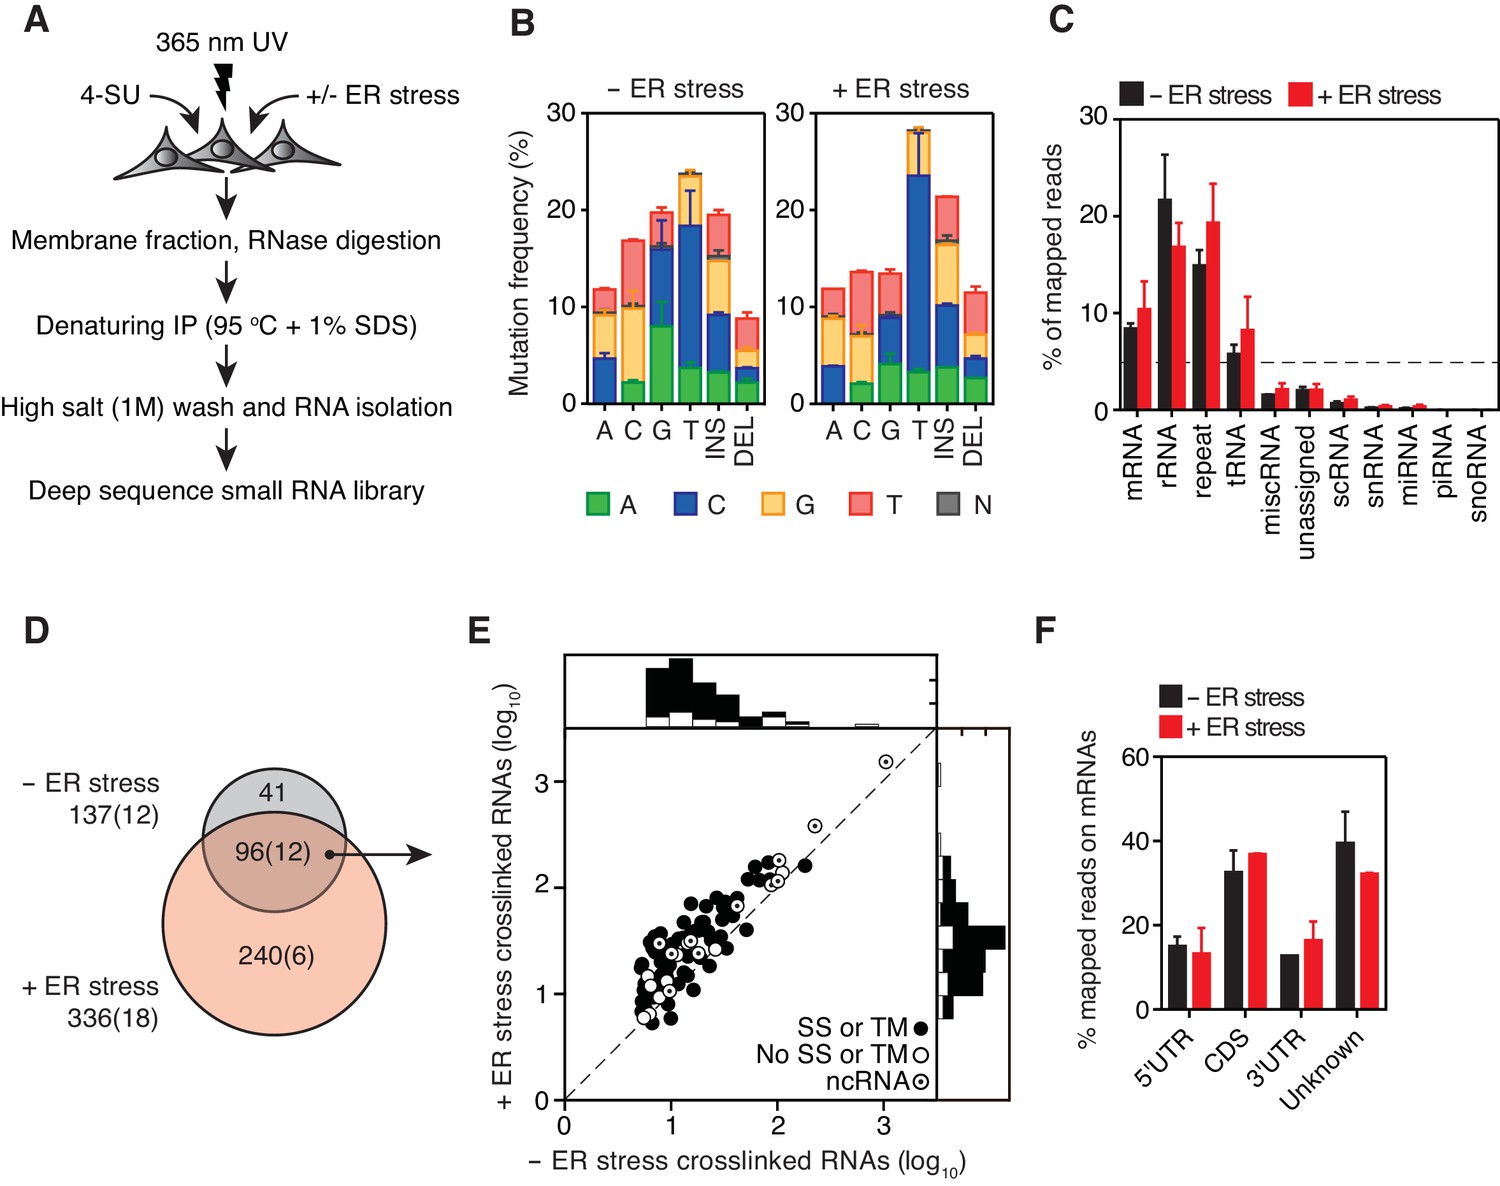
Identification of IRE1-associated RNAs.
(A) Experimental strategy. (B) Mutation plots showing T→C transitions are the most common mutations recovered by PAR-CLIP in biological duplicates. (C) Breakdown of RNA classes associated with IRE1 identified by PAR-CLIP in biological duplicates. (D) Venn diagrams showing the numbers of crosslinked transcripts recovered by PAR-CLIP in the presence or absence of chemically induced ER stress in biological duplicates. Cardinals indicate the total or non-coding (in parenthesis) number of transcripts in each group. (E) Scatter plot showing the abundance of PAR-CLIP recovered transcripts in the presence or absence of chemically induced ER stress (copies per million reads: geometric mean of copy number per transcript in biological duplicates). The histograms above and to the side of the scatter plot illustrate the frequency of transcripts that traverse the secretory pathway. The diagonal dashed line indicates a slope of 1. (F) Breakdown of mRNA regions associated with IRE1 in PAR-CLIP experiments. ‘Unknown region’ refers to transcripts associated with coding loci but that do not have a single annotated coding sequence (i.e., alternative splicing or alternative transcription initiation sites).
Figure 1—figure supplement 1

A modifed PAR-CLIP protocol for identifying IRE1-associated RNAs.
(A) Schematic of modified PAR-CLIP protocol. (B) Immunoblots showing the enrichment for IRE1 in subcellular fractions prepared by differential detergent extraction as performed in our PAR-CLIP experiments. (C) Immunoblot showing the relative enrichment for IRE1 in native and denaturing IP conditions. (D) Semi-quantitative RT-PCR showing the extent of XBP1 splicing in the HEK293Trex cell line where we force-express IRE1 in the presence or absence of chemically-induced ER stress. ER stress was induced by exposing the cells to tunicamycin. (E) Top: Autoradiogram of an SDS-PAGE gel in which the 5’-ends of IRE1-crosslinked RNAs were radiolabeled with polynucleotide kinase after immunoprecipitation of epitope-tagged IRE1. The crosslinked lysates were treated with the indicated amounts of RNase T1 for 30 min at 25°C. Bottom: Autoradiogram of a TBE-urea PAGE gel in which the RNA fragments purified from gel cutouts obtained from the gel in the top panel were resolved. (F) Autoradiogram of an SDS-PAGE gel of the eluates of denaturing IPs of epitope-tagged IRE1 after radiolabeling the 5’-end of crosslinked RNAs. The bracket on the left indicates the region of the gel that was excised for purification of IRE1-RNA complexes. The dashed line indicates where the lanes from a single gel were cropped.
Figure 1—figure supplement 2
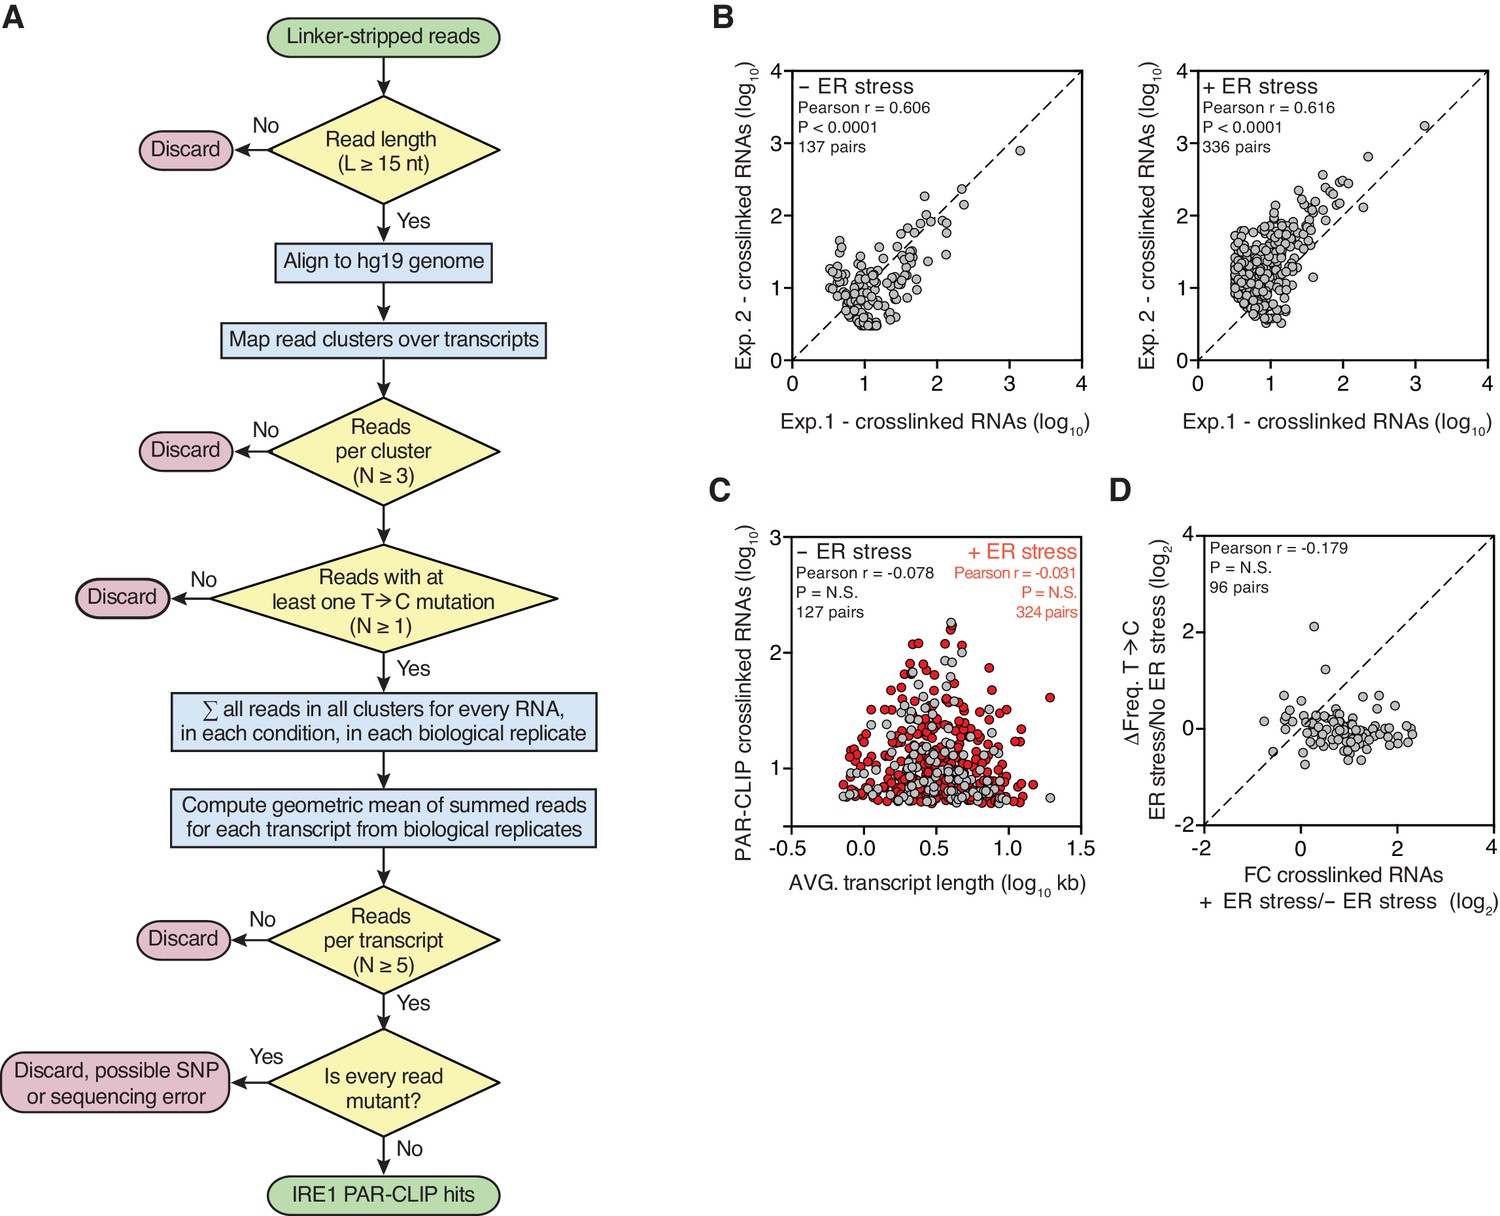
Reproducible identification of IRE1-crosslinked RNAs using our modified PAR-CLIP protocol.
(A) Flow chart indicating the criteria that must be fulfilled for assigning IRE1-crosslinked transcripts in PAR-CLIP experiments. (B) Scatter plots showing the correlation between the numbers of crosslinked transcript copies (per million reads) recovered by PAR-CLIP in biological replicates. The diagonal dashed line indicates a slope of 1. (C) Scatter plot showing the correlation between the number of crosslinked transcript copies recovered by PAR-CLIP and transcript length. For transcripts with multiple isoforms the average length of all isoforms was computed. Highly abundant small RNAs were removed as outliers. (D) Scatter plot showing the fold-change in the number of crosslinked transcript copies recovered by PAR-CLIP in the presence or absence of chemically induced ER stress and the change in frequency of transcript copies derived from reads containing T→C substitutions in the same conditions. The diagonal dashed line indicates a slope of 1.
Figure 2 with 2 supplements
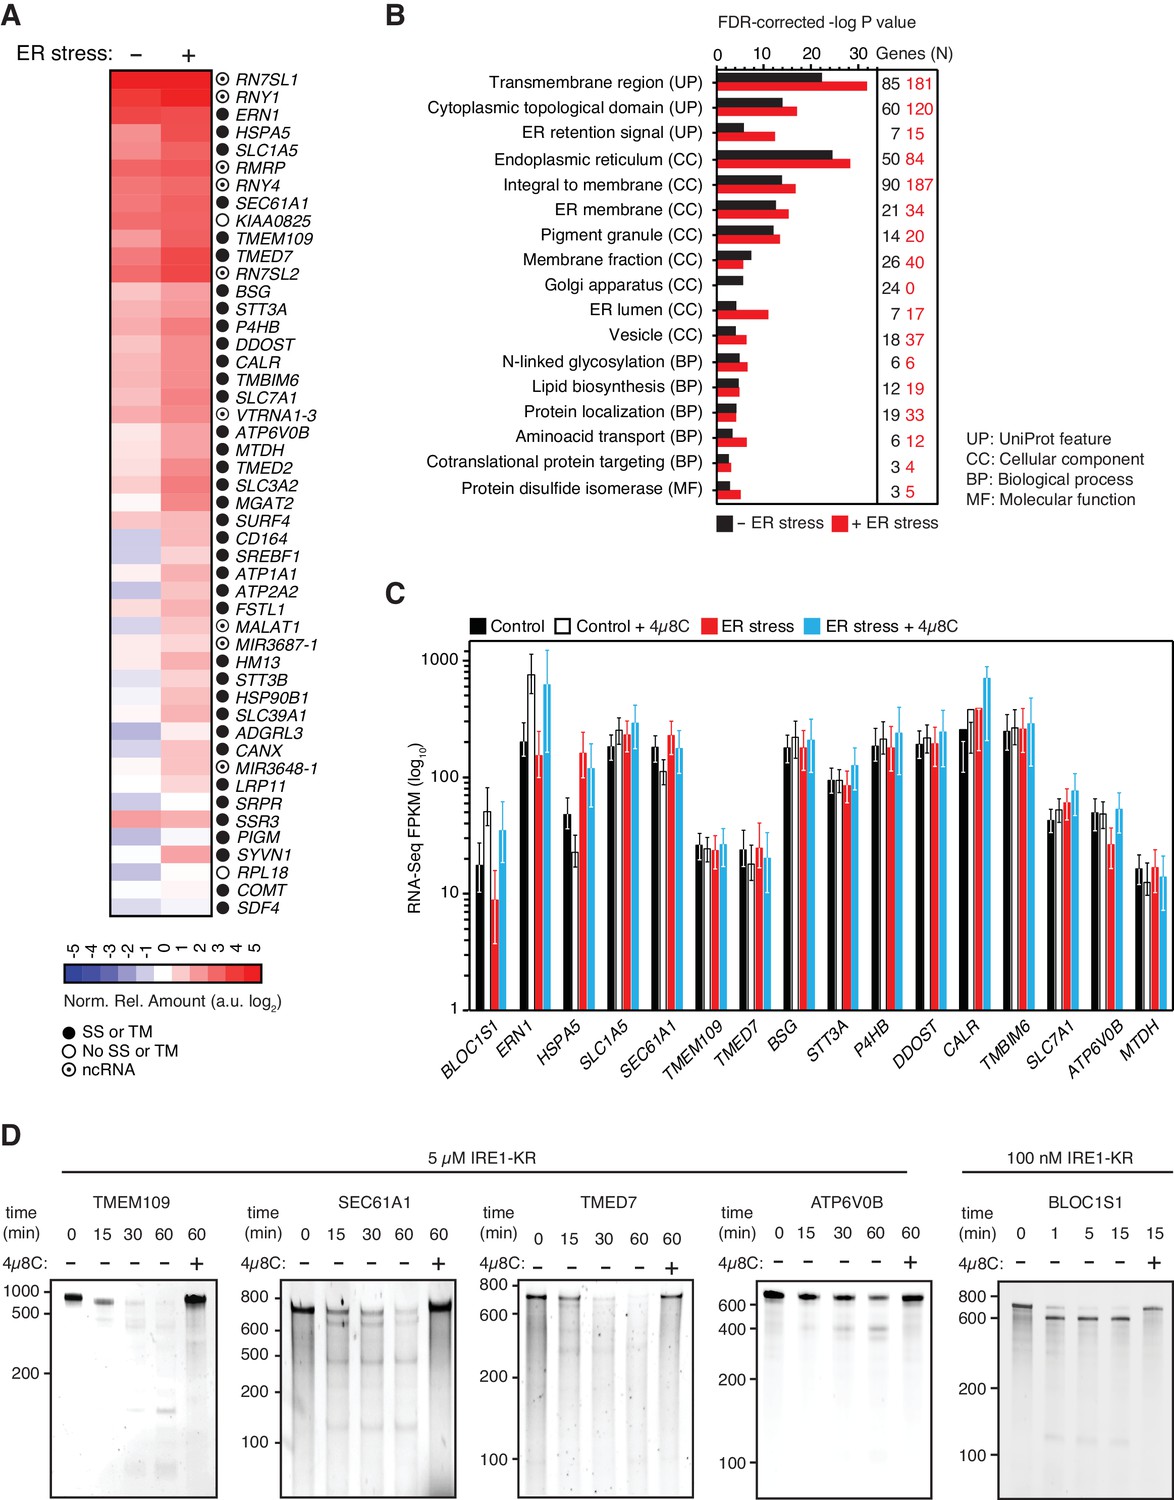
IRE1 associates with mRNAs and ncRNAs.
(A) Heat map showing the relative amounts of select transcripts in the common-core (intersection of Venn diagrams. Arbitrary threshold: copies ≥ 10). (B) Gene-functional categories enriched among the crosslinked protein-coding transcripts recovered in each experimental set-up grouped by gene-ontology (GO) terms. (C) Changes in the transcript levels of select PAR-CLIP targets during ER stress measured by RNA-seq. Data: Mean FPKM values of biological duplicates. Error bars: 95% CI. (D) TBE-urea PAGE gels showing the IRE1-dependent cleavage of select PAR-CLIP targets. The IRE1 specific inhibitor 4μ8C (10 μM) was used as a control for specificity.
Figure 2—figure supplement 1
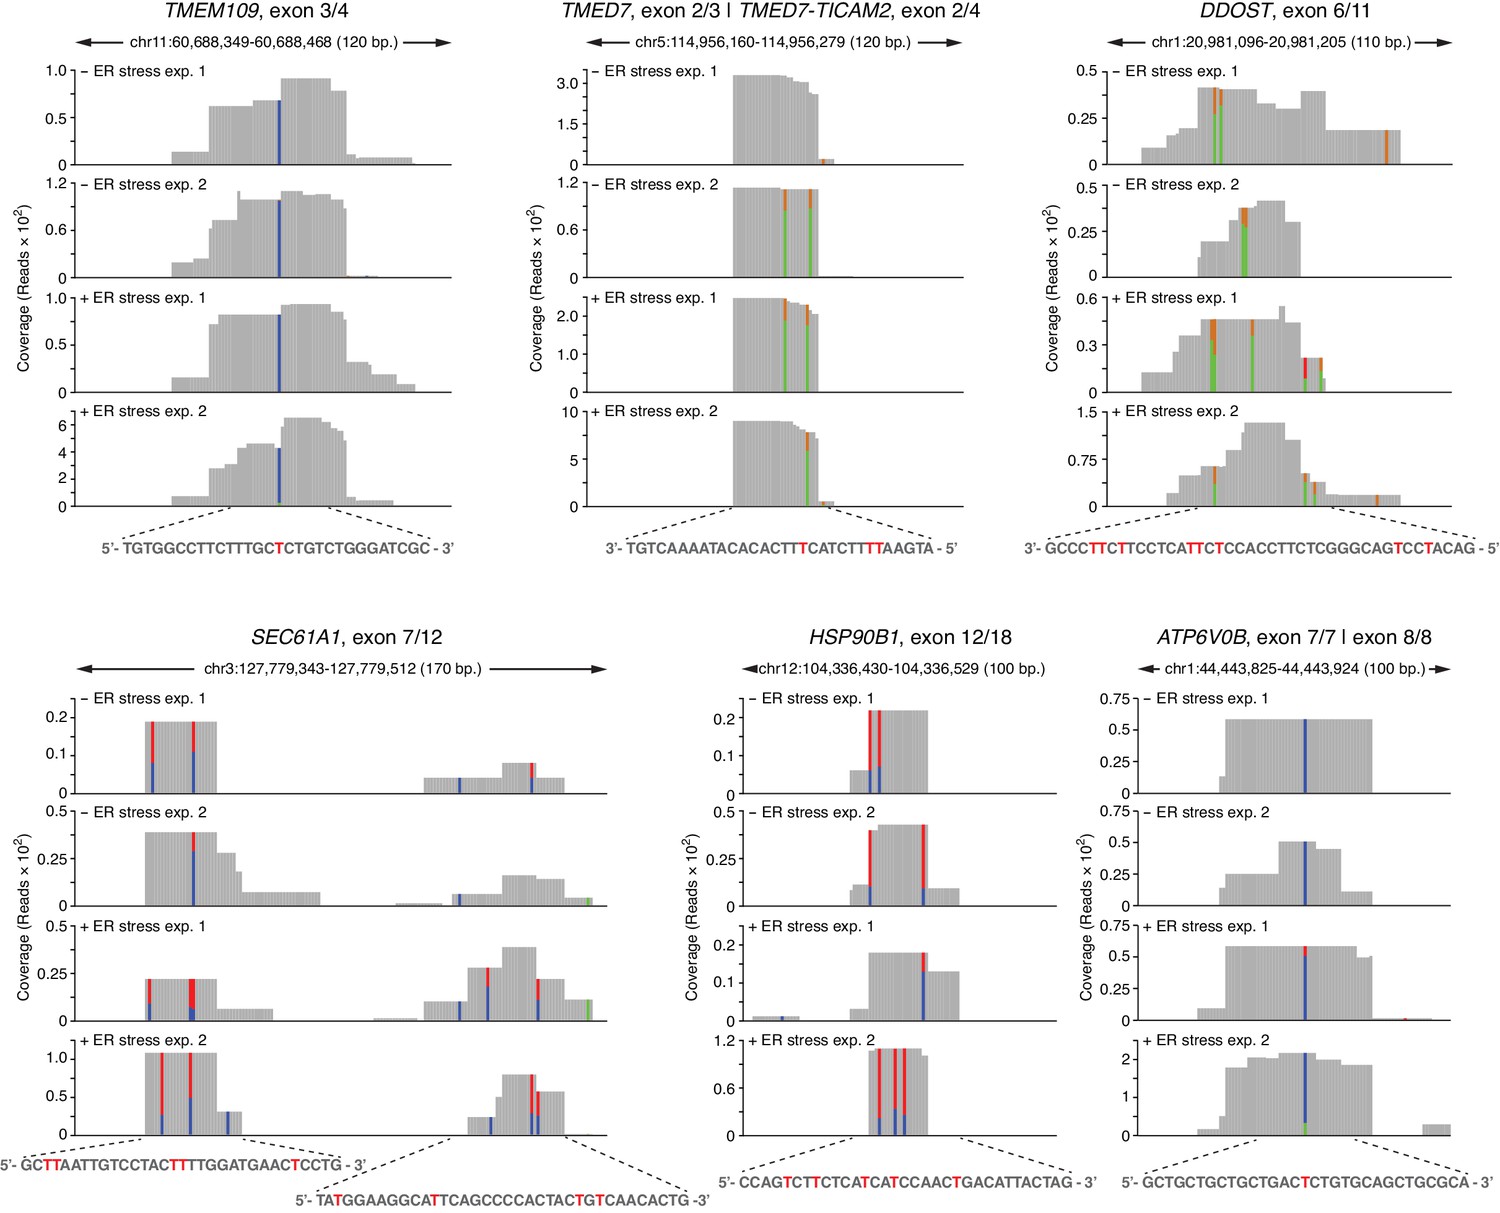
Examples of coverage tracks of PAR-CLIP sequencing reads mapped to coding loci in the presence or absence of chemically induced ER stress.
The colored bars indicate the stereotypical T→C transitions indicative of crosslinking. In reads mapped to the Watson strand, the red bars indicate the proportion of reads with a T, and the blue bars indicate proportion of reads with a C (T→C transition). In reads mapping to the Crick strand, green bars indicate the proportion of reads with a T, and the gold bars indicate proportion of reads with a C (T→C transition). The sequence below each plot indicates the crosslinked nucleotide (red Ts).
Figure 2—figure supplement 2
Expression profiles of IRE1-associated RNAs identified by PAR-CLIP.
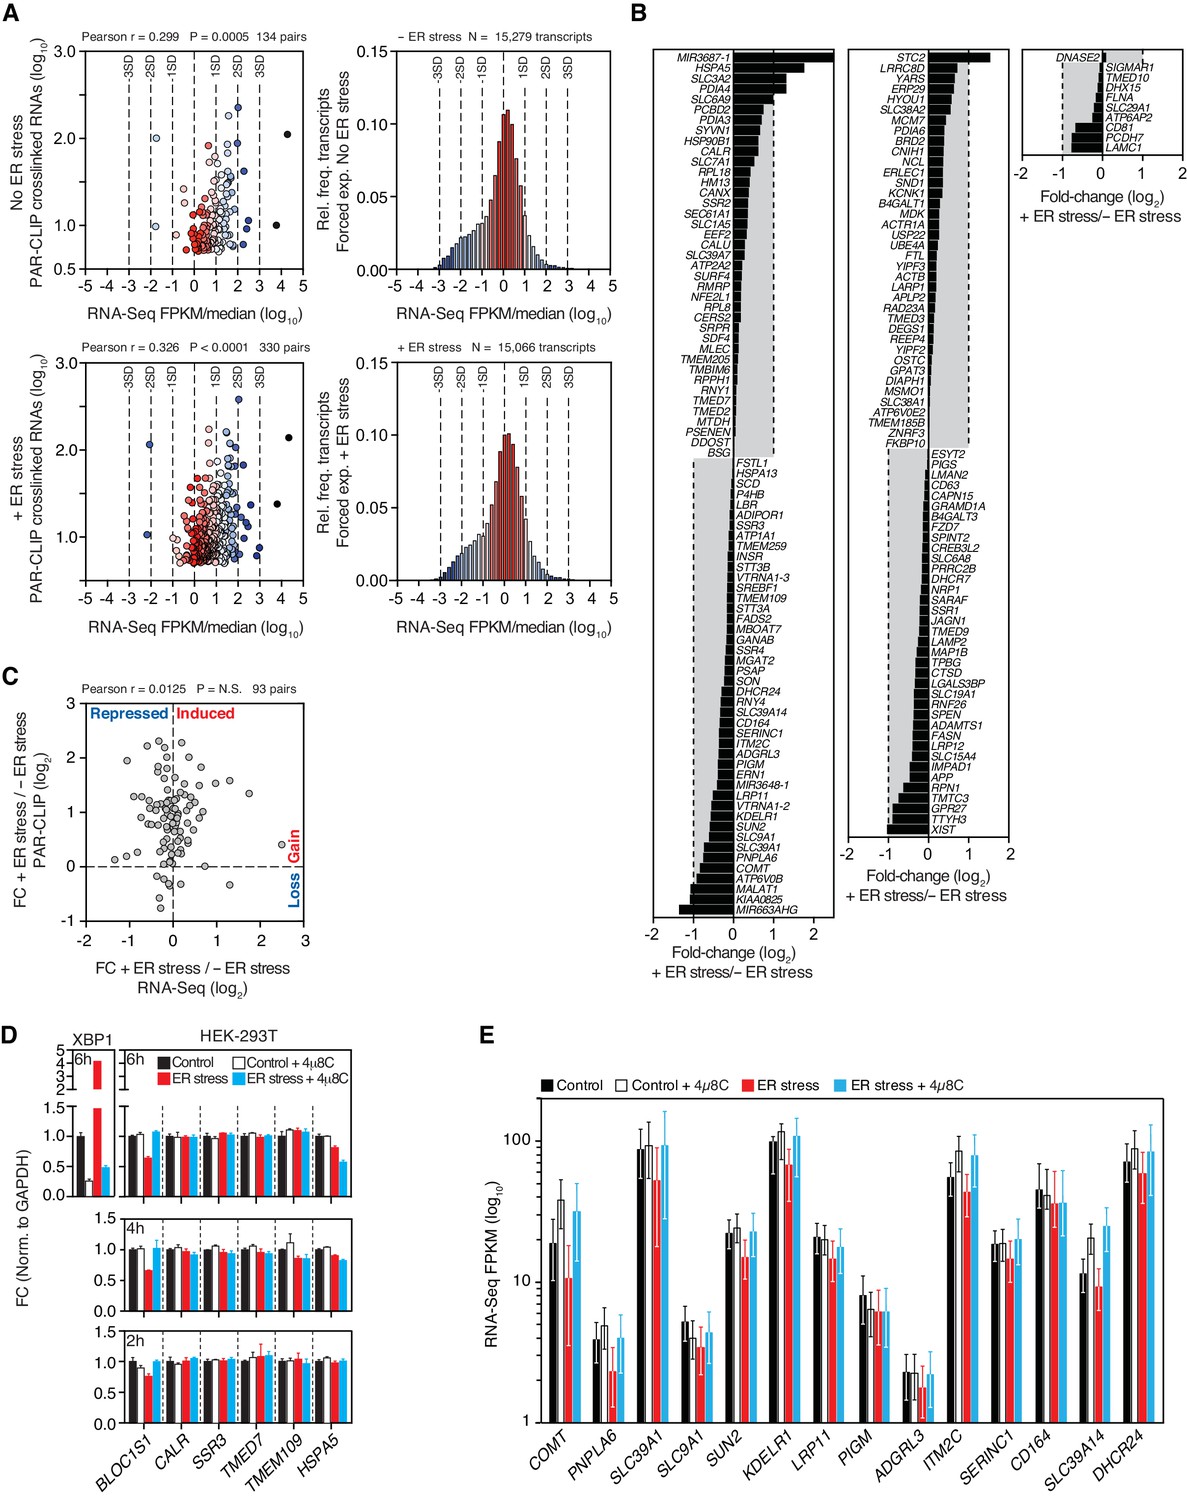
(A) Left panels: Scatter plots showing the correlation between the number of crosslinked transcript copies (per million reads) recovered by PAR-CLIP and the expression level as measured by RNA-Seq in the HEK293Trex cell line that force-expresses epitope-tagged IRE1, and under the same ER stress conditions (5 μg/ml tunicamycin). The mean expression level for each transcript (obtained from biological duplicates) was normalized to the median expression level of the entire dataset, which consisted of all transcripts for which we recovered RNA-Seq reads (FPKM > 0) in a particular condition. Right panels: Histograms showing the gene expression distribution in RNA-Seq experiments. Deviations from the central tendency are color-coded, with warm colors closer to the central tendency and cool colors towards the tail ends of the distribution. The same color scheme is applied to the data points in the left panels. The dashed vertical lines indicate the standard deviation (SD) of the median-normalized data. (B) Waterfall plots showing the expression change in select transcripts identified by PAR-CLIP measured by RNA-Seq in the HEK293Trex cell line that force-expresses epitope-tagged IRE1, and under the same ER stress conditions (5 μg/ml tunicamycin). Bars: mean values of biological duplicates. (C) Scatter plots showing the fold-change in the number of crosslinked transcript copies recovered by PAR-CLIP in the presence or absence of chemically induced ER stress and the fold-change in the number of RNA-Seq reads (FPKM) in the same conditions. Genes repressed or expressed during ER stress are indicated on the X-axis. Transcripts for which there is a loss or gain of recovered crosslinked copies are indicated on the Y-axis. (D) Representative quantitative real-time PCR measurements of the levels of select PAR-CLIP hit mRNAs in response to ER stress in different cell types. ER stress was induced with 300 nM of the ER calcium reuptake inhibitor thapsigargin, and the cells were pre-treated for 30 min with 5 μg/ml actinomycin D to block transcription. The IRE1 specific inhibitor 4μ8C (50 μM) was used as a control for specificity. Metrics for spliced XBP1 mRNA or the canonical RIDD substrate mRNA, BLOC1S1, were used as positive controls. Data: mean of triplicates. Error bars: SDs. (E) Changes in the transcript levels of select PAR-CLIP targets during ER stress measured by RNA-seq. Data: Mean FPKM values of biological duplicates. Error bars: 95% CI.
Figure 3 with 1 supplement
IRE1 associates with the SRP RNA.
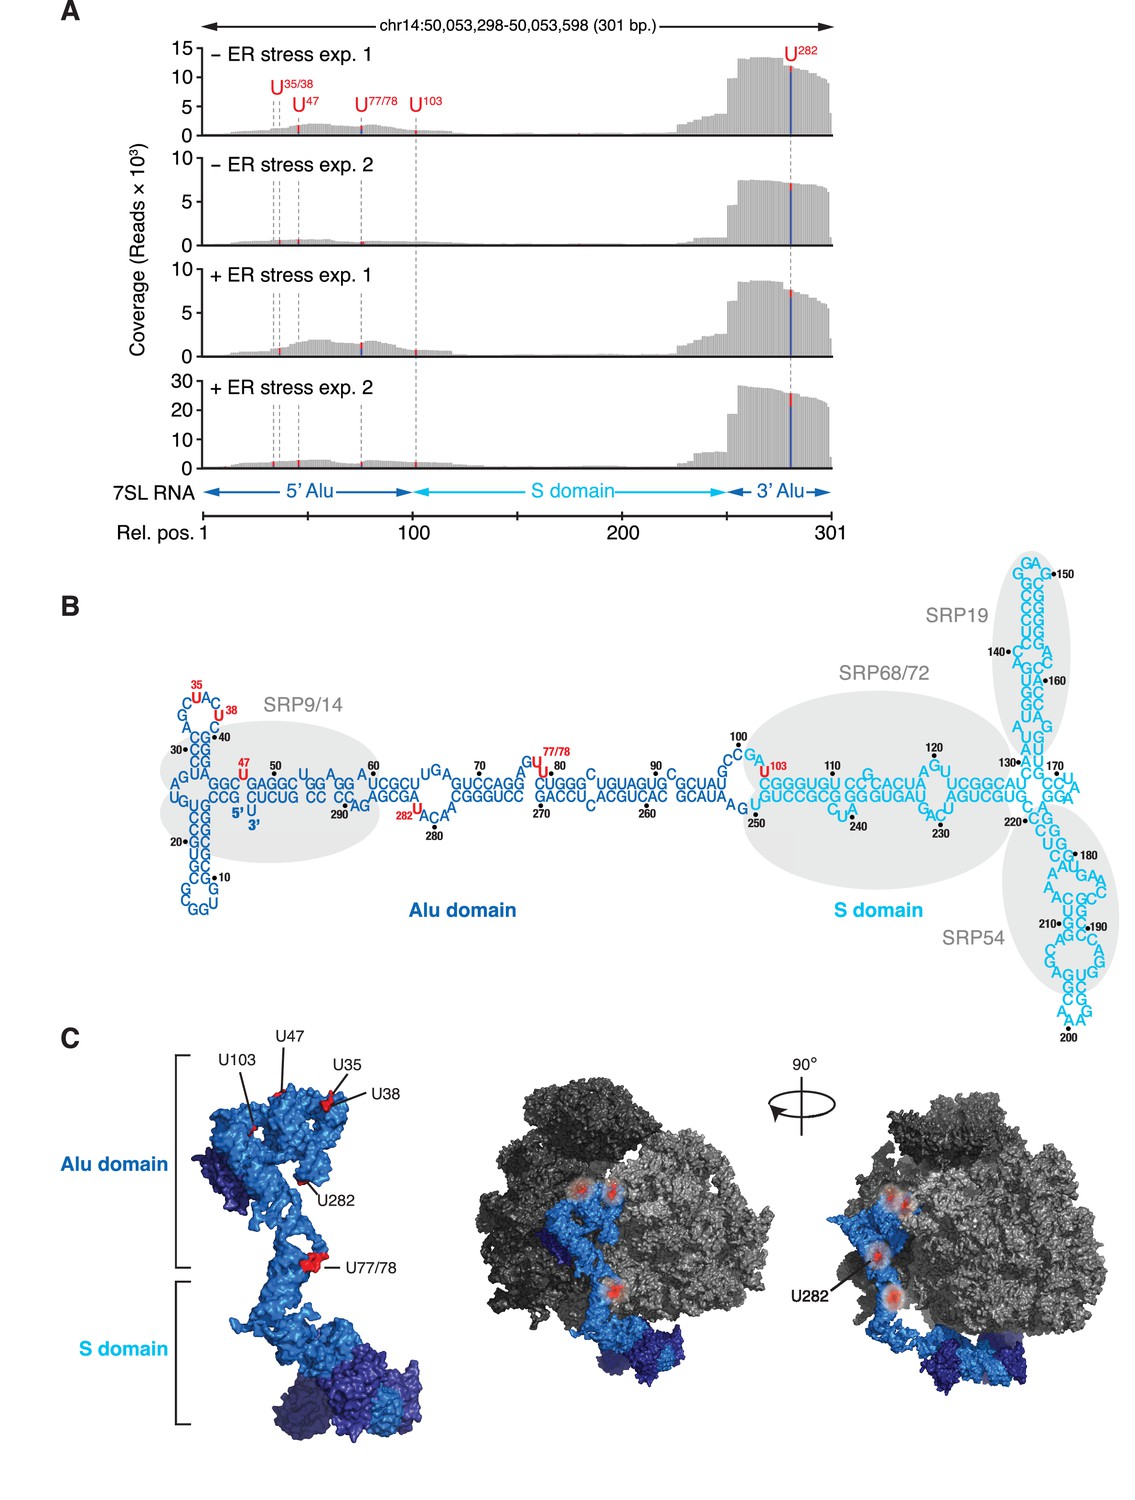
(A) Coverage tracks of PAR-CLIP sequencing reads in the presence or absence of chemically induced ER stress mapped to the SRP in the human genome. The colored bars indicate the proportion of reads with a T (red) or a C (blue, T→C transition), allowing mapping of the corresponding uracil on the RNA from which the reads originated (indicated over each bar). (B) Schematic of the SRP showing the crosslink sites (red circles) identified in RN7SL by PAR-CLIP. Shaded ovals indicate the SRP proteins. (C) Crosslink sites (red) identified by PAR-CLIP on RN7SL and mapped onto the structure of SRP (PDB accession number: 3JAJ). Free and ribosome-bound views of SRP are shown.
Figure 3—figure supplement 1

SRP RNA remains intact during ER stress.
(A) Left: Schematic indicating the positions were qRT-PCR primers anneal on RN7SL. Right: Representative qRT-PCR measurements of the levels of RN7SL in response to ER stress in different cell types. The IRE1 specific inhibitor 4μ8C (50 μM) was used as a control for specificity. ER stress was induced with 300 nM thapsigargin. Data: Mean of triplicates. Error bars: SDs. (B) Left: Schematic of experimental set-up to enrich for membrane-bound RNAs used in the Northern blot experiment on the right panel. Right panel: Representative Northern blot of the SRP RNA upon induction of ER stress using a probe that recognizes the region corresponding to the S-domain of SRP on RN7SL. Bottom panels: TBE-urea PAGE gels of membrane-fraction enriched RNA extracted from RPMI-8226 cells undergoing a time course of ER stress. Numbers on the right indicate the molecular weights (nucleotides). Middle panels: Nylon membrane transfers of the gels below. Numbers on the right indicate the relative size (nucleotides). Top panels: Northern blots with the indicated probe on the membranes in the panels below. The IRE1 specific inhibitor 4μ8C (20 μM) was used as a control for specificity. ER stress was induced with 10 μg/ml tunicamycin. The cells were pre-treated (16 hr) with 5-fluorouracil (375 μM) to inhibit the exosome complex in an effort to detect intermediate cleavage products.
Figure 4 with 2 supplements
IRE1 associates with specific tRNAs.
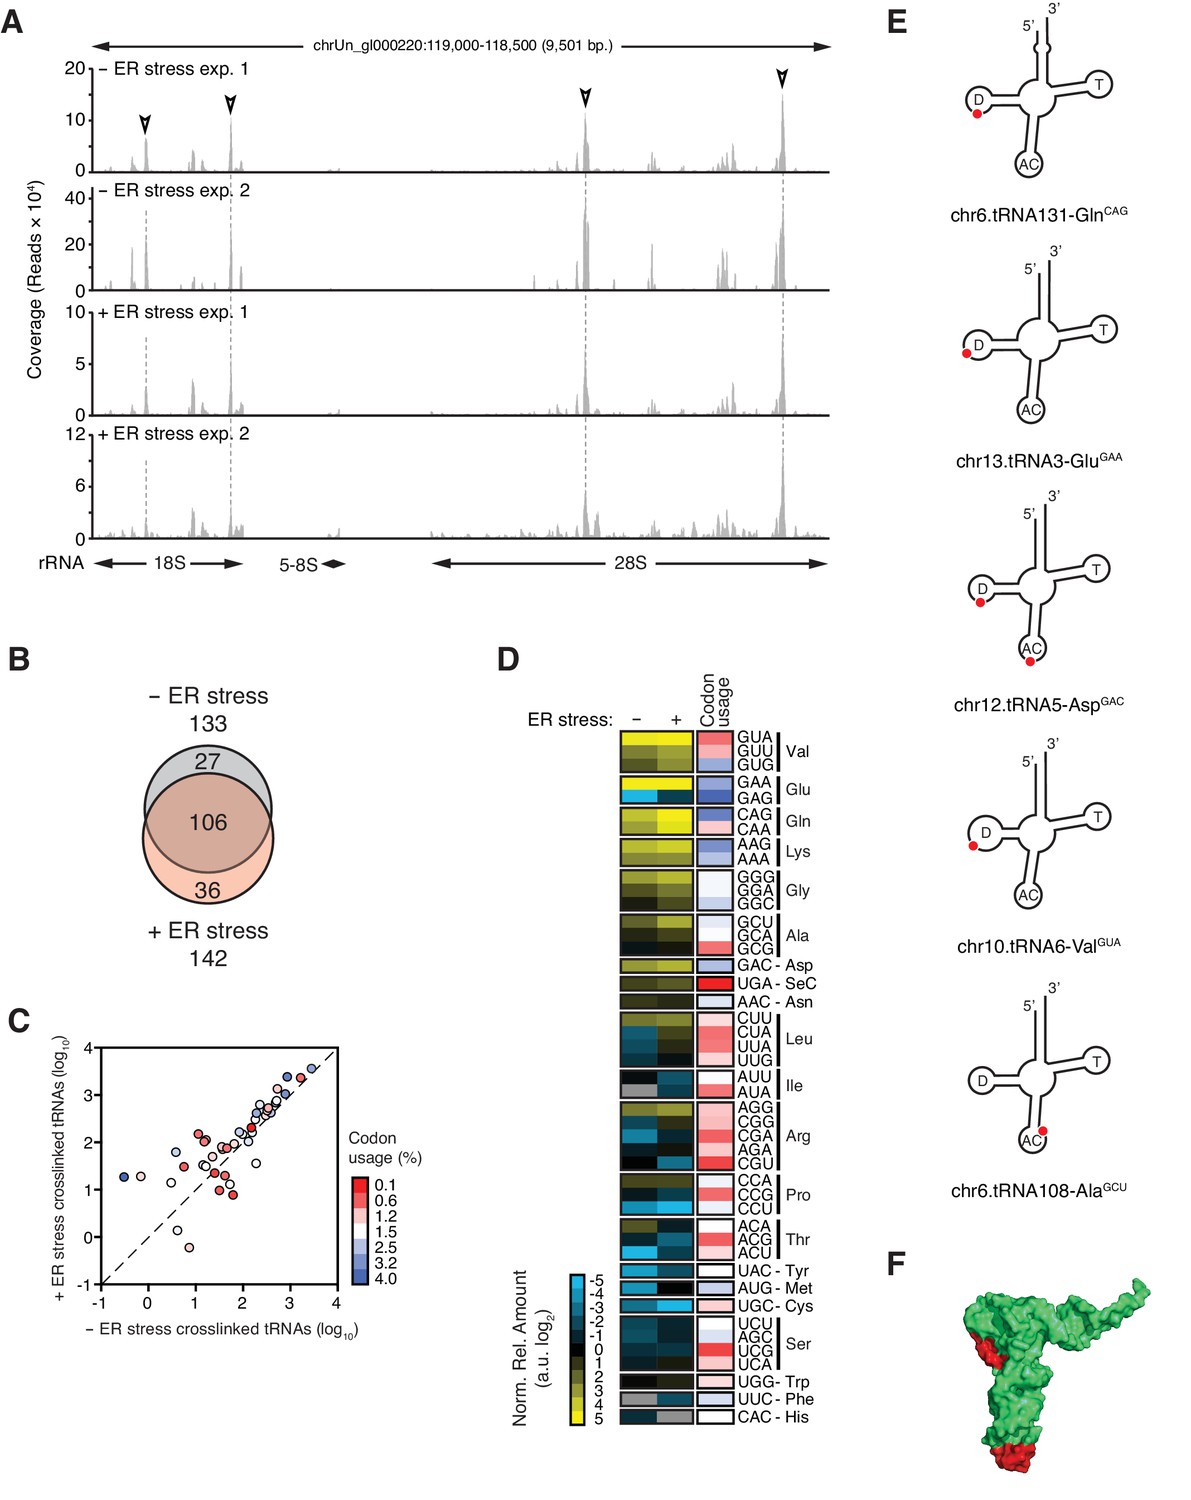
(A) Coverage tracks of PAR-CLIP sequencing reads recovered in the presence or absence of chemically induced ER stress mapped to the 45S pre-ribosomal loci (RNA45S5) in the human genome. Discrete regions of preferential association between IRE1 and rRNA are indicated by arrowheads. (B) Venn diagrams showing the numbers of crosslinked tRNAs recovered by PAR-CLIP in the presence or absence of chemically induced ER stress. (C) Scatter plot showing the abundance of PAR-CLIP recovered tRNAs grouped by codon-anticodon in the presence or absence of chemically induced ER stress (copies per million reads: sum of geometric means of copy number of each tRNA with the same anticodon in biological duplicates). Specific tRNA examples are indicated. Codons are colored based on codon usage from the codon usage database (http://www.kazusa.or.jp/codon/). The diagonal dashed line indicates a slope of 1. (D) Heat map showing the relative amounts of PAR-CLIP recovered tRNAs grouped by codon-anticodon in the presence or absence of chemically induced ER stress. Codons are colored as in panel C. (E) Schematic representation of the crosslink sites on top tRNA hits. (F) Topographical mapping of the PAR-CLIP identified crosslink sites on tRNAs.
Figure 4—figure supplement 1
Reproducible identification of IRE1-crosslinked tRNAs.
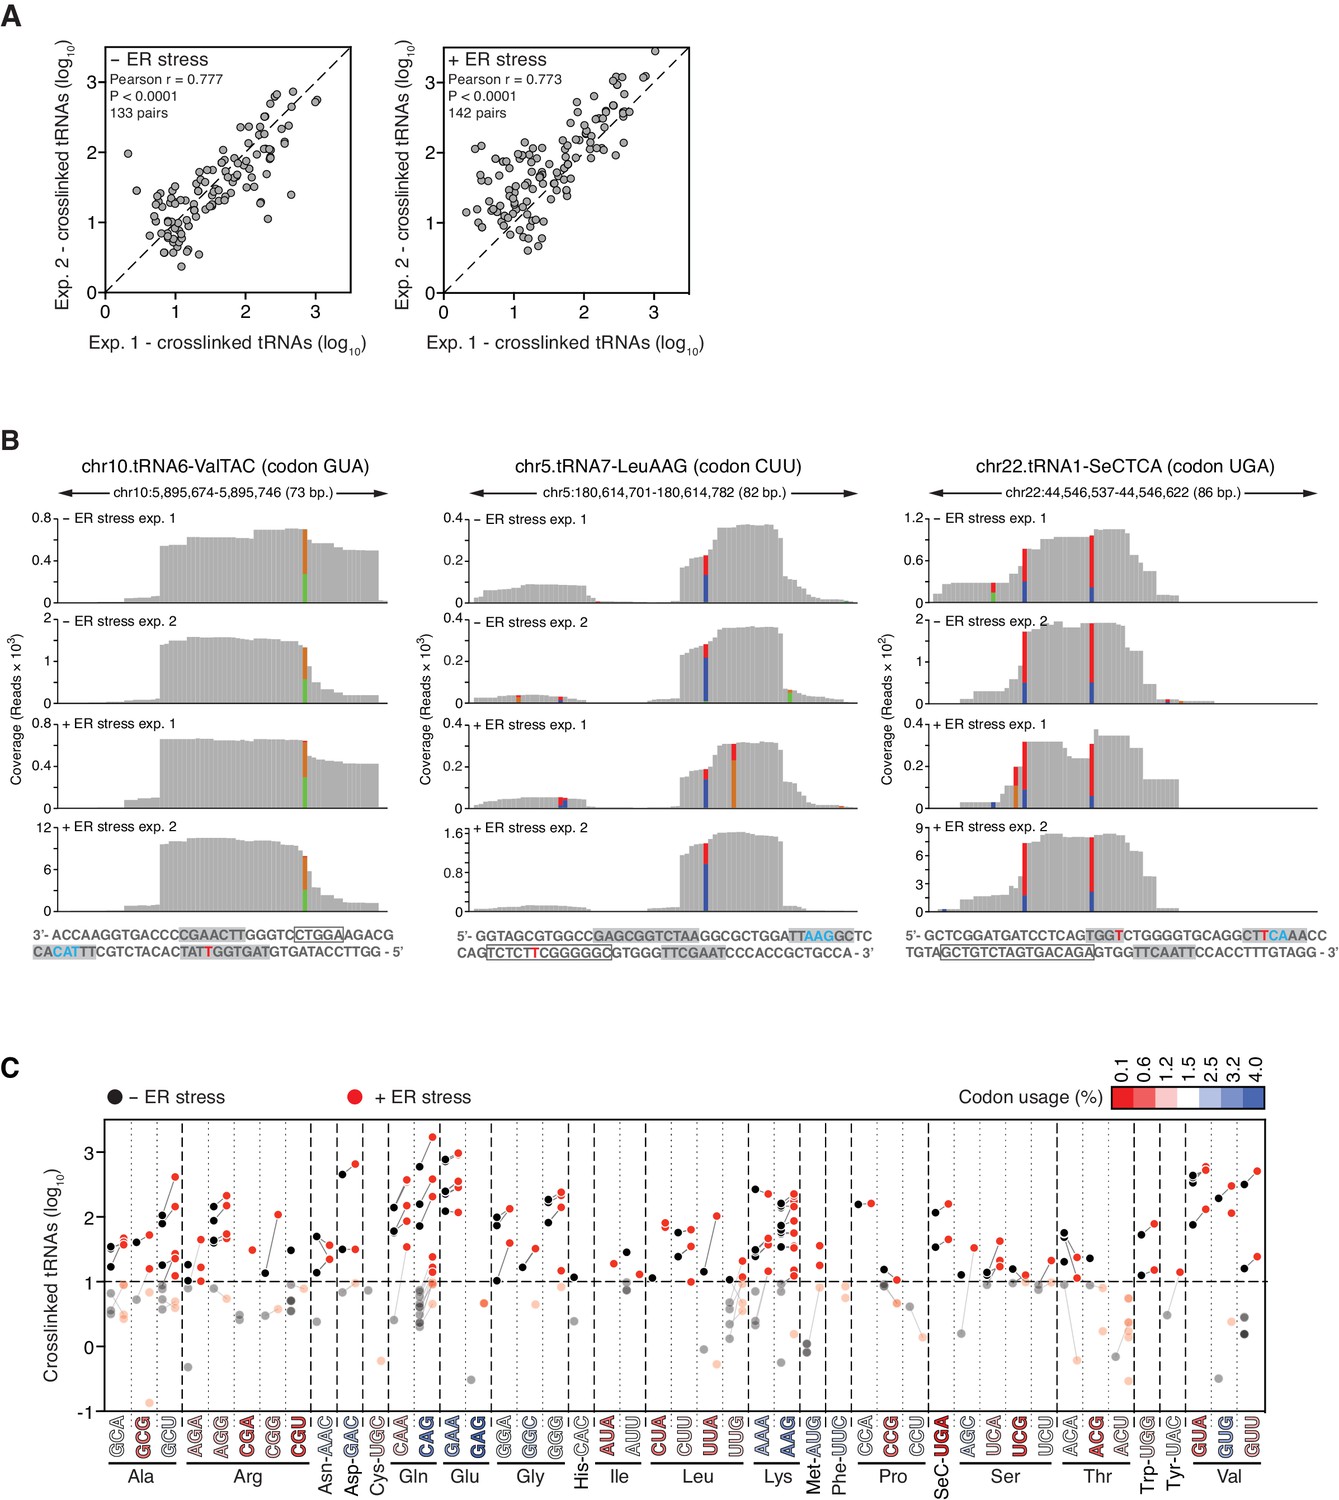
(A) Scatter plots showing the correlation between the numbers of crosslinked tRNA copies (per million reads) recovered by PAR-CLIP in biological duplicates. The diagonal dashed line indicates a slope of 1. (B) Examples of coverage tracks of PAR-CLIP sequencing reads mapped to tRNAs in the presence or absence of chemically induced ER stress. Colored bars as in Figure 2—figure supplement 1. The sequence below each plot corresponds to the genomic sequence of the tRNA. Grey-filled boxes indicate the positions of the D-, anticodon- and T- loops (in the 5’-to-3’ direction). The outlined box indicates the position of the variable region. Crosslinked nucleotides are indicated as red Ts. (C) Before-and-after scatter plot showing the abundance of PAR-CLIP recovered tRNAs in the absence (black dots) or presence (red dots) of chemically induced ER stress (copies per million reads: copy number of each tRNA). Lines connecting black and red dots link the same tRNA in both conditions. Individual tRNAs were grouped by codon/anticodon to illustrate the changes in recovered copy number during ER stress. Codons in the X-axis are colored based on codon usage from the codon usage database (http://www.kazusa.or.jp/codon/).
Figure 4—figure supplement 2

tRNAs remain intact during ER stress.
Representative Northern blot of select tRNAs upon induction of ER stress using a probe that recognizes the 3’-end of Gln tRNAs (left), or a probe that recognizes full-length GlnCAG tRNAs (right). Bottom panels: TBE-urea PAGE gels of total RNA extracted from HEK293T cells undergoing a time course of ER stress. Middle panels: Nylon membrane transfers of the gels below. Top panels: Northern blots with the indicated probes on the membranes in the panels below. The IRE1 specific inhibitor 4μ8C (10 μM) was used as a control for specificity. ER stress was induced with 200 nM of thapsigargin.
Figure 5 with 2 supplements

IRE1 and ribosome interact tightly over a well-defined region.
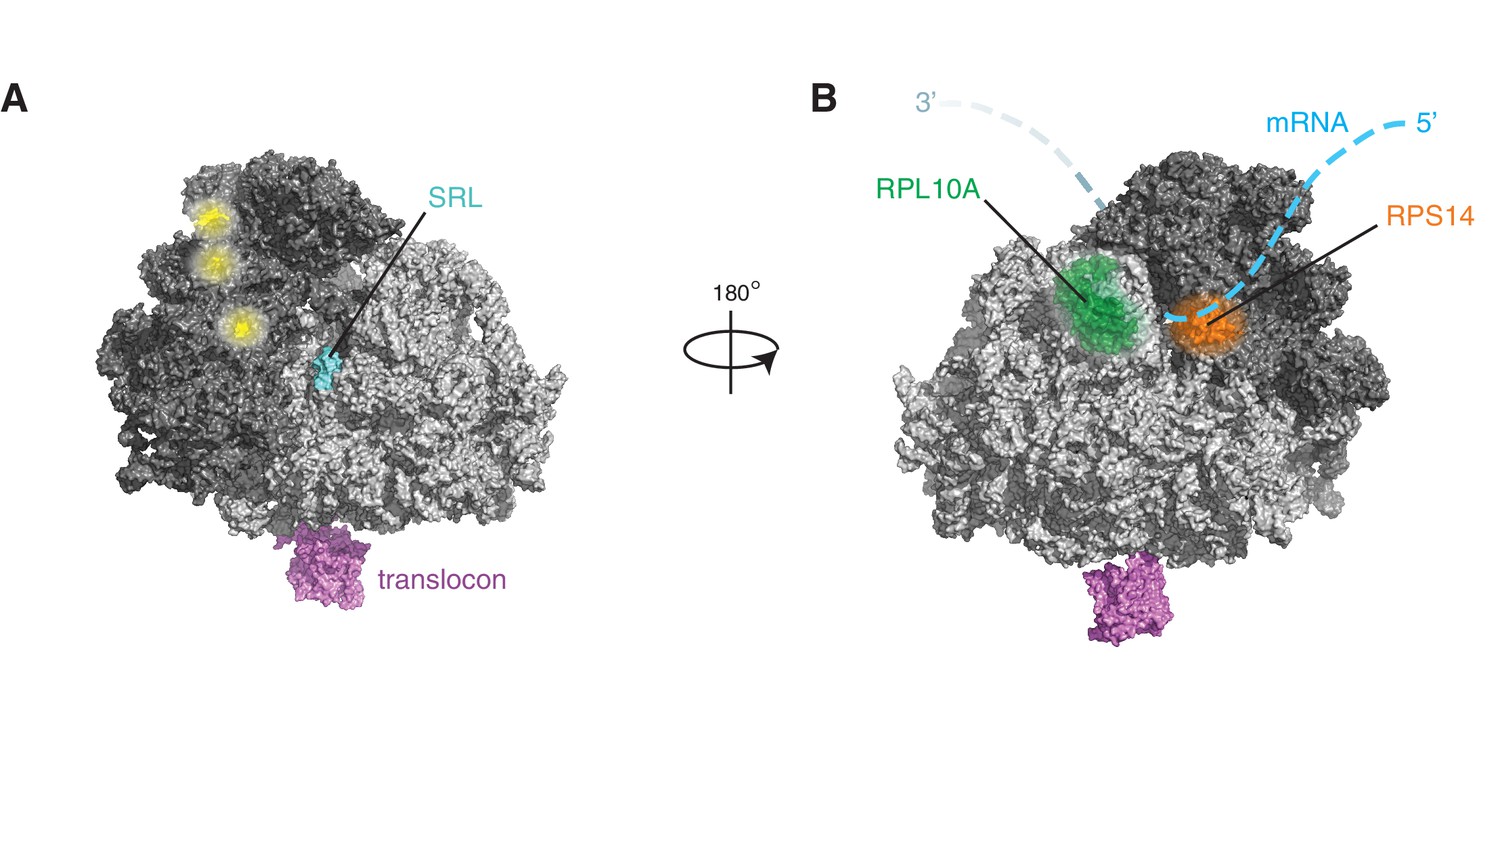
(A) Depiction of the topologies of IRE1 and an ER-bound ribosome docked on the translocon (after PDB accession number 3J7R). The linker tethering IRE1’s transmembrane and kinase/endonuclease domains is drawn to scale assuming an extended conformation. SRL: Sarcin-ricin loop. (B) Topographical localization of the IRE1 crosslink sites on ribosomes identified in PAR-CLIP experiments. Crosslinked regions in ribosomal RNAs (from Figure 4A) are indicated in red. The sarcin-ricin loop in the 60S subunit (colored in cyan) is shown as a topographical reference. Based on published structures with PDB entry 3J7R. (C) Topographical localization of the IRE1 crosslink sites on SRP engaged with the ribosome (PDB accession number 3JAJ). (D) Topographical mapping of the PAR-CLIP identified crosslink sites on tRNAs positioned in the A/P site of a ribosome. Based on PDB accession number 3J7R. (E) Topographical localization of ribosomal proteins crosslinked to IRE1 through RNA bridges and recovered in denaturing IPs. Note that the sites of IRE1-ribosome interaction coalesce in a band stretching from the A-site to the vicinity of the translocon. (F) Scatter plot showing hits obtained in native IRE1 IPs followed by LC/MS analysis of interacting IRE1 protein partners. Relevant hits are indicated. (G) Scatter plot comparing the relative abundance of ribosomal proteins and the relevant proteins SSR2 and RTCB recovered in native IPs and denaturing IPs. Each dot is a single ribosomal protein. Specific proteins recovered in denaturing IPs are indicated. (H) IP-Western blot validations of select IRE1-SRP and IRE1-ribosome interactions.
Figure 5—figure supplement 1

IRE1 crosslink sites mapped onto the secondary structure of the large and small ribosomal subunit RNAs (Petrov et al., 2014).
The red lines over the sequence indicate IRE1 crosslink sites identified by PAR-CLIP.
Figure 5—figure supplement 2
IRE1 associates with specific surfaces on the ribosome.
(A) IRE1 crosslink sites do not coincide with published DDX3 crosslink sites on ribosomes (depicted in yellow) (Oh et al., 2016). (B) Topographical localization of ribosomal proteins crosslinked to IRE1 through RNA bridges and recovered in denaturing IPs which lie adjacent to the mRNA exit site on the ribosome.
Figure 6 with 1 supplement

IRE1 associates with ribosomes and peptide stretches encoded in specific mRNAs.
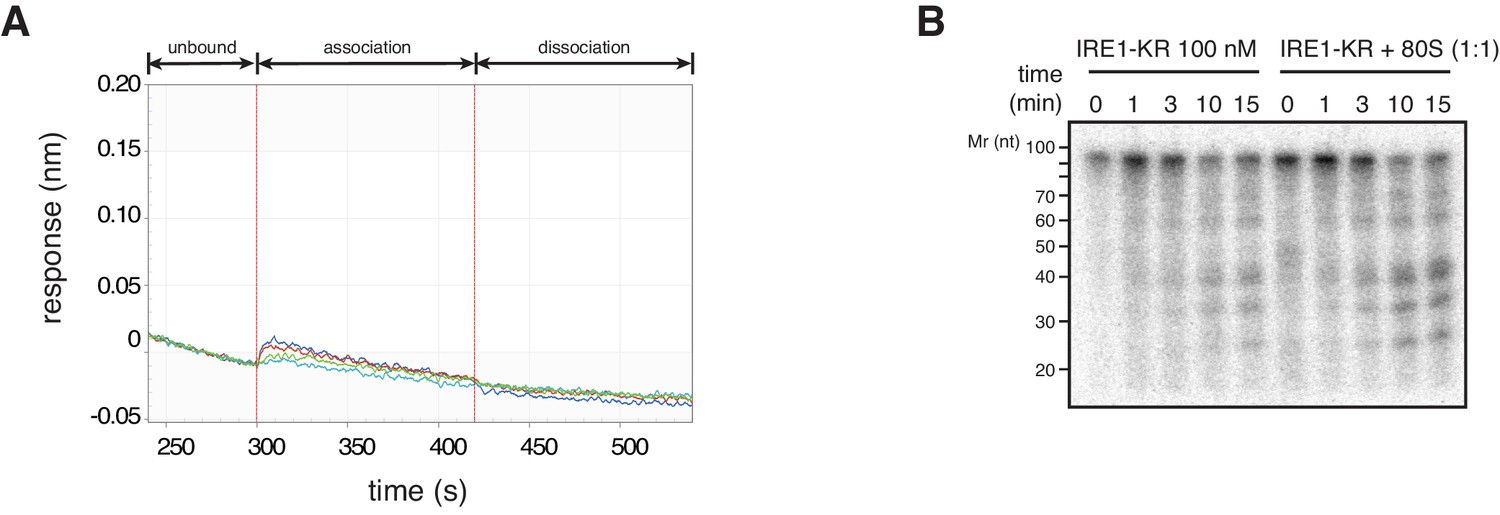
(A) Thermophoresis analysis of IRE1-ribosome binding affinity. A fluorescently labeled cytosolic portion of IRE1 consisting of its kinase and nuclease domains preceded by a 43-residue portion of the linker that tethers the C-terminal kinase/nuclease domains to the ER membrane were employed to assess its binding affinity to purified ribosomes. (B-C) IRE1-KR-ribosome interactions validated by co-sedimentation assays. Immunoblots of the pellets of the sucrose cushions at various ribosome concentrations separated by SDS-PAGE probed with the indicated antibodies. (D) Size exclusion chromatography fractions analyzed by immunoblot showing that IRE1-KR elutes earlier from a Sephacryl-300 column upon binding to ribosomes. The fractions were separated by SDS-PAGE and probed with the indicated antibodies against IRE1 or the ribosomal protein RPL13A. (E) Bio-layer interferometry (BLI) signal of IRE1-KR loaded biosensors dipped into a solution containing ribosomes at the indicated concentrations for the indicated time. The increase in the BLI signal indicates association between IRE1 and ribosomes. Dipping the IRE1-KR coupled sensors into buffer devoid of ribosomes promotes IRE1-ribosome dissociation and the consequent drop in the BLI signal (F) SYBR-gold stained TBE-Urea PAGE gels showing the effects of the presence of purified ribosomes in an in vitro cleavage assay for IRE1-KR employing a minimal 21-mer archetypal substrate RNA corresponding to the 3’ canonical hairpin structure found in the bifurcated stem-loop of XBP1 mRNA of human origin (G) Peptide array immunoblot of 18-mers spotted tiled along proteins encoded by select PAR-CLIP target mRNAs. (H) Quantification of array in G. The schematics illustrate the topology of the proteins encoded by the transcripts.
Figure 6—figure supplement 1
IRE1-KR does not associate with the 60S ribosomal subunit.
(A) Bio-layer interferometry experiments showing that 60S ribosomal subunit does not interact with IRE1-KR. (B) SYBR-gold stained TBE-Urea PAGE gel showing the effects of the presence of purified ribosomes in an in vitro cleavage assay for IRE1-KR employing the minimal the bifurcated stem-loop of XBP1 mRNA of human origin.
Figure 7
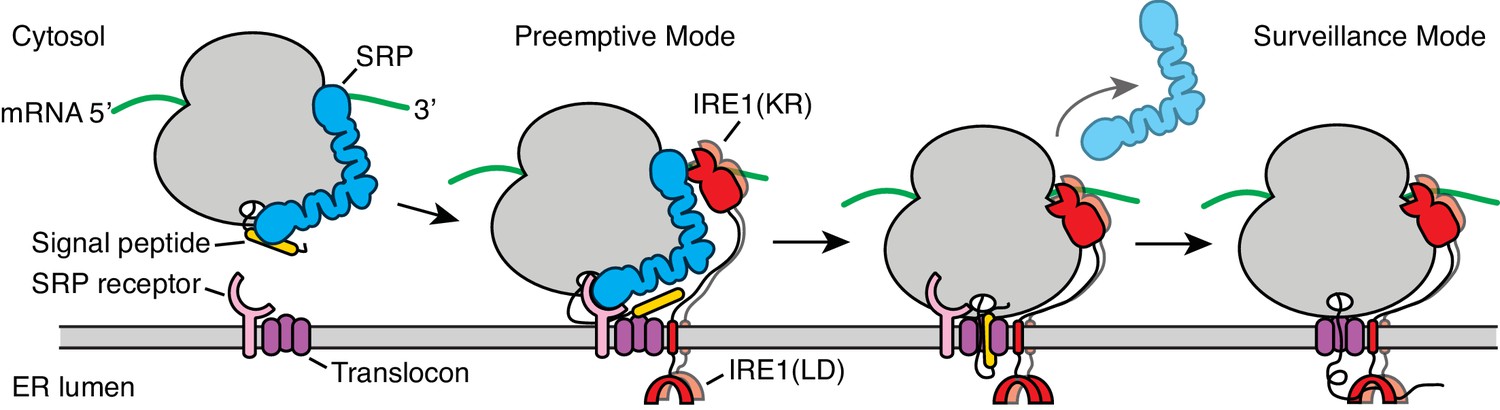
Model for co-translational IRE1 engagement.
The linker tethering IRE1’s transmembrane domain and its kinase/nuclease domains (KR) is drawn to scale as an extended chain. LD: lumenal domain.
Additional files
-
Supplementary file 1
Transcripts recovered in PAR-CLIP experiments performed by pulling-down on epitope-tagged IRE1 in the presence or absence of chemically induced ER-stress.
- https://doi.org/10.7554/eLife.43036.019
-
Supplementary file 2
tRNAs recovered in PAR-CLIP experiments performed by pulling-down on epitope-tagged IRE1 in the presence or absence of chemically induced ER-stress.
- https://doi.org/10.7554/eLife.43036.020
-
Supplementary file 3
IRE1 native IP-MS and PAR-CLIP-MS enriched peptides.
- https://doi.org/10.7554/eLife.43036.021
-
Transparent reporting form
- https://doi.org/10.7554/eLife.43036.022
Download links
A two-part list of links to download the article, or parts of the article, in various formats.
Downloads (link to download the article as PDF)
Open citations (links to open the citations from this article in various online reference manager services)
Cite this article (links to download the citations from this article in formats compatible with various reference manager tools)
The unfolded protein response and endoplasmic reticulum protein targeting machineries converge on the stress sensor IRE1
eLife 7:e43036.
https://doi.org/10.7554/eLife.43036


