Dissociation rate compensation mechanism for budding yeast pioneer transcription factors
- The Ohio State University, United States
- The Pennsylvania State University, United States
Figures
Figure 1 with 6 supplements
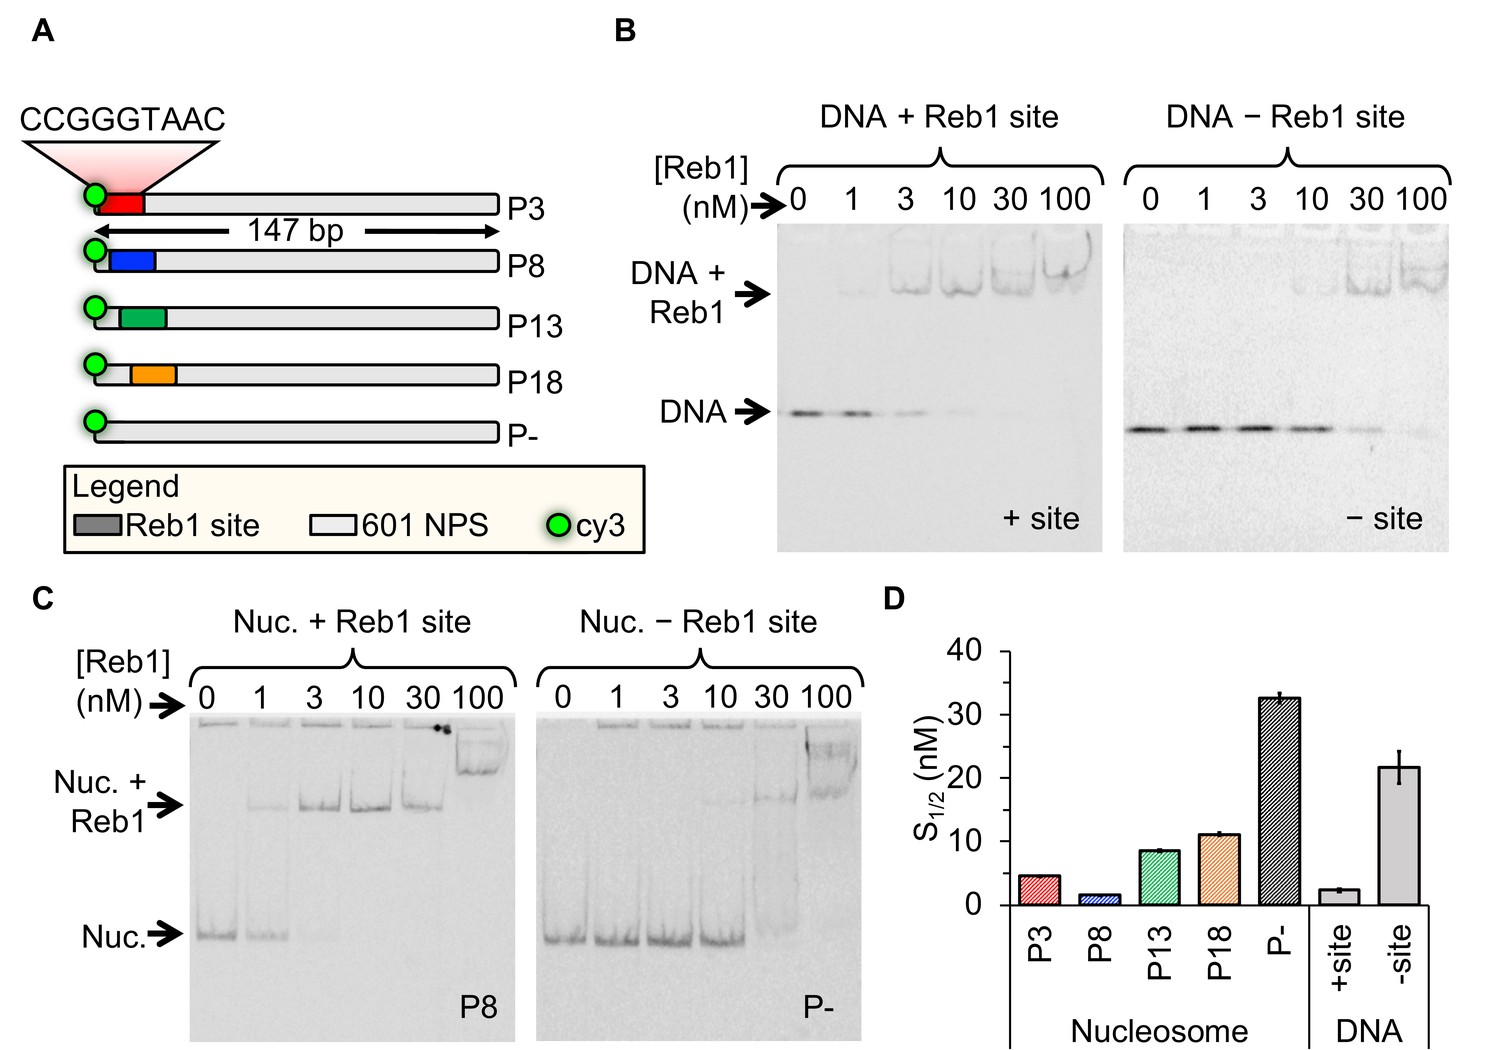
Reb1 binds DNA and nucleosomes with similar affinities.
(A) Design of the modified ‘601’ nucleosome positioning sequences (NPS) used in this study. Colored rectangles represent the Reb1-binding site at positions P3 (red), P8 (blue), P13 (green) and P18 (gold) within the 601 NPS. The numbers indicate the starting position of the Reb1-binding site (in number of base pairs into the 601 NPS). (B) Cy3 image of the EMSA of Reb1 binding to a 25-bp DNA sequence with (left) or without (right) the Reb1-binding site. (C) Cy5 image of the EMSA of Reb1 binding to P8 nucleosomes with (left) or without (right) the Reb1-binding site. (D) Quantification of the S1/2s determined from the Reb1 EMSAs in panels (B) and (C) and in Figure 1—figure supplement 3 (S1/2 Reb1–DNA + site EMSA = 2.3 ± 0.2 nM, S1/2 Reb1–DNA – site EMSA = 21.7 ± 2.3 nM, S1/2 Reb1–Nuc P3 EMSA = 4.6 ± 0.1 nM, S1/2 Reb1–Nuc P8 EMSA = 1.5 ± 0.1 nM, S1/2 Reb1–Nuc P13 EMSA = 8.5 ± 0.2 nM, S1/2 Reb1–Nuc P18 EMSA = 11.2 ± 0.3 nM, S1/2 Reb1–Nuc P – EMSA = 32.7 ± 0.8 nM). These results show that Reb1 binds nucleosomes and DNA sites specifically with a similar S1/2.
Figure 1—figure supplement 1
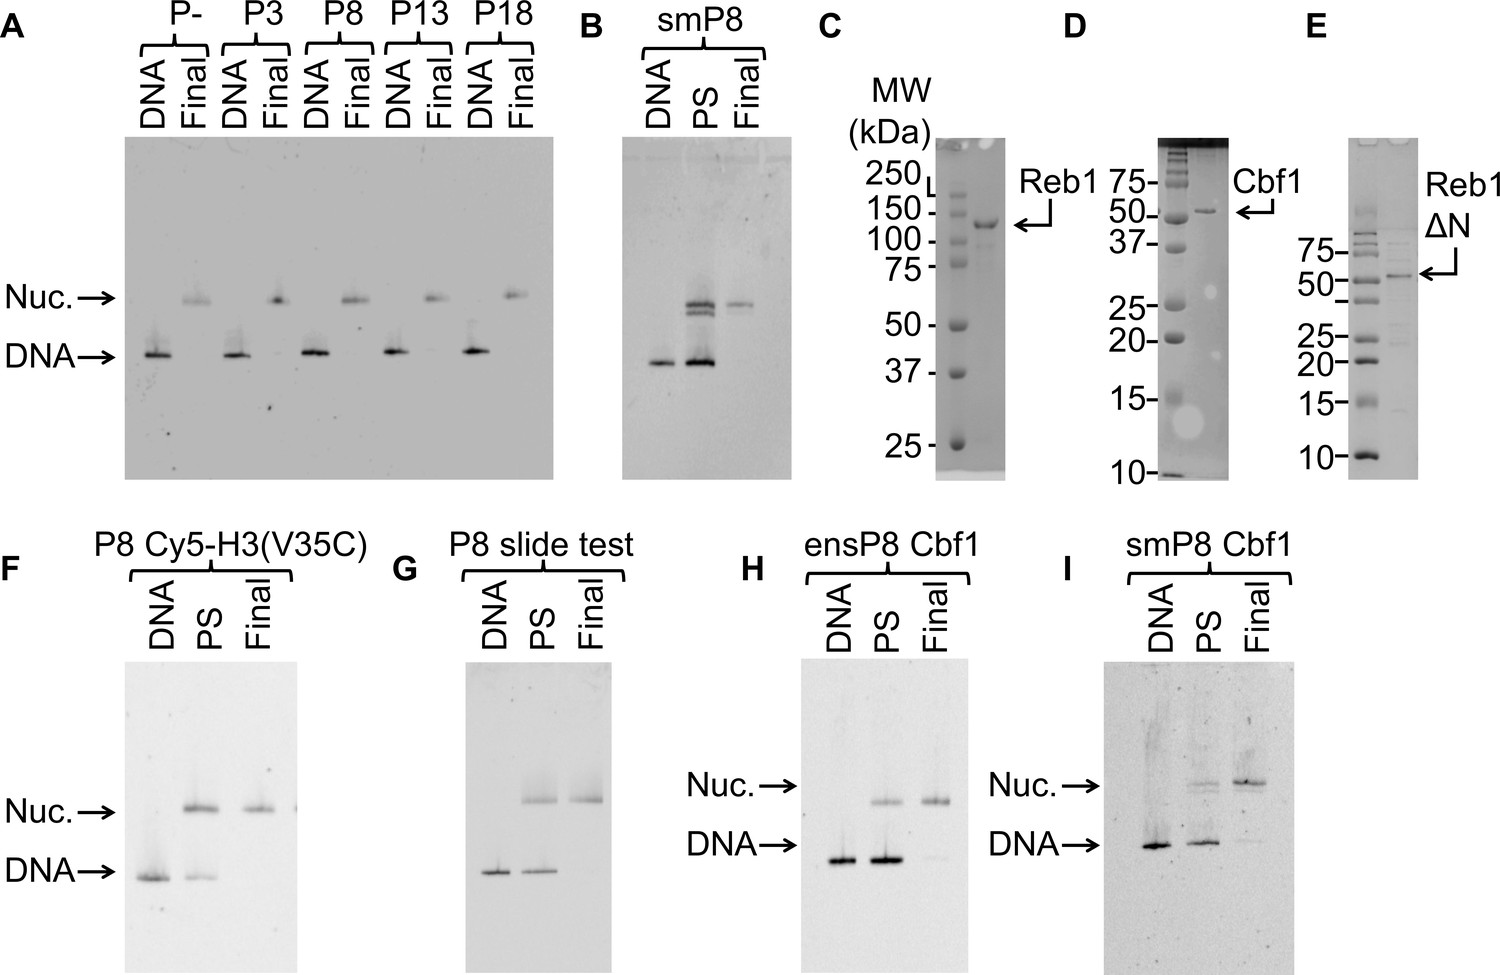
Nucleosomes and TFs used in this study.
For all nucleosome gels: ‘DNA’ = free DNA, ‘PS’ = nucleosomes pre-sucrose gradient purification, and ‘Final’ = final nucleosomes used for experiments. (A) Cy3 fluorescence image of the EMSA used to quantify the purity of the 147-bp reconstituted P–, P3, P8, P13 and P18 nucleosomes used in the ensemble Reb1–nucleosome experiments. (B) Cy3 fluorescence image of the EMSA of nucleosomes with the Reb1-binding site and a 75-bp linker used for the single molecule experiments. (C) Image of the the Coomassie-stained SDS-PAGE gel of purified Reb1 used in this study. (D) Image of the the Coomassie-stained SDS-PAGE gel of purified Cbf1 used in this study. (E) Image of the Coomassie-stained SDS-PAGE gel of purified Reb1ΔN used in this study. (F) Cy3 fluorescence image of the EMSA of the nucleosomes labeled with Cy5 at H3(V35C) used for for FRET. (G) Cy3 images of the EMSA of the nucleosomes used to test for Reb1-induced nucleosome repositioning. These nucleosomes contain a Reb1-binding site opposite the Cy3 fluorophore. We used 167-bp DNA for this assay. (H) Cy3 images of the EMSA of the 147-bp nucleosomes containing the Cbf1-binding site at P8 used for ensemble FRET experiments. (I) Cy3 images of the EMSA of the 222-bp nucleosomes containing the Cbf1-binding site at P8 used for smFRET experiments.
Figure 1—figure supplement 2
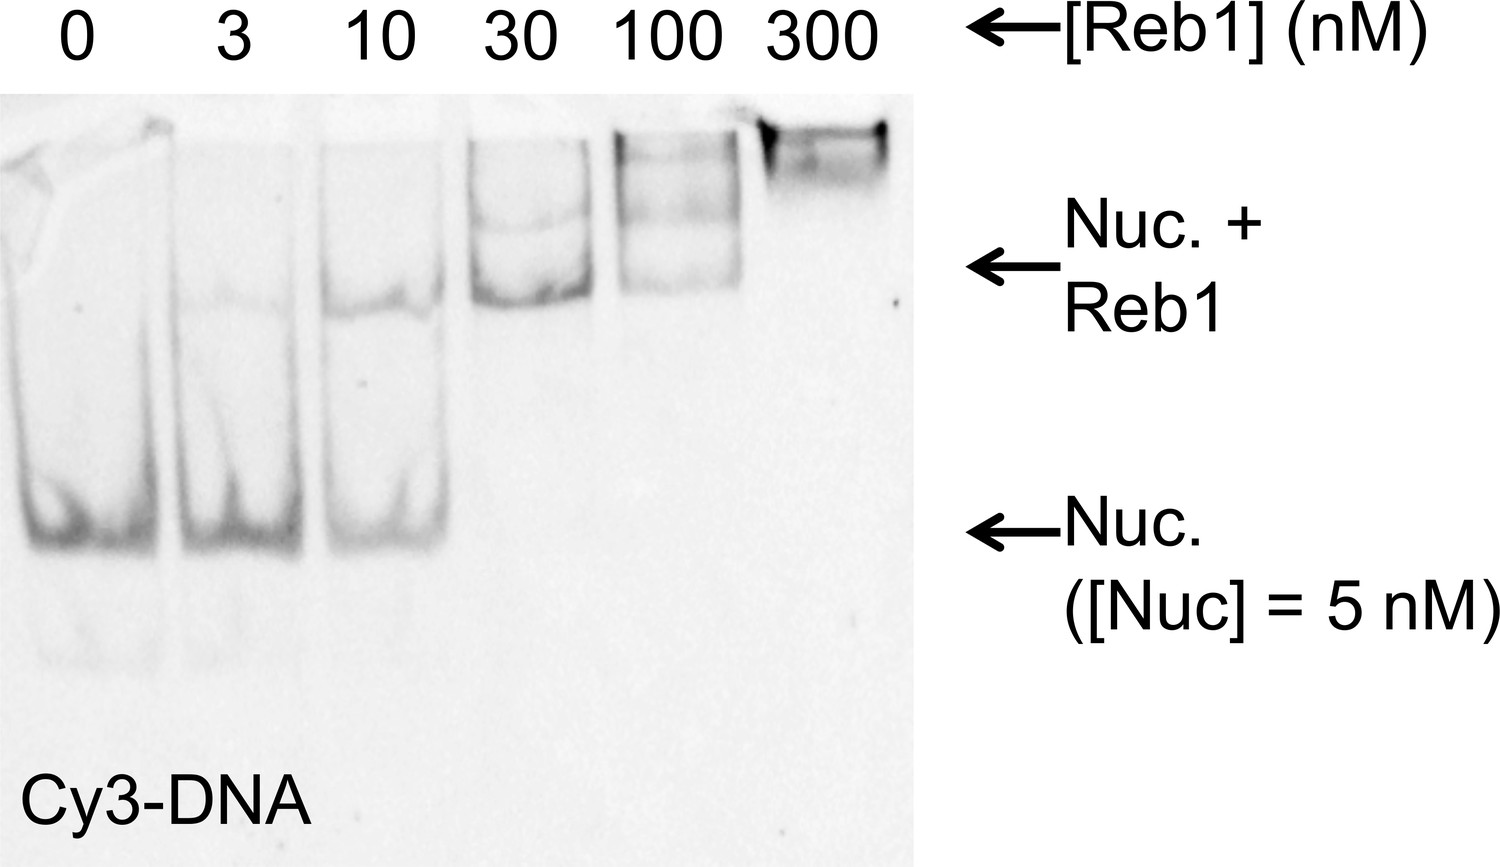
The Reb1–nucleosome bound complex in EMSAs.
Cy3 images of the EMSA of Reb1 binding to nucleosomes containing Cy5-H2A(K119C). This demonstrates that the Reb1 shifted complex contains Cy3-DNA. This, combined with Figure 1C, demonstrates that the Reb1 binds a stable nucleosome complex.
Figure 1—figure supplement 3
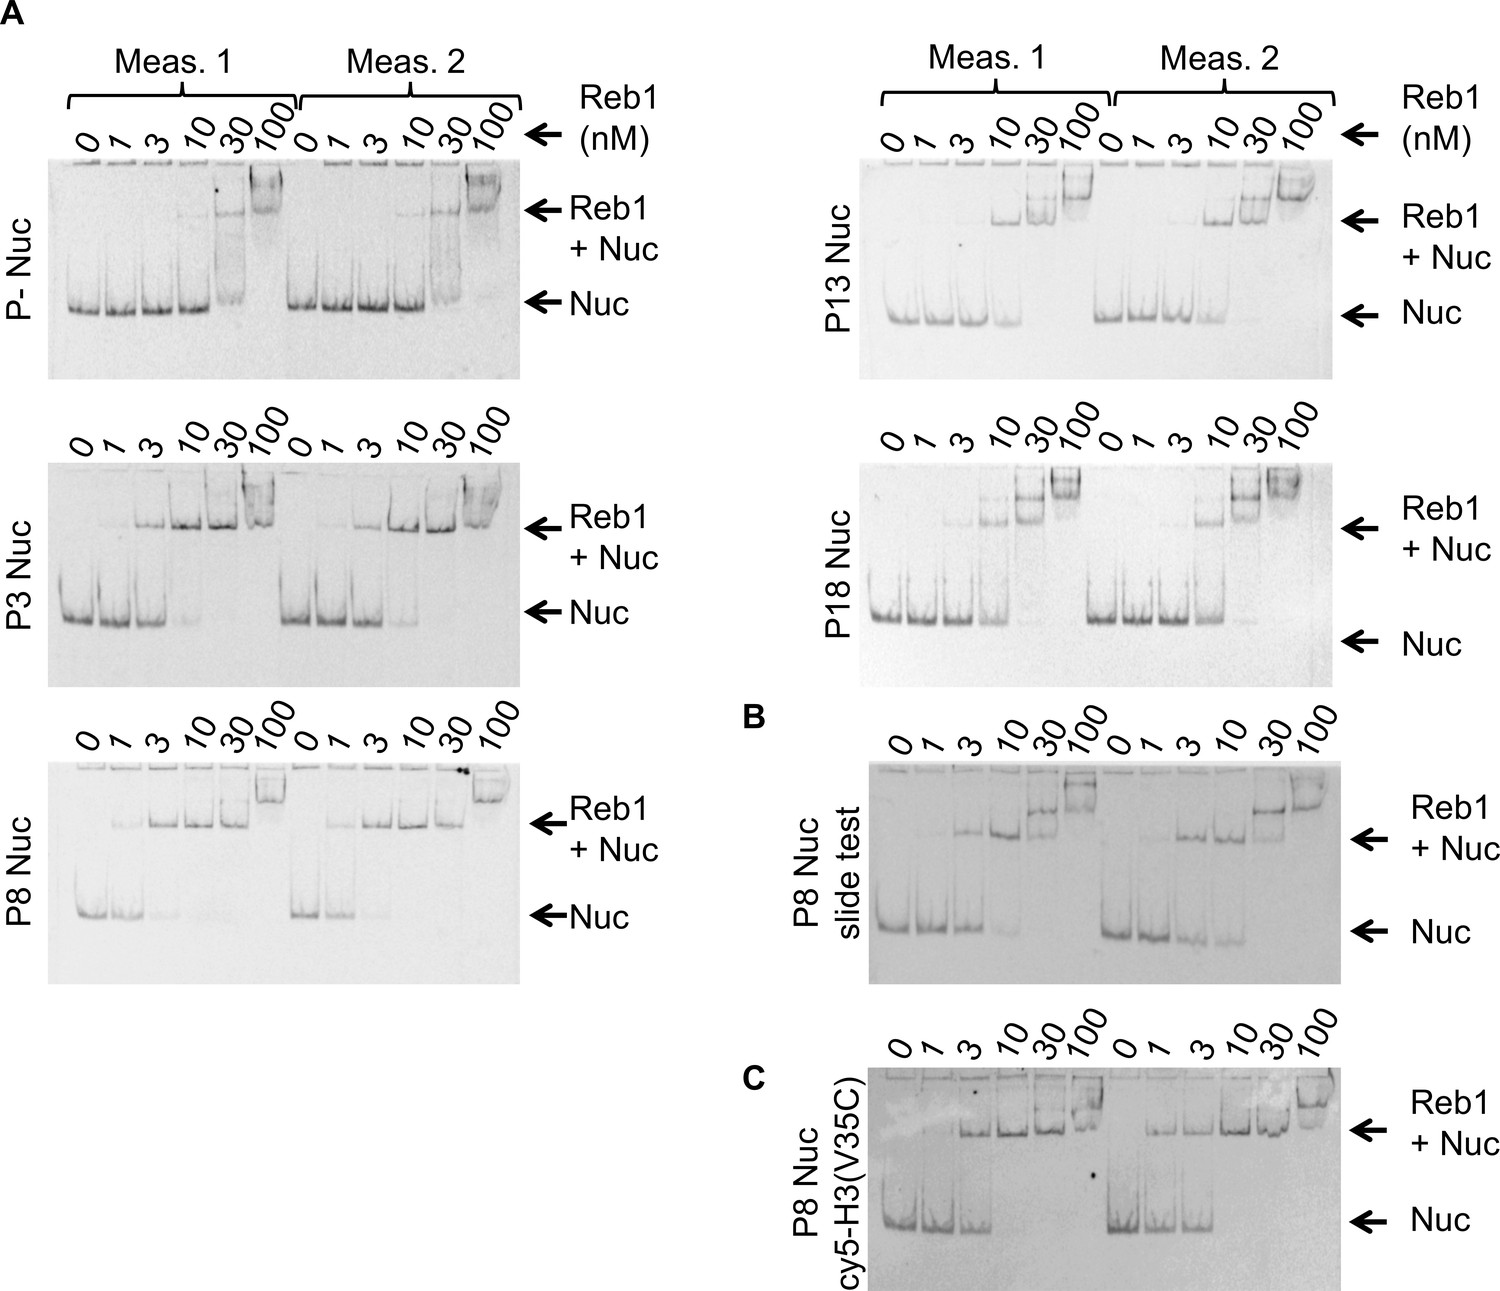
Reb1 nucleosome EMSAs.
(A) Cy5 images of Reb1–nucleosome EMSAs. We define position of the binding site in the 601 sequence as'Px’ where ‘x’ represents the beginning of the Reb1-binding site. P– are nucleosomes without the Reb1-binding site. All EMSA measurements were performed in duplicate. (B) Cy5 image of the Reb1–nucleosome EMSA used to test for Reb1-induced nucleosome repositioning, referred to as ‘Reb1-slide.’ (C) Cy5 image of the Reb1–nucleosome EMSA using nucleosomes Cy5 labeled at H3(V35C).
Figure 1—figure supplement 4
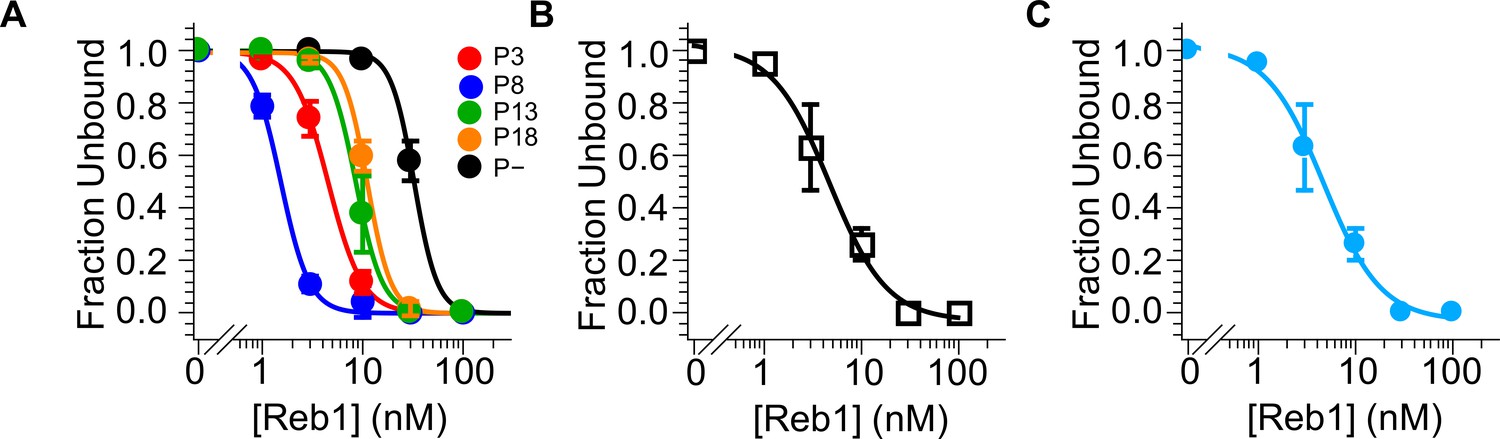
Reb1–nucleosome EMSA fits.
Binding curves generated from data in Figure 1—figure supplement 3. (A) Binding curves for P3, P8, P13, P18, and P– Reb1-nucleosome EMSAs. (B) Binding curves for the Reb1-slide nucleosome EMSA. (C) Binding curve for the Reb1–Cy5-H3(V35C) nucleosome EMSA.
Figure 1—figure supplement 5
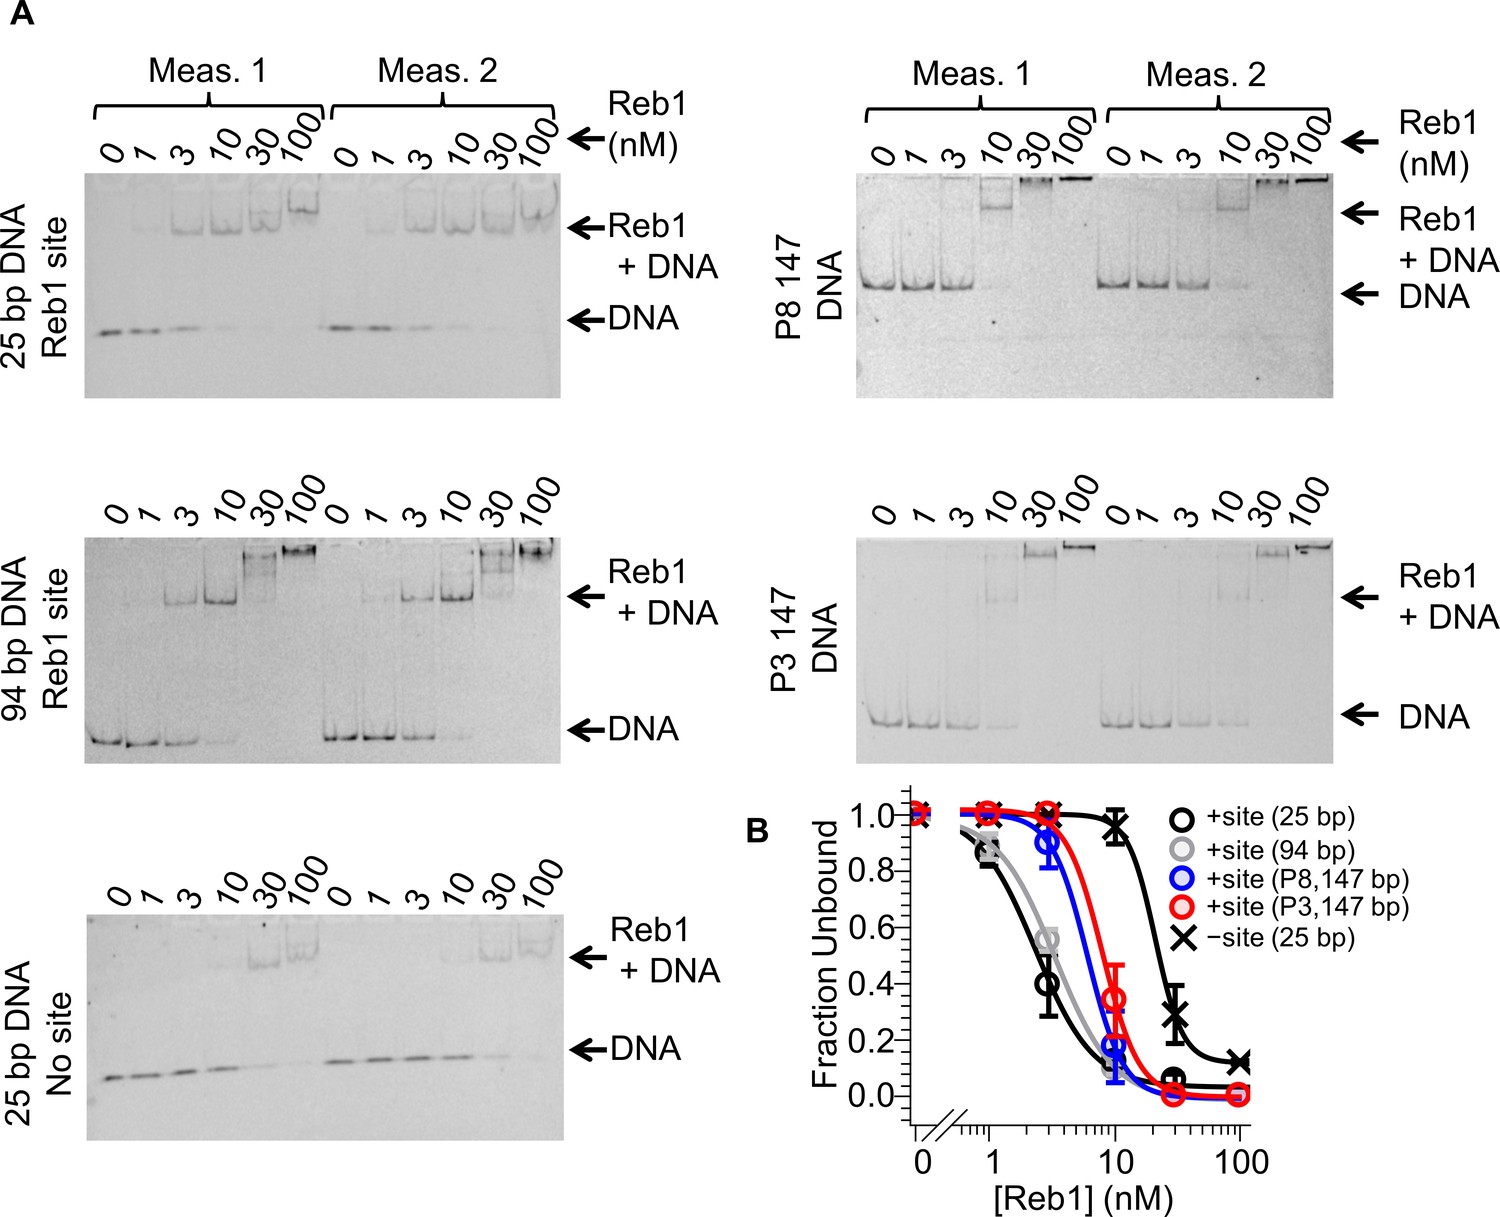
Reb1–DNA EMSAs.
Cy3 images of EMSAs used to quantify Reb1 binding to DNA constructs with and without the Reb1-binding site. (A) 25-bp DNA and 94-bp DNA used for smPIFE experiments, as well as 25-bp DNA without the Reb1 binding site, P8 147-bp DNA and P3 147-bp DNA. (B) Binding curves fit to these data.
Figure 1—figure supplement 6
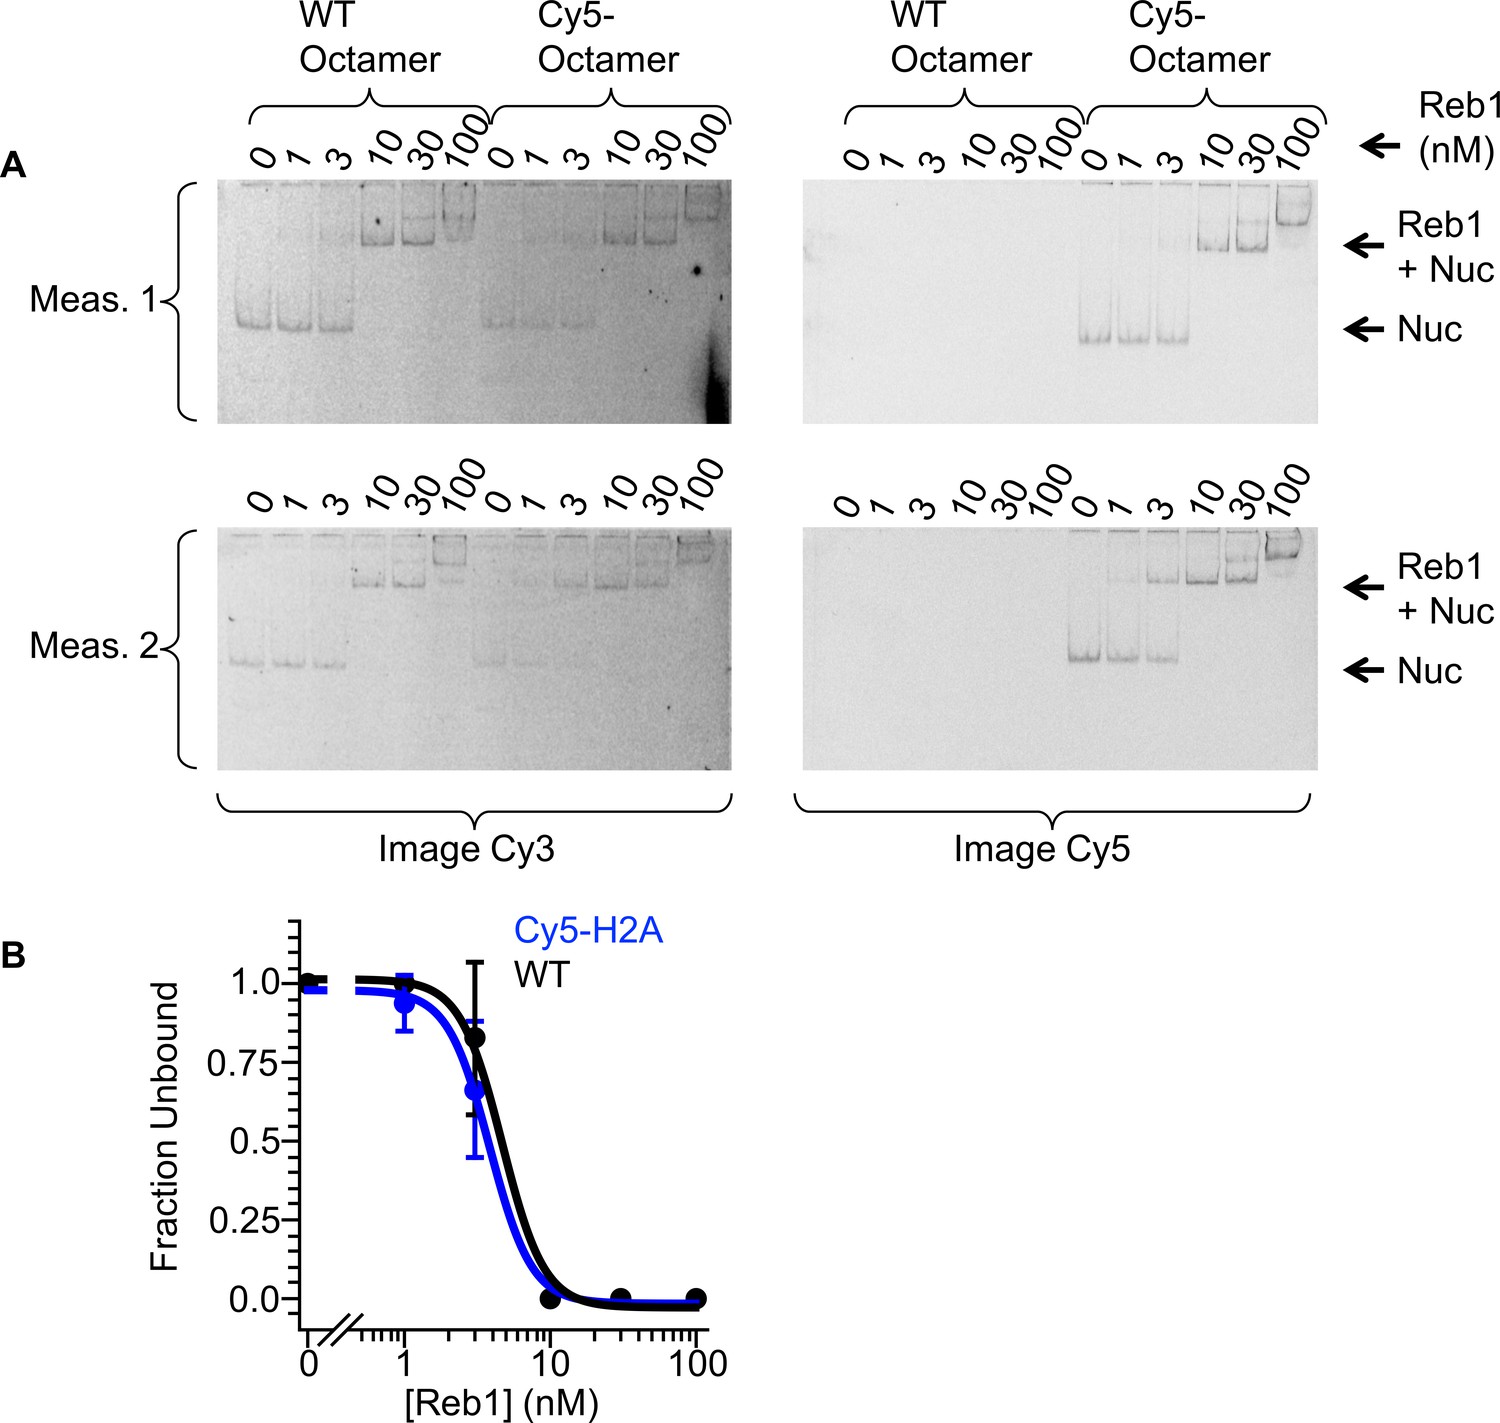
Comparison of Reb1-binding affinities to labeled and unlabeled octamers.
(A) Cy3 and Cy5 images of Reb1 binding to nucleosomes reconstituted with a WT octamer or with a Cy5-octamer, visualized with EMSAs. (B) Binding curves that are fitted to these data reveal similar affinity to these two nucleosomes (S1/2 Reb1–Nuc unlabeled Octamer = 4.7 ± 0.5 nM, S1/2 Reb1–Nuc Cy5 octamer = 3.8 ± 0.2 nM).
Figure 2 with 2 supplements
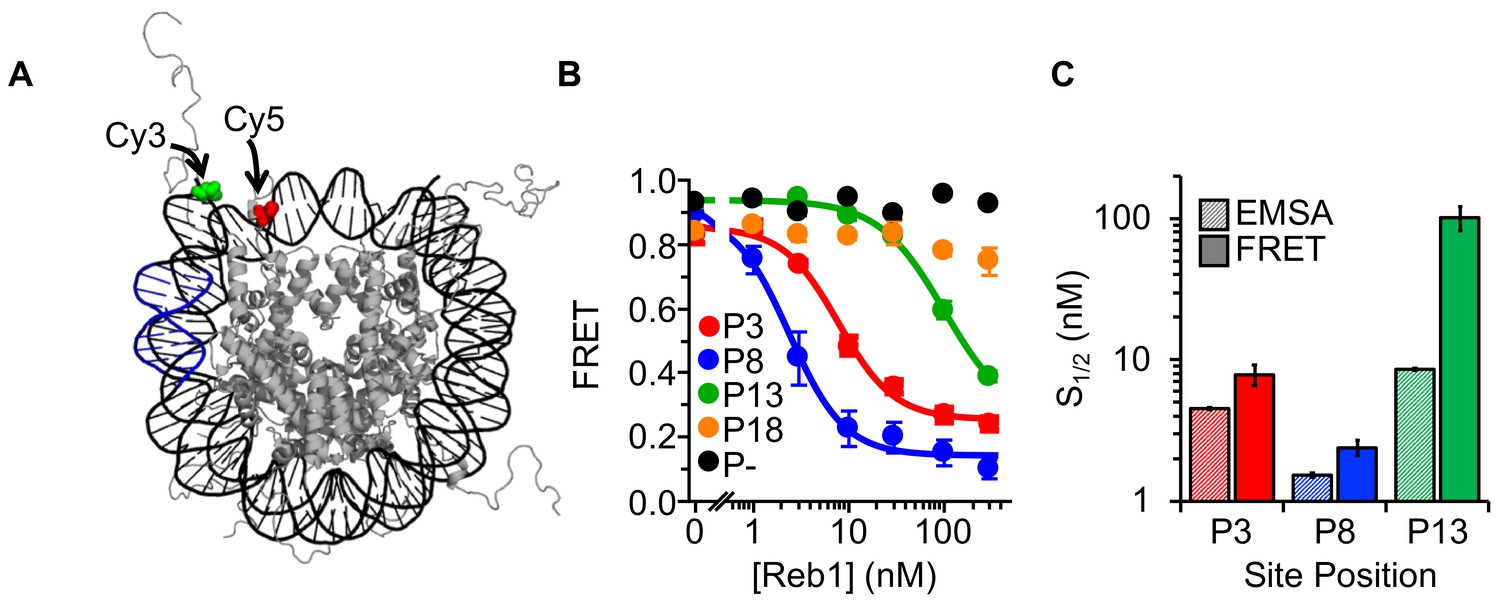
Reb1 binding induces nucleosome structural change.
(A) Nucleosome structure (Davey et al., 2002) containing the internal FRET pair used in this study. Cy3 is attached to the 5′ end of the DNA NPS and adjacent to the Reb1 binding site (blue). The octamer is labeled with Cy5 at H2A(K119C). When fully wrapped, the nucleosome is in a high FRET state. (B) Nucleosome FRET efficiency measurements while titrating Reb1 with the nucleosome constructs: P3 (red), P8 (blue), P13 (green), P18 (gold), or no binding site (P–, black). Reb1 titrations with P3, P8, and P13 nucleosomes fit to binding isotherms with S1/2 Reb1–Nuc P3 FRET = 7.9 ± 1.3 nM, S1/2 Reb1–Nuc P8 FRET = 2.4 ± 0.3 nM, S1/2 Reb1–Nuc P13 FRET = 101.5 ± 19.1 nM. We do not observe a significant ΔFRET for P18 and P– nucleosomes. (C) Comparison of the S1/2 values obtained from EMSA and FRET experiments. For P3 and P8 nucleosomes, the FRET S1/2 values are in close agreement to the EMSA S1/2 values, indicating that ΔFRET is a measure of Reb1 binding to nucleosomes.
Figure 2—figure supplement 1
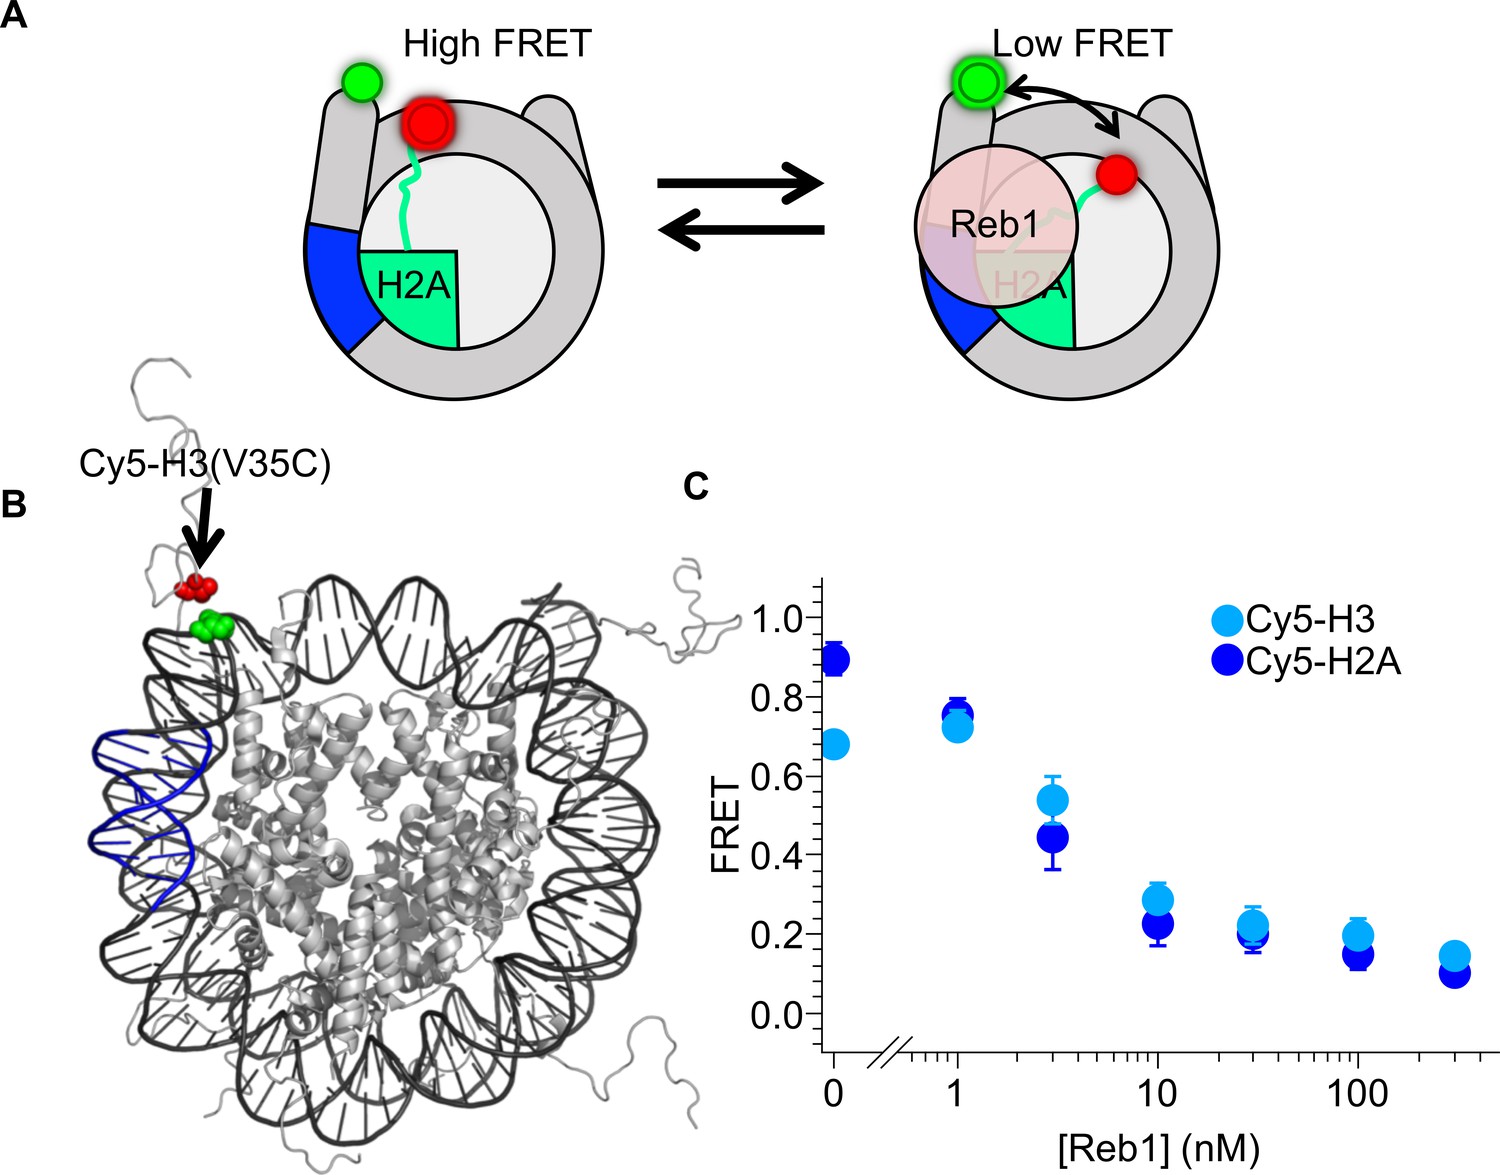
Reb1-induced nucleosome ΔFRET is not the result of structural changes in the H2A C-terminal domain.
(A) Nucleosome states representing one explanation for the observed Reb1-induced ΔFRET, which is that Reb1 distorts the H2A C-terminal domain. (B) Nucleosome structure (Davey et al., 2002) with the Reb1-binding site in blue, Cy3 in green and Cy5 that is attached to H3(V35C) in red. Cy3 and Cy5 undergo efficient energy transfer when the nucleosome is fully wrapped. (C) Plot of the FRET efficiency of these nucleosomes when Reb1 is titrated. We observe a similar decrease in FRET for Cy5-H3(V35C) (cyan) nucleosomes as for Cy5-H2A(K119C) (blue). This result demonstrates that the Reb1-dependent ΔFRET does not result from structural changes in H2A and instead is due to a structural change affecting the DNA and the entire octamer.
Figure 2—figure supplement 2
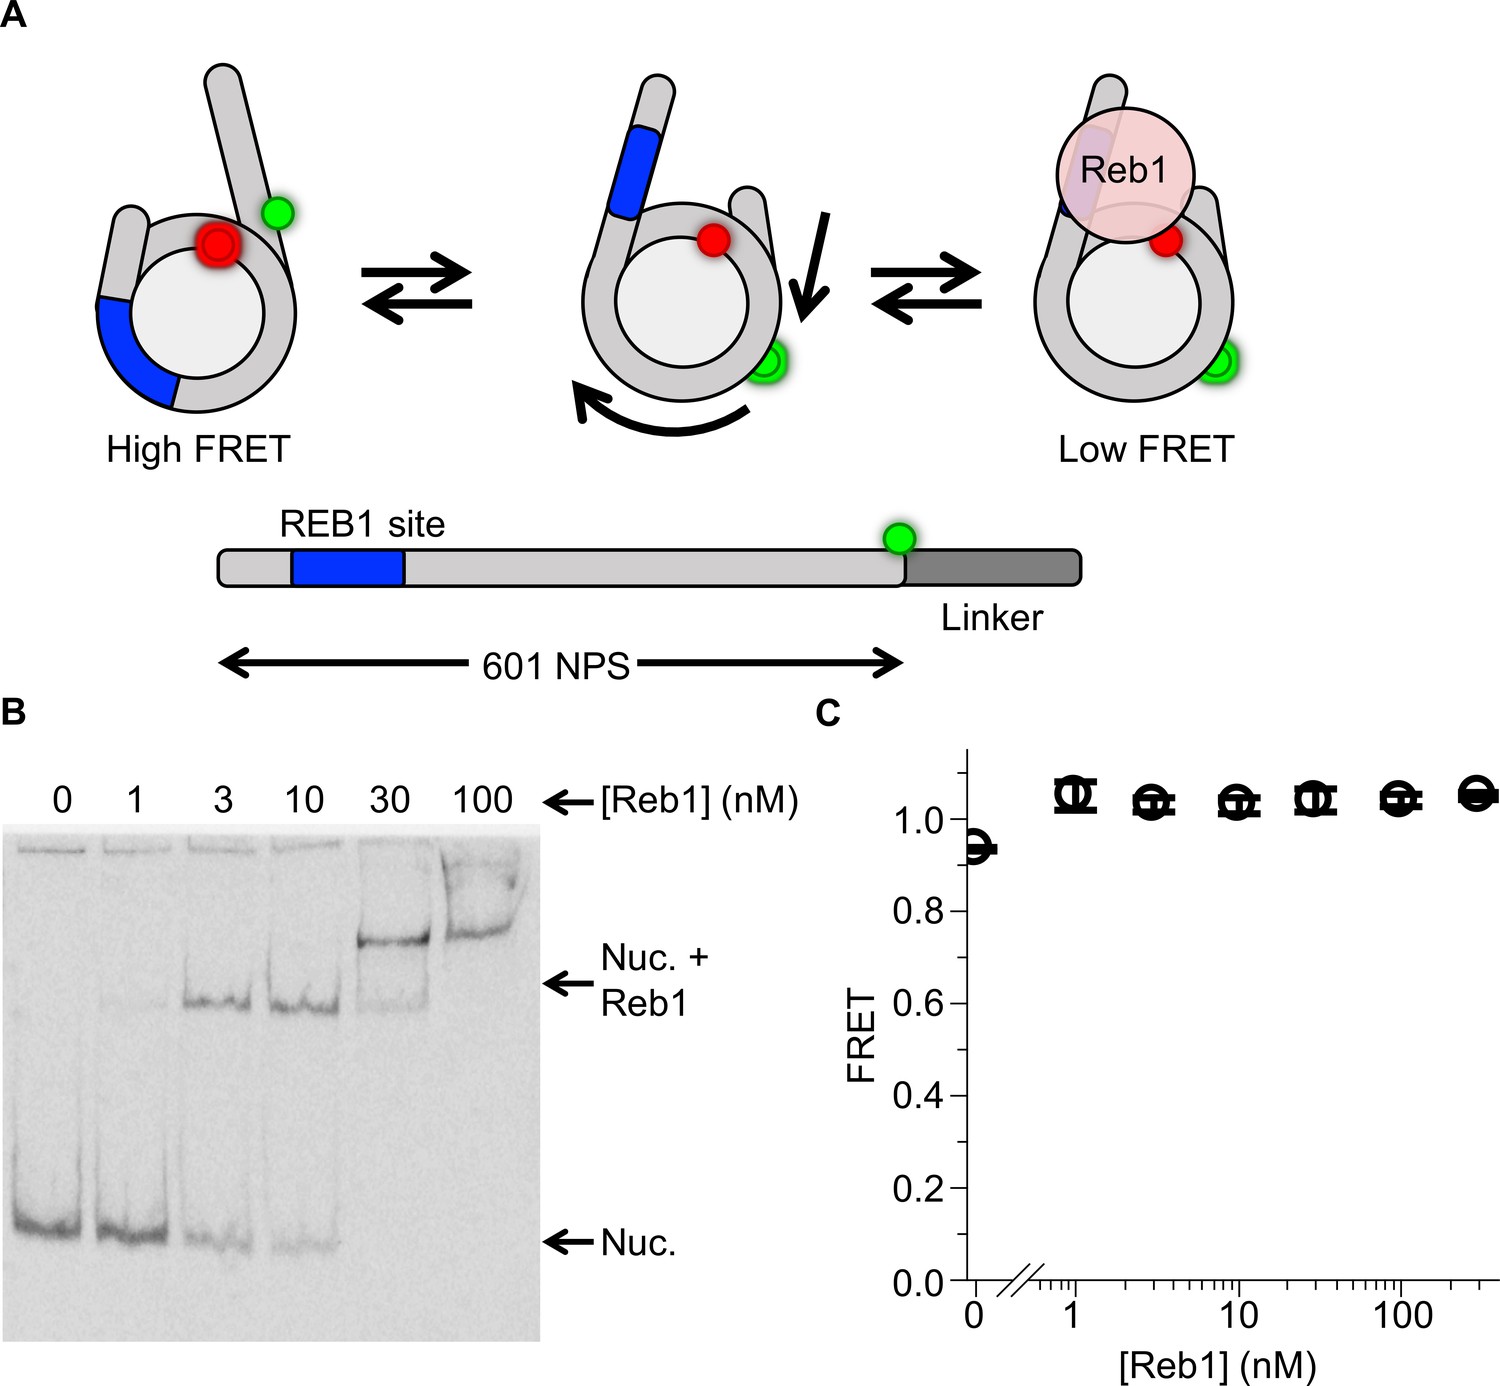
Reb1 does not trap nucleosomes in a repositioned state.
(A) Nucleosome states that represent a second possible explanation for the Reb1-dependent change in FRET, which is that Reb1 binds to repositioned nucleosomes that expose its binding site. To test this, we prepared 167-bp nucleosomes containing a Cy3 fluorophore and a 20-bp linker opposite the P8 Reb1-binding site. The octamer was labeled at H2A(K119C). (B) Cy5 image of the EMSA determining that Reb1 binds these nucleosomes. (C) A plot of the FRET efficiency from these nucleosomes as Reb1 is titrated. The FRET efficiency does not decrease as Reb1 is titrated over the concentration range in which it binds nucleosomes. This result proves that the Reb1-dependent ΔFRET is not due to nucleosome repositioning.
Figure 3 with 1 supplement
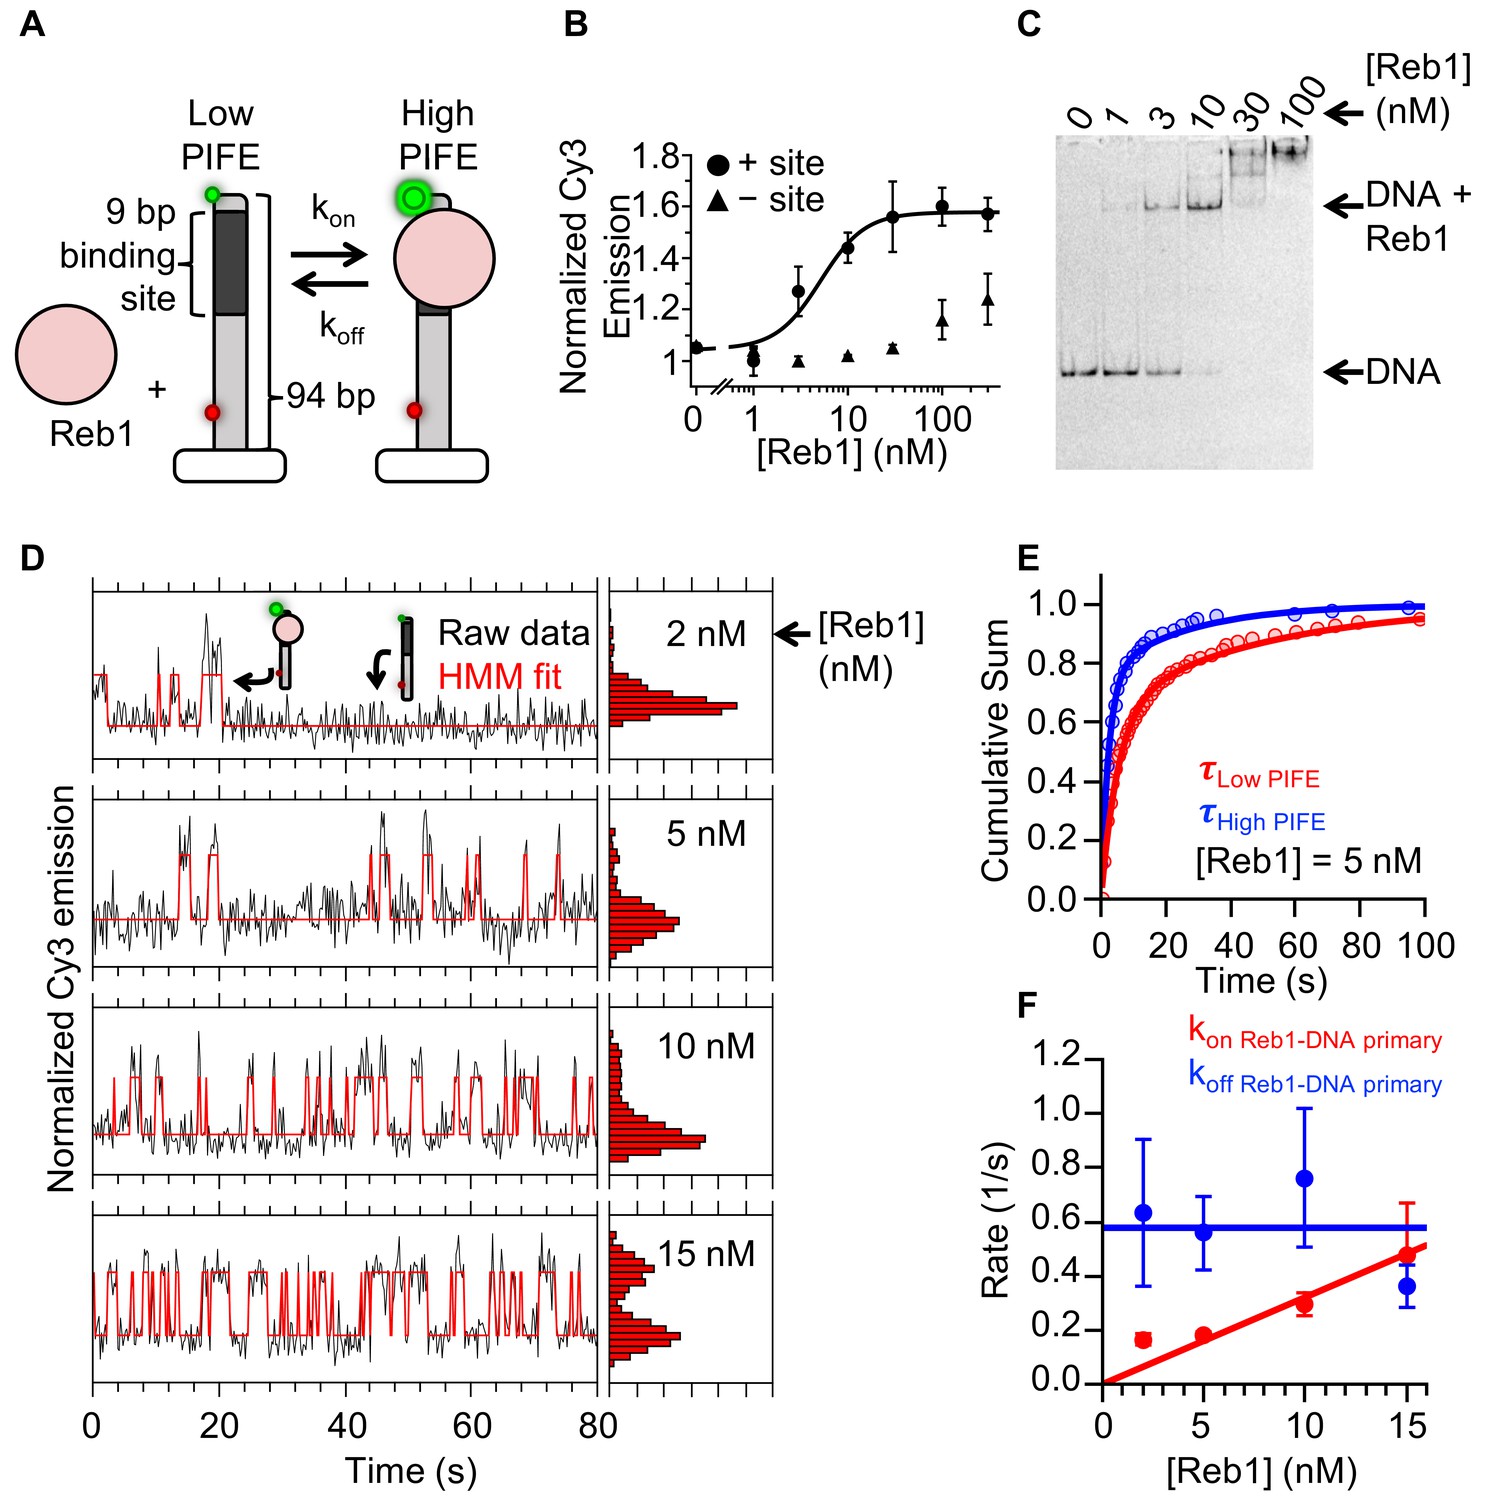
Reb1 rapidly binds to and dissociates from fully exposed DNA-binding sites.
(A) Design of the smPIFE measurements. The 94-bp DNA molecule with the Reb1-binding site 1 bp from the Cy3-labeled 5′ end was immobilized on a quartz surface through a biotin–streptavidin linkage. DNA molecules are also Cy5-labeled, and we only analyzed molecules with signals in both Cy3 and Cy5. (B) Reb1 titration with the smPIFE DNA results in a Cy3 emission increase of ~1.5-fold and fits to a binding isotherm with an S1/2 Reb1–DNA PIFE = 5.1 ± 0.2 nM. Without the binding site, the Cy3 emission does not change until 100 nM, demonstrating that the observed PIFE is due to site-specific Reb1 binding. (C) Cy3 image of the EMSA of Reb1 binding to the smPIFE DNA molecule. Reb1 binding is similar to that observed for the 25 bp DNA molecule (S1/2 Reb1–DNA EMSA = 3.4 ± 0.1 nM). (D) Example time traces of single DNA molecules with four separate Reb1 concentrations, where the black lines are the Cy3 fluorescence and the red lines are the two-state Hidden Markov Model (HMM) fits. As the Reb1 concentration increases, the immobilized DNA molecules shift to the high PIFE state. (E) Example cumulative sums of low PIFE (red) and high PIFE (blue) dwell times that are fit with double exponentials. The Reb1 concentration is 5 nM. (F) The primary Reb1–DNA binding (red) and dissociation (blue) rates at four Reb1 concentrations. The dissociation rates are constant with an average rate of koff Reb1–DNA primary = 0.58 ± 0.08 s−1, while the binding rate increases with Reb1 concentration. The overall binding rate is determined by fitting to a line whose slope represents the binding rate, kon Reb1–DNA primary = 0.032 ± 0.003 s−1 nM−1.
Figure 3—figure supplement 1
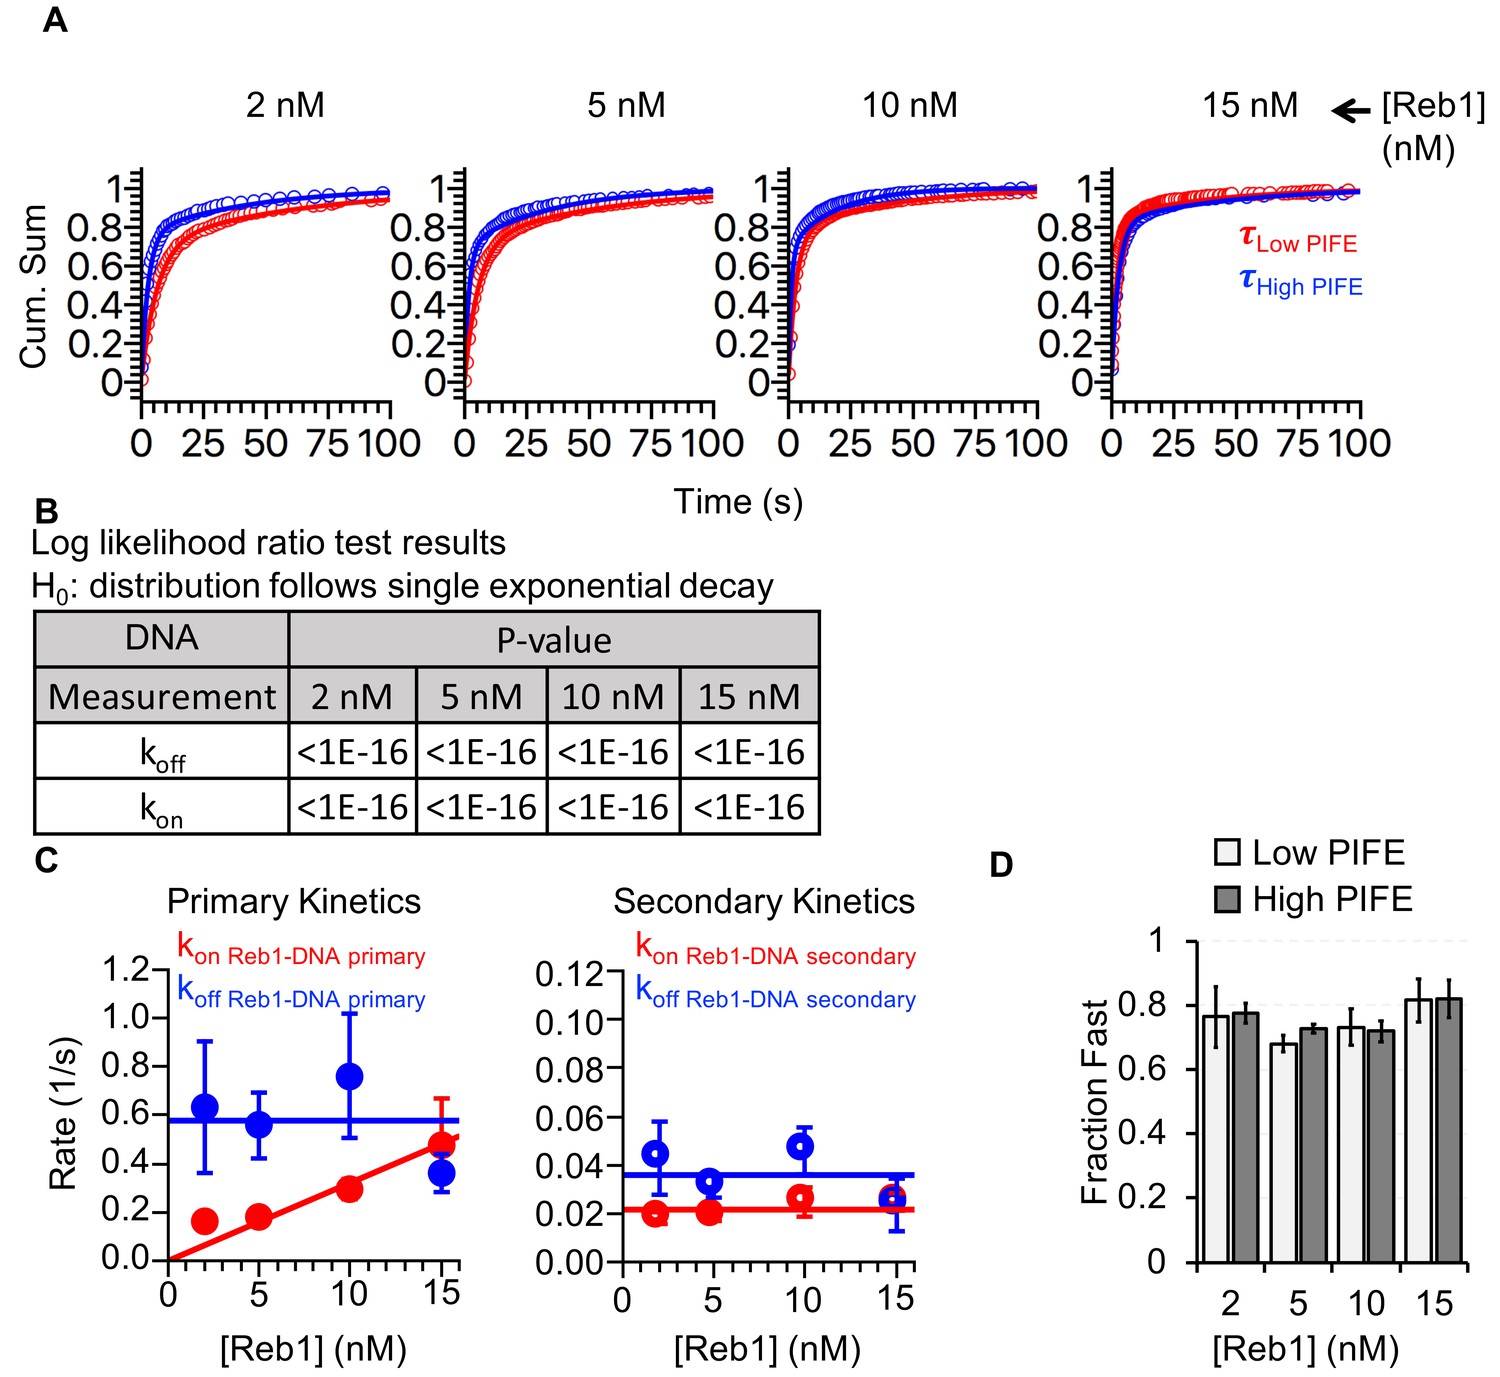
Reb1-binding and -dissociation rates for interactions with DNA.
(A) Cumulative sums of low PIFE (red) and high PIFE (blue) dwell times on DNA at each Reb1 concentration. (B) Table of the log-likelihood ratio to test if the assumption that a cumulative sum fits to a double exponential. If the result is more than 0.01 for three of the Reb1 concentrations, we reject the assumption and fit with a single exponential. For Reb1–DNA, both unbound and bound cumulative sums follow double-exponentials. (C) Plots of primary and secondary rates for Reb1 low PIFE ⇒ high PIFE and high PIFE ⇒ low PIFE transitions at increasing Reb1 concentrations. These are determined from the exponential fits of the cumulative sums in panel (A). (D) The fraction of PIFE transitions belonging to the fast population for low PIFE ⇒ high PIFE transitions (light grey) and high PIFE ⇒ low PIFE transitions (dark grey) for increasing Reb1 concentrations. For both types of transitions, the faster rates accounted for ~75% of the binding and dissociation events.
Figure 4 with 1 supplement

Reb1 binds and dissociates from nucleosomes significantly slower than DNA.
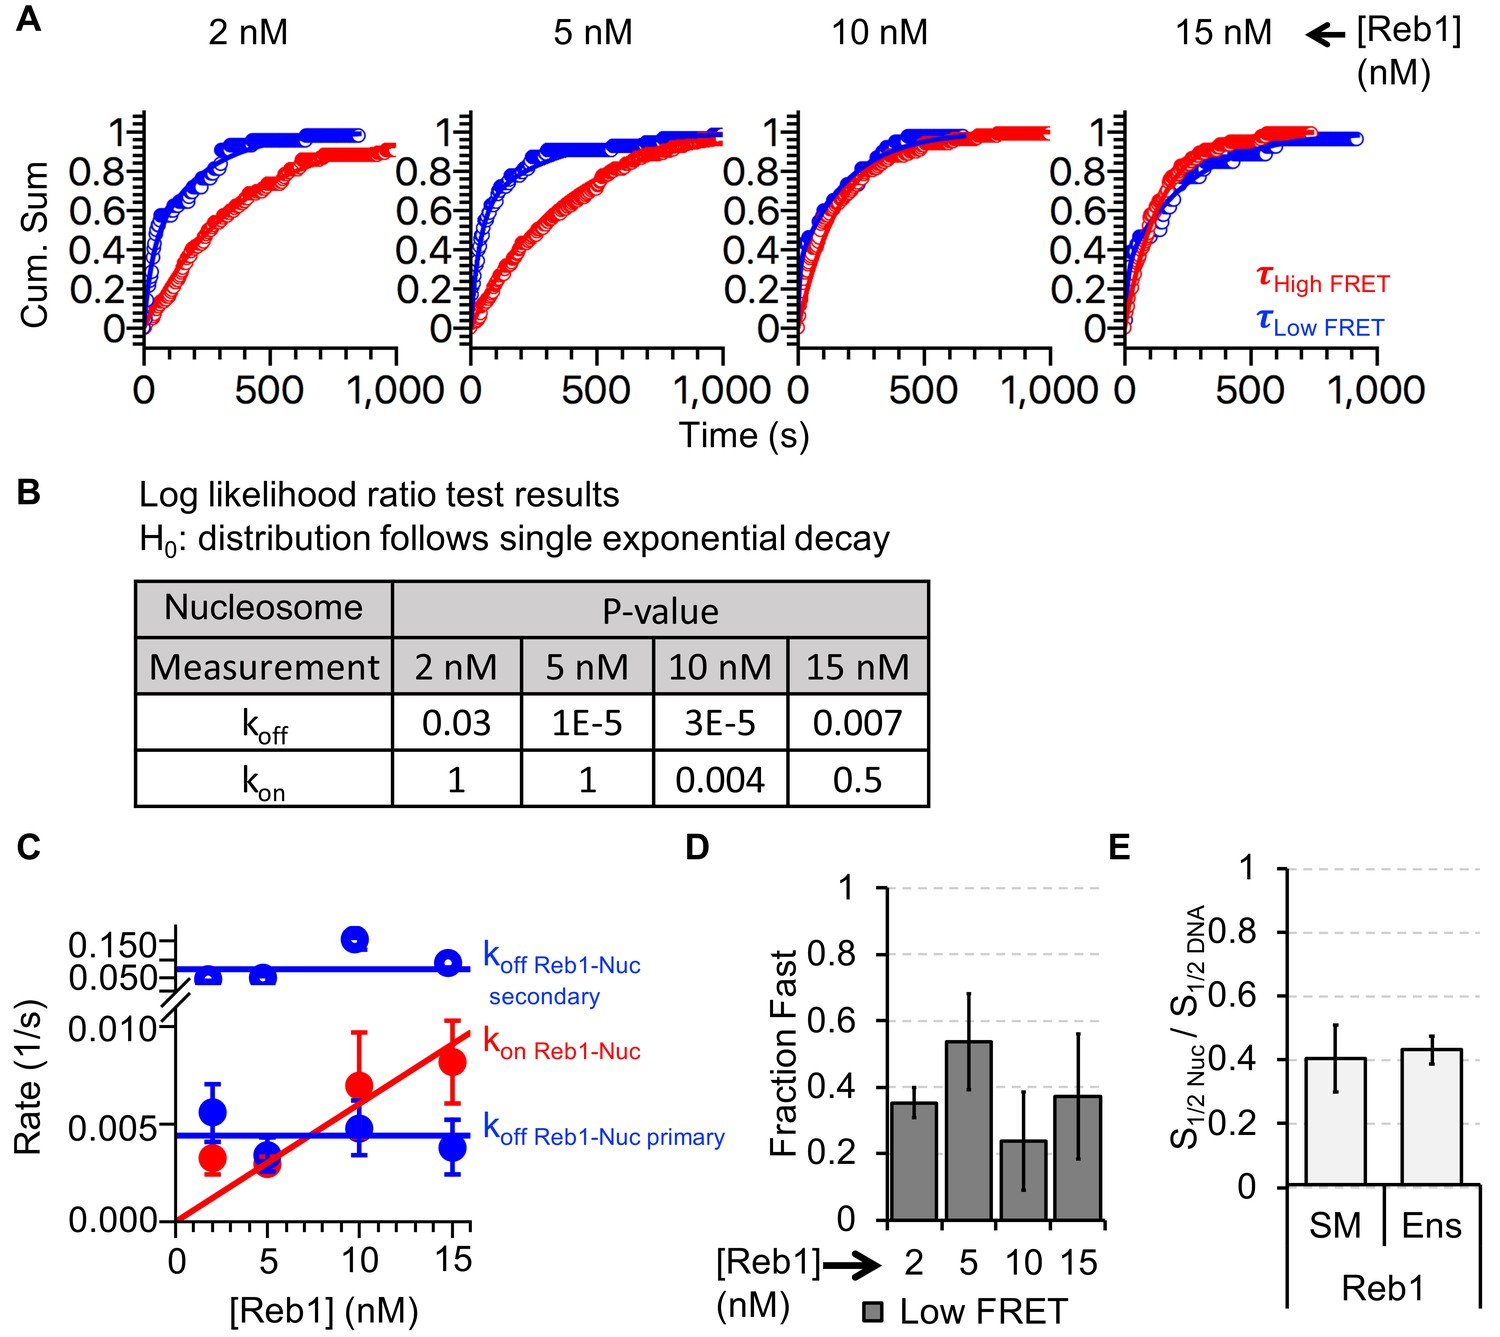
(A) smFRET P8 nucleosomes are tethered to the microscope surface through an additional 75 bp of DNA extending out of the nucleosome opposite to Cy3 and the Reb1-binding site. The octamer was labeled with Cy5 at H2A(K119C). Reb1 binding traps the nucleosome in a low FRET state. (B) Ensemble FRET titration of Reb1 with smFRET nucleosomes. The titration fits to a binding isotherm with an S1/2 Reb1–smNuc P8 FRET = 2.2 ± 0.2. This value is similar to that for titrations with nucleosomes containing 147-bp DNA (Figure 2B). (C) Example time traces of single nucleosomes at four separate Reb1 concentrations, which are fitted with a two-state Hidden-Markov Model. As the Reb1 concentration increases, the immobilized nucleosome shifts to the low FRET state. (D) Cumulative sums of dwell times in the high FRET (red) and low FRET states (blue), which fit to single and double exponentials, respectively. The Reb1 concentration is 5 nM. (E) The primary Reb1-binding (red) and -dissociation (blue) rates for increasing Reb1 concentrations. The dissociation rates are constant with an average rate of koff Reb1–Nuc primary = 0.0044 ± 0.0005 s−1, whereas the binding rates fit to a line with a slope that equals the overall binding rate of kon Reb1–Nuc primary = 0.0006 ± 0.0001 s−1 nM−1.
Figure 4—figure supplement 1
Analysis of Reb1–nucleosome single-molecule binding experiments.
(A) Cumulative sums of high FRET (red) and low FRET (blue) dwell times for nucleosomes at each Reb1 concentration. (B) Table of the log-likelihood ratio used to test the assumption that a cumulative sum fits to a double exponential. If the result is more than 0.01 for three of the Reb1 concentrations, we reject the assumption and fit with a single exponential. For Reb1–Nnucleosome interactions, the low FRET cumulative sums follow double exponentials. (C) Plots of the rates of Reb1 binding (red) to nucleosomes, and both the primary and secondary rates for the dissociation of Reb1 (blue) from nucleosomes for four concentrations of Reb1. These are determined from the exponential fits of the cumulative sums in panel (A). (D) The fraction of the fast dissociation rates of Reb1 from nucleosomes for increasing Reb1 concentrations. For Reb1 dissociation from nucleosomes, the slower rate accounted for ~60% of all of the dissociation events. (E) Ratio of the nucleosome-binding affinity to DNA-binding affinity for Reb1 for both single-molecule (SM) and ensemble (Ens) measurements. The ratio obtained using the dominant rates from single-molecule measurements is consistent with the ratio from ensemble measurements.
Figure 5 with 1 supplement
Cbf1 also binds and dissociates from nucleosomes significantly slower than from DNA.
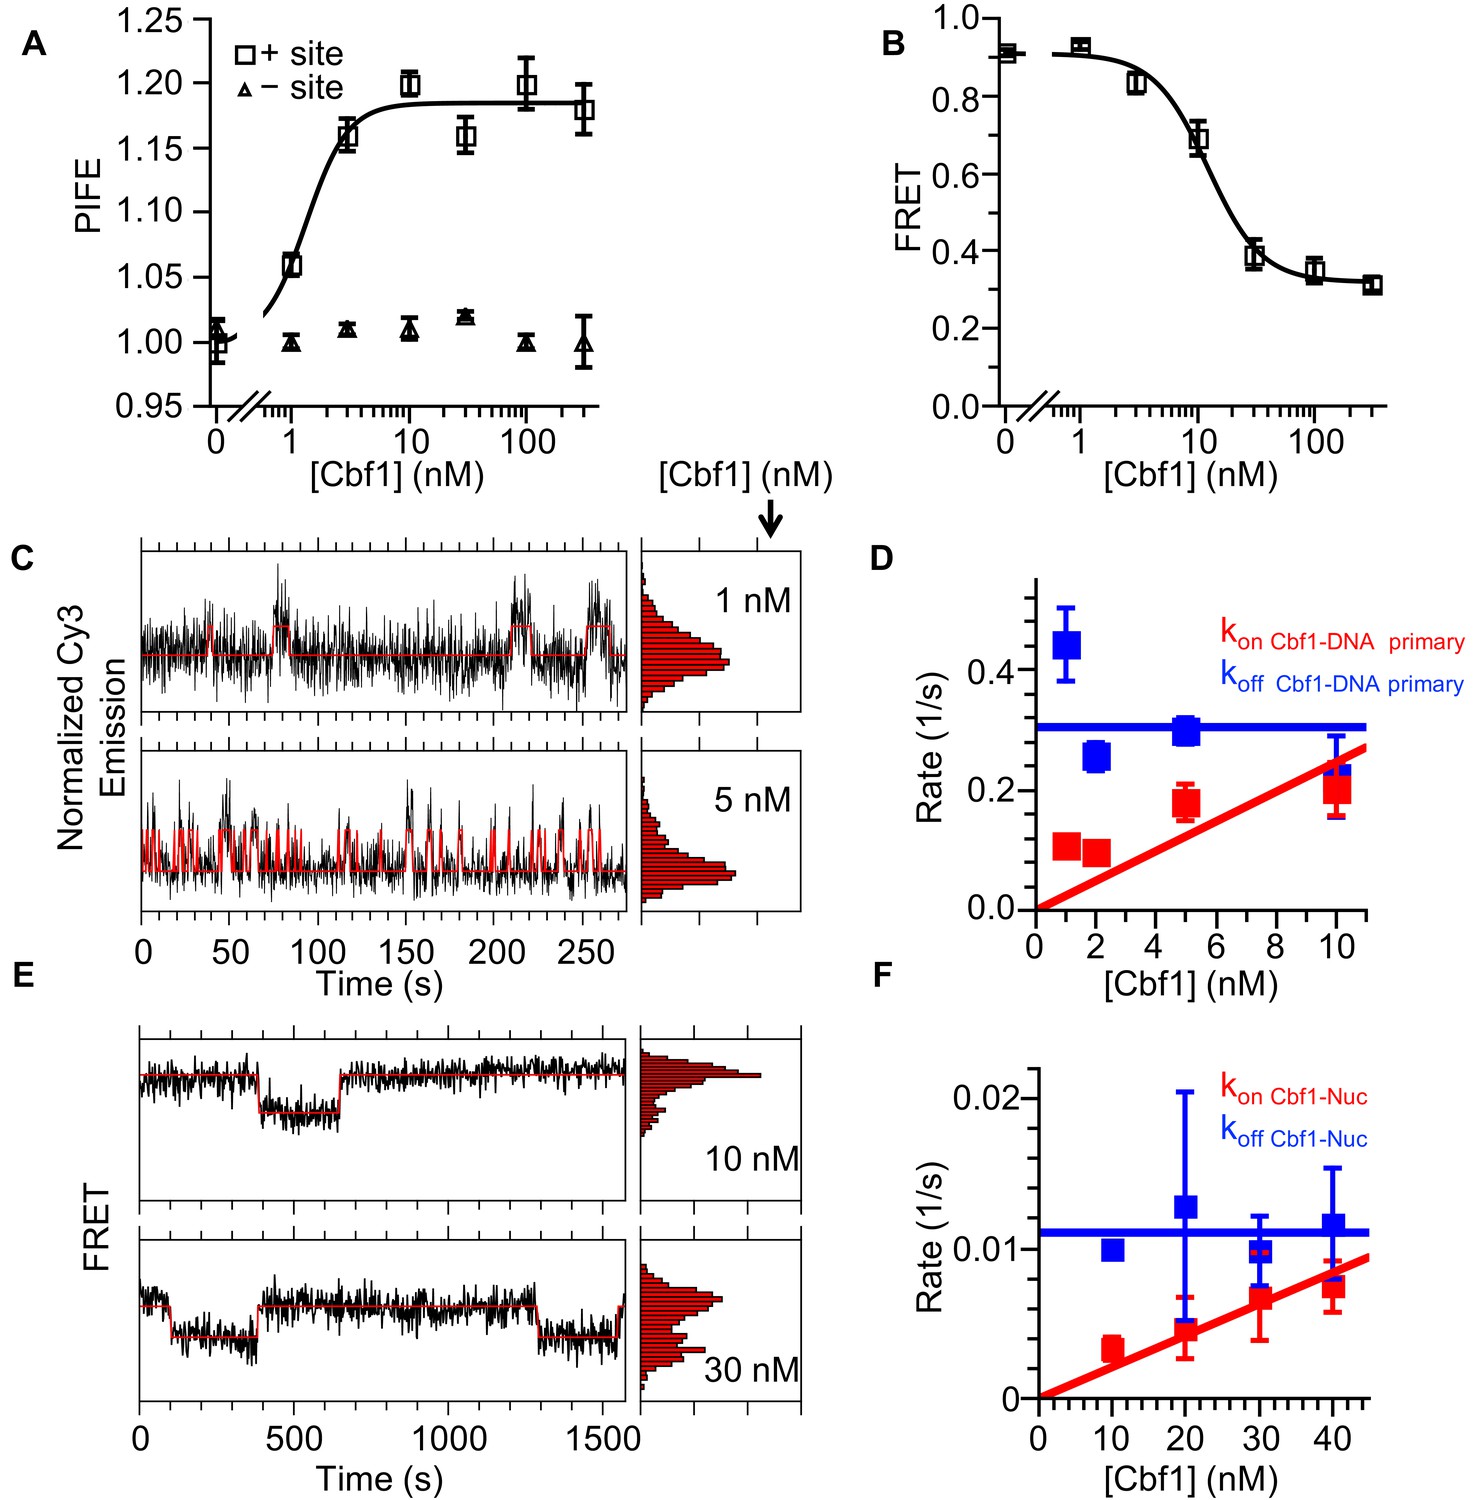
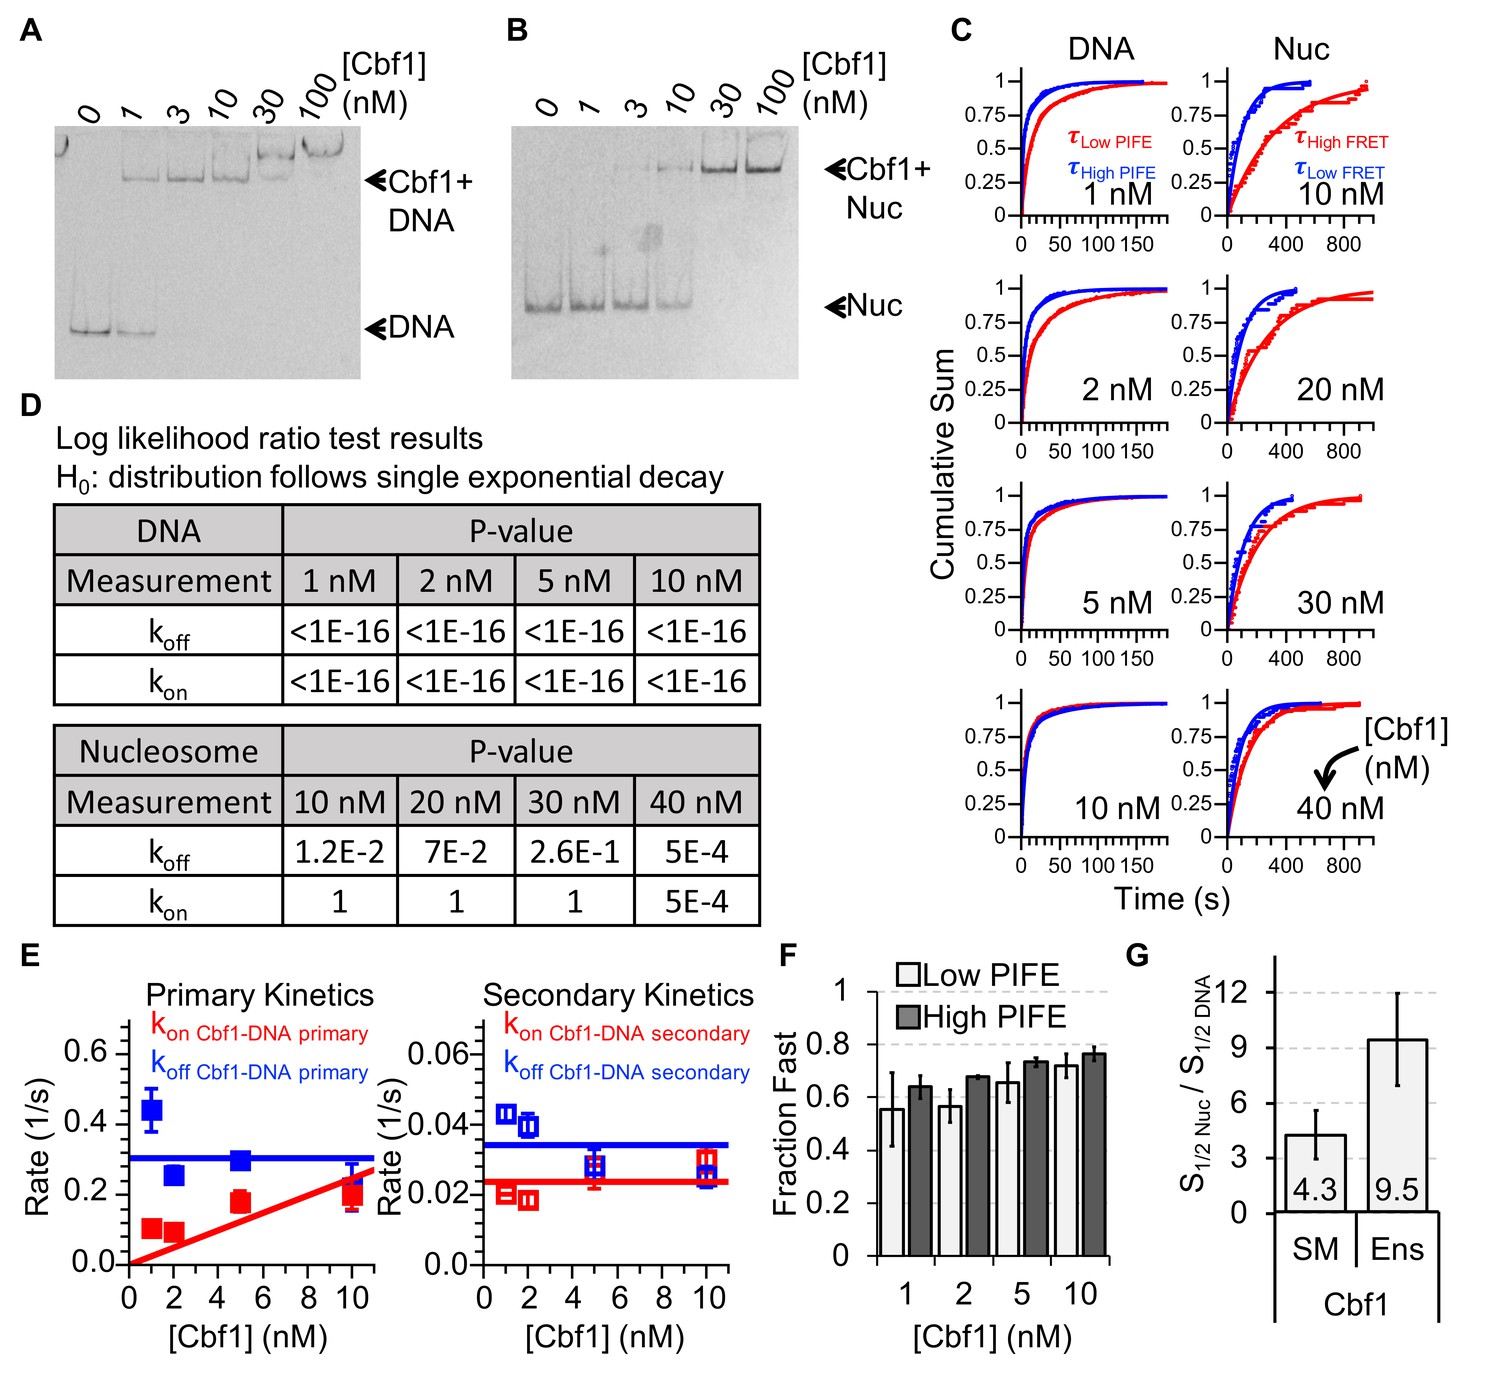
(A) Ensemble PIFE measurement of a Cbf1 titration with a 94-bp DNA with and without the Cbf1-binding sites 1 bp from the 5′ end and Cy3 labeled. The normalized PIFE fits to a binding isotherm with an S1/2 Cbf1–DNA PIFE = 1.3 ± 0.3 nM. Without the binding site, the Cy3 emission does not change, demonstrating that the observed PIFE is due to site-specific Cbf1 binding. (B) Cbf1 titration with Cy3-Cy5 labeled nucleosomes with the Cbf1 site at P8. The FRET fits to a binding isotherm with an S1/2 Cbf1–smNuc FRET = 12.3 ± 1.6 nM. (C) Example time traces of single DNA molecules for two separate Cbf1 concentrations, where the black lines are the Cy3 fluorescence and the red lines are the two-state Hidden Markov Model fits. As the Cbf1 concentration increases, the immobilized DNA molecules shift to the high PIFE state. (D) The Cbf1–DNA primary binding and dissociation rates for increasing concentrations of Cbf1. These were determined from cumulative sums of Cbf1–DNA high PIFE and low PIFE dwell times that were fitted to double exponentials. The primary dissociation kinetics (blue) were constant with an average of koff Cbf1–DNA primary = 0.30 ± 0.05 s−1, while the primary binding kinetics (red) fit to a line with a slope that equals the overall binding rate of kon Cbf1–DNA primary = 0.025 ± 0.006 s−1 nM−1. (E) Example time traces of single nucleosomes with two separate Cbf1 concentrations, where the black lines are the FRET efficiency data and the red lines are the two-state Hidden Markov Model fits. As the Cbf1 concentration increases, the immobilized nucleosome shift to the low FRET state. (F) The Cbf1–nucleosome binding and dissociation rates for increasing concentrations of Cbf1. These were determined from cumulative sums of Cbf1–nucleosome low FRET and high FRET dwell times that were fitted to single exponentials. The dissociation kinetics (blue) were constant with an average of koff Cbf1–Nuc = 0.0111 ± 0.0007 s−1, whereas the binding kinetics (red) fit to a line with a slope that equals the overall binding rate of kon Cbf1–Nuc = 0.00021 ± 0.00002 s−1 nM−1.
Figure 5—figure supplement 1
Characterizing Cbf1 interactions with DNA and nucleosomes.
(A) Cy3 image of the EMSA of Cbf1 binding to a 94-bp DNA sequence with the Cbf1-binding site (S1/2 Cbf1–DNA EMSA ≈ 1 nM). (B) Cy5 image of the EMSA of Cbf1 binding to nucleosomes with the Cbf1-binding site at P8 (S1/2 Cbf1–Nuc EMSA ≈ 11.5 nM). (C) Cumulative sum of low PIFE (red) and high PIFE (blue) dwell times for DNA (left) and nucleosomes (right) for each Cbf1 concentration. The DNA cumulative sums were fitted with double exponentials whereas the nucleosome cumulative sums were fitted with single exponentials. (D) Table of the log-likelihood ratio used to test the assumption that a cumulative sum fits to a double exponential curve. If the test is more than 0.01 for three of the four Cbf1 concentrations, we rejected the assumption and fitted a single exponential instead. For Cbf1–DNA, both unbound and bound cumulative sums follow double exponentials. For Cbf1–nucleosomes, both unbound and bound cumulative sums follow single exponentials. (E) Plots of primary (left) and secondary (right) rates for Cbf1 low ⇒ high PIFE (red) and high ⇒ low PIFE (blue) transitions in the interaction with DNA at increasing Cbf1 concentrations. These are determined from the exponential fits of the cumulative sums in panel (C). (F) The fractions of the fast transitions for low ⇒ high PIFE (light grey) and high ⇒ low PIFE (dark grey) of Cbf1 on DNA fwith increasing Cbf1 concentrations. Fast transitions rates accounted for ~60% and ~70% of the low ⇒ high and high ⇒ low events, respectively. (G) Ratio of nucleosome-binding affinity to DNA-binding affinity for Cbf1 for both single-molecule (SM) and ensemble (Ens) measurements. The ratio obtained using the dominant rates from single-molecule measurements is within about a factor of 2 of the ratio from ensemble measurements.
Figure 6 with 2 supplements
Reb1ΔN binds and dissociates similarly to WT Reb1.
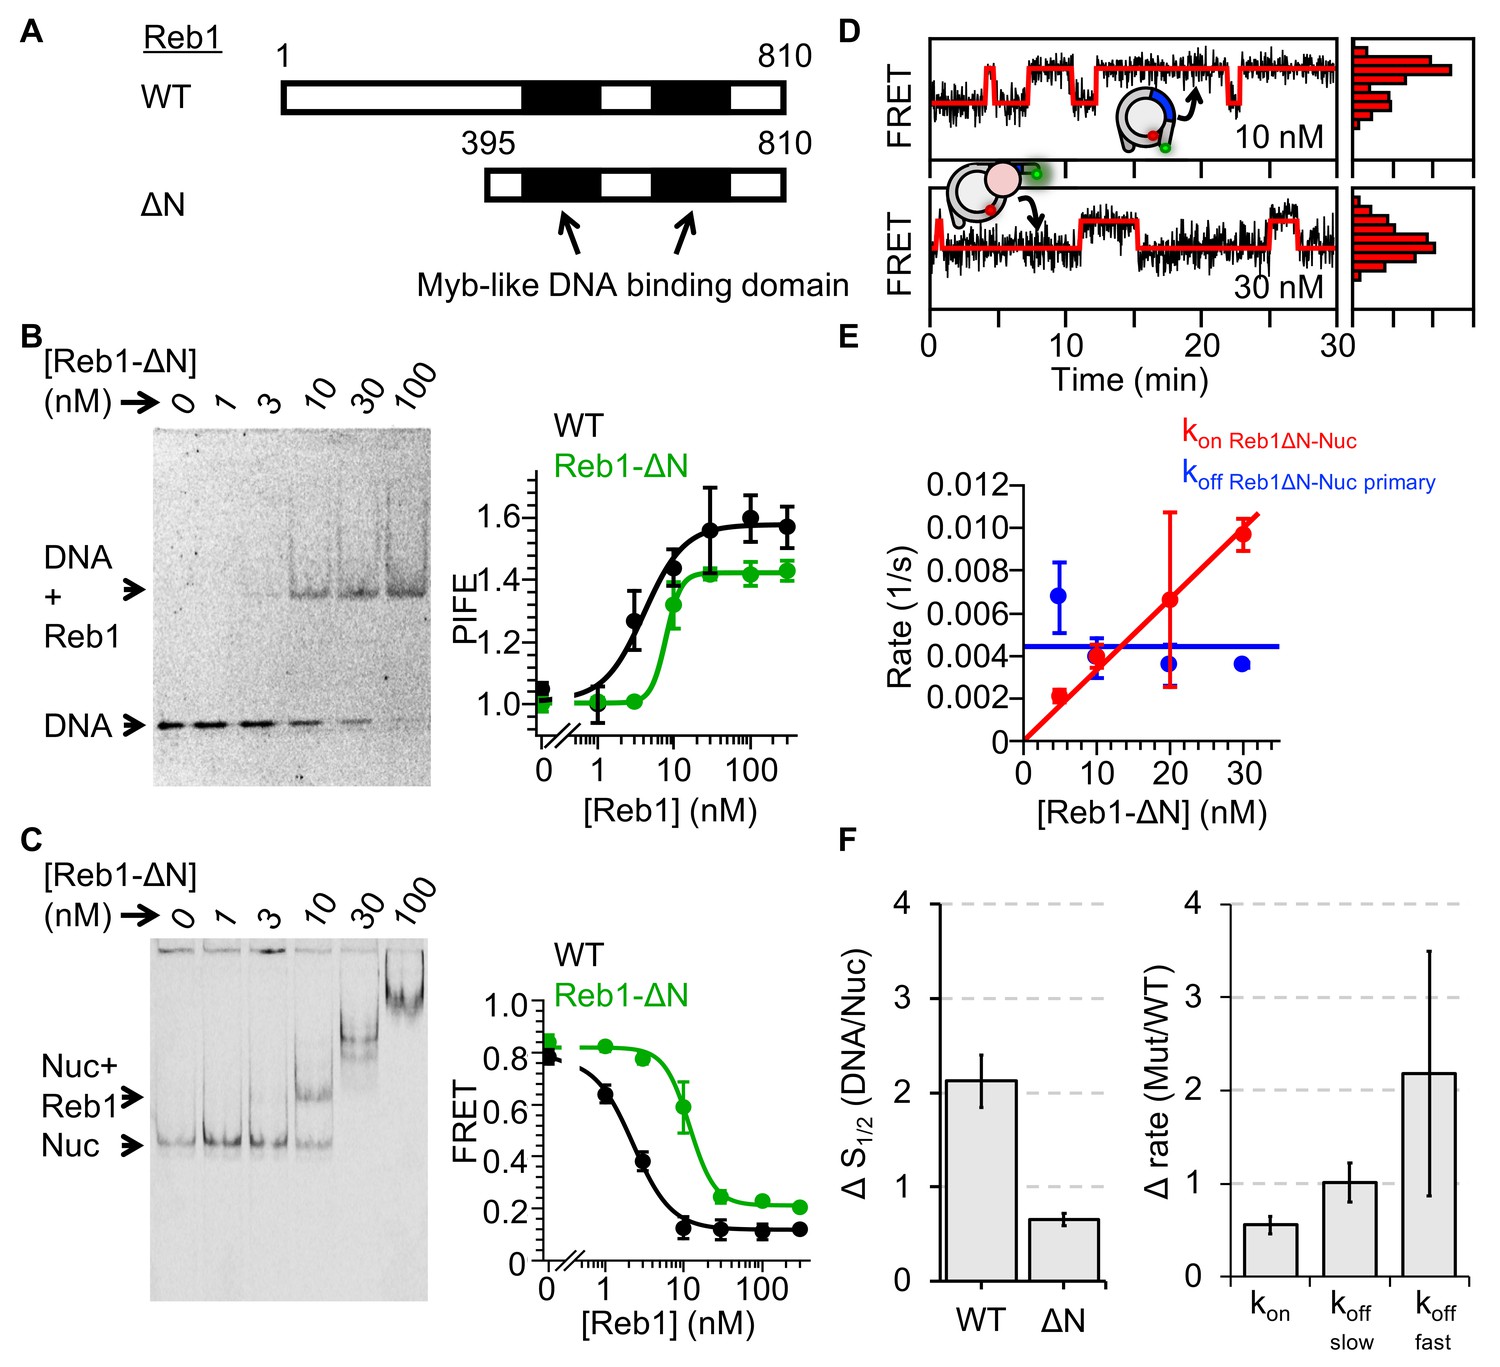
(A) Schematic comparison of WT Reb1 and the deletion variant Reb1-ΔN, which is comprised of residues 395–810. (B) Cy3 image of the EMSA of Reb1-ΔN binding to the 25-bp DNA molecule (S1/2 Reb1ΔN–DNA EMSA = 12.8 ± 1.2 nM). In addition, Reb1-ΔN titration with the smPIFE DNA results in a Cy3 emission increase of ~1.4-fold and fits to a binding isotherm with an S1/2 Reb1ΔN–DNA PIFE = 7.8 ± 0.5 nM. (C) Cy5 image of Reb1-ΔN binding to smFRET nucleosomes containing the P8 Reb1-binding site (S1/2 Reb1ΔN -Nuc P8 EMSA = 8.5 ± 0.5 nM). In addition, ensemble FRET measurements with these nucleosomes fit to a binding isotherm with an S1/2 Reb1ΔN–Nuc P8 FRET = 11.8 ± 0.9 nM. (D) Example time traces of single nucleosomes for two separate Reb1-ΔN concentrations, which are fitted to a two-state Hidden-Markov Model. As the Reb1 concentration increases, the immobilized nucleosome shifts to the low FRET state. (E) The primary Reb1-binding (red) and -dissociation (blue) rates for increasing Reb1-ΔN concentrations. The dissociation rates are constant with an average rate of koff Reb1ΔN–Nuc primary = 0.0044 ± 0.0008 s−1, whereas the binding rates fit to a line with a slope that equals the overall binding rate of kon Reb1ΔN–Nuc primary = 0.0003 ± 0.00001 s−1 nM−1.
Figure 6—figure supplement 1
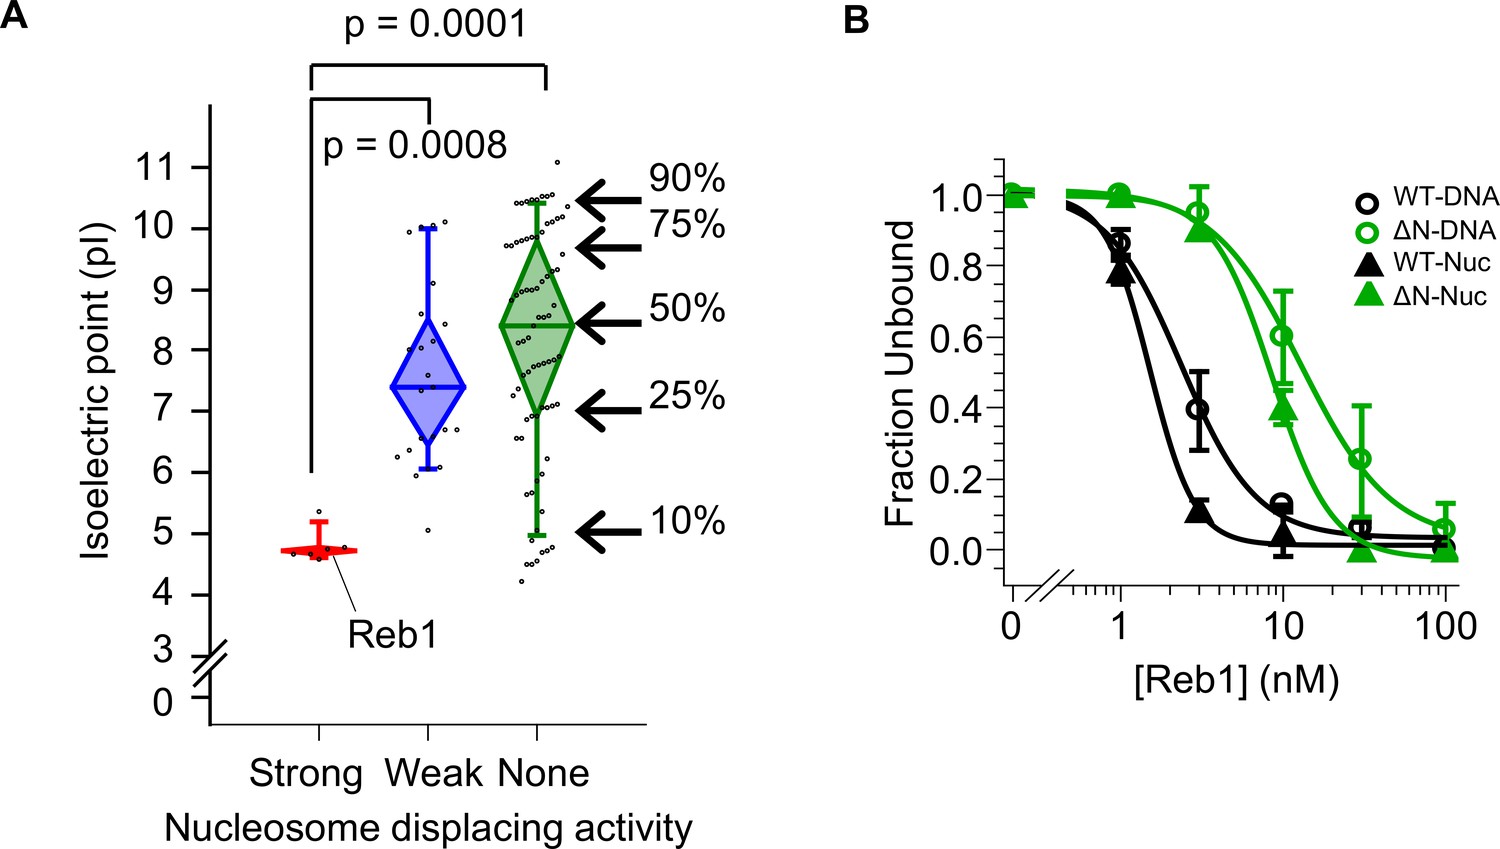
Strong nucleosome displacing factors are characterized by their overall negative charge.
(A) The isoelectric points for budding yeast TFs that have strong (red), weak (blue), or no (green) nucleosome displacing activity (Yan et al., 2018). (B) Binding curves fit to the Reb-ΔN EMSAs shown in Figure 6B–C.
Figure 6—figure supplement 2
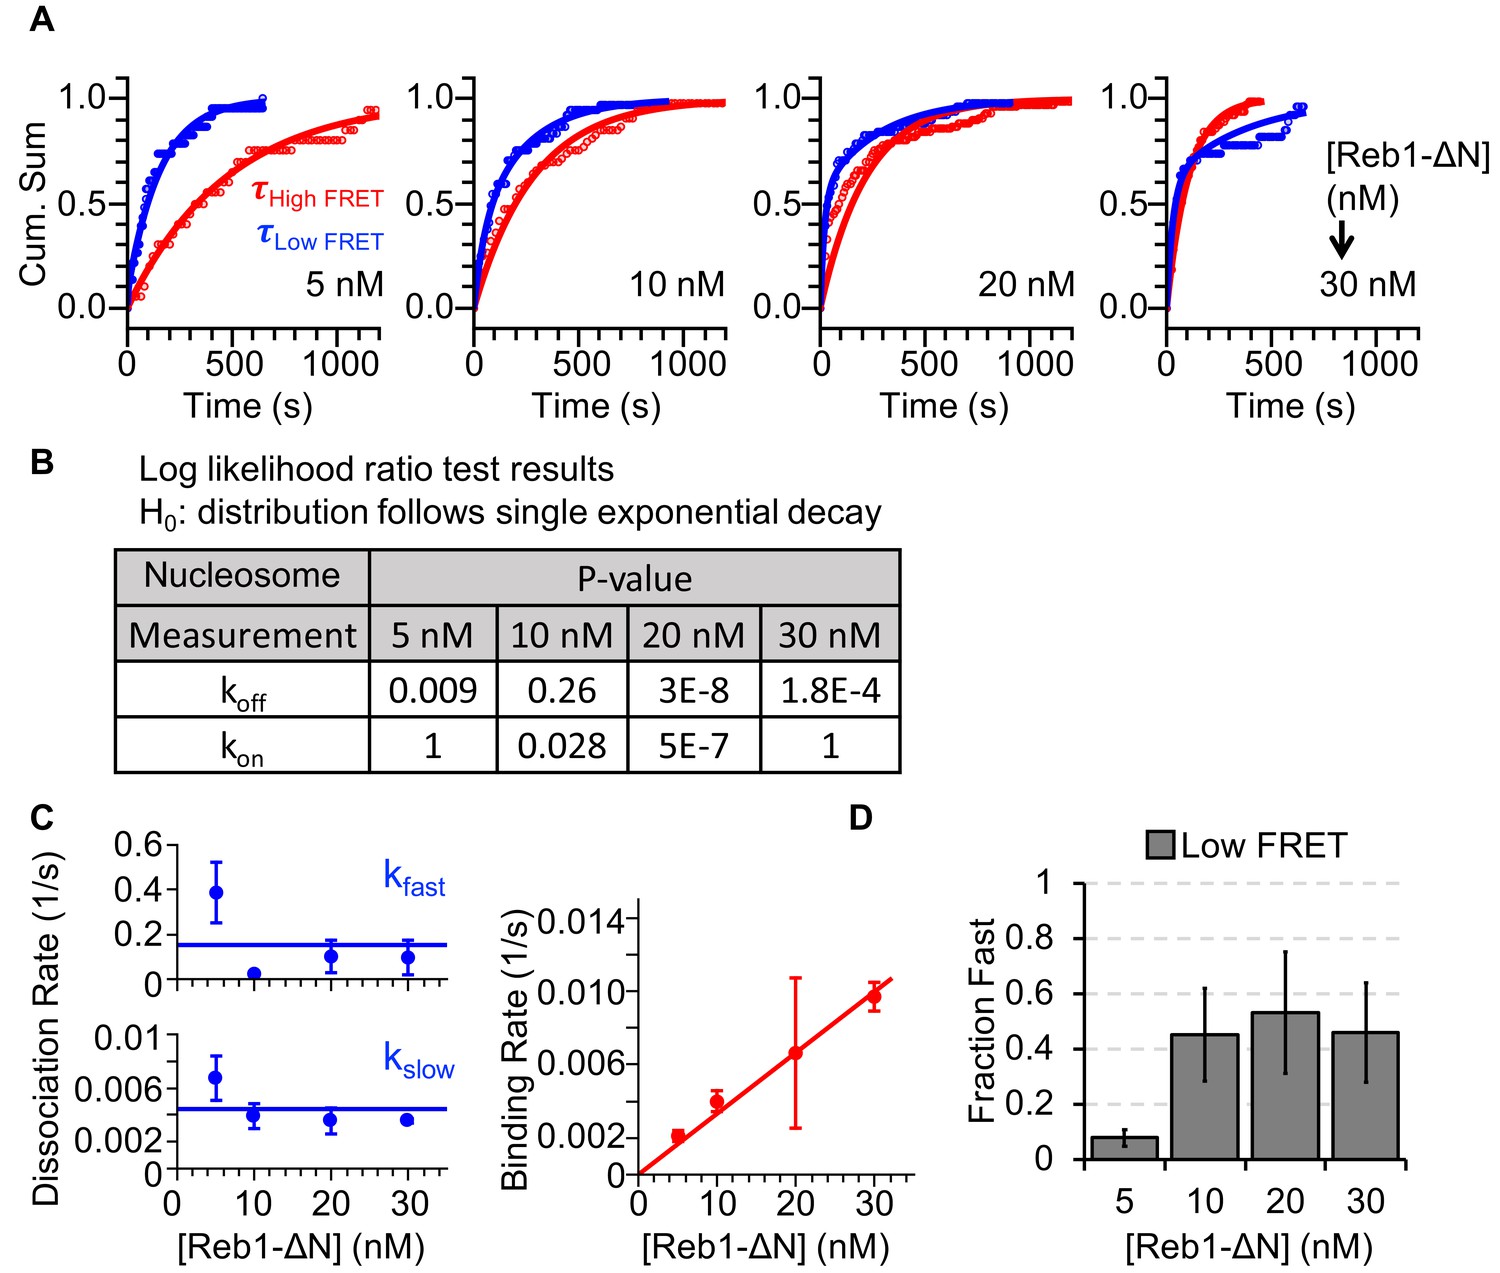
Characterizing Reb1ΔN interactions with nucleosomes.
(A) Cumulative sums of high FRET (red) and low FRET (blue) dwell times for nucleosomes at each Reb1ΔN concentration. (B) Table of the log-likelihood ratio that was used to test the assumption that a cumulative sum fits to a double exponential. If the result was more than 0.01 for three of the Reb1ΔN concentrations, we rejected the assumption and fitted a single exponential. For Reb1ΔN binding to nucleosomes, the low FRET cumulative sums followed double-exponentials. (C) Plots of the Reb1ΔN binding rates (red) to nucleosomes, and of both the fast and slow dissociation rates (blue) from nucleosomes for four concentrations of Reb1ΔN. These rates were determined from the exponential fits of the cumulative sums in panel (A). (D) The fraction of fast dissociation rates of Reb1 from nucleosomes for increasing Reb1 concentrations. For Reb1ΔN dissociation from nucleosomes, the slower rate accounted for ~50% of all of the dissociation events.
Figure 7 with 1 supplement
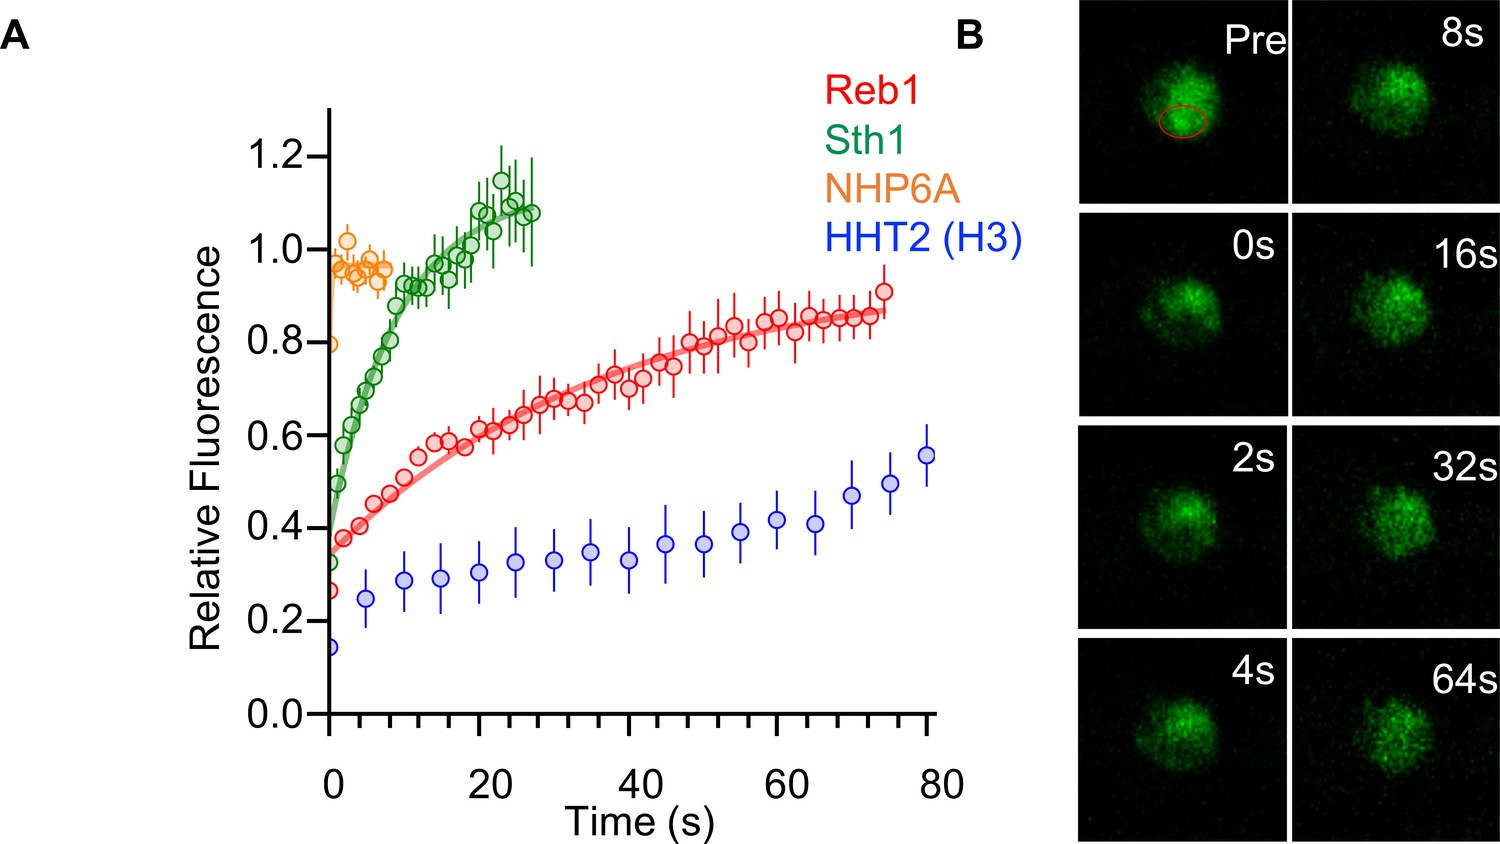
Reb1 slowly exchanges in vivo.
(A) Recovery curves for Reb1 (red), HHT2 (Blue), Sth1 (green), and NHP6A (orange) after photobleaching. Reb1 τ1/2 = 25.8 ± 2.5 s, Sth1 τ1/2 = 7.8 ± 0.7 s, NHP6A τ1/2 = 0.2 ± 0.1 s. (B) Fluorescence images of GFP-labeled Reb1 during a FRAP experiment. The bleached region is indicated with a red circle.
Figure 7—figure supplement 1
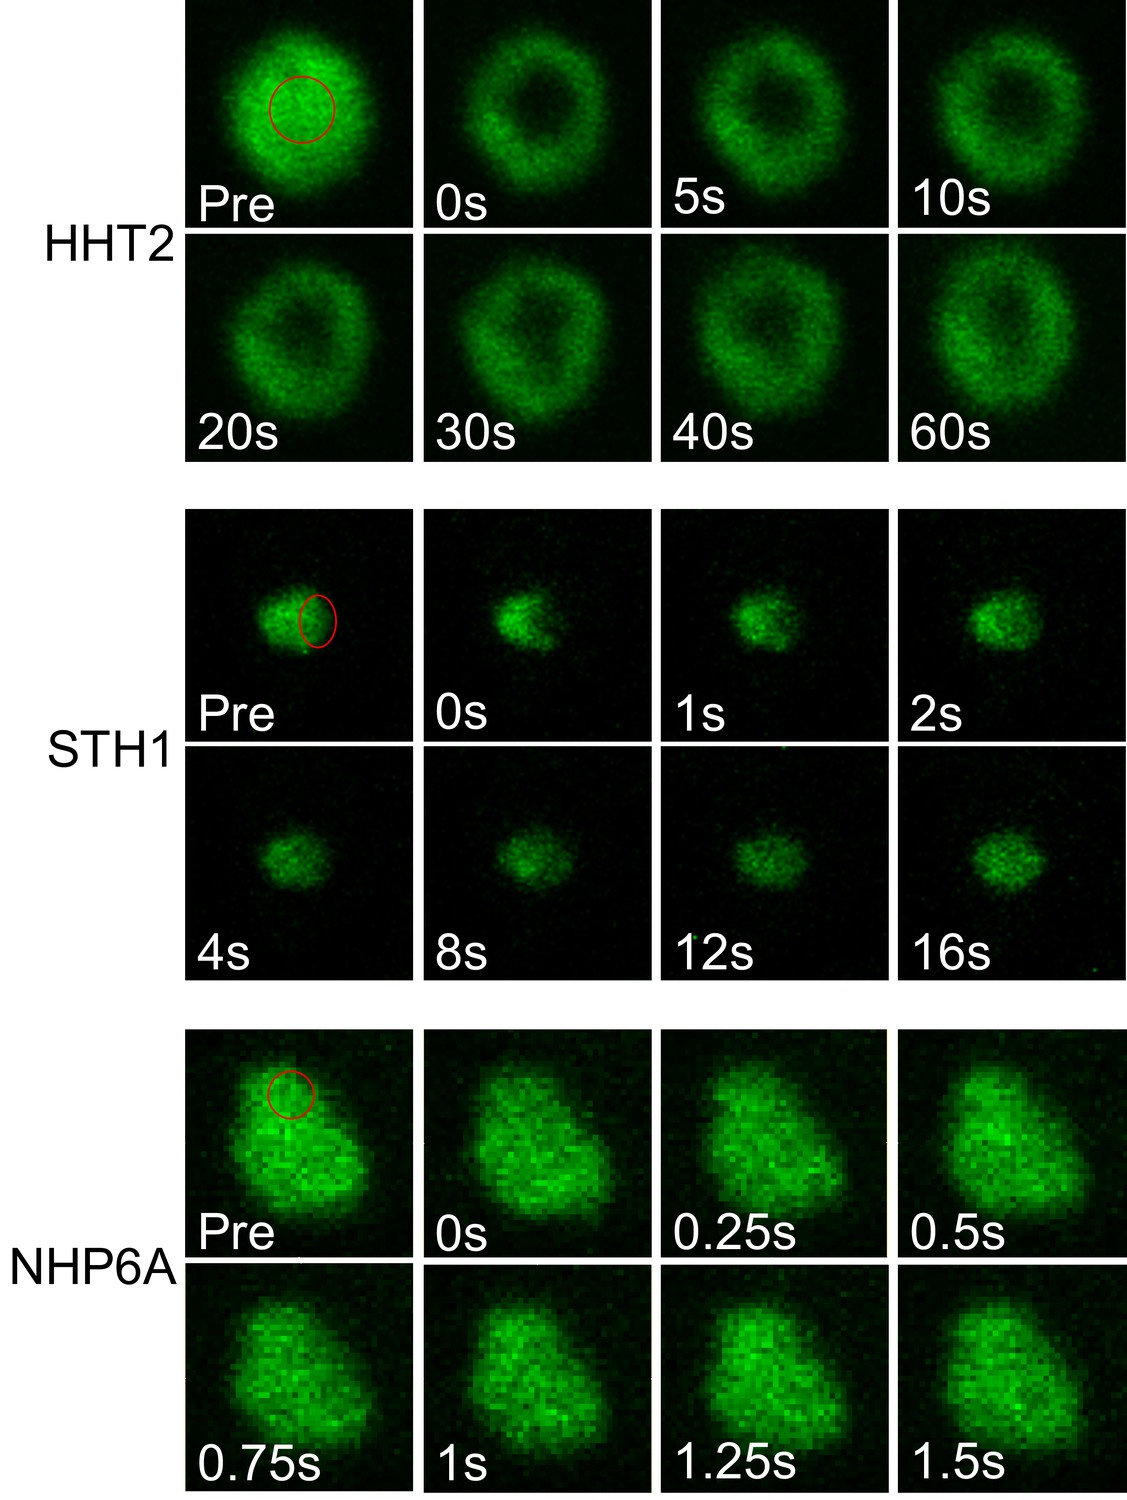
Fluorescence recovery of non-PF proteins in a yeast nucleus.
Fluorescence images of HHT2 (H3), STH1 and NHP6A during a FRAP experiment. Bleached regions are indicated with red circles.
Figure 8
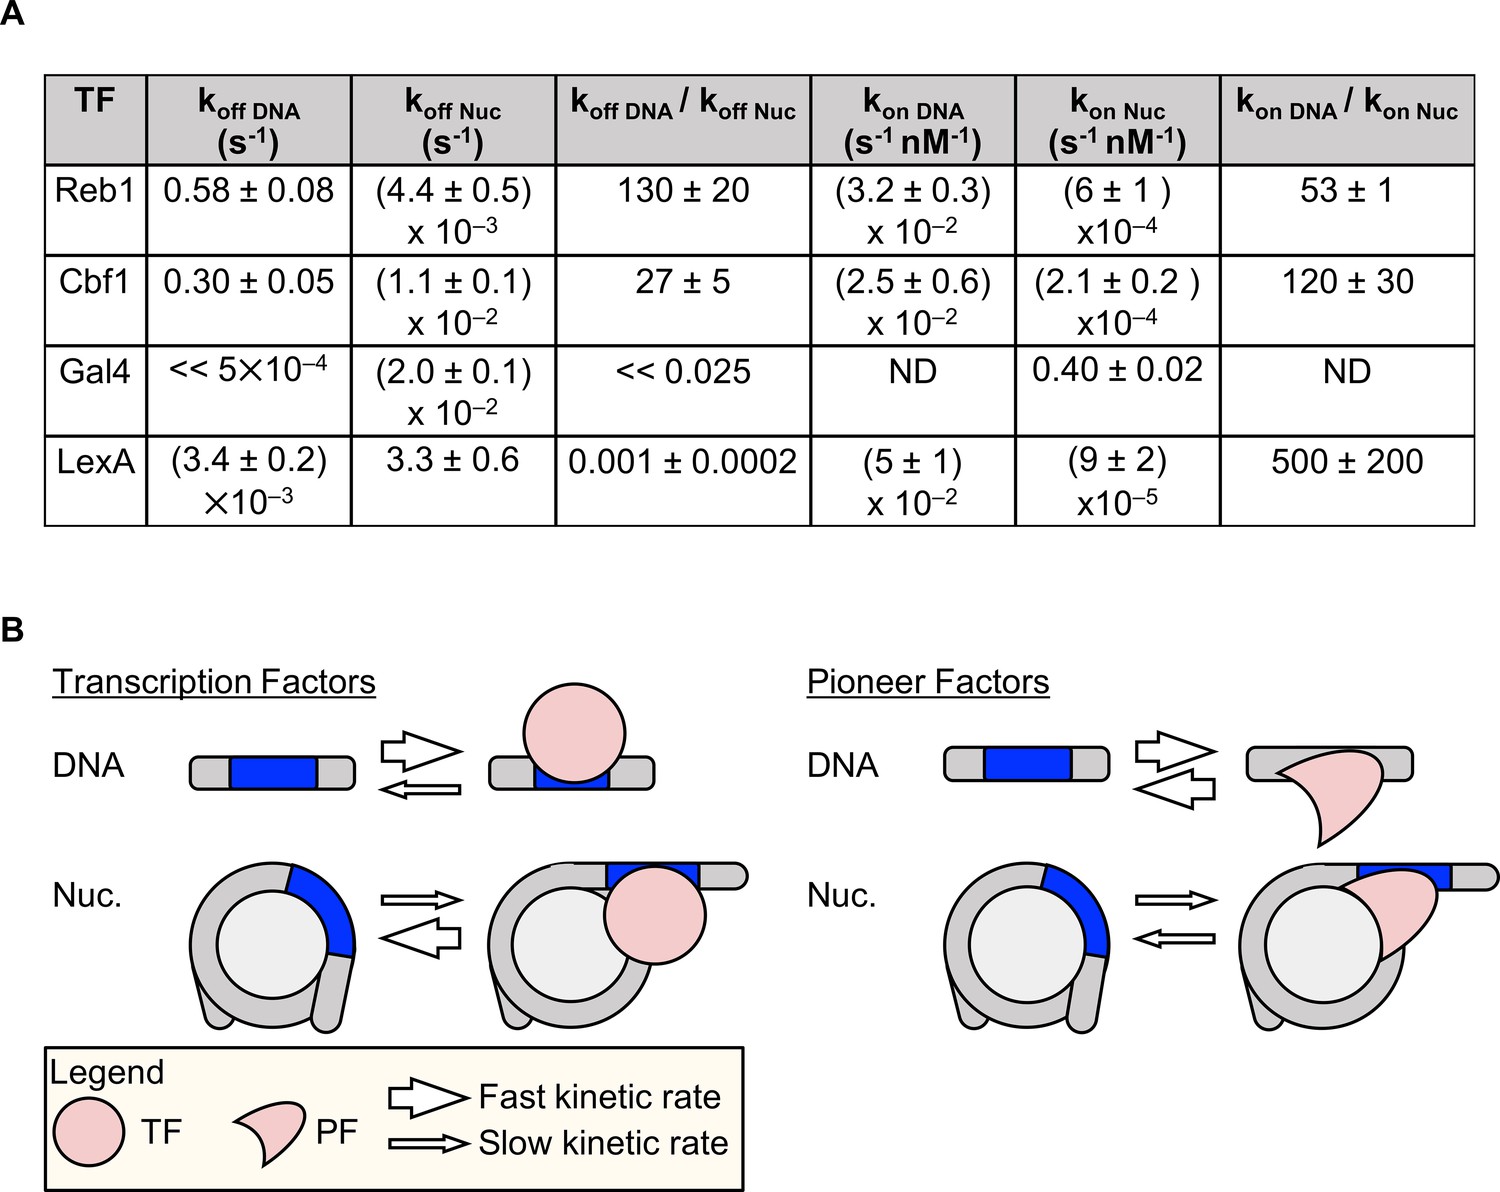
Dissociation rate compensation mechanism for yeast pioneer TFs.
(A) Table of Reb1, Cbf1, Gal4 and LexA (Luo et al., 2014b) binding and dissociation rates with DNA and P8 nucleosomes. (B) The dissociation rate compensation mechanism. (Left) For traditional TFs, nucleosomes decrease TF binding rates and increase TF dissociation rates, which can reduce the overall TF affinity by orders of magnitude. (Right) Like TFs, nucleosomes have lower PF binding rates than do naked DNA, but the PF dissociation rate from nucleosomes is lower than that from DNA. This compensates for the reduced PF binding rate so that the overall PF affinity is similar for nucleosomes and DNA, and allows PFs to trap nucleosomes in partially unwrapped states efficiently.
Tables
Key resources table
| Reagent type (species) or resource | Designation | Source or reference | Identifiers | Additional information |
|---|---|---|---|---|
| Strain, strain background (S. cerevisiae) | BY4741 | (Huh et al., 2003) | MATa his3Δ1 leu2Δ0 met15Δ0 ura3Δ0 | |
| Strain, strain background (S. cerevisiae) | BY4742 | (Huh et al., 2003) | MATα his3Δ1 leu2Δ0 lys2Δ0 ura3Δ0 | |
| Strain, strain background (S. cerevisiae) | BY4741-Reb1 | Constructed in this study | MATa his3Δ1 leu2Δ0 met15Δ0 ura3Δ0 REB1–GFP::His3MX | See 'Materials and methods: FRAP assay' |
| Strain, strain background (S. cerevisiae) | BY4741-HHT2 | Constructed in this study | MATa his3Δ1 leu2Δ0 met15Δ0 ura3Δ0 HHT2–GFP::His3MX | See 'Materials and methods: FRAP assay' |
| Strain, strain background (S. cerevisiae) | BY4741–Sth1 | Constructed in this study | MATa his3Δ1 leu2Δ0 met15Δ0 ura3Δ0 STH1–GFP::His3MX | See 'Materials and methods: FRAP assay' |
| Strain, strain background (S. cerevisiae) | BY4741–NHP6A | Constructed in this study | MATa his3Δ1 leu2Δ0 met15Δ0 ura3Δ0 NHP6A–GFP::His3MX | See 'Materials and methods: FRAP assay' |
| Strain, strain background (S. cerevisiae) | BY4742–Reb1 | Constructed in this study | MATα his3Δ1 leu2Δ0 lys2Δ0 ura3Δ0 REB1–GFP::His3MX | See 'Materials and methods: FRAP assay' |
| Strain, strain background (S. cerevisiae) | BY4742-HHT2 | Constructed in this study | MATα his3Δ1 leu2Δ0 lys2Δ0 ura3Δ0 HHT2–GFP::His3MX | See 'Materials and methods: FRAP assay' |
| Strain, strain background (S. cerevisiae) | BY4742–Sth1 | Constructed in this study | MATα his3Δ1 leu2Δ0 lys2Δ0 ura3Δ0 Sth1–GFP::His3MX | See 'Materials and methods: FRAP assay' |
| Strain, strain background (S. cerevisiae) | BY4742–NHP6a | Constructed in this study | MATα his3Δ1 leu2Δ0 lys2Δ0 ura3Δ0 NHP6A–GFP::His3MX | See 'Materials and methods: FRAP assay' |
| Strain, strain background (S. cerevisiae) | BY4743–Reb1 | Constructed in this study | MATa/α his3Δ1/his3Δ1 leu2Δ0/leu2Δ0 LYS2/lys2Δ0 met15Δ0/MET15 ura3Δ0/ura3Δ0 REB1–GFP::His3MX/Factor-GFP::His3MX | See 'Materials and methods: FRAP assay' |
| Strain, strain background (S. cerevisiae) | BY4743–HHT2 | Constructed in this study | MATa/α his3Δ1/his3Δ1 leu2Δ0/leu2Δ0 LYS2/lys2Δ0 met15Δ0/MET15 ura3Δ0/ura3Δ0 HHT2–GFP::His3MX/Factor-GFP::His3MX | See 'Materials and methods: FRAP assay' |
| Strain, strain background (S. cerevisiae) | BY4743–Sth1 | Constructed in this study | MATa/α his3Δ1/his3Δ1 leu2Δ0/leu2Δ0 LYS2/lys2Δ0 met15Δ0/MET15 ura3Δ0/ura3Δ0 Sth1–GFP::His3MX/Factor-GFP::His3MX | See 'Materials and methods: FRAP assay' |
| Strain, strain background (S. cerevisiae) | BY4743–NHP6A | Constructed in this study | MATa/α his3Δ1/his3Δ1 leu2Δ0/leu2Δ0 LYS2/lys2Δ0 met15Δ0/MET15 ura3Δ0/ura3Δ0 NHP6A–GFP::His3MX/Factor-GFP::His3MX | See 'Materials and methods' |
Additional files
-
Supplementary file 1
Tables S1 to S6 reporting all binding-affinity measurements, all measured rates, a comparison of the relative binding affinities (Nuc/DNA) in the ensemble and single molecule experiments, the primers used in in vitro experiments, the single-molecule quality control data, and the primers used in the in vivo experiments.
- https://doi.org/10.7554/eLife.43008.024
-
Source code 1
Matlab script for data analysis of idealized traces.
- https://doi.org/10.7554/eLife.43008.025
-
Transparent reporting form
- https://doi.org/10.7554/eLife.43008.026
Download links
A two-part list of links to download the article, or parts of the article, in various formats.
Downloads (link to download the article as PDF)
Open citations (links to open the citations from this article in various online reference manager services)
Cite this article (links to download the citations from this article in formats compatible with various reference manager tools)
Dissociation rate compensation mechanism for budding yeast pioneer transcription factors
eLife 8:e43008.
https://doi.org/10.7554/eLife.43008


