Mutant huntingtin impairs PNKP and ATXN3, disrupting DNA repair and transcription
- University of Texas Medical Branch, United States
- University of California, Irvine, United States
- Duke University School of Medicine, United States
- Sam Houston State University, United States
- Houston Methodist Research Institute, United States
- Buck Institute for Research on Aging, United States
- University of California, Irvine, Institute for Memory Impairments and Neurological Disorders, United States
Figures
Figure 1 with 7 supplements
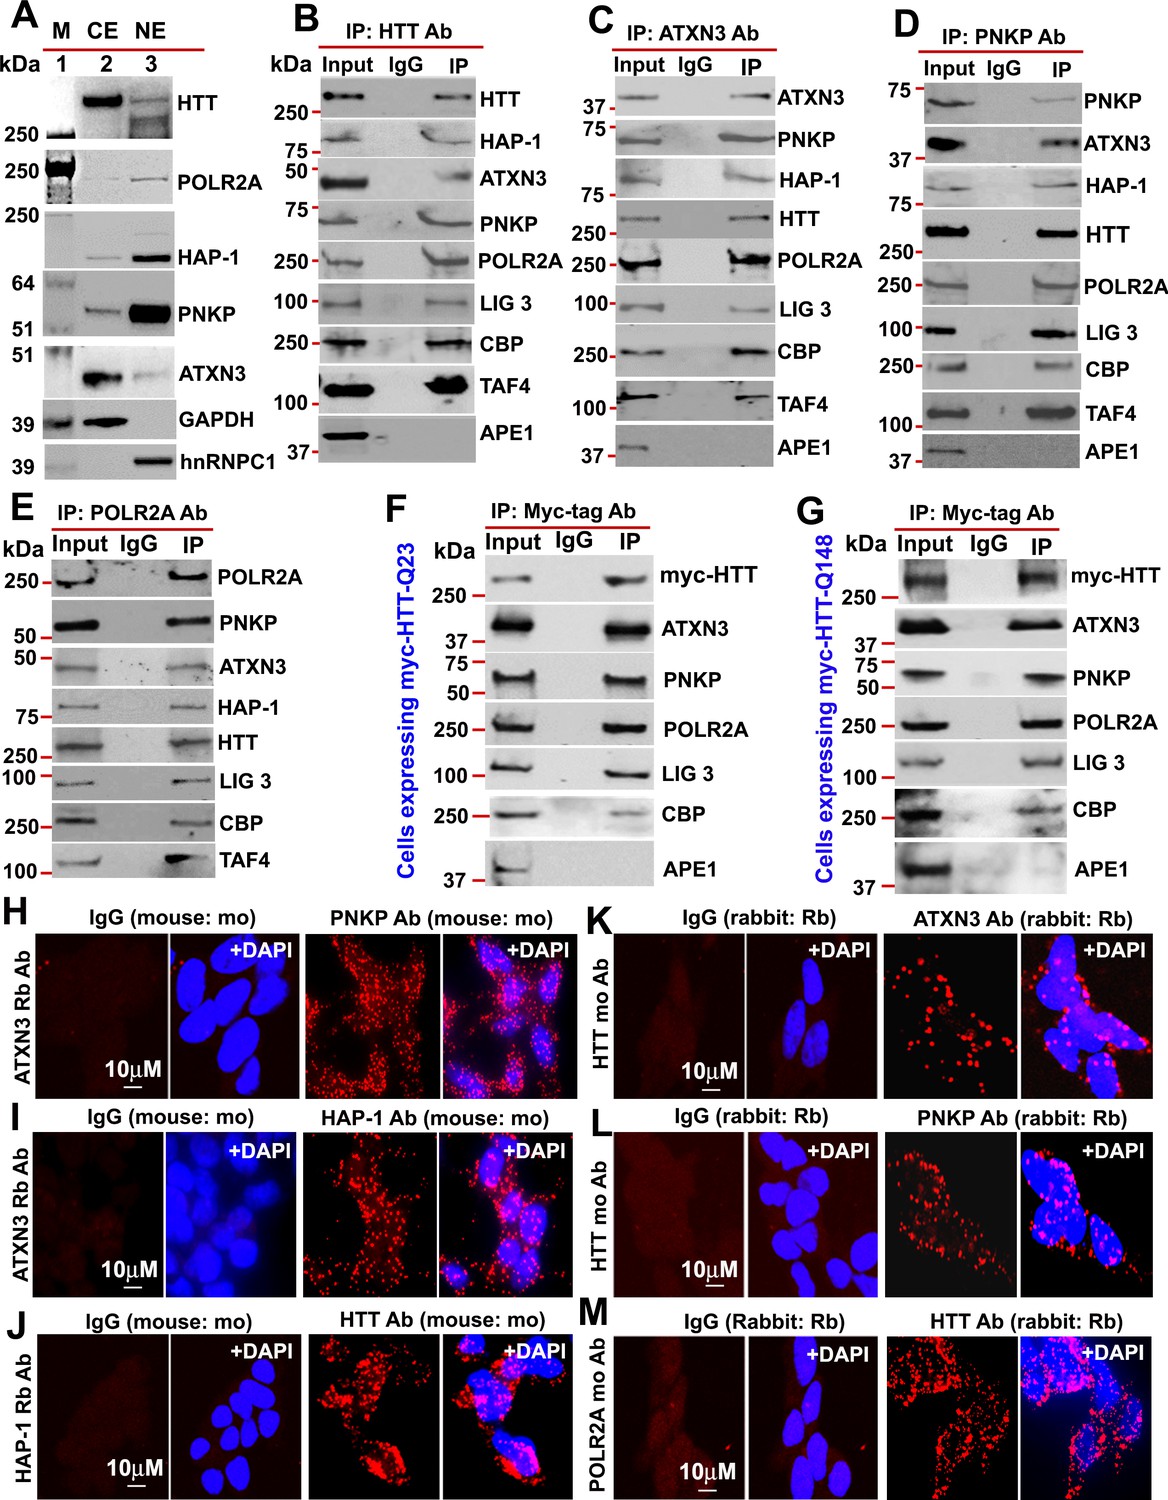
HTT is a part of the TCR complex.
(A) Nuclear extract (NE), and cytosolic extract (CE) were purified from human neuroblastoma SH-SY5Y cells and the protein fractions were analyzed by western blots (WBs) to detect HTT, ATXN3, PNKP, and HAP1 levels in these sub-cellular fractions. GAPDH and hnRNPC1/C2 were used as cytosolic and nuclear markers respectively. APE1 was used as a negative control in panels A to D. (B) Endogenous HTT was immunoprecipitated (IP’d) from NEs of SH-SY5Y cells and immunocomplex (IC) were analyzed by western blot (WB) to examine the TCR proteins (HAP-1, ATXN3, PNKP, POLR2A, LIG 3, CBP, and TAFII 130 (TAF4). (C) Endogenous ATXN3 was IP’d from NEs of SH-SY5Y cells and IC was subjected to WB to detect associated TCR complex components with respective antibodies. (D) Endogenous PNKP was IP’d from NEs of SH-SY5Y cells and IC was analyzed by WB to examine associated TCR components. (E) Endogenous POLR2A was IP’d from NEs of SH-SY5Y cells and IC was analyzed by WB to detect associated TCR proteins. (F) NEs was isolated from PC12 cells ectopically expressing a Myc-tagged full-length normal wild type HTT (FL-wtHTT-Q23) for assessing the possible interaction of HTT with POLR2A and associated TCR proteins. Exogenous Myc-wtHTT-Q23 was IP’d with an anti-Myc antibody, and the Myc immunocomplex was subjected to WBs with respective antibodies. APE1 was used as a negative control in panels F and G. (G) NEs was isolated from PC12 cells ectopically expressing a Myc-tagged full-length mutant HTT (FL-mHTT-Q148). Exogenous Myc-wtHTT-Q148 was IP’d with an anti-Myc antibody, and the Myc immunocomplex was subjected to WBs with respective antibodies. Proximity Ligation Assay (PLA) in SH-SY5Y cells to examine the protein-protein interaction using the following antibody pairs. Red fluorescence indicates positive PLA signals for protein-protein interactions. Nuclei were stained with DAPI. (H) ATXN3 (rabbit: Rb) and IgG (mouse: mo) or PNKP (mouse: mo) antibodies. (I) ATXN3 (rabbit: Rb) with IgG (mouse: mo) or HAP-1 (mouse: mo) antibodies. (J) HAP-1 (rabbit: Rb) and IgG (mouse: mo) or HTT (mouse: mo) antibodies. (K) HTT (mouse: mo) with IgG (rabbit: Rb) or ATXN3 (rabbit: Rb) antibodies. (L) HTT (mouse: mo) with IgG (rabbit: Rb) or PNKP (rabbit: Rb) antibodies, and. (M) POLR2A (mouse: mo) with IgG (rabbit: Rb) or HTT (rabbit: Rb) antibodies.
Figure 1—figure supplement 1

Huntingtin is a part of the transcription-coupled DNA repair (TCR) complex.
Nuclear extracts (NEs) from human neuroblastoma SH-SY5Y cells was isolated and the endogenous HTT was immunoprecipitated (IP’d) with anti-HTT antibody. The HTT immunocomplex (HTT-IC) was analyzed by western blots (WBs) to examine the presence of various TCR proteins with respective antibodies (HAP-1, ATXN3, PNKP, POLR2A, LIG 3, CBP, and TAFII 130 (TAF4) shown in the figures. The original WBs show the protein bands and molecular weight markers.
Figure 1—figure supplement 2
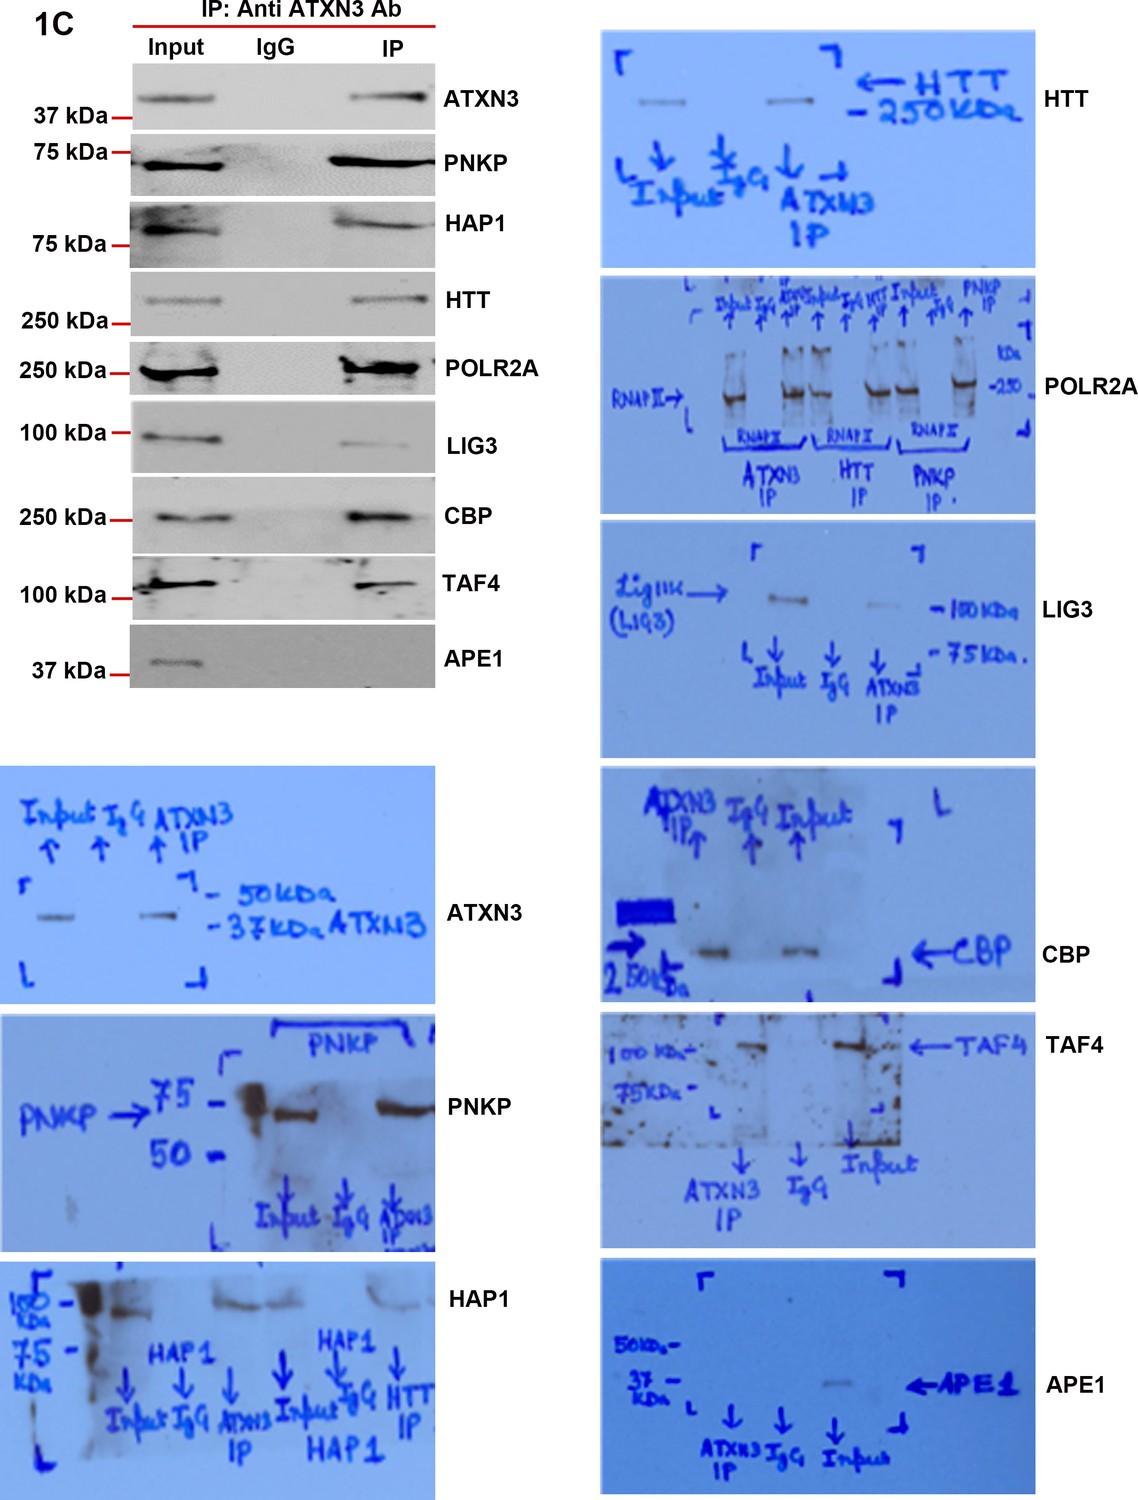
ATXN3 is present in the HTT-TCR complex.
Nuclear extracts (NEs) from human neuroblastoma SH-SY5Y cells was isolated and the endogenous ataxin-3 was immunoprecipitated (IP’d) with anti-ataxin-3 antibody. The atxin-3 immunocomplex (ATXN3-IC) was analyzed by western blots (WBs) to examine the presence of various TCR proteins with respective antibodies. The original WBs show the protein bands and molecular weight markers.
Figure 1—figure supplement 3

DNA strand break repair enzyme PNKP is present in the TCR complex.
Endogenous PNKP was IP’d from NEs of SH-SY5Y cells and PNKP IC was analyzed by WBs to examine the presence of PNKP-associated TCR components. The original WBs show the protein bands and molecular weight markers.
Figure 1—figure supplement 4

RNA polymerase large subunit (POLR2A) is present in the HTT-TCR complex.
POLR2A was IP’d from NEs of SH-SY5Y cells and IC was analyzed by WBs to detect the POLR2A-associated TCR proteins. Presence of HAP-1, ATXN3, PNKP, POLR2A, LIG 3, CBP, and TAFII 130 (TAF4) are shown in figures. The original WBs show the protein bands and molecular weight markers.
Figure 1—figure supplement 5
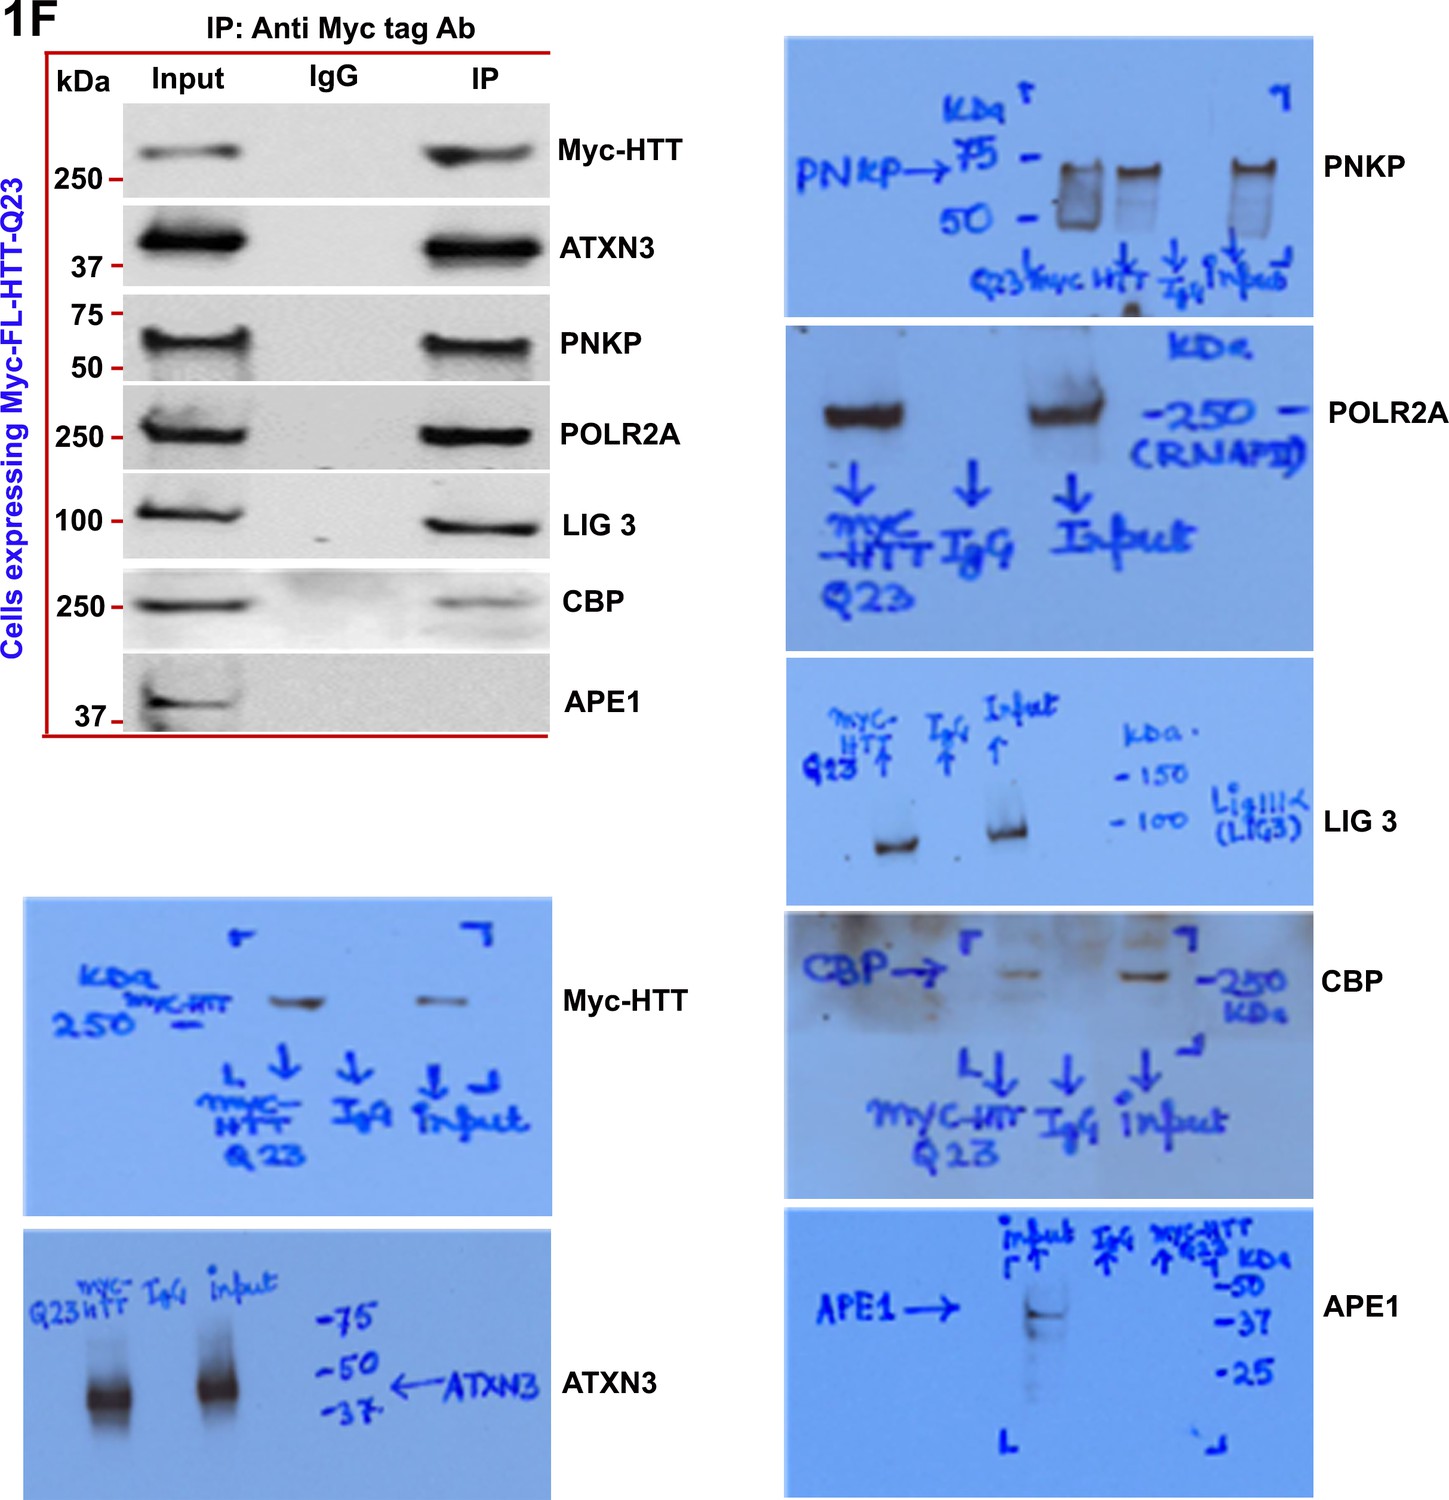
Wild-type normal HTT is a part of the multiprotein TCR complex in vitro.
Nuclear extract (NEs) was isolated from PC12 cells exogenously expressing Myc-tagged full-length wild-type normal HTT encoding 23Qs (FL-HTT-Q23), and the Myc-HTT-Q23 protein was immunoprecipitated (IP’d) with anti-Myc-tag Ab, and the Myc immunocomplex (Myc-IC) was analyzed by western blots (WBs) for assessing the possible interaction of HTT with POLR2A and associated TCR proteins (ATXN3, PNKP, POLR2A, LIG 3, and CBP).
Figure 1—figure supplement 6
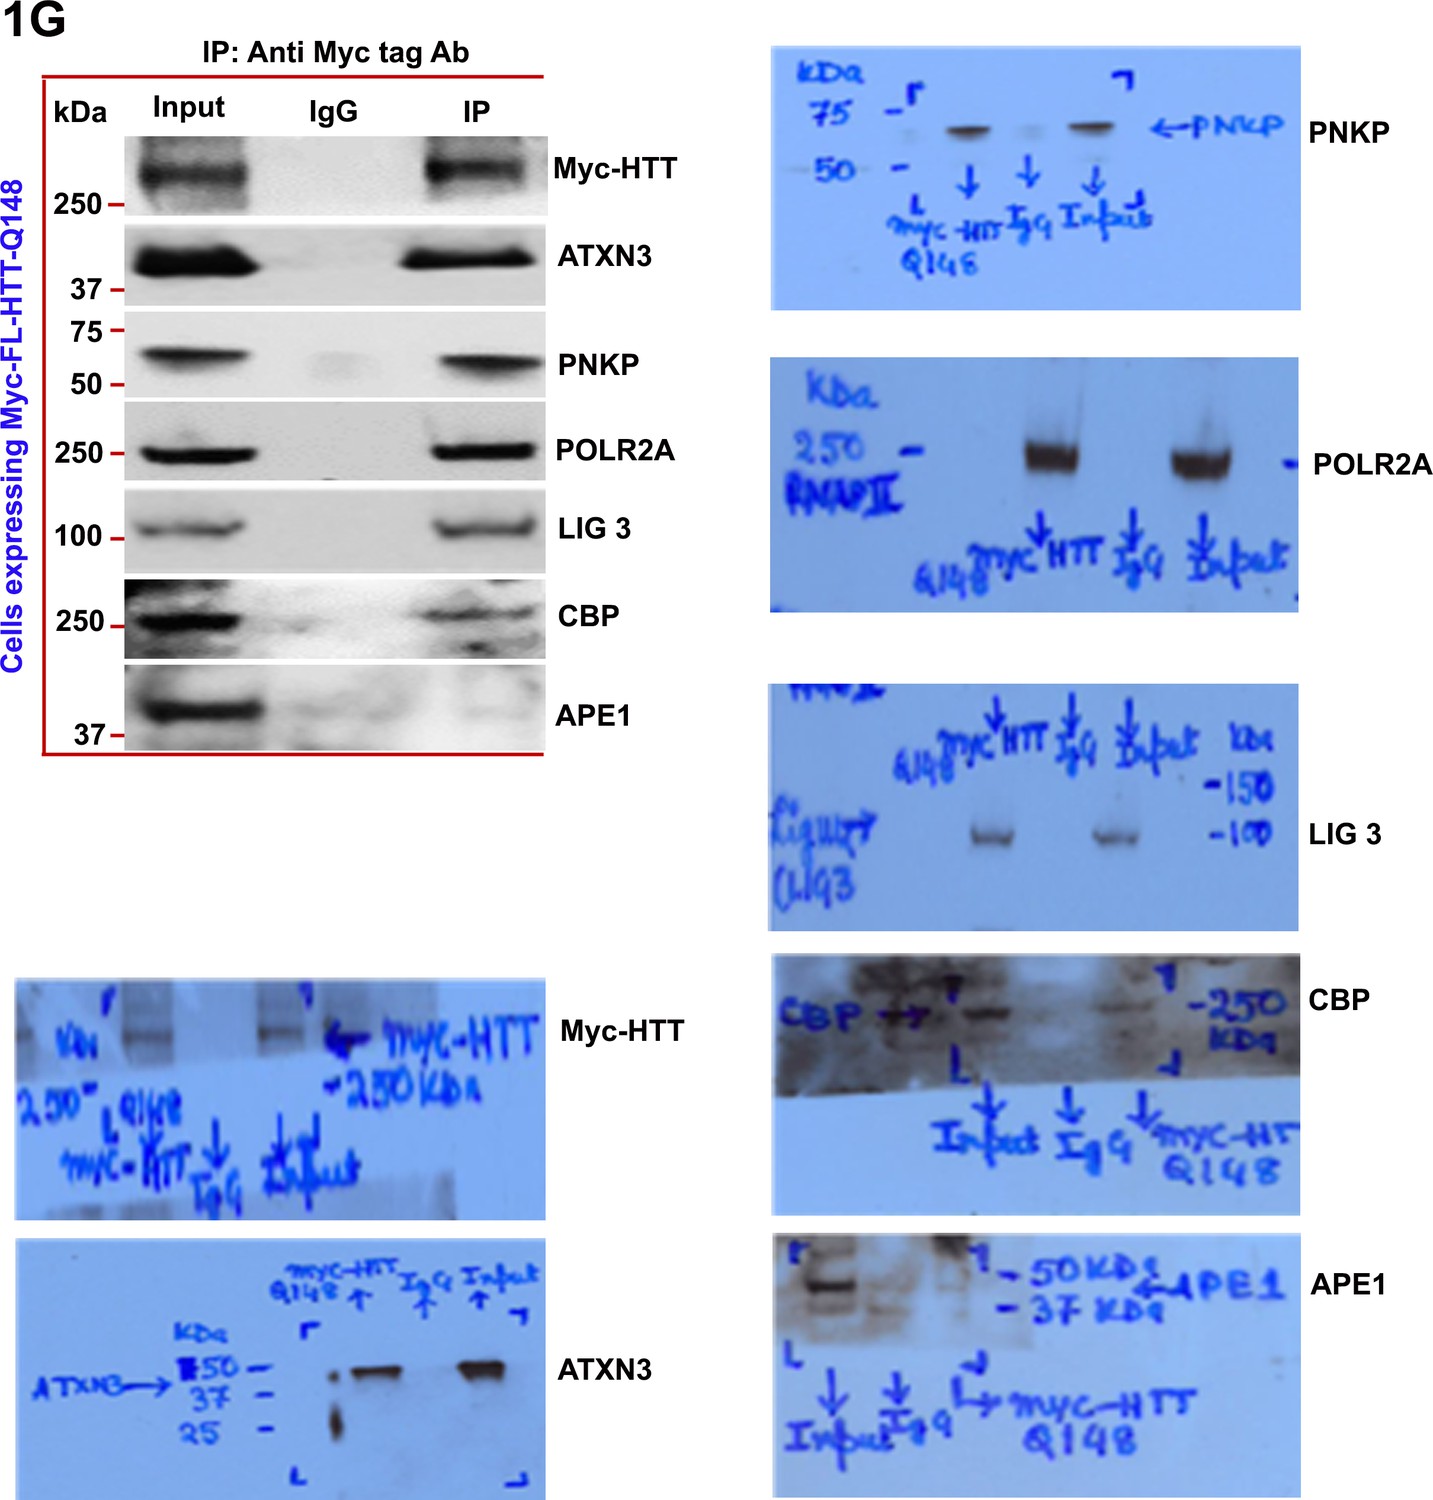
Mutant HTT is a part of the multiprotein TCR complex in vitro.
Nuclear extract (NEs) was isolated from PC12 cells ectopically expressing a Myc-tagged full-length mutant HTT encoding 148Qs (FL-mHTT-Q148) for assessing the possible interaction of mutant HTT with POLR2A and associated TCR proteins. Myc-FL-mHTT-Q148 was IP’d with an anti-Myc antibody, and the Myc immunocomplex was subjected to WBs with respective antibodies.
Figure 1—figure supplement 7

HTT is a component of the TCR complex in vivo.
(A) Proximity Ligation Analysis (PLA) was performed on normal (left) and HD (expressing mHTT-Q58, adult onset HD patient, disease grade 4/4 and manifested severe phenotypes) patient brain sections (right) with anti-HTT (mouse) and anti-PNKP (rabbit) antibodies, and confocal image analysis was performed to assess possible in vivo interaction of HTT and PNKP. Arrows indicate the representative colocalization of the HTT and PNKP proteins in the nucleus. Nuclei were stained by DAPI (blue). Bar = 10 µm. (B) PLA on control and HD brain section was performed with anti-ATXN3 (rabbit) and anti-PNKP (mouse) antibodies to assess possible in vivo interaction. (C) ATXN3 (rabbit) and HTT (mouse) antibodies to assess the in vivo protein association of the two proteins. Red fluorescence indicates positive protein-protein interactions (arrows indicate positive PLA signals).
Figure 2
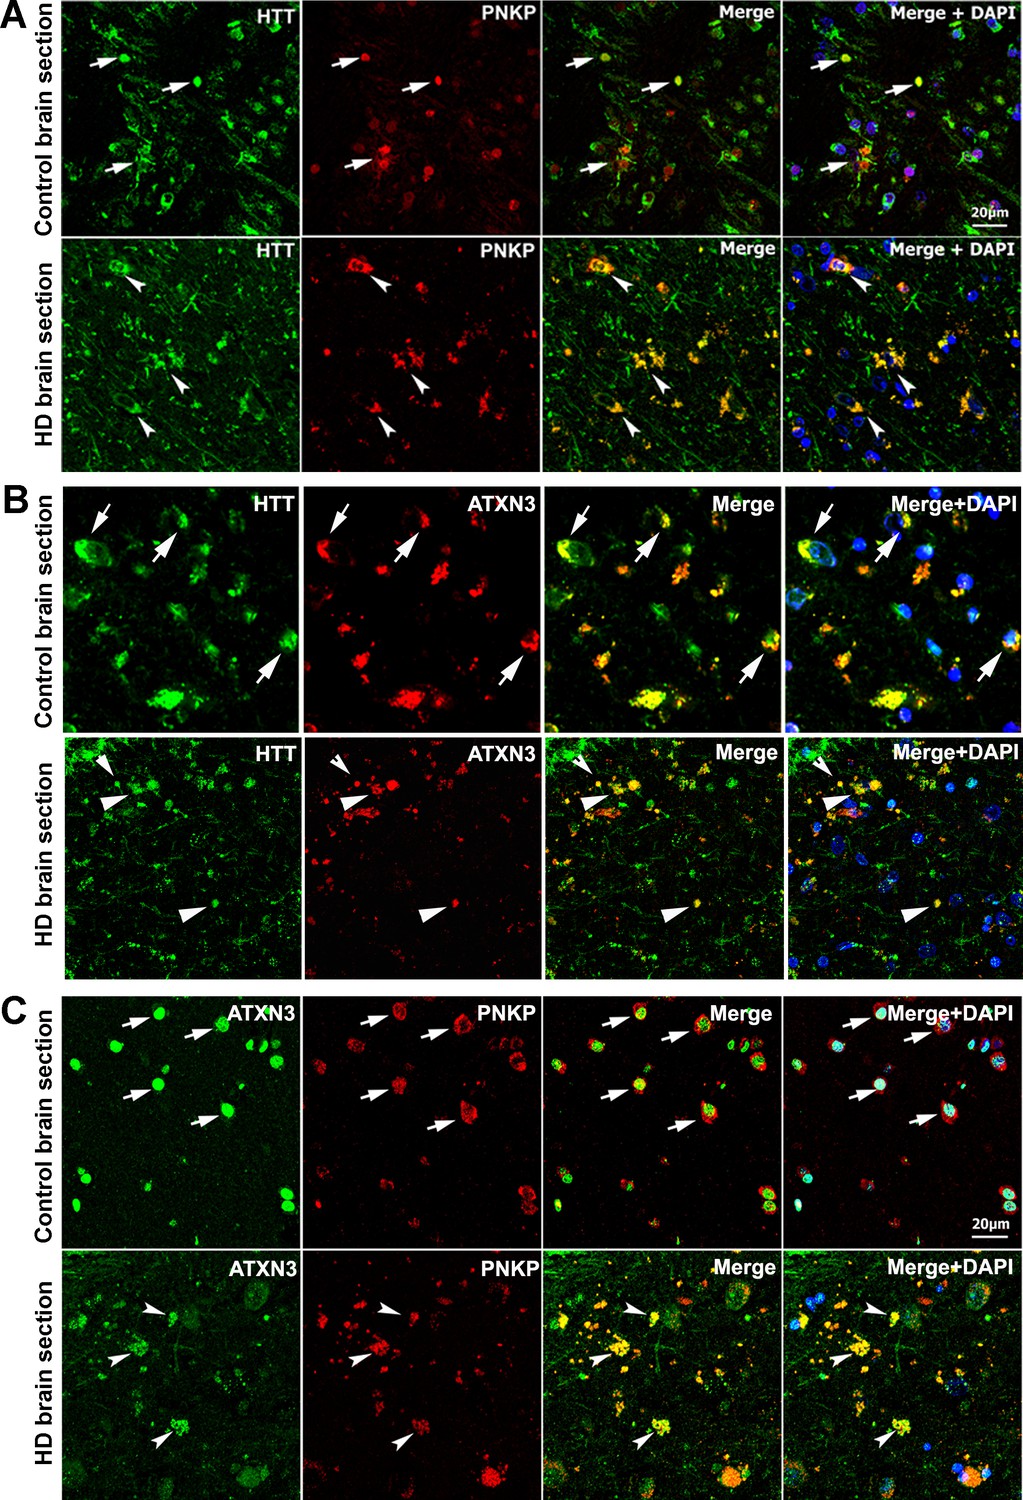
HTT colocalizes with PNKP and ATXN3 in postmortem human brain sections.
(A) Normal and HD postmortem brain (mHTT-Q94) sections were analyzed by double immunolabeling with antibodies against HTT (green) and PNKP (red) to assess their in vivo colocalization and possible interactions (representative colocalization of HTT and PNKP are shown by arrows). For panels A and B, merge of red and green fluorescence appears as yellow/orange, and nuclei were stained with DAPI (blue). (B) Normal and HD brain (mHTT-Q82; early onset HD patients, disease grade 4/4, manifesting severe phenotype) sections analyzed by double immunolabeling with antibodies against HTT (green) and ATXN3 (red) to assess their in vivo colocalization and possible interaction (arrows). (C) Normal and HD brain (mHTT-Q94; early onset HD patients, disease grade 4/4, manifesting severe phenotype) sections were analyzed by double immunolabeling with antibodies against ATXN3 (green) and PNKP (red) to assess their in vivo colocalization and possible interaction (arrows).
Figure 3
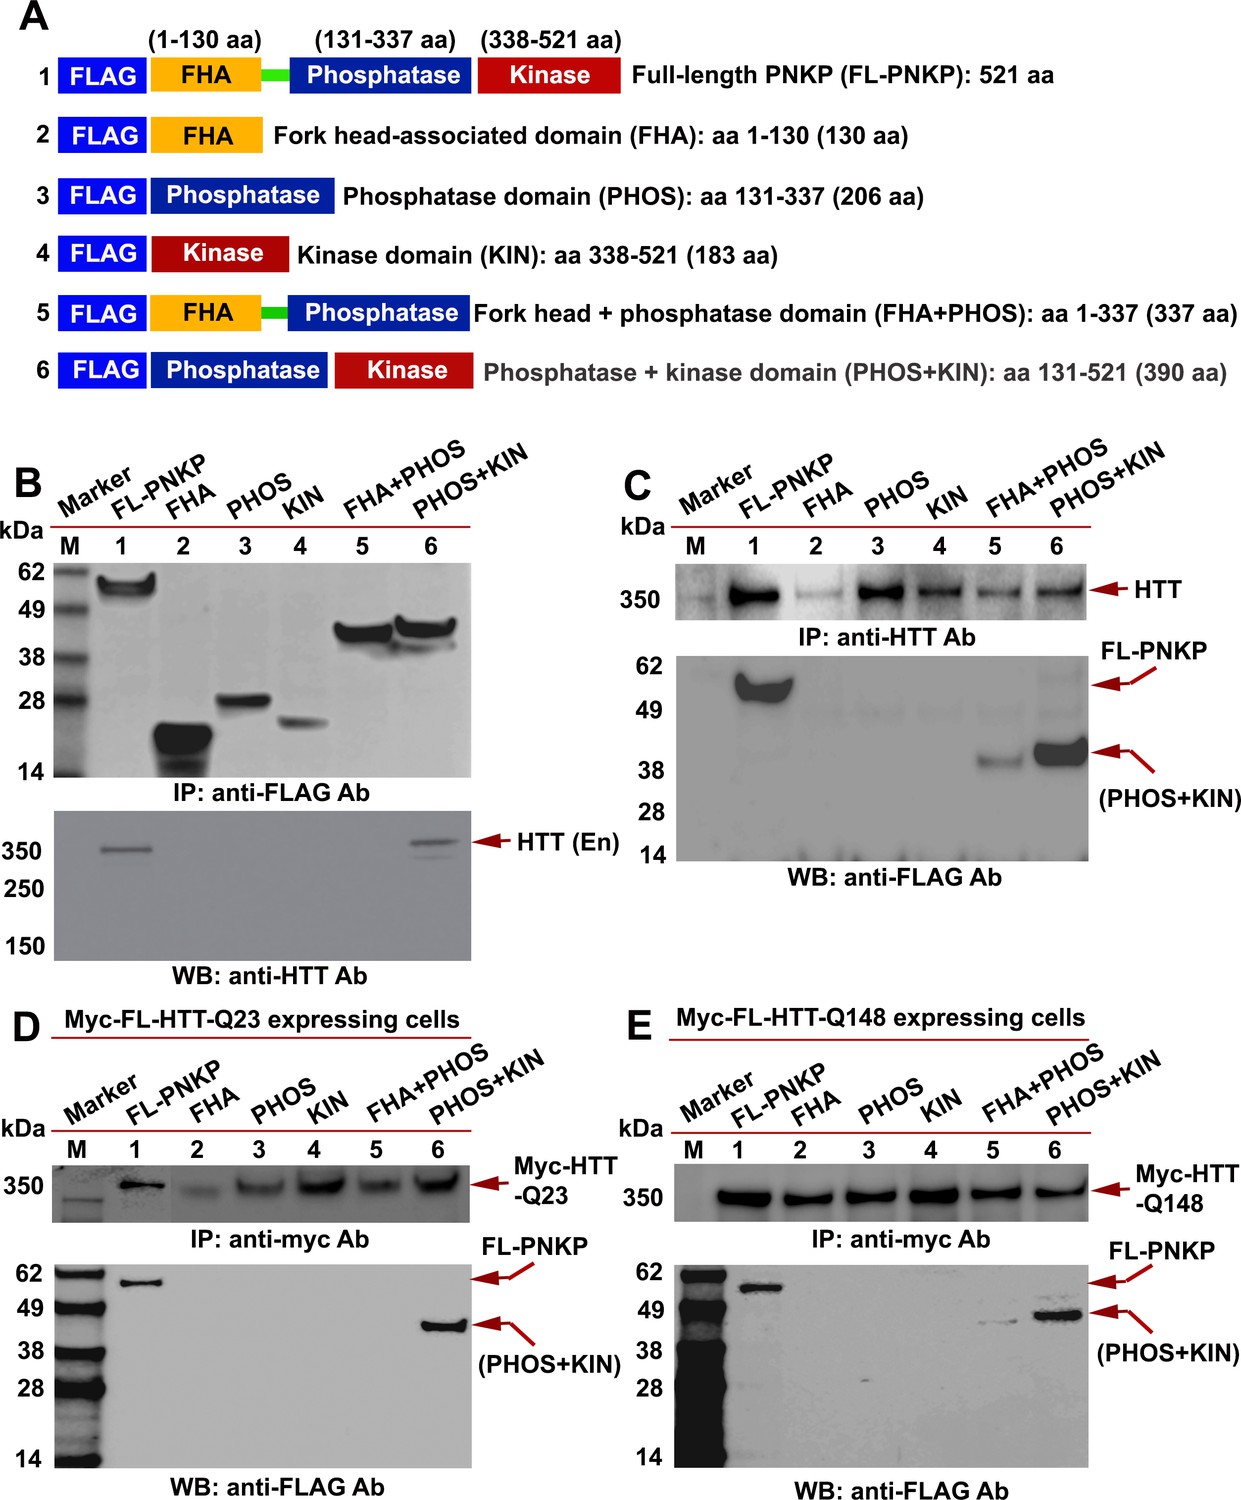
HTT interacts with the C-terminal catalytic domain of PNKP.
(A) Schematic illustrating various functional domains of PNKP expressed as FLAG-tagged peptides: (1) full-length PNKP containing N-terminal fork-head-associated (FHA) domain, central phosphatase (PHOS) and C-terminal kinase (KIN) domains; (2) FHA domain (1–130 amino acids); (3) PHOS domain (131–337 amino acids); (4) KIN domain (338–521 amino acids); (5) FHA and PHOS domains (1–137 amino acids); and (6) PHOS and KIN domains (131–521 amino acids). (B) Plasmids encoding full-length PNKP (FL-PNKP) or various PNKP domains were separately transfected into SH-SY5Y cells (lanes 1 to 6) and NEs isolated 48 hr post-transfection. Lanes 1 to 6 in the WB (upper panel) shows the pull-down of full-length PNKP (FL-PNKP) and various PNKP domains that were IP’d with an anti-FLAG Ab. The WB in the lower panel shows the presence of endogenous HTT (arrow) in the FLAG-IC. M: protein molecular weight marker. (C) Plasmids encoding full-length PNKP (FL-PNKP) and various PNKP domains were separately transfected into SH-SY5Y cells (lanes 1 to 6), NEs isolated, and HTT was IP’d with an anti-HTT antibody. The pull-down of endogenous HTT is shown in the upper panel (arrow). The HTT-IC was analyzed by WB (lower panel) to detect FL-PNKP or various PNKP domains with an anti-FLAG Ab (arrows). (D) Plasmids encoding FLAG-tagged full-length PNKP (FL-PNKP) or various PNKP domains were transfected separately into PC12 cells expressing full-length Myc-tagged normal HTT encoding 23Qs (Myc-FL-wtHTT-Q23) (lanes 1 to 6), NEs were isolated, and Myc-HTT IP’d with Myc tag antibody. Upper panel is the WB showing the IP of HTT with an anti-Myc tag antibody. The Myc-IC was analyzed by WB to assess interaction of various PNKP domains with HTT with an anti-FLAG antibody (lower panel, arrows). (E) Plasmids encoding the full-length PNKP (FL-PNKP) or various PNKP domains were transfected into PC12 cells expressing Myc-tagged full-length mutant HTT encoding 148Qs (Myc-FL-mHTT-Q148) (lanes 1 to 6), NEs isolated, and Myc-tagged HTT was IP’d with an anti-Myc-tag antibody. Upper panel is the WB showing IP of Myc-HTT with anti-Myc tag antibody. Interactions of FL-PNKP or various PNKP domains with FL-HTT were analyzed by WB with an anti-FLAG antibody (lower panel, arrows).
Figure 4
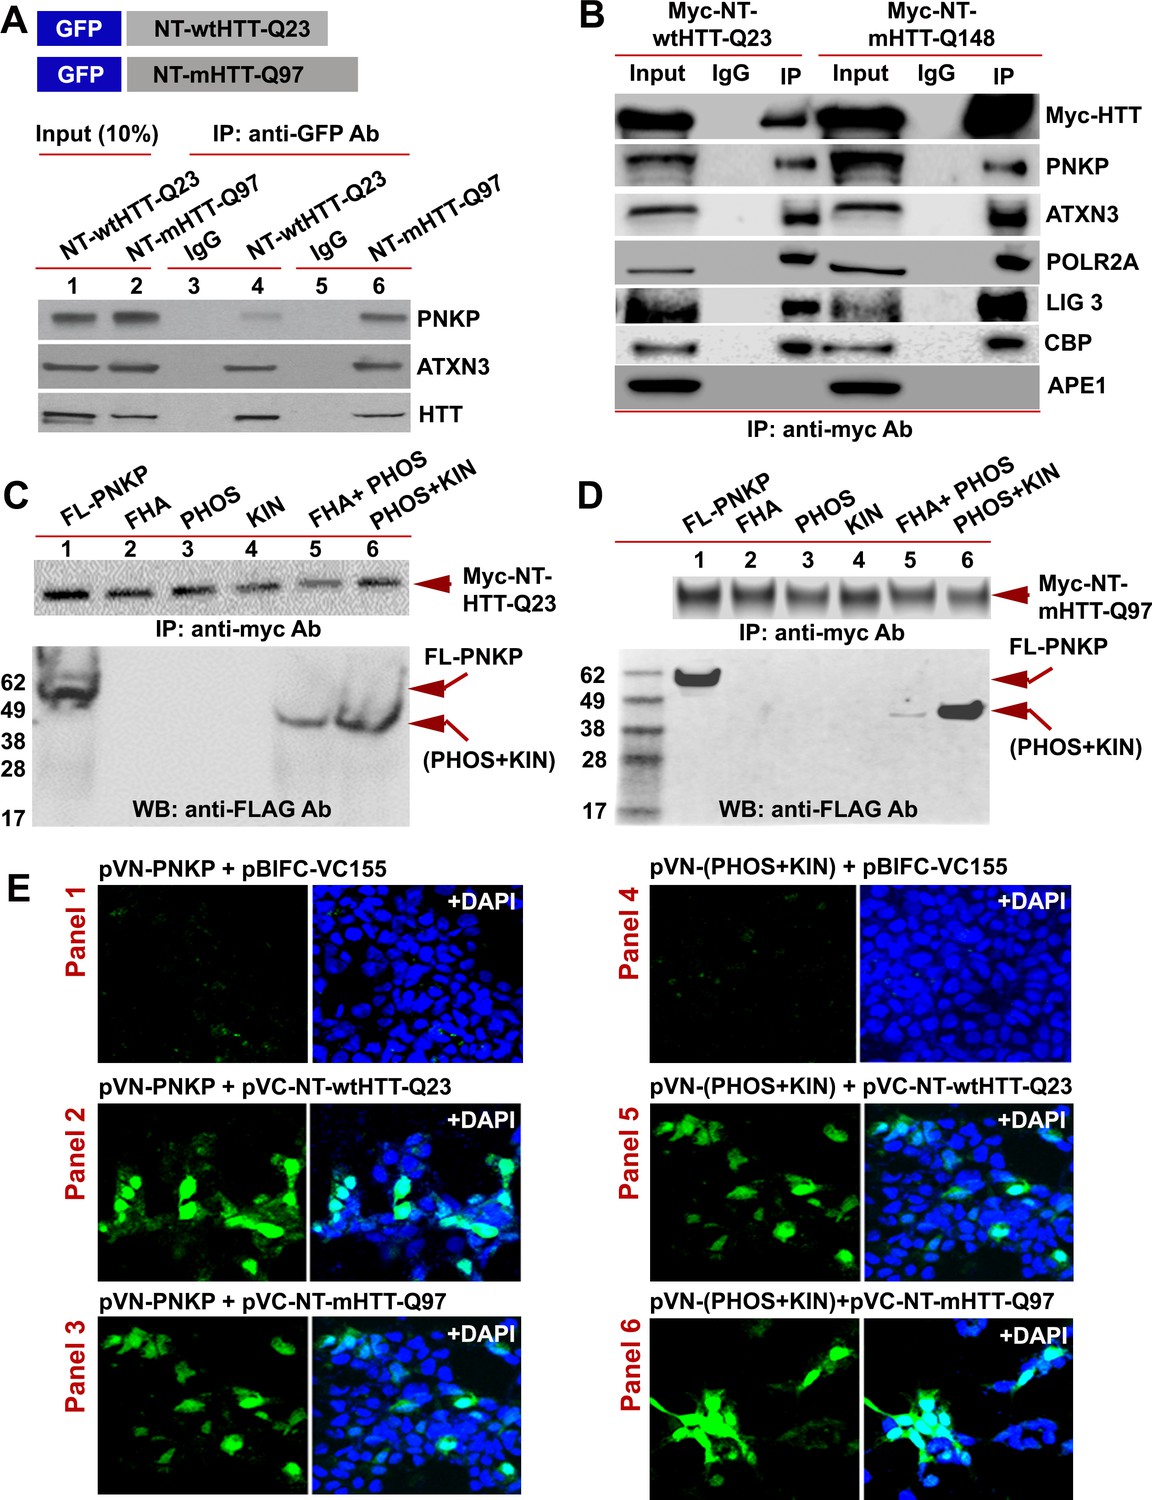
The N-terminus of HTT interacts with the C-terminal catalytic domain of PNKP.
(A) Schematic showing GFP-tagged N-terminal fragment of wild-type normal HTT encoding 23Qs or mutant HTT encoding 97Qs (NT-wtHTT-Q23 and NT-mHTT-Q97 plasmid vectors respectively; upper panel). SH-SY5Y cells were transfected with NT-wtHTT-Q23 or NT-mHTT-Q97, NEs isolated, fusion peptides IP’d from NE with an anti-GFP antibody, and WBs performed with respective antibodies to detect endogenous PNKP, ATXN3, or HTT in the GFP-IC (lower panel). (B) NEs from PC12 cells expressing Myc-tagged N-terminal fragment of wild-type normal HTT encoding 23Qs or mutant HTT encoding 148Qs (NT-wtHTT-Q23 or NT-mHTT-Q148, respectively) were isolated and the Myc-HTT was IP’d with an anti-Myc tag Ab and Myc-IC was analyzed by WBs to detect various TCR complex components with respective antibodies. (C) Plasmids encoding full-length PNKP (FL-PNKP) or various PNKP domains (lanes 1 to 6) were separately transfected into SH-SY5Y cells expressing the N-terminal fragment of HTT encoding 23Qs (Myc-NT-wtHTT-Q23), NEs were isolated and the NT-HTT was IP’d with an anti-Myc tag Ab. The upper panel shows pull down of Myc-NT-HTT-Q23. The Myc-IC was analyzed by WBs with an anti-FLAG Ab to detect FL-PNKP or PNKP domains (lower panel; arrows). (D) Plasmids encoding full-length PNKP (FL-PNKP) or various domains (lanes 1 to 6) were separately transfected into SH-SY5Y cells expressing the N-terminal fragment of mutant HTT encoding 97Qs (Myc-mHTT-Q97) and NEs were isolated and the Myc-NT-HTT-Q97 was IP’d with an anti-Myc tag Ab and the Myc-IC was analyzed by WBs to detect FL-PNKP or PNKP domains (lower panel; arrows). (E) BiFC assay of SH-SY5Y cells cotransfected with plasmids: Panel 1) pVN173-PNKP and pVC-BIFC-155, Panel 2) pVN-PNKP and pVC-NT-wtHTT-Q23, Panel 3) pVN-PNKP and pVC-NT-mHTT-Q97, Panel 4) pVN (PHOS + KIN) and pVC-BIFC-155, Panel 5) pVN-(PHOS + KIN) and pVC-NT-wtHTT-Q23, and panel 6) pVN-(PHOS + KIN) and pVC-NT-mHTT-Q97. Reconstitution of fluorescence was monitored via fluorescence microscopy. Nuclei were stained with DAPI (blue).
Figure 5 with 5 supplements
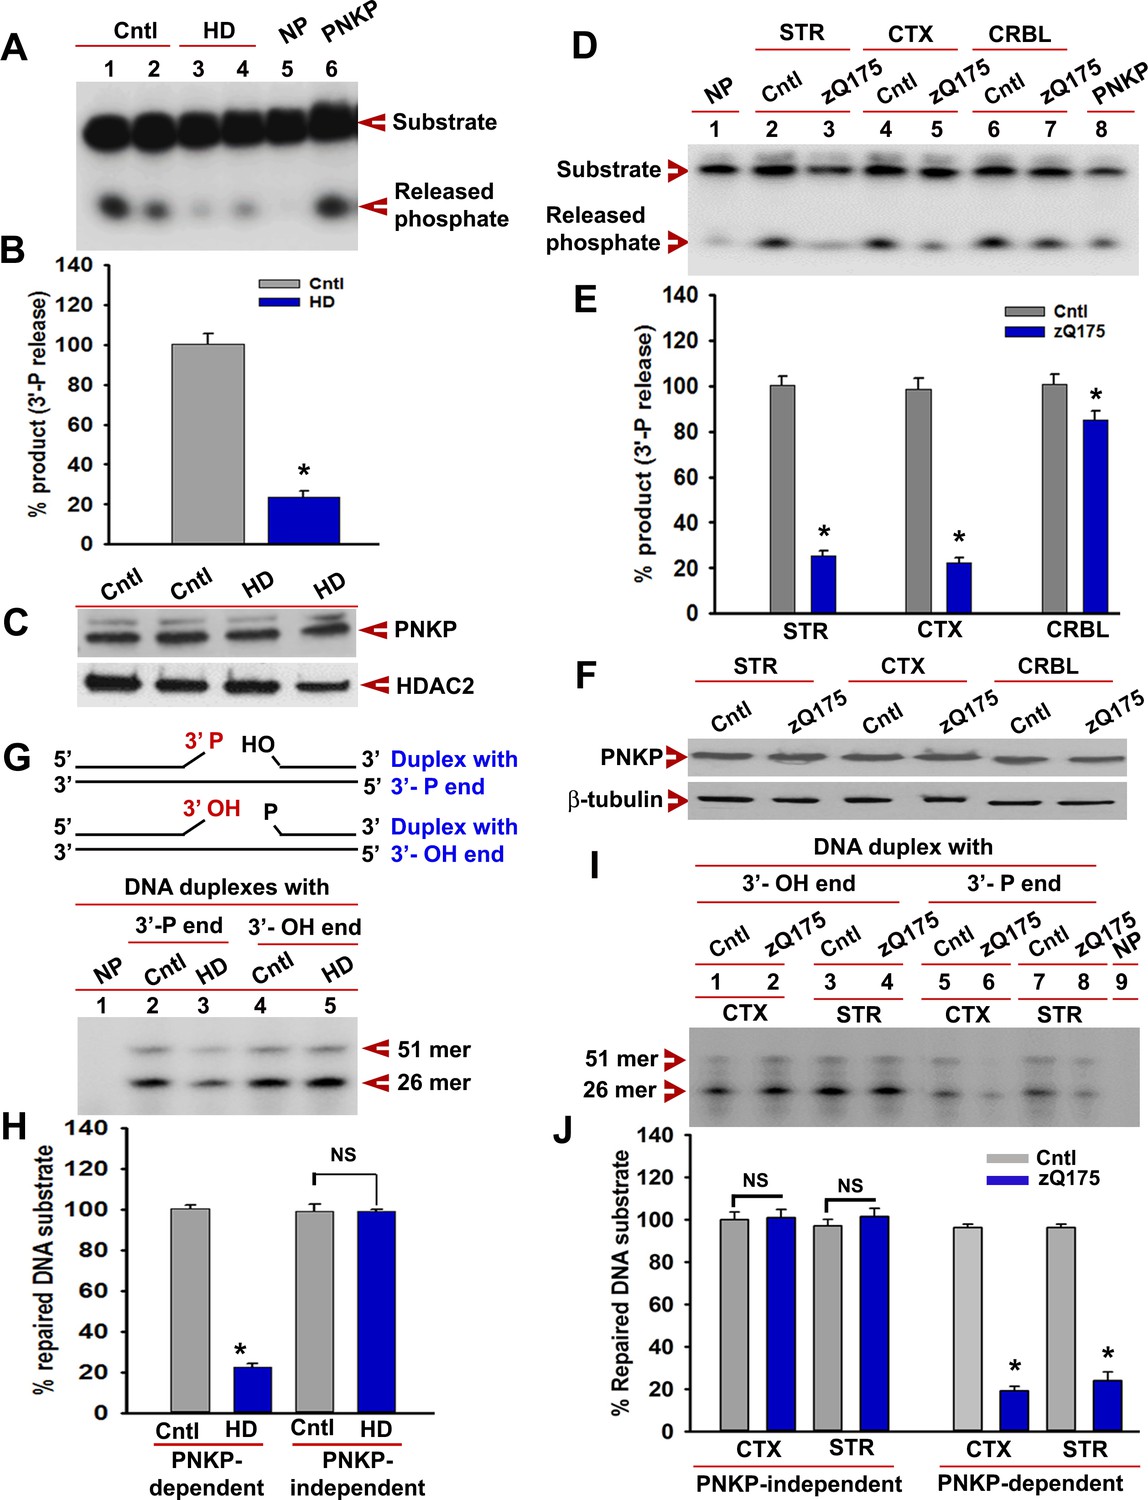
mHTT abrogates PNKP activity in vitro and in vivo.
(A) The 3'-phosphatase activities of PNKP in the NE (250 ng each) of control (lanes 1 and 2, differentiation replicates of Q33 iPSCs), and HD neurons (lanes 3 and 4, differentiation replicates of Q109 iPSCs) were determined by amount of phosphate release from the DNA substrate (arrows). No protein extract was added to the substrate in lane 5 (NP), and purified PNKP (25 fmol) was added as a positive control (lane 6). (B) Relative 3'-phosphatase activities (in terms of % product) of PNKP in control (Q33) and HD (Q109) neurons. Data represent mean ± SD, *p<0.001 when compared with control. The quantification was measured by taking into account two biological replicates and three technical replicates. (C) NEs from control (Q33) and HD neurons (Q109) were analyzed by WB to determine PNKP protein levels (upper panel); HDAC2 was used as a loading control (lower panel). (D) PNKP activities in the NEs from the striatum (STR), cortex (CTX) and cerebellum (CRBL) of 7 weeks old WT control and zQ175 transgenic mice (n = 5; STR or CTX or CRBL were pooled from five littermate mice); no protein was added to the substrate in lane 1 (NP), and purified PNKP was added as a positive control (lane 8). (E) Relative PNKP activities (in terms of % product) in the STR, CTX, and CRBL of 7 weeks old zQ175 transgenic (n = 5) and age-matched control (n = 5) mice. Five biological replicates and three technical replicates were used in this study. Data represent mean ± SD, *p<0.001 when compared with control. (F) NEs from the STR, CTX, and CRBL of zQ175 (n = 5) and age-matched wild type control (n = 5) mice were analyzed by WB to determine PNKP levels (upper panel); β-tubulin was used as a loading control (lower panel). (G) mHTT specifically abrogates PNKP activity without interfering with DNA polymerase or ligase activities. Total DNA repair was assessed with NE (2.5 µg) from control (Q33) and HD (Q109) neurons added to two nicked DNA duplexes (upper panel): one with 3'-phosphate ends that require PNKP activity (lanes 2 and 3, lower panel), and the other with clean 3'-OH termini that do not require PNKP activity but need DNA polymerase and ligase activities (lanes 4 and 5, lower panel) for effective repair. The 51-mer DNA band (arrow) represents repaired DNA duplexes in G and I. (H) Relative PNKP and PNKP-independent DNA repair efficiencies in HD (Q109) and control (Q33) primary neurons. NS denotes not significant difference in H and J. Two biological replicates and three technical replicates were used in this study. Data represent mean ± SD. (I) NEs from zQ175 transgenic (n = 5) and control (n = 5) mice CTX and STR were added to nicked DNA substrates as described above, and total DNA repair was assessed. (J) PNKP-dependent or -independent repair of the DNA duplexes by NEs from control and zQ175 transgenic mouse brain tissue. Data represent mean ± SD, *p<0.001 for E, H, and J. Three biological replicates and three technical replicates were used in this assay.
-
Figure 5—source data 1
Huntinton's disease models.
- https://doi.org/10.7554/eLife.42988.020
Figure 5—figure supplement 1
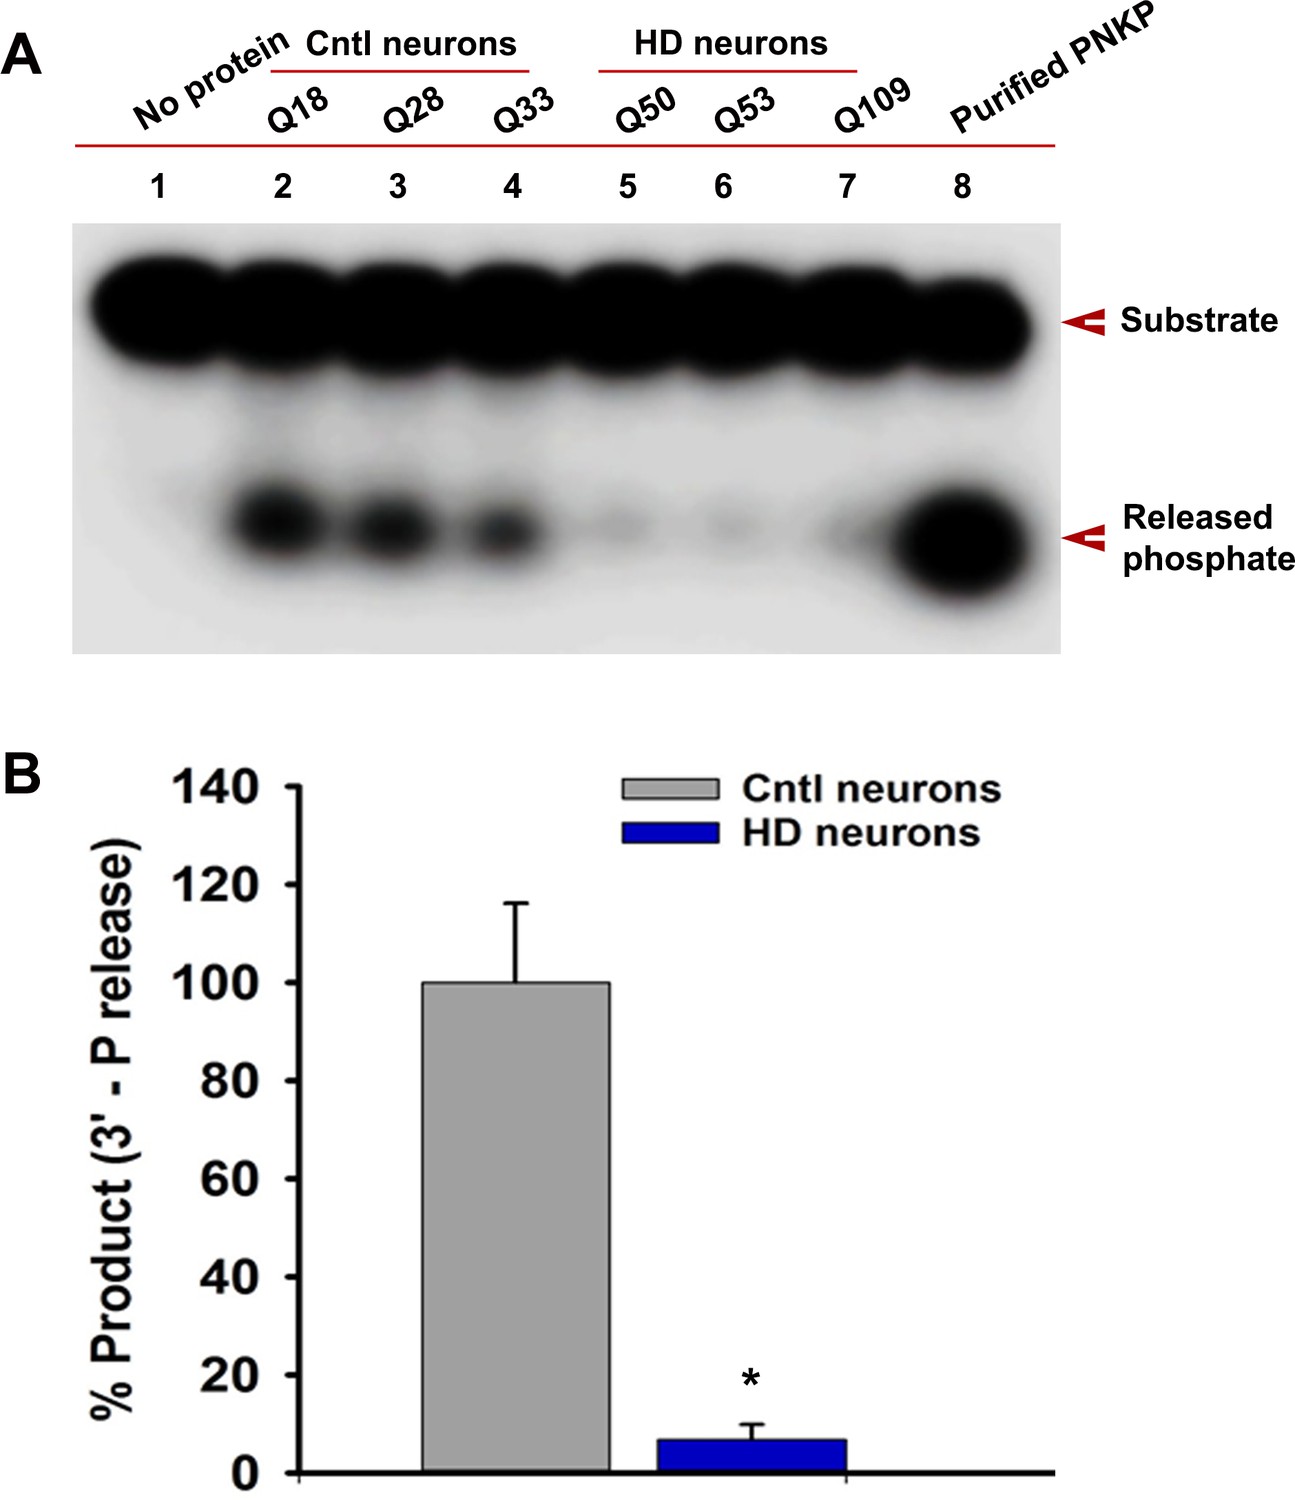
Endogenous level of mHTT is sufficient to deplete nuclear PNKP activity in iPSC-derived HD primary striatal neurons.
(A) The 3'-phosphatase activities of PNKP in the NE (250 ng each) of control (lanes 2, 3 and 4; differentiated iPSCs expressing Q18, Q28 and Q33), and HD neurons (lanes 5, 6 and 7; differentiated iPSCs expressing Q50, Q53 and Q109) were determined by measuring phosphate release from the DNA substrate (arrows). No protein extract was added to the substrate in lane one and purified PNKP (25 fmol) was added as a positive control (lane 8). (B) Relative 3'-phosphatase activities (in terms of % product) of PNKP in control (Q18, Q28 and Q33) and HD (Q50, Q53 and Q109) neurons. Data represent mean ± SD, *p<0.001 when compared with control. Three biological replicates and four technical replicates were used in measuring the phosphatase activities of PNKP.
Figure 5—figure supplement 2
mHTT-mediated inactivation of the TCR complex abrogates PNKP activity.
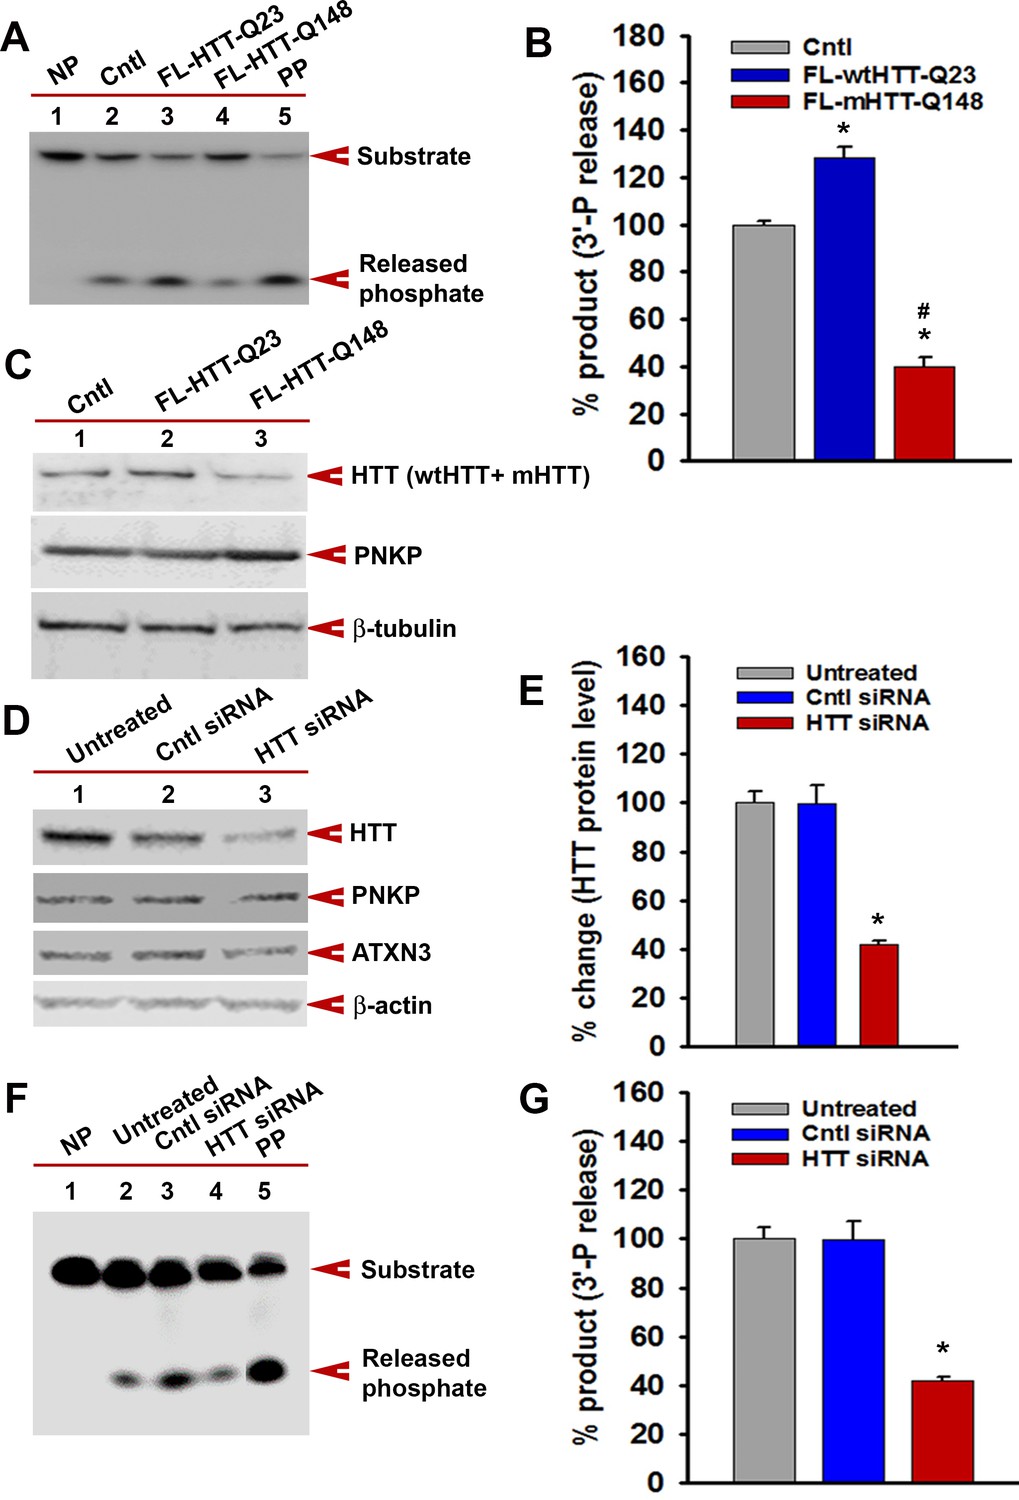
(A) The 3'-phosphatase activities of PNKP in the NE (250 ng each) of WT (Cntl: lane 2), wtHTT-Q23-expressing (lane 3), and mHTT-Q148-expressing (lane 4) PC12 cells were determined by measuring phosphate release from the DNA substrate (arrows). No protein extract was added to the substrate in lane 1 (NP), and purified PNKP (PP; 25 fmol) was added as a positive control (lane 5). (B) Relative 3'-phosphatase activities (in terms of % product) of PNKP in WT control cells and cells expressing wtHTT-Q23 or mHTT-Q148. Data represent mean ± SD, *p<0.001 when compared with control and #p<0.001 when compared with FL-HTT-Q148. (C) NEs from WT control, wtHTT-Q23, or mHTT-Q148-expressing PC12 cells were analyzed by WB to determine PNKP protein levels; β-tubulin was the loading control. (D) NEs were isolated from untreated SH-SY5Y cells (lane 1), cells transfected with control siRNA (lane 2), or HTT siRNA (lane 3), and analyzed by WBs to detect HTT, PNKP, and ATXN3; β-actin was the loading control. (E) Relative levels of HTT in untreated SH-SY5Y cells, cells transfected with control siRNA, and HTT siRNA. Data represent mean ± SD; *p<0.001. (F) The 3'-phosphatase activities of PNKP in the NE of SH-SY5Y cells (lane 2), cells transfected with control siRNA (lane 3) and HTT siRNA (lane 4). No protein extract was added to the substrate in lane 1 (NP), and purified PNKP (PP; 25 fmol) was added as a positive control (lane 5). (G) Relative 3'-phosphatase activities (in terms of % product) of PNKP in untreated SH-SY5Y cells, transfected with control siRNA or HTT siRNA. Data represent mean ± SD; *p<0.001.
Figure 5—figure supplement 3
Expression of the N-terminus of mHTT abrogates PNKP activity.
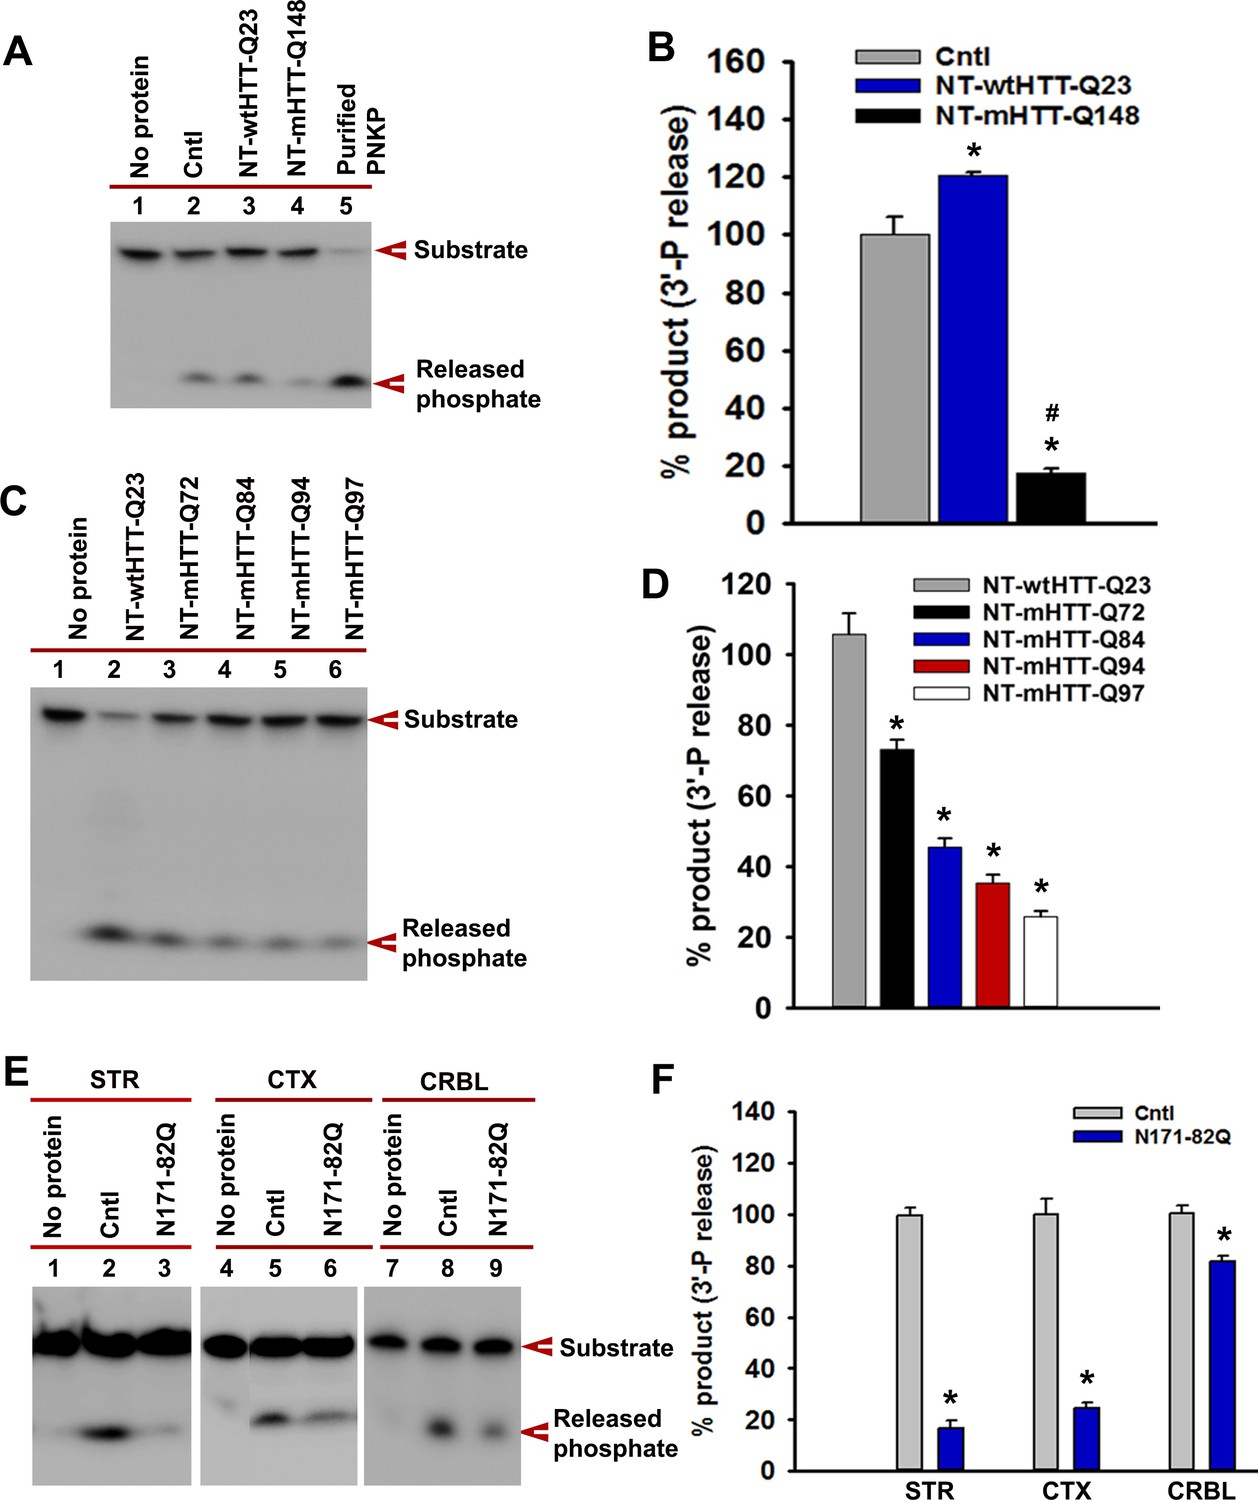
(A) NEs were isolated from WT PC12 cells (Cntl; lane 2) or cells expressing NT-wtHTT-Q23 (lane 3) or NT-mHTT-Q148 (lane 4), and PNKP activity was assessed. (B) Relative amounts of phosphate release from WT control PC12 cells and cells expressing NT-wtHTT-Q23 and NT-mHTT-Q148. Data represent mean ± SD, *p<0.001 when phosphate release in NT-wtHTT-Q23 and NT-mHTT-Q148 was compared with control PC12 cells and #p<0.001 when the phosphate release in NT-mHTT-Q148 was compared with NT-wtHTT-Q23. (C) NEs were isolated from SH-SY5Y cells expressing the N-terminus of HTT encoding Q23, Q72, Q84, Q94, and Q97, and PNKP activity was assessed. The products were analyzed to determine how much phosphate was released from the substrate (arrow). (D) The amounts of phosphate released from the substrate (arrow) when NEs of SH-SY5Y cells expressing NT-HTT encoding Q23, Q72, Q84, Q94, and Q97 were added. Data represents mean ± SD, *p<0.001. Three technical replicates were used in this assay. (E) PNKP activities measured in NEs from STR, CTX, or CRBL of N171-82Q and control mice. (F) Relative PNKP activities in control and N171-82Q transgenic mice STR, CTX, and CRBL. Data represents mean ± SD, *p<0.001. Three biological replicates and three technical replicates were used in Figure 5—figure supplement 3E and F.
Figure 5—figure supplement 4

mHTT triggers DNA damage response (DDR)-ATM signaling.
(A) Total protein from the induced pluripotent stem cell (iPSC)-derived primary control neurons (Q18 and Q28) and HD primary neurons (Q50 and Q53) was isolated and analyzed by WBs to detect p-ATM-S1981, total ATM, p-γH2AX-S139, total H2AX, p-p53-S15, and total p53 levels; HDAC2 was the loading control. (B) Relative levels of p-ATM-S1981, p-γH2AX, and p-p53-S15 in iPSC-derived control and HD neurons with respect to the corresponding total proteins. Data represent mean ± SEM. (C) Total protein from the STR of zQ175 and age-matched control WT mice (n = 4) was isolated and the protein extracts were pooled together and analyzed by WBs to detect p-ATM-S1981, total ATM, p-γH2AX-S139, total H2AX, p-p53-S15, and total p53 levels; β-tubulin was the loading control. (D) Relative levels of p-ATM-S1981, p-γH2AX-S139, and p-p53-S15 in control and zQ175 mice STR with respect to the corresponding total proteins. Data represent mean ± SEM. (E) Total RNA was isolated from the CTX of 36 weeks old zQ175 and age-matched control WT mice, and mRNA levels of the p53 target genes analyzed by q-RT-PCR. 18 s rRNA gene was used as control. Data represent mean ± SD; *p<0.001 in B, D, and E. (F) Total RNA was isolated from the CRBL of 36 weeks old zQ175 and age-matched control WT mice, and mRNA levels of the p53 target genes analyzed by q-RT-PCR. NS = not significant.
Figure 5—figure supplement 5
PNKP overexpression in mutant cells rescues cell toxicity.
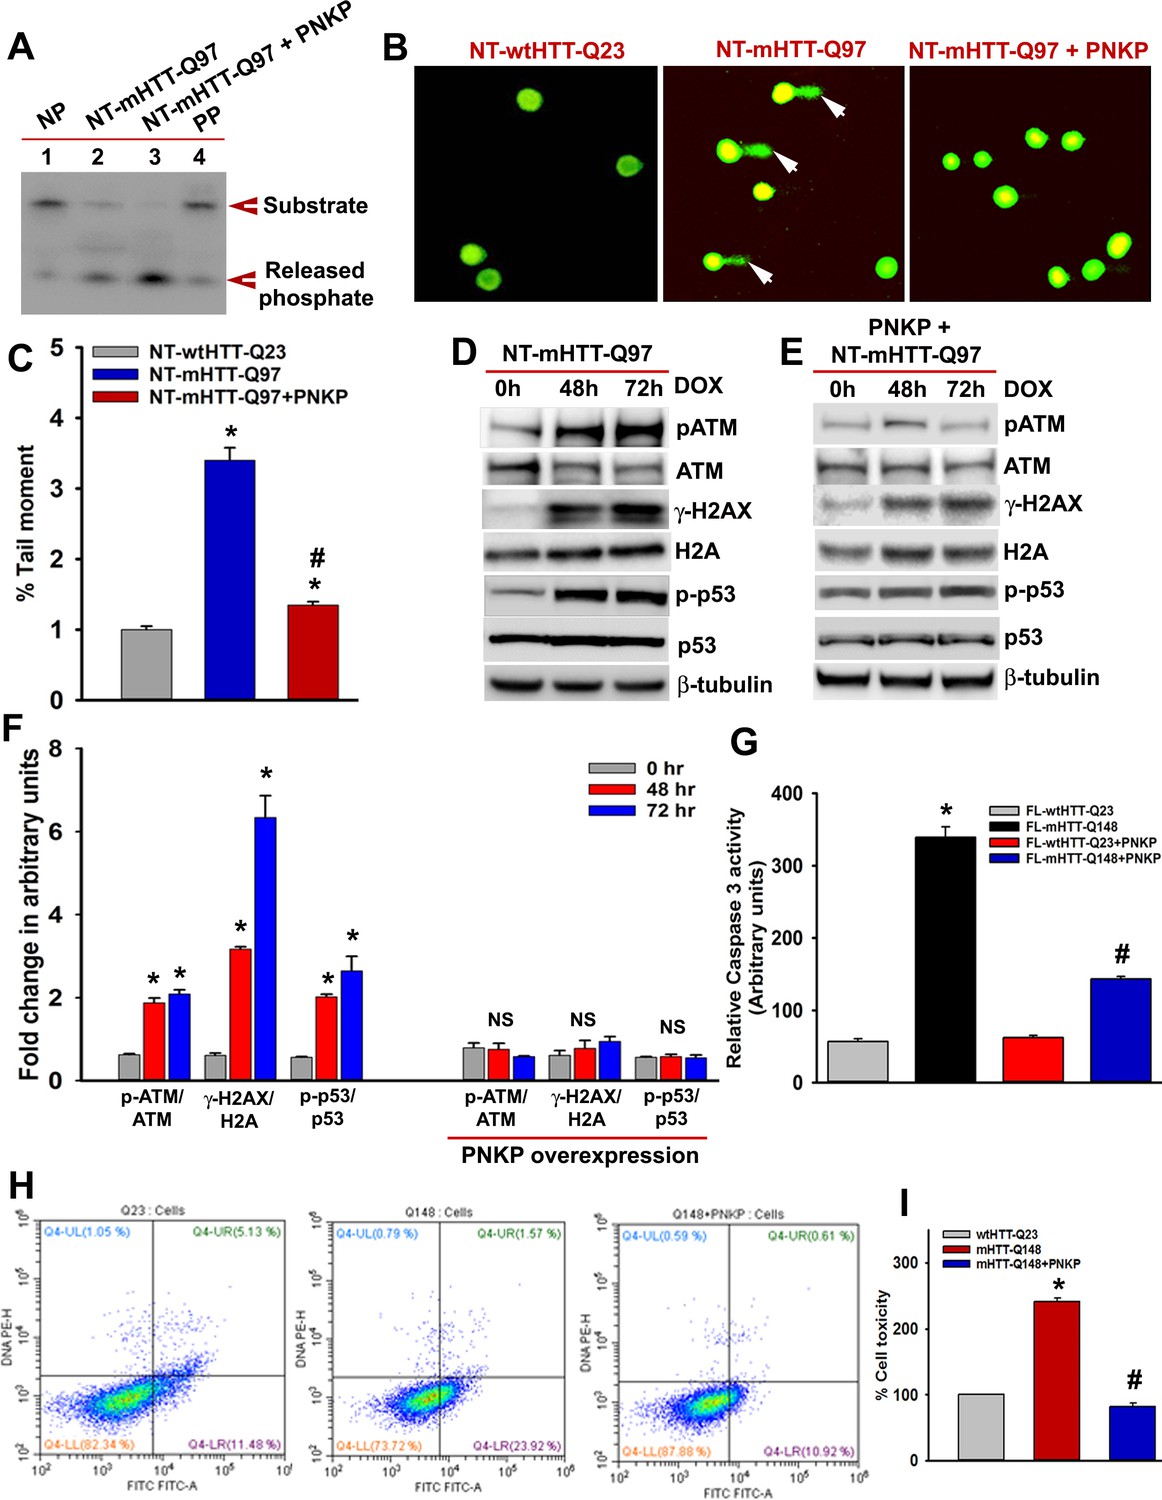
(A) NEs isolated from the mutant SH-SY5Y cells (NT-mHTT-Q97) (lane 2) and mutant cells with PNKP overexpression (lane 3), and PNKP activity was measured. No protein was added in lane 1 (NP) and purified PNKP was added in lane 4 (PP). DNA substrate and the released phosphate are shown by arrows. (B) Alkaline comet analyses of cells expressing NT-wtHTT-Q23 (left panel), NT-mHTT-Q97 (center panel), and co-expressing NT-mHTT-Q97 and PNKP (right panel). Comet tails (DNA strand breaks/damages) are shown by arrows. Nuclei are stained with SYBR green. (C) Tail moments representing strand breaks in cells expressing NT-wtHTT-Q23, NT-mHTT-Q97, and co-expressing NT-mHTT-Q97 and PNKP. Data represent mean ± SEM; *p<0.001 compared with NT-wtHTTQ23 and # p<0.001 compared with NT-mHTT-Q97 in C, E, G and I. (D) Expression of NT-mHTT-Q97 was induced (by adding doxycycline to the medium) in differentiated SH-SY5Y cells that were harvested 0, 48, and 72 hr post-induction, and NEs were analyzed by WBs to detect p-ATM-S1981, total ATM, p-p53-S15, total p53, p-γH2AX-S139, and total H2A levels; β-tubulin is the loading control. (E) Expression of NT-mHTT-Q97 was induced in differentiated SH-SY5Y cells overexpressing PNKP. NEs were analyzed to determine the levels of p-ATM-S1981, total ATM, p-γH2AX-S139, total H2A, p-p53-S15, and total p53; β-tubulin is the loading control. (F) Relative levels of p-ATM-S1981, p-γH2AX, and p-p53-S15 with respect to the corresponding total proteins. Cells were harvested 0 (gray), 48 (red), and 72 (blue) h after NT-mHTT-Q97 expression; Data represent mean ± SEM. (G) Caspase-3 activities in PC12 cells expressing FL-wtHTT-Q23, FL-mHTT-Q148, co-expressing FL-wtHTT-Q23 and PNKP, or co-expressing FL-mHTT-Q148 and PNKP. (H) Representative flow cytometry analysis showing cell toxicity in PC12 cells expressing FL-wtHTT-Q23, FL-mHTT-Q148, and co-expressing FL-mHTT-Q148 + PNKP. X-axis: Annexin-V-FITC signal. Y-axis: Propidium Iodide signal. Healthy cells are represented in the lower left quadrant, early apoptotic cells in the lower right quadrant, late apoptotic cells in the upper right quadrant, and necrotic cells in the upper left quadrant. (I) Relative levels of cell toxicity of cells expressing FL-wtHTT-Q23, FL-mHTT-Q148 and co-expressing FL-mHTT-Q148 and PNKP. Data represent mean ± SD; *p<0.001 when compared wtHTT-Q23 vs. mHTT-Q148, and #p<0.001 when compared mHTT-Q148 +PNKP with mHTT-Q148.
Figure 6 with 4 supplements
mHTT preferentially induces DNA damage/strand breaks in the transcriptionally active genome.
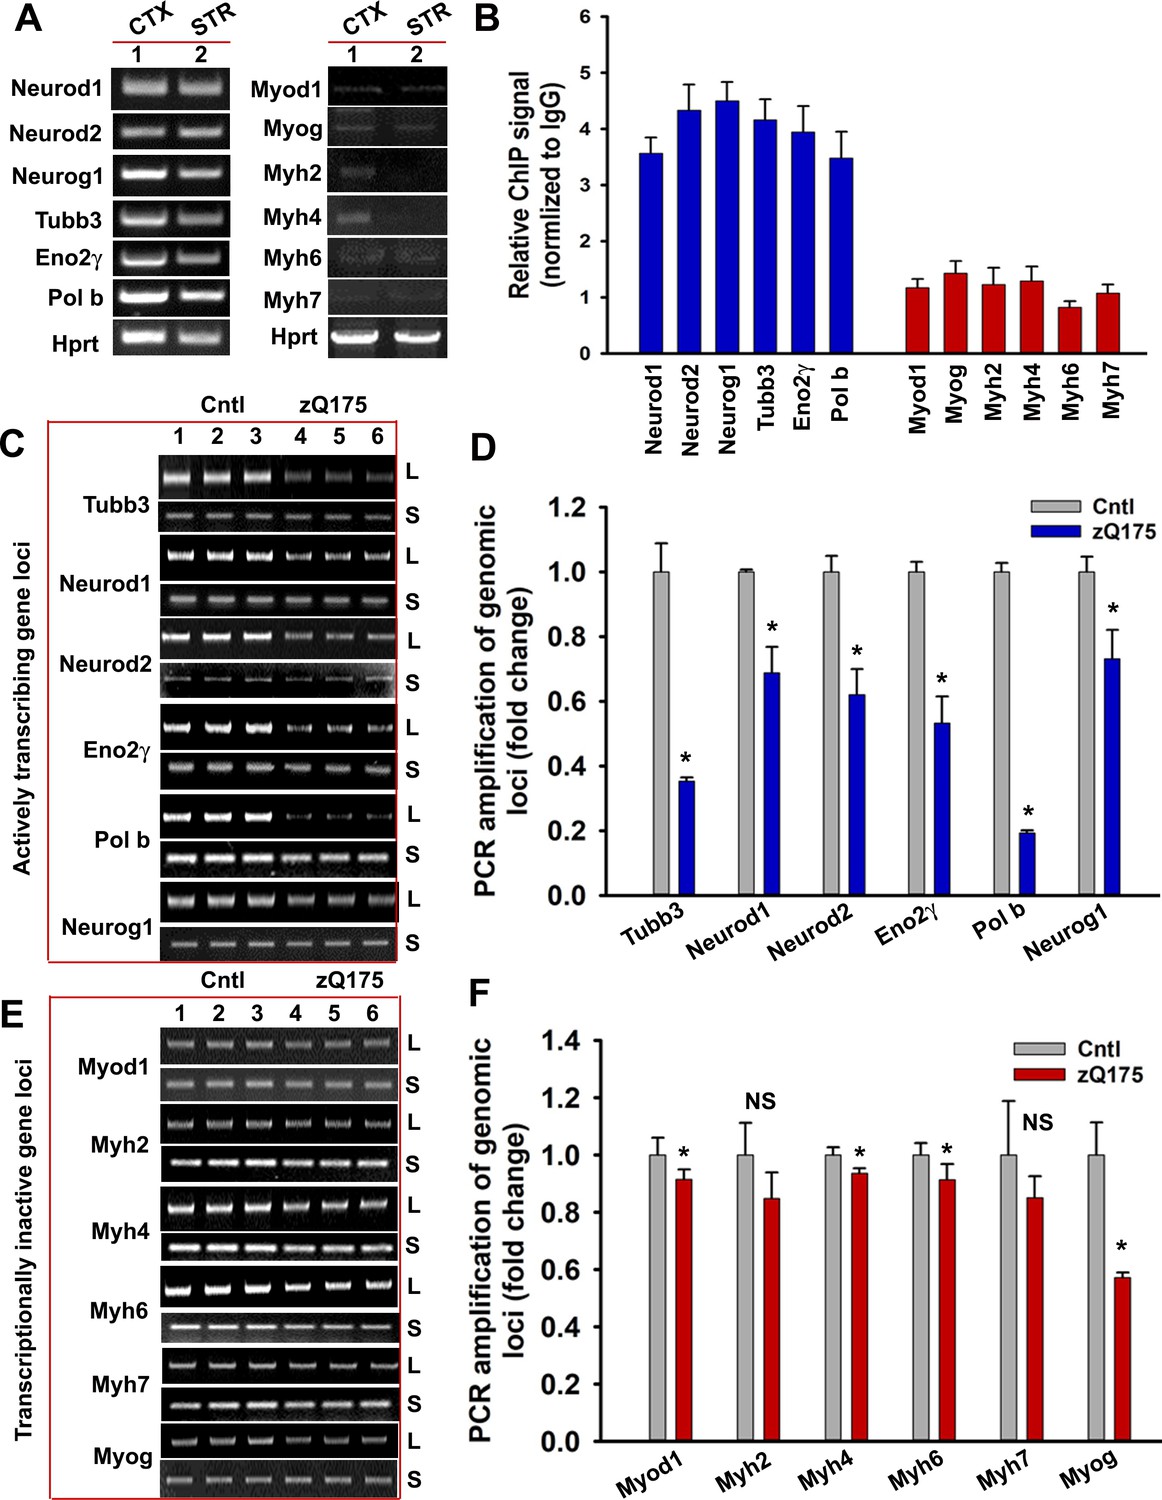
(A) Tissue from CTX and STR of 5 WT mouse brain (7 weeks old) was pooled and total RNA was isolated and expression levels of various genes were measured using qRT-PCR analysis. Left panel shows amplified product of transcribing genes and the right panel for non-transcribing genes. (B) ChIP analysis showing relative occupancy of wtHTT on the actively transcribing (blue) vs. transcriptionally inactive (red) genome loci in 7 weeks old WT mouse STR. Three biological replicates and three technical replicates were used in this assay. Data represent mean ± SD. (C) Genomic DNA was isolated from the CTX of asymptomatic (7 weeks old) zQ175 transgenic (CTX from five transgenic mice were pooled) and age-matched WT control (CTX from 5 WT control mice were pooled) mice. Various transcriptionally active gene loci (Neurod1, Neurod2, Neurog1, Tubb3, Eno2γ, and Pol b) were PCR-amplified from the genomic DNA and analyzed on agarose gels; L: long amplicon (6 to 12 kb product), S: short amplicon (200–300 bp). (D) Relative PCR amplification efficacies of various actively transcribing gene loci in 7 weeks old WT control and zQ175 mouse brains (CTX). Data represent mean ± SD, *p<0.001. Five biological replicates each with three technical replicates were used in this assay. (E) PCR amplification of genomic DNA isolated from the CTX of asymptomatic (7 weeks) zQ175 and WT control mice and various loci that are transcriptionally inactive in brain (Myod1, Myog, Myh2, Myh4, Myh6, and Myh7) were PCR amplified. PCR products from WT control (lanes 1–3) and zQ175 mice (lanes 4 to 6) were analyzed on agarose gels. L: long amplicon (6 to 12 kb product), S: short amplicon (200–300 bp). (F) Relative amounts of PCR products from the transcriptionally inactive genomic loci in the CTX of WT control and zQ175 mice. Data represent mean ± SD; *p<0.001. Five biological replicates each with three technical replicates were used in this assay.
-
Figure 6—source data 1
Mutant Huntingtin- mediated CBP degradation.
- https://doi.org/10.7554/eLife.42988.026
Figure 6—figure supplement 1
mHTT expression induces DNA strand breaks in STR but not in CRBL.
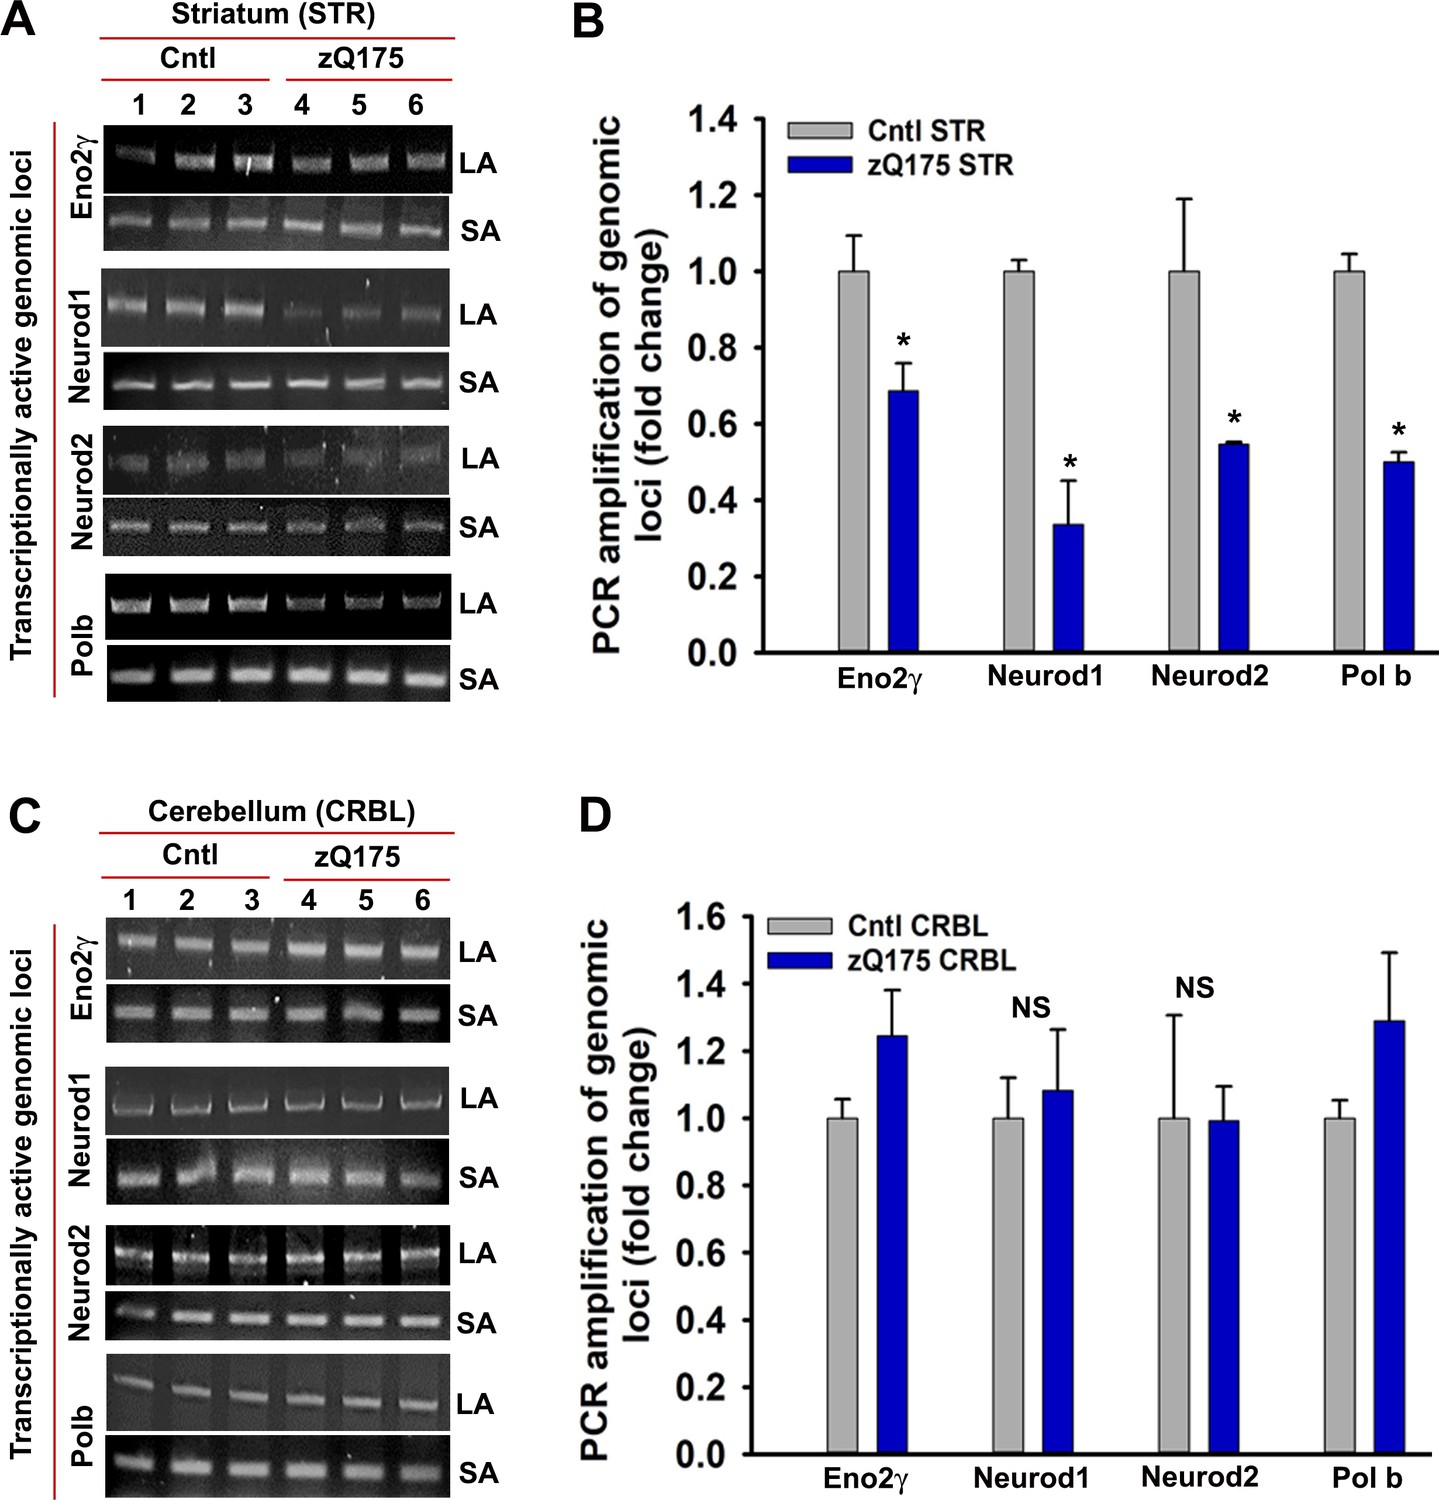
(A) Genomic DNA was isolated from the STR of asymptomatic zQ175 transgenic (STR from three transgenic mice were pooled) and age-matched WT control (STR from three control mice were pooled) mice. Various transcriptionally active gene loci (Eno2γ, Neurod1, Neurod2 and Pol b) were PCR-amplified from the genomic DNA and analyzed on agarose gels; the lanes in figure represents a technical replicate. LA: long amplicon (6- to 12 kb product), SA: short amplicon (200–300 bp). PCR products from WT control mice (lanes 1–3) and zQ175 mice (lanes 4 to 6) were analyzed on agarose gels. (B) Relative PCR amplification efficacies of various gene loci in WT control and zQ175 transgenic mouse STR. Data represent mean ± SD; *p<0.001 compared with control. (C) Genomic DNA was isolated from the CRBL of asymptomatic zQ175 transgenic (CRBL from three transgenic mice were pooled) and age-matched WT control (CRBL from 3 WT control mice were pooled) mice. Various gene loci (Eno2γ, Neurod1, Neurod2 and Pol b) were PCR-amplified from the genomic DNA and analyzed on agarose gels; LA: long amplicon (6- to 12 kb product), SA: short amplicon (200–300 bp). PCR products from WT control mice (lanes 1–3) and zQ175 mice (lanes 4 to 6) were analyzed on agarose gels. (D) Relative PCR amplification efficacies of various gene loci in WT control and zQ175 transgenic mouse CRBL. NS = not significant.
Figure 6—figure supplement 2
HD patients’ brain and HD transgenic mouse brain accumulate DNA damages.
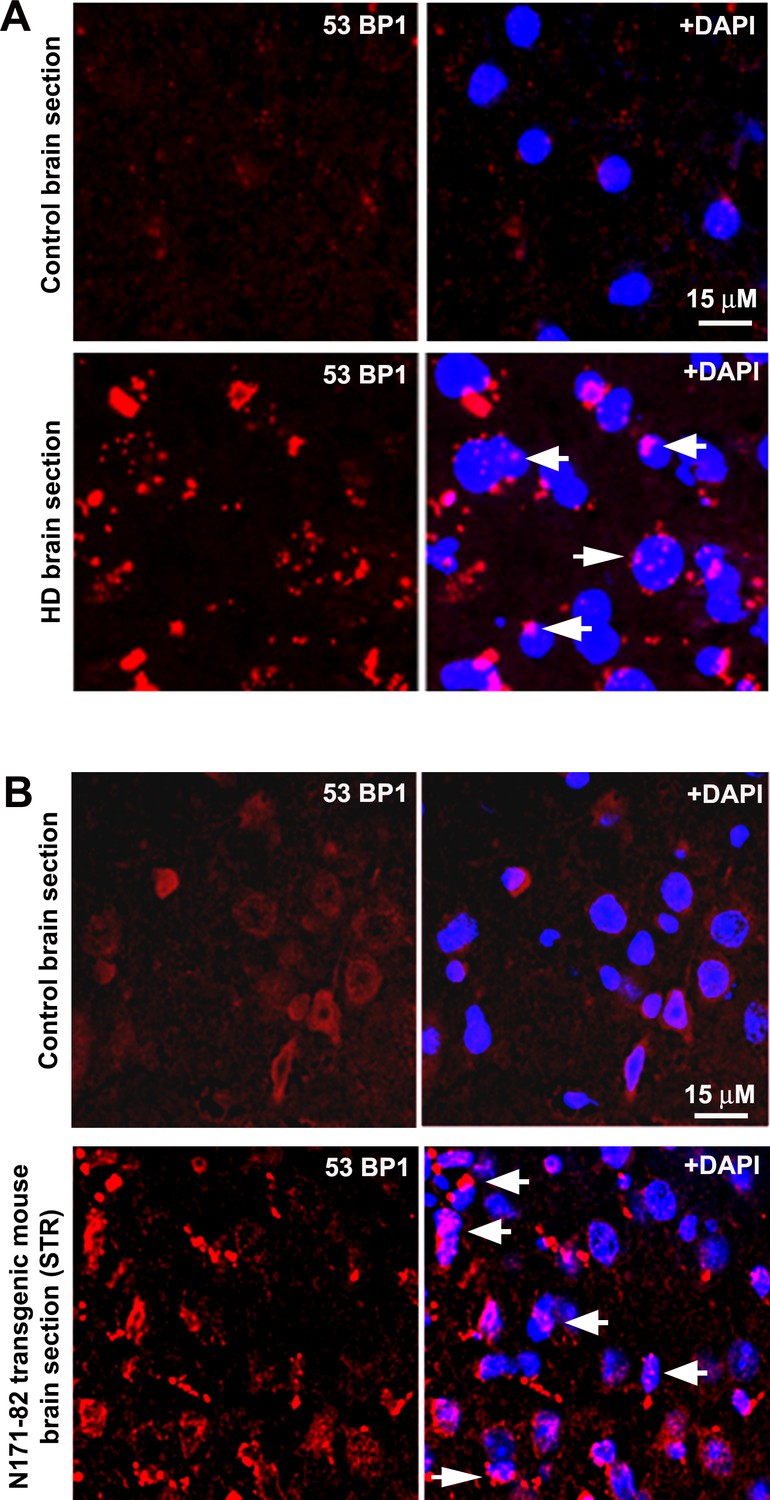
(A) A representative confocal image showing immunostaining of HD patients’ brain section expressing mHTT-Q58 (lower panel) and age-matched normal control brain section (upper panel) with anti-phospho-53BP1 (p53-binding protein) antibody. Arrows show 53BP1 foci formation in HD brain section indicating DNA strand break accumulations. (B) A representative confocal image showing immunostaining of N171-82Q transgenic mouse brain (STR) section (lower panel) and age-matched normal control brain (STR) section (upper panel) with anti-phospho-53BP1 antibody. Arrows show 53BP1 foci formation in HD brain section indicating DNA strand break accumulations.
Figure 6—figure supplement 3
HD primary neurons accumulate DNA breaks preferentially in the actively transcribing genome.
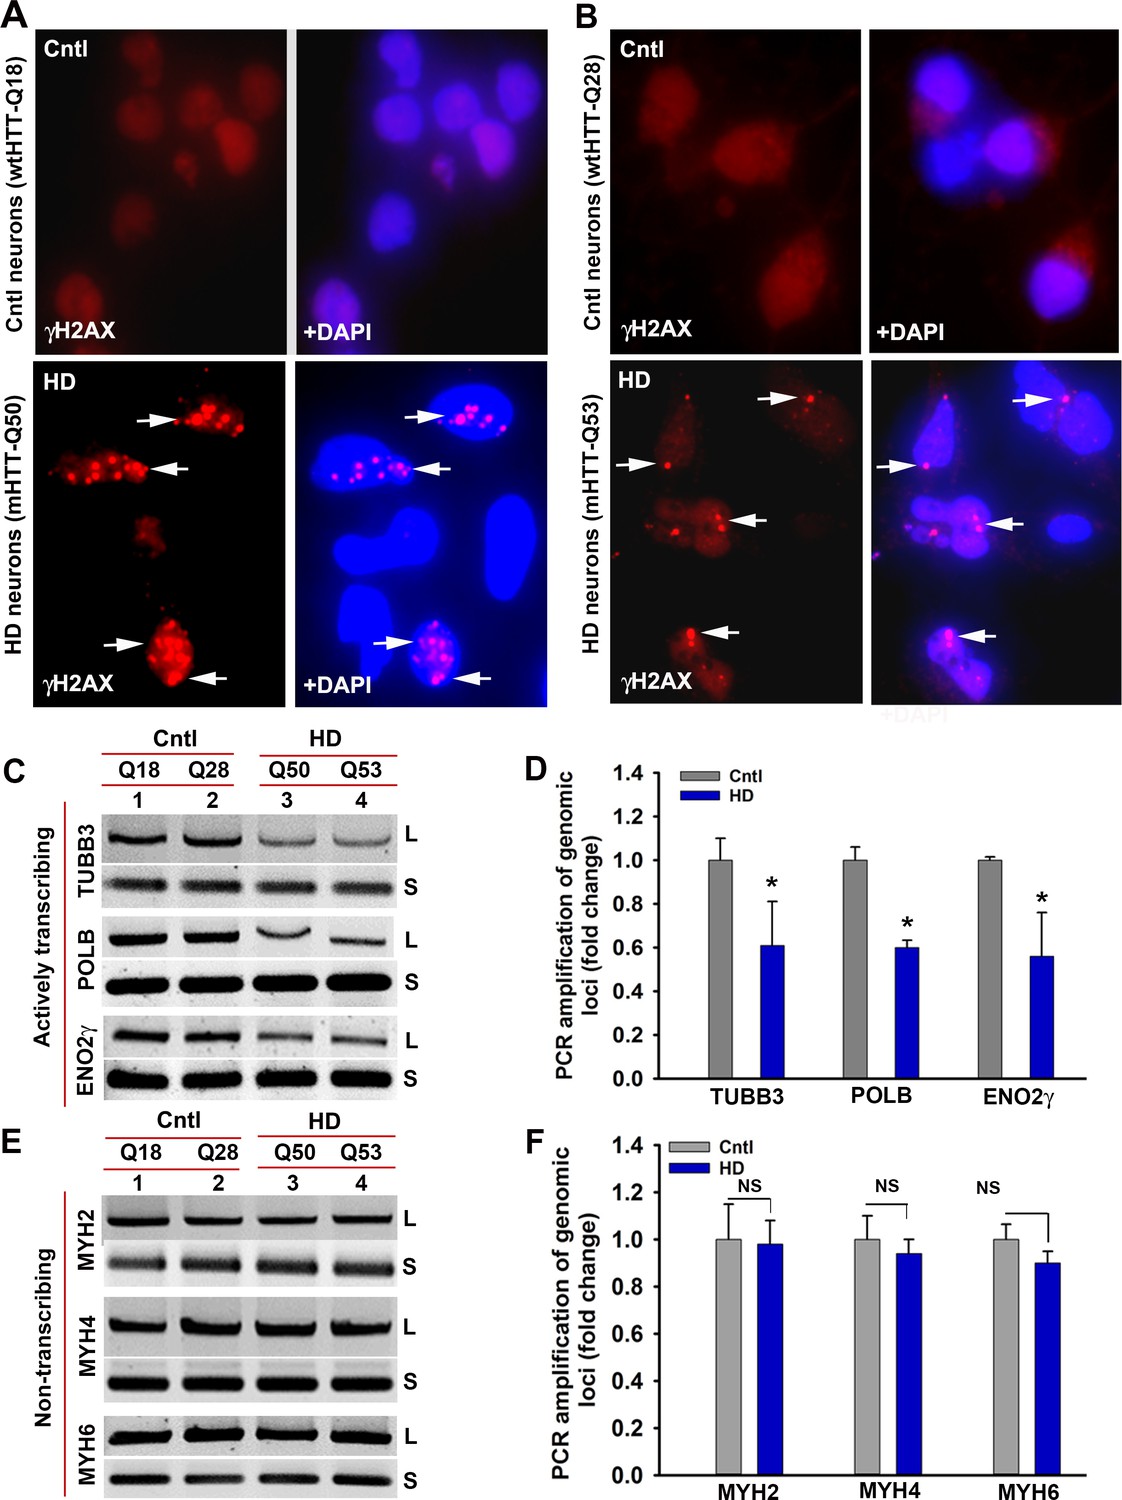
(A) Control and HD primary neurons expressing Q18 and Q50 respectively were immunostained with anti-γH2AX antibody to detect DNA strand breaks (arrows). (B) Control and HD primary neurons expressing Q28 and Q53 respectively were immunostained with anti-γH2AX antibody to detect DNA strand breaks (arrows). (C) LA-qPCR analysis. Genomic DNA was isolated from the control (Q18 and Q28) and HD (Q50 and Q53) primary neurons, genomic loci were PCR amplified, and the PCR products analyzed on agarose gels. Relative intensity of the PCR product indicates the PCR amplification efficacy of TUBB3, POLB and ENO2γ genomic locus that is actively transcribed in HD (lanes 3 and 4) vs. control neurons (lanes 1 and 2). L = long amplicon, and S = short amplicon in C and E. (D) Relative PCR amplification efficacy of TUBB3, POLB, and ENO2γ in control and HD neurons. Data represent mean ± SD; *p<0.001. (E) LA-qPCR analysis. Agarose gel showing PCR amplification of MYH2, MYH4 and MYH6, genomic loci that are not actively transcribed in control (lanes 1 and 2) and HD neurons (lanes 3 and 4). (F) Relative PCR amplification efficacy of MYH2, MYH4 and MYH6 loci in control vs. HD neurons. NS = not significant. Two biological replicates for control as well as for mutant subjects with three technical replicates were used in the LA-qPCR analyses.
Figure 6—figure supplement 4
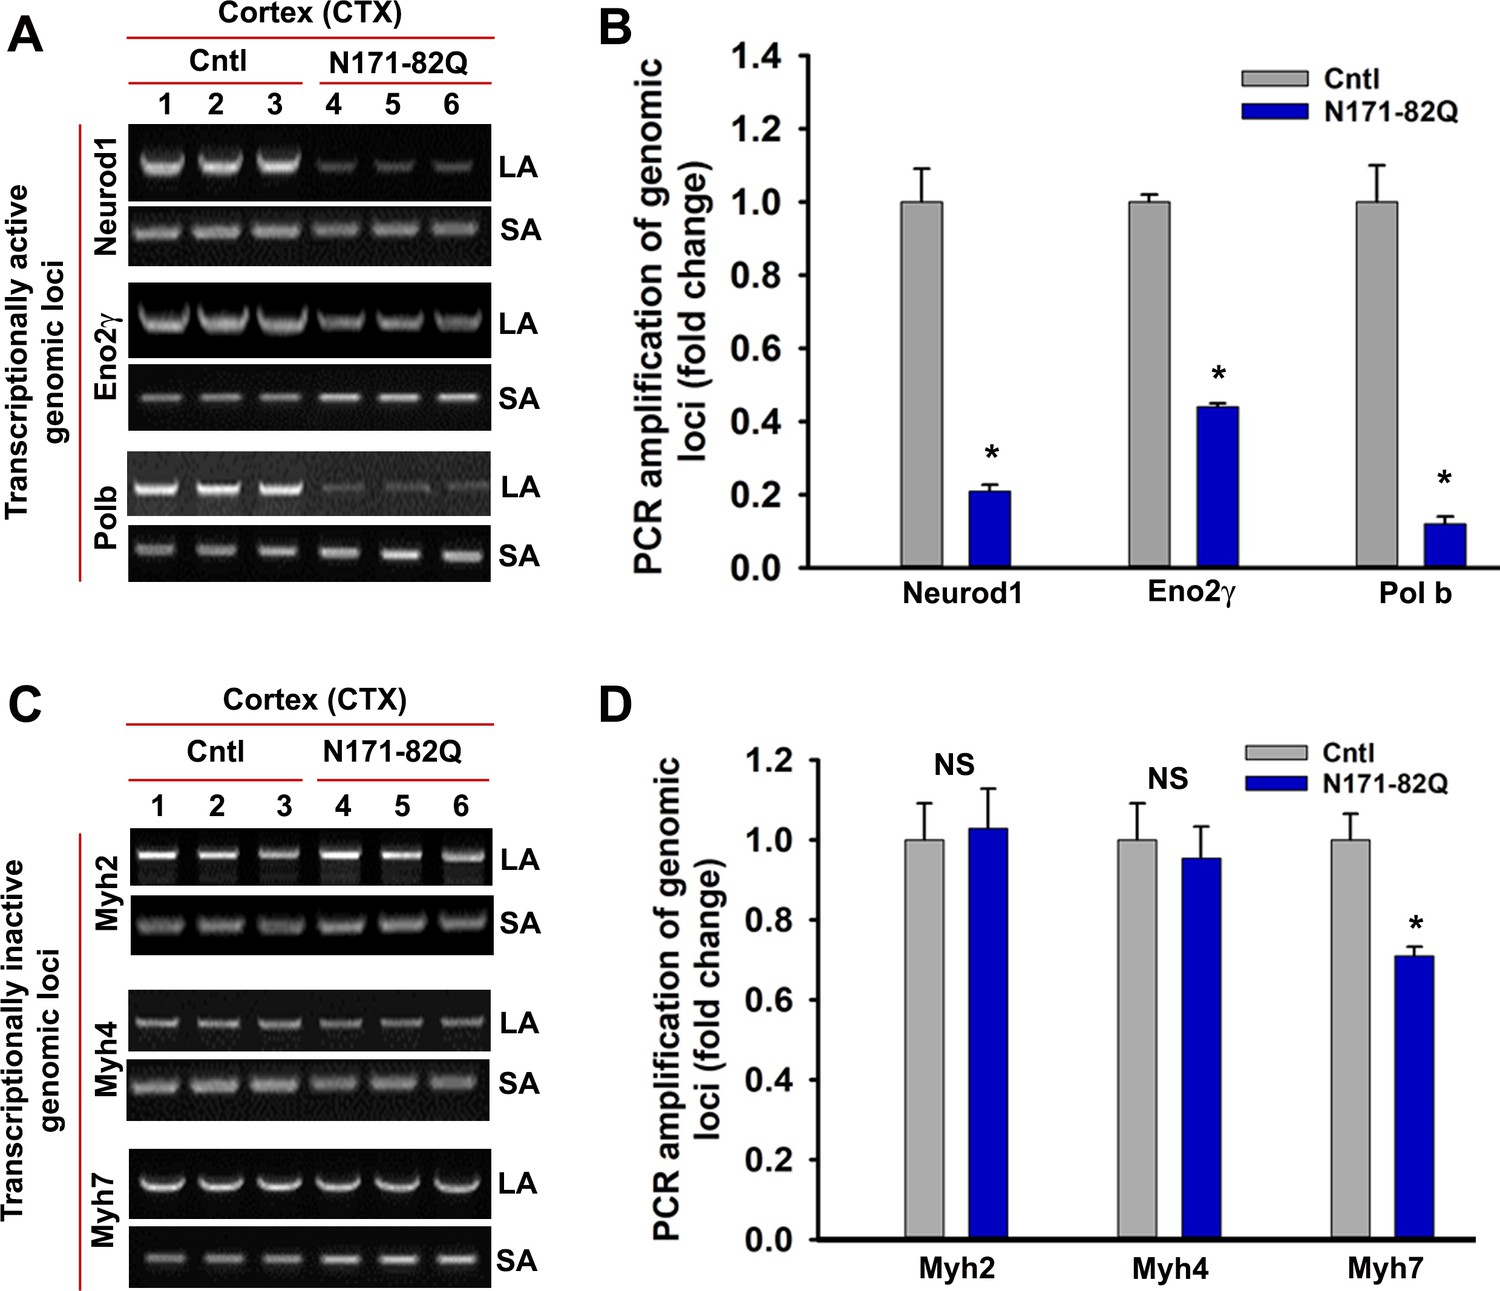
N171-82Q transgenic mouse brain predominantly accumulates strand breaks in the transcriptionally active genome.
LA-qPCR analysis. Genomic DNA was isolated from the CTX of symptomatic (16 wks old) N171-82Q transgenic (n = 3, pooled) and age-matched control mice (n = 3, pooled), various genomic loci were PCR amplified, and the PCR products were analyzed on agarose gels (left panels), and the PCR products were quantified (right panels). (A) The relative intensity of the PCR product indicates the PCR amplification efficacy of Neurod1, Eno2γ and Pol b, actively transcribing genomic loci in N171-82Q transgenic (lanes 4 to 6) vs. control CTX (lanes 1 to 3). LA = long amplicon, and SA = short amplicon in A and C. (B) Relative PCR amplification efficacy of Neurod1, Eno2γ and pol b in the CTX. Data represent mean± SD; *p<0.001. (C) LA-qPCR showing PCR amplification efficacy of Myh2, Myh4 and Myh7 in the CTX of N171-82Q transgenic (lanes 4 to 6) vs. age-matched controls (lanes 1 to 3). (D) Relative PCR amplification efficacy of Myh2, Myh4, and Myh7 loci in the CTX of N171-82Q transgenic and age-matched control mice. NS = not significant. Three biological replicates and three technical replicates were used for the LA-qPCR analyses.
Figure 7
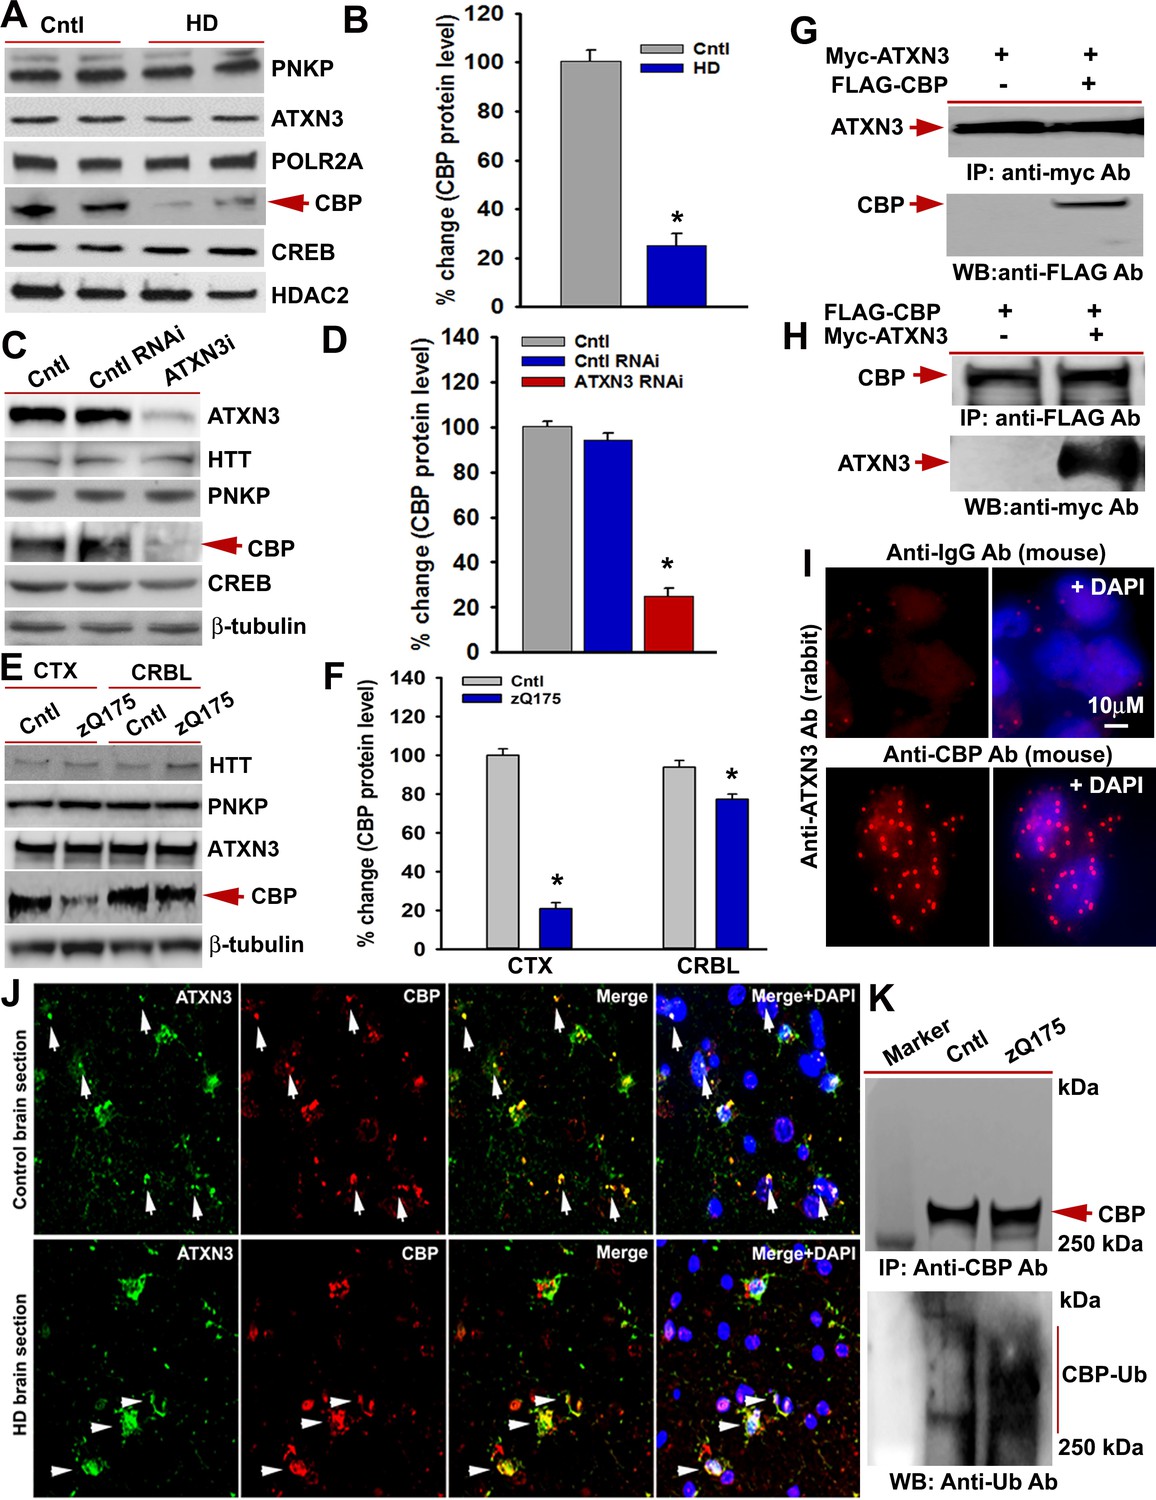
mHTT facilitates CBP degradation by inactivating ATXN3.
(A) Nuclear extracts (NEs) isolated from control primary neurons (Q18 and Q28) and HD neurons (Q53 and Q109) were analyzed by WBs to measure PNKP, ATXN3, POLR2A, CBP, and CREB levels; HDAC2 was the loading control. (B) Relative CBP levels in control and HD neurons normalized to HDAC2. Two biological replicates and three technical replicates were used in this assay. Data represent mean ± SD; *p<0.001. (C) NEs isolated from SH-SY5Y cells expressing control shRNA or ATXN3 shRNA were subjected to WB to determine ATXN3, HTT, PNKP, CBP, and CREB levels; β-tubulin was used as loading control. (D) Relative CBP levels (normalized to β-actin) in WT control cells, cells expressing control RNAi or ATXN3 RNAi. Data represent mean ± SD; *p<0.001. (E) NEs isolated from CTX and CRBL of zQ175 and WT control mice, and analyzed by WB to determine HTT, PNKP, ATXN3, POLR2A and CBP levels; β-tubulin was the loading control. (F) Relative CBP levels in the CTX and CRBL in WT control and zQ175 mice. CBP levels were normalized to β-tubulin. Data represent mean ± SD; *p<0.001. (G) HEK293 cells were cotransfected with plasmids expressing Myc-ATXN3 and FLAG-CBP, Myc-ATXN3 IP’d with a Myc antibody, analyzed by WB to detect CBP in the Myc-IC (arrow). (H) HEK293 cells cotransfected with plasmids expressing Myc-ATXN3 and FLAG-CBP, NEs isolated and CBP IP’d with a FLAG antibody, ICs were subjected to WB to detect ATXN3 (arrow). (I) SH-SY5Y cells were analyzed by PLA to examine interactions between CBP and ATXN3. Nuclei were stained with DAPI (upper panel). Reconstitution of red fluorescence indicates interaction of CBP with ATXN3 (lower panel). (J) Control (upper panel) and HD (lower panel) patient brain sections were analyzed by immunostaining with antibodies against ATXN3 (green) and CBP (red) to assess their in vivo interactions. Merged red and green fluorescence appears as yellow/orange; nuclei stained with DAPI (blue). Arrow indicates the respective colocalization. (K) Total protein was isolated from control and zQ175 mice CTX, and CBP was IP’d with a CBP antibody (upper panel), and the IC analyzed with anti-ubiquitin antibody to detect CBP ubiquitination (lower panel).
-
Figure 7—source data 1
DNA damage precedes neurodegeneration.
- https://doi.org/10.7554/eLife.42988.028
Figure 8

Proposed mechanism by which mHTT triggers neurotoxicity in HD.
Schematic diagram of our hypothesized mechanism by which polyQ expansions in mHTT compromise the functional integrity of the TCR complex. Normal HTT forms a multiprotein TCR complex with POLR2A, ATXN3, PNKP, CBP, and additional DNA repair enzymes, and this structure monitors and edits DNA strand breaks/damage during transcriptional elongation, preserving genome integrity, transcription and neuronal survival. In HD, polyQ expansions in mHTT impair the normal function of the TCR complex; mHTT-mediated inactivation of PNKP activity impairs DNA repair, which leads to the persistence of DNA strand breaks and chronic activation of ATM-p53 pro-apoptotic signaling. Additionally, mHTT-mediated inactivation of ATXN3’s deubiquitinating activity facilitates ubiquitination and degradation of CBP, impairing CBP-CREB-regulated gene transcription and further amplifying pro-degenerative output in the HD brain. PolyQ expansion in mHTT thus adversely impacts DNA repair and transcription and neural function and survival, triggering neurotoxicity and functional decline in HD.
Additional files
-
Transparent reporting form
- https://doi.org/10.7554/eLife.42988.030
Download links
A two-part list of links to download the article, or parts of the article, in various formats.
Downloads (link to download the article as PDF)
Open citations (links to open the citations from this article in various online reference manager services)
Cite this article (links to download the citations from this article in formats compatible with various reference manager tools)
Mutant huntingtin impairs PNKP and ATXN3, disrupting DNA repair and transcription
eLife 8:e42988.
https://doi.org/10.7554/eLife.42988


