Neural structure mapping in human probabilistic reward learning
- University of Oxford, United Kingdom
- Max Planck Institute for Human Development, Germany
Figures
Figure 1 with 3 supplements

Task design and RSA results.
(A) Humans performed two tasks during a single EEG recording session. In the numerical decision task, participants viewed a stream of ten digits between 1 and 6, deciding whether the blue or orange numbers had the highest/lowest average. In the bandit task, participants learned about the reward probabilities of six images (bandits) and were asked to choose between two successive bandits to obtain a fixed reward. Numbers below each frame show time duration of the frame in ms. (B) RSA revealed a numerical and value distance effect from ~100 ms after stimulus onset (bottom colored lines, Pcluster <0.005). Inset shows magnitude model RDM. Shaded area represents SEM. Repeating the same analyses with correlation distance (Figure 1—figure supplement 1) or splitting the data per task framing group (Figure 1—figure supplement 2) provided highly similar results. Figure 1—figure supplement 3 shows the patterns do not differ between bandits presented first or second. (C) Averaged neural RDMs between 200–700 ms for the numerical (top) and bandit (bottom) task show a clear correspondence with the magnitude model.
Figure 1—figure supplement 1

RSA results with Pearson correlation distance.
We repeated all main analyses using correlation distance, a measure that is scale invariant and removes any univariate effects, showing that our results are consistent over different distance measures. (A) RSA revealed a magnitude effect arising around 100 ms for both tasks (bottom colored lines, Pcluster <0.005). Shaded area represents SEM. (B) Averaged RDMs between 200–700 ms for both tasks. (C) Averaged neural RDM between 350 and 600 ms across the two tasks. Upper left and lower right quadrant represent within-task dissimilarities for the numerical and bandit task respectively, lower right and upper left quadrant contain the cross-validated dissimilarities between tasks. (D) Cross-temporal cross-validation revealed a stable magnitude representation shared over the two tasks between approximately 350 and 600 ms (Pcluster <0.005).
Figure 1—figure supplement 2
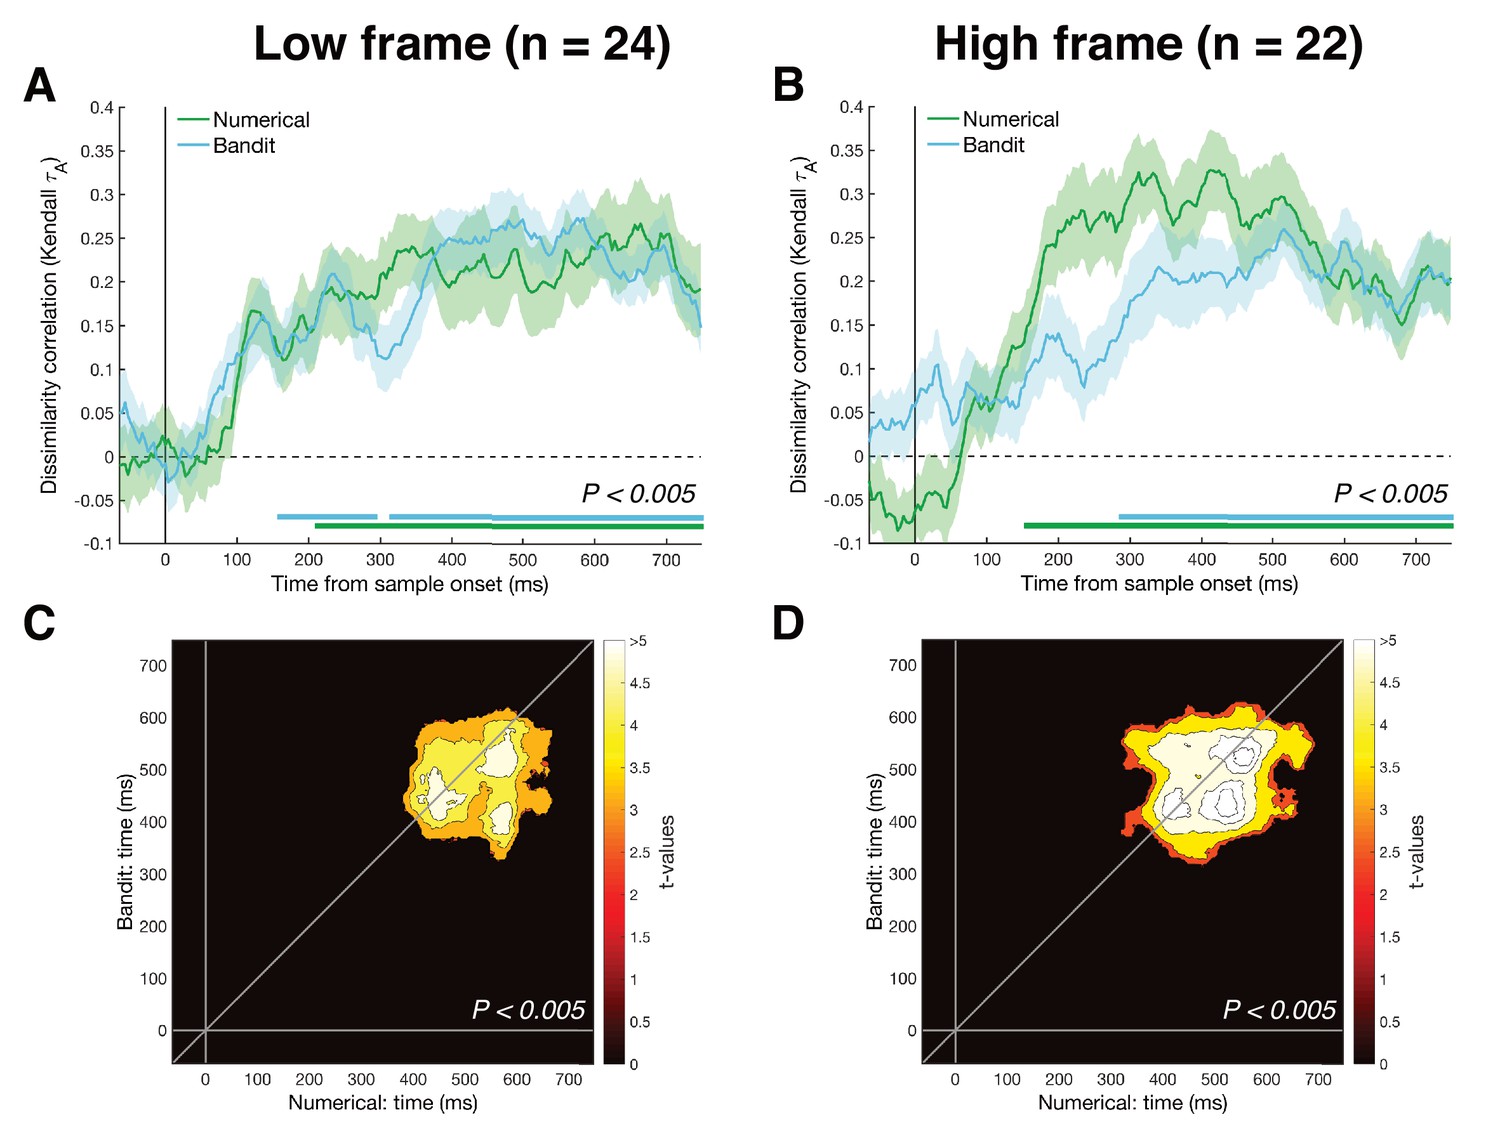
RSA results split per task framing.
Approximately half of the participants performed the numerical task indicating the color with the lowest average (n = 24) and the other half indicating the highest average (n = 22). (A-B) Within-task RSA showed magnitude representations were reliably decodable for the two tasks under either task framing, albeit with slightly later/smaller clusters than the aggregated data (bottom colored lines, Pcluster <0.005). Shaded area represents SEM. (C-D) Cross-temporal cross-validation showed a shared magnitude representation under either task framing, with a slightly larger cluster for the higher frame (Pcluster <0.005).
Figure 1—figure supplement 3
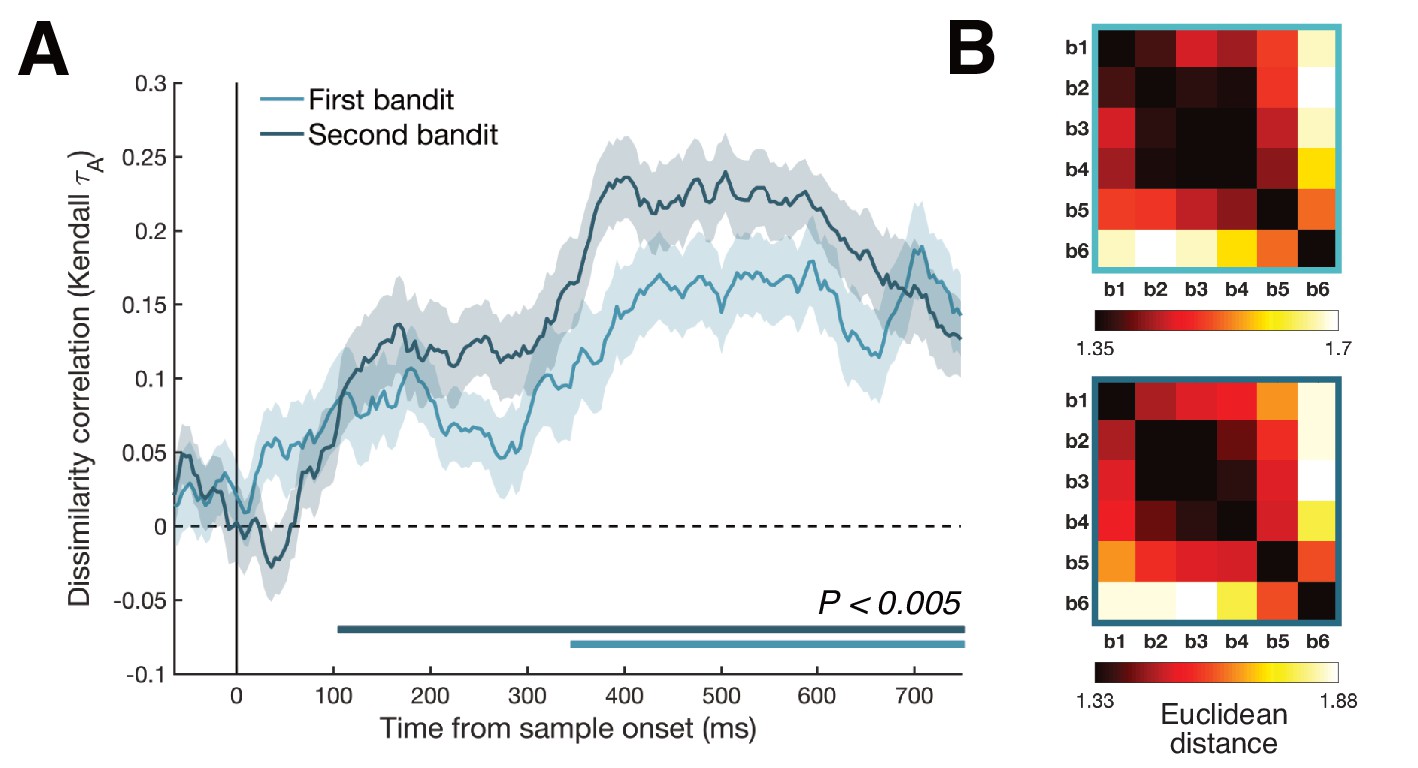
RSA results split for first and second bandit.
To test for the possibility that our magnitude decoding was not merely driven by a ‘value comparison’ signal, whereby the value of the second bandit is assessed relative to the value of the first, RDMs were calculated separately for the first and second presented bandit. (A) Although the identified cluster was greater for the second bandit, magnitude was decodable for both bandits reliably from approximately 350 ms onwards (bottom colored lines, Pcluster <0.005). (B) Averaged neural RDMs between 200 and 700 ms for the first (top) and second (bottom) bandit were highly similar.
Figure 2 with 2 supplements

Cross-temporal cross-validation RSA.
(A) Averaged neural RDM from 350 to 600 ms across the numerical (1-6) and bandit (b1–b6) task. Upper left and lower right quadrants show representational dissimilarity for numbers (‘N’) and bandits (‘B’), respectively, that is within-task RDM; lower left/upper right quadrants show cross-validated dissimilarity between numbers and bandits (‘N-B’), that is between-task RDM. (B) Cross-temporal cross-validated RSA revealed a stable magnitude representation that was shared between the two tasks (Pcluster <0.005) around 350–600 ms. (C) To ensure that our cross-validation was not driven by a single number/bandit pair, we systematically removed each number/bandit pair and repeated the cross-temporal cross-validated RSA on the subset data. Each pixel can range from 0 (no significant cross-validation for any number/bandit pair) to 6 (cross-validation always reached significance). Between 400 and 600 ms our cross-validation was robust to the removal of any number/bandit pair (Figure 2—figure supplement 1 shows the results isolated when excluding number/bandit pair 6).
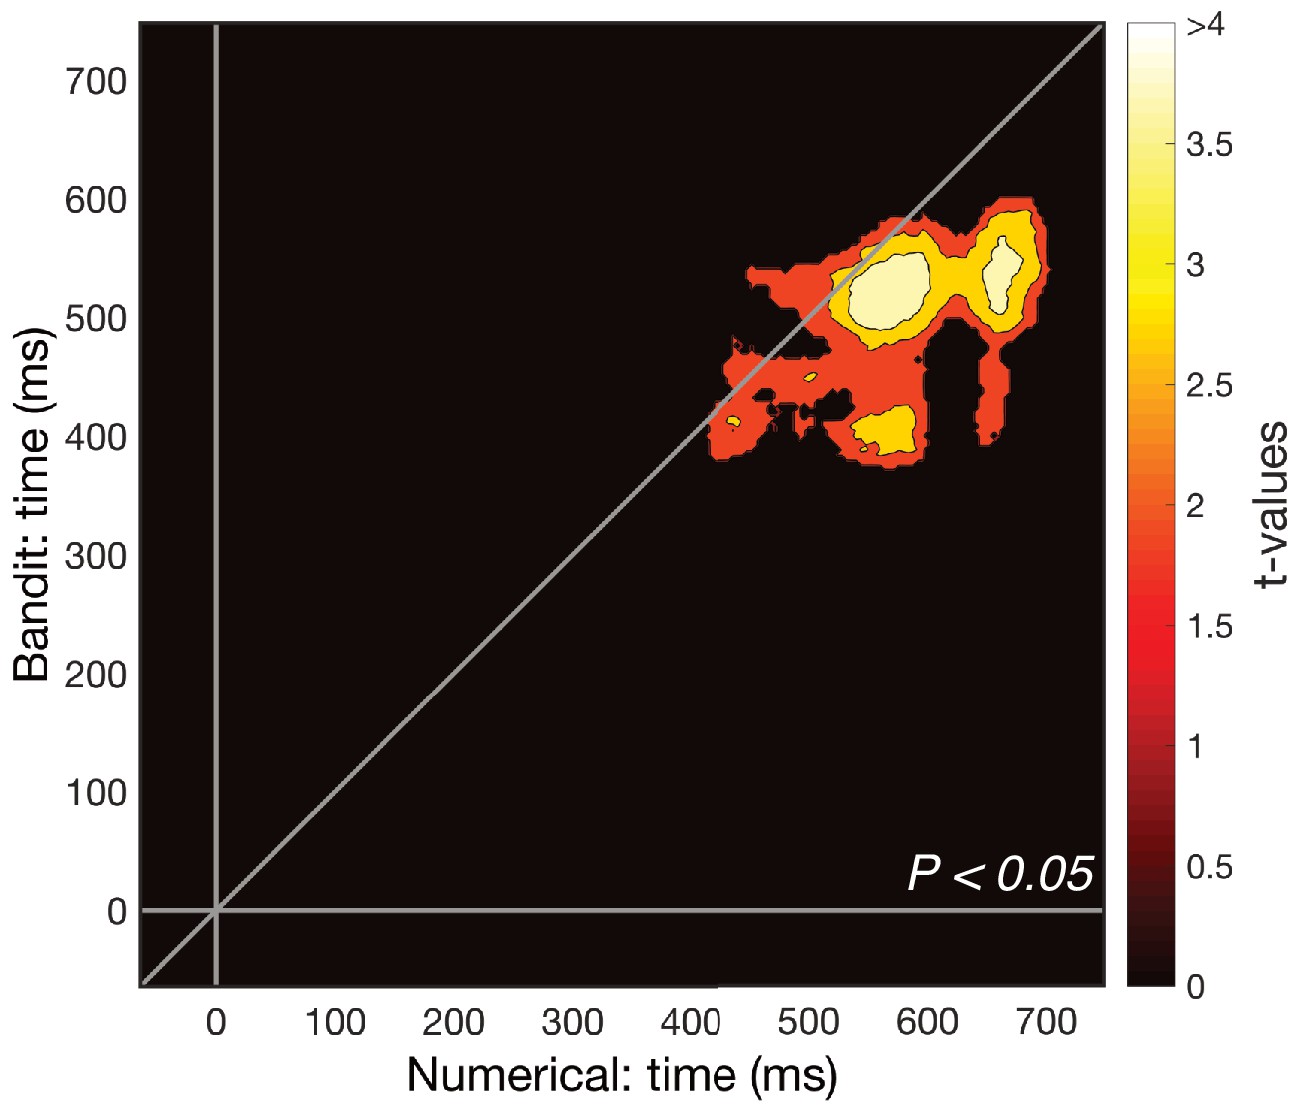
Figure 2—figure supplement 1
Cross-validation after removal of number 6/subjectively highest valued bandit (subset of Figure 2C).
The most distinct pattern of numerical/value distance was present for the highest number and most valued bandit. After removing this pair from the cross-validated RDM and repeating the cross-temporal cross-validation RSA, magnitude was still decodable from the remaining numbers and bandits (Pcluster <0.05).
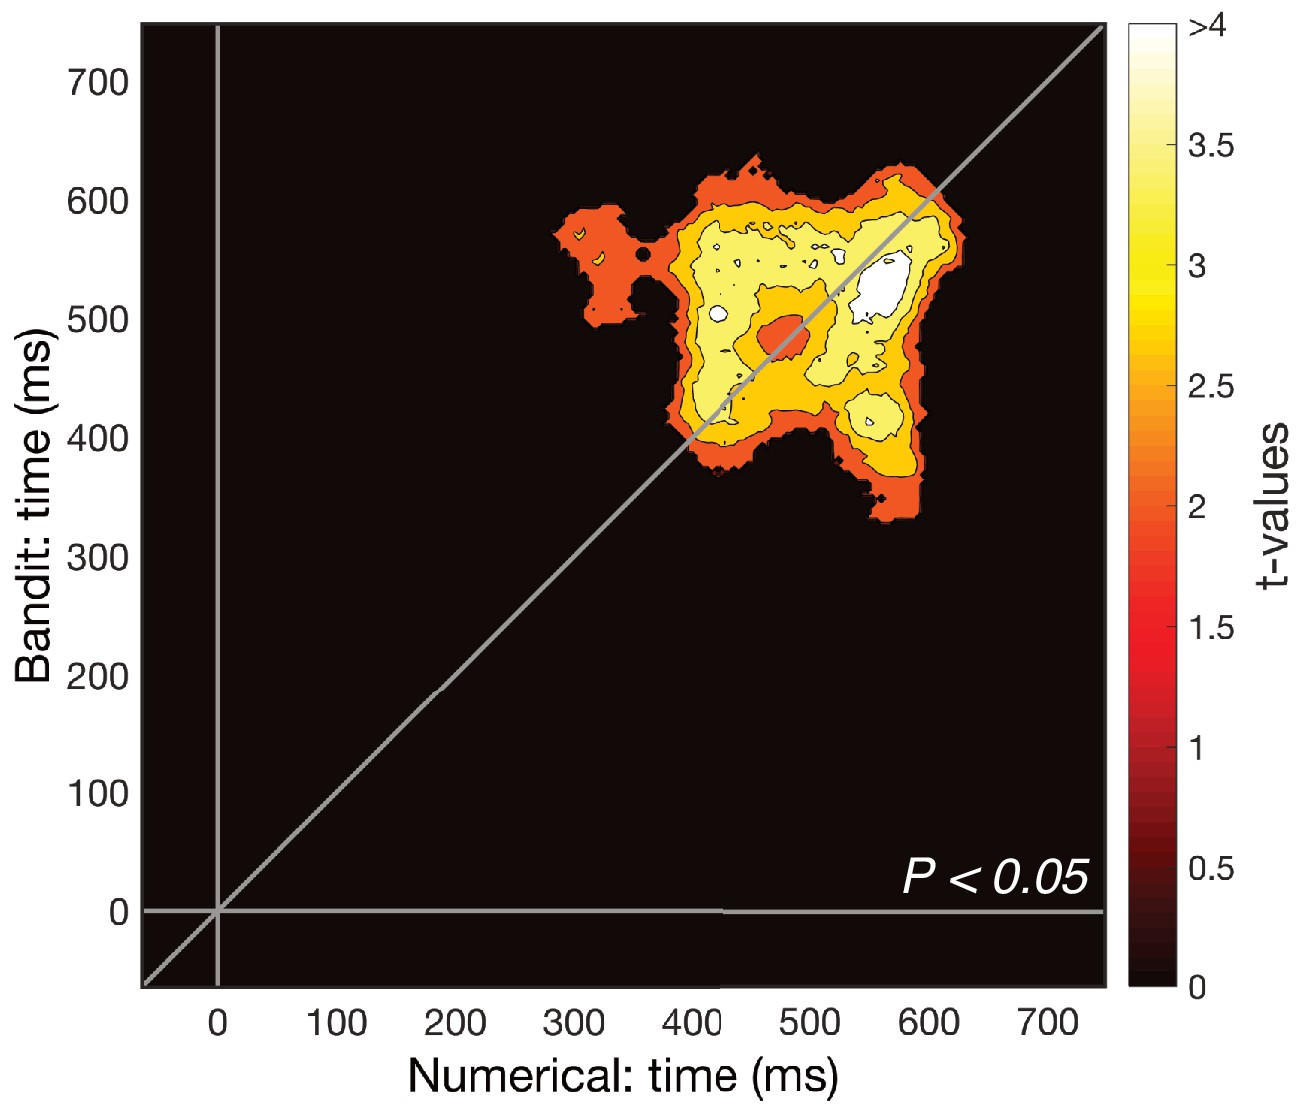
Figure 2—figure supplement 2
We compared the strength of within-subject cross-validation to the between-participants cross-validation, asking whether variations in multivariate neural signals existed that were idiosyncratic within participants.
For each participant, we combined EEG responses per stimulus from the numerical task iteratively with the EEG responses of another participant from the bandit task, repeating our cross-validation protocol for the newly created between-subject data. This allowed us to ask how well a participant’s neural patterns correlated with those of other participants, resulting in a distribution of correlation estimates at each time point. We then calculated a z-value at each time point, indicating how far the within-participant correlation diverged from the between-participant distribution of correlations. Non-parametric cluster-based permutation tests were then used to identify clusters in time where participants’ neural patterns in the bandit task were significantly better predicted by their own neural patterns compared to the population (Pcluster <0.05). The effect was noisier but arose around the same time as the original cross-validation pattern, suggesting the effect was not purely driven by shared noise from the same recording session.
Figure 3
Detailed examination of the magnitude pattern in cross-validation.
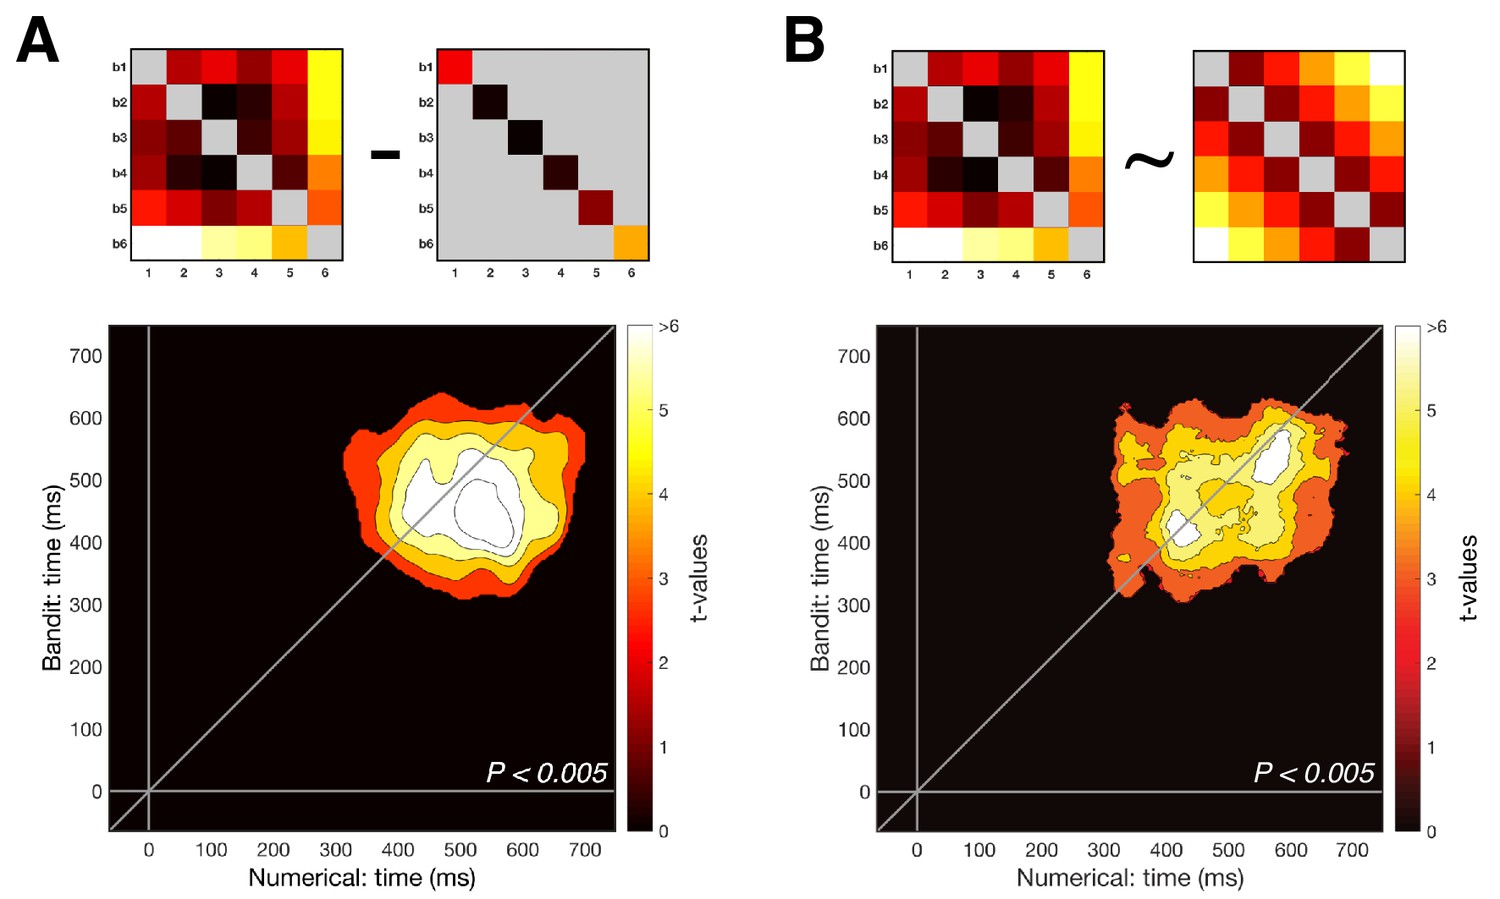
(A) The presence of a one-to-one mapping along the number line (i.e. number one to least valued bandit) was tested using the ‘Exemplar Discriminability Index’ (EDI), a measure that indicates how much better items on average map onto iterations of the same item compared to different items. The EDI is calculated by subtracting the mean on-diagonal distances from the mean off-diagonal distances (top illustration). Significant exemplar discriminability, where numbers most closely resembled their equivalent bandit, arose at the same time as our main findings. (B) Removing the diagonal from the lower rectangle in the cross-validation RDM (i.e. the dissimilarity between distributed responses to corresponding stimuli in the two tasks) reproduced the results from our main analysis, suggesting the effect was not mainly driven by matching stimulus pairs (e.g. number six and most valuable bandit), but by a gradual distance effect (Pcluster <0.005).
Figure 4
Behavioral analyses.
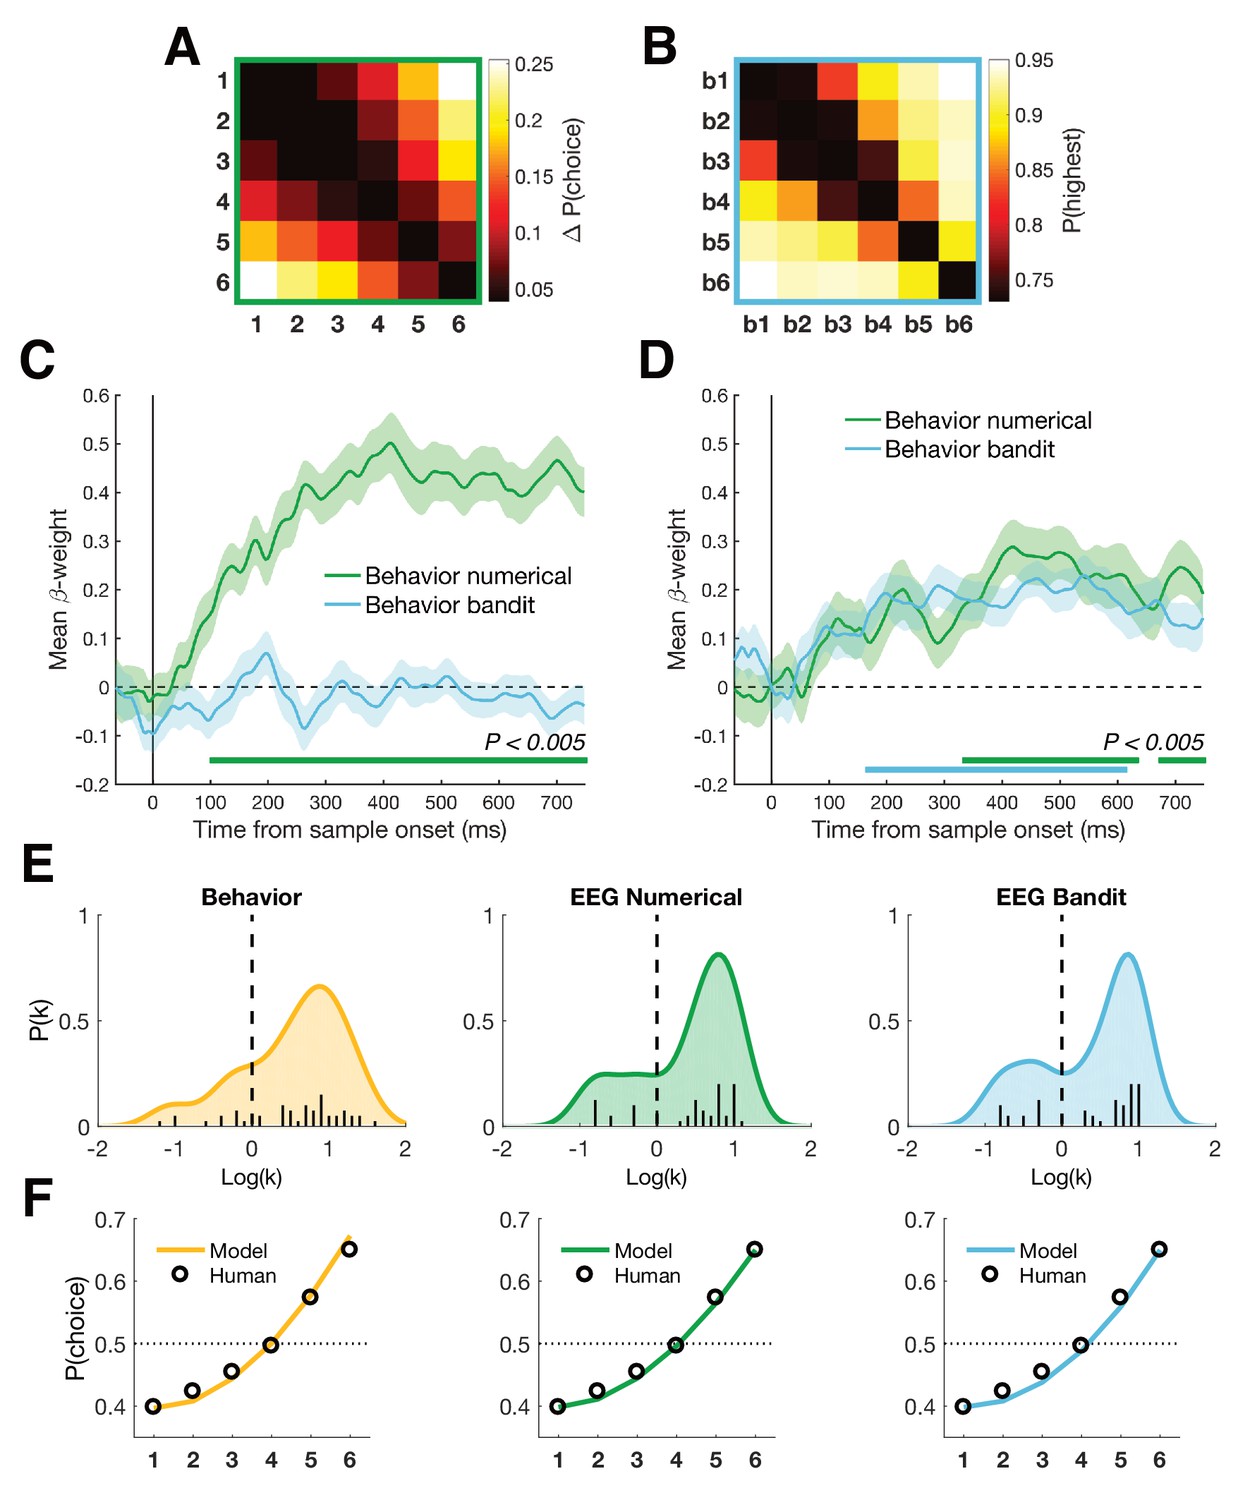
(A) Group-averaged difference RDM of decision weights in the numerical task. We calculated the weight of each number on participant’s choice, independent of color, and created a choice RDM through pairwise differences of weights. (B) Group-averaged choice RDM in the bandit task. Each cell contains the probability of choosing the highest valued bandit on trials where bandit x and bandit y were presented together. Participants never encountered trials where the same bandit was presented twice. (C) Both choice matrices were inserted in a multiple regression explaining EEG patterns to establish a potential link between behavior and neural patterns in either task. Only the numerical choice RDM explained neural patterns of the numerical task. (D) In contrast, both choice RDMs significantly explained neural patterns in the bandit task, possibly indicating that participants relied on a more general understanding of numbers in both tasks (bottom colored lines, Pcluster < 0.005). Shaded area represents SEM. (E) Distributions of after fitting a power-law model of the form to the decision weights in the numerical task (yellow) and the average neural patterns in the numerical (green) and bandit task (blue) between 350 and 600 ms (see Materials and methods). In all cases, the best fitting parameter was significantly greater than 0 (linear), indicating an overweighting/increasing dissimilarity for larger quantities (numbers 5-6 or highest valued bandits). (F) Decision weights under the median estimated for psychometric (yellow) and neurometric (green/blue) fits, compared to the median true human decision weights in the numerical task.
Figure 5 with 3 supplements
Dimensionality of magnitude representation.
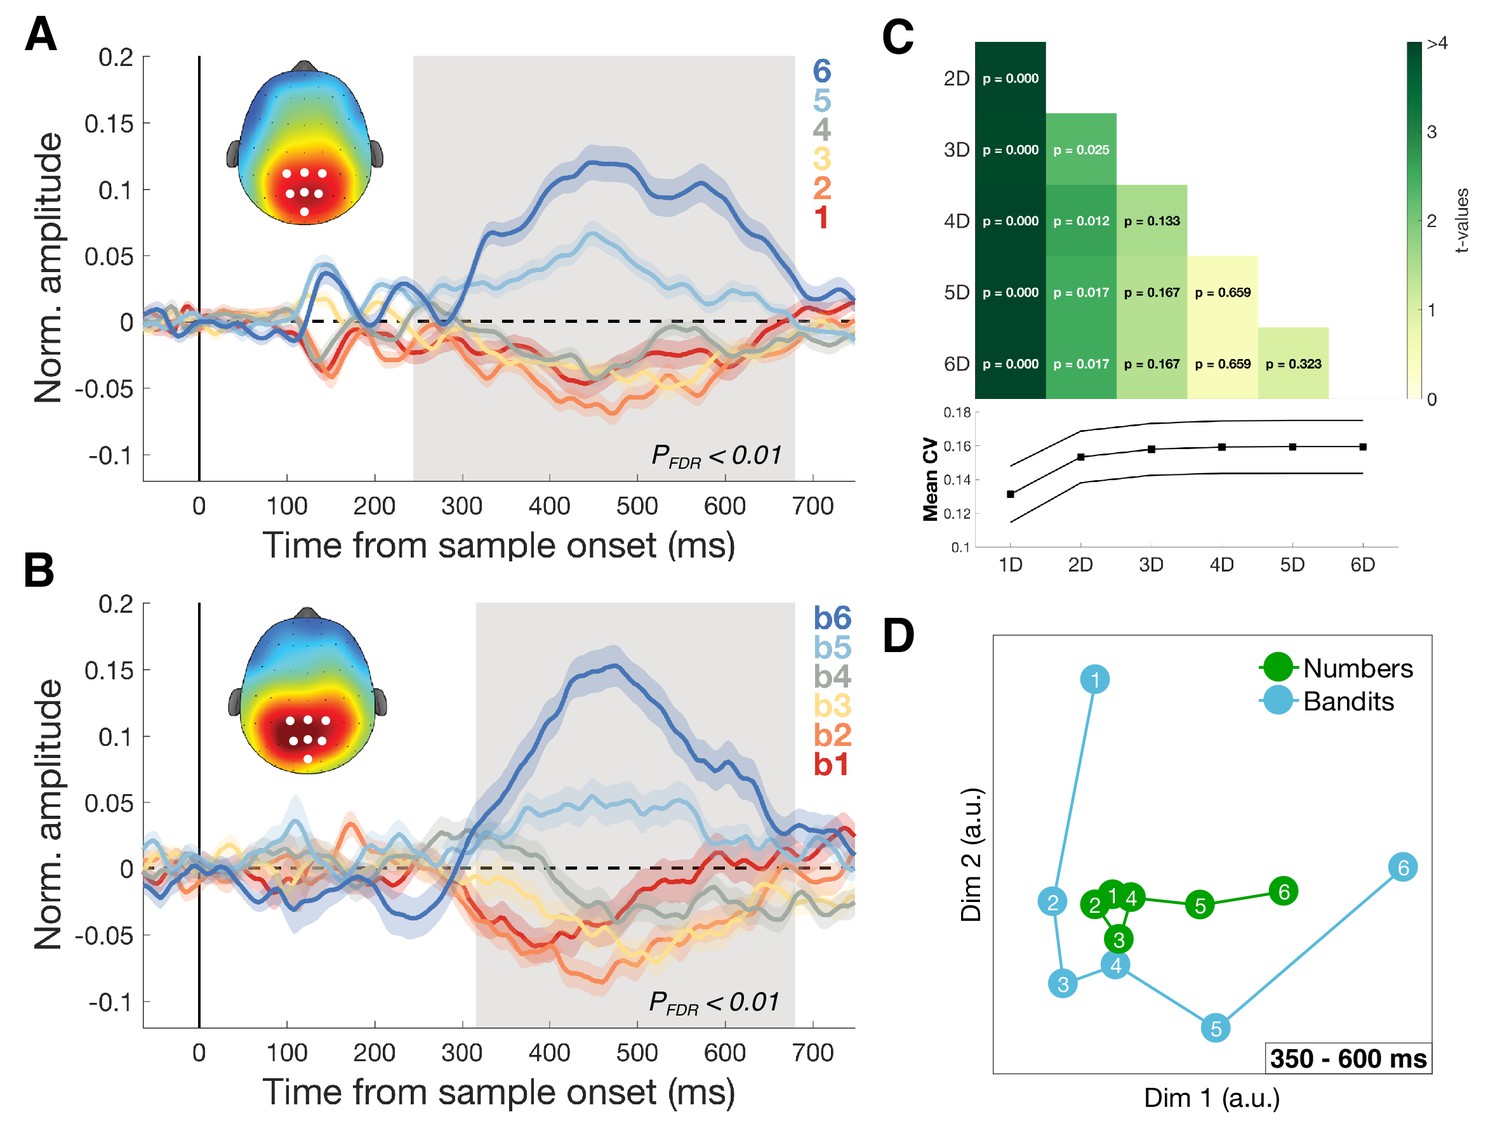
(A) Average normalized amplitudes associated with numbers 1–6, independent of task framing (report highest/lowest) or category (blue/orange) at highlighted centro-parietal electrodes. Grey shaded area shows time of greatest disparity between signals (Kruskal-Wallis, PFDR <0.01). Scalp map inset shows response amplitude for number six during identified time window. Colored shading represents SEM. The ascending direction of the univariate responses was independent of task framing (Figure 5—figure supplement 1) (B) Equivalent analysis for bandits b1 (lowest value) to b6 (highest value) in the bandit task. Scalp map shows response amplitude for highest subjectively valued bandit b6. (C) Dimensionality of the data was iteratively reduced using SVD and the strength of cross-validation under each new dimensionality was assessed by comparing the mean cross-validation in the 350–600 ms time window (bottom plot). Each cell in the grid contains the t- and p-value of a pairwise comparison of mean CV under different dimensionalities of the data. Reduction to one (and to a lesser degree two) dimension(s) significantly reduced the size of the effect. (D) Multidimensional scaling (MDS) revealed two principal axes that describe the data: a magnitude axis approximately following the number/bandit order and a certainty axis distinguishing inlying (e.g. 3,4) from outlying (e.g. 1,6) numbers or bandits.
Figure 5—figure supplement 1
Univariate centro-parietal signals separated by task and task framing.
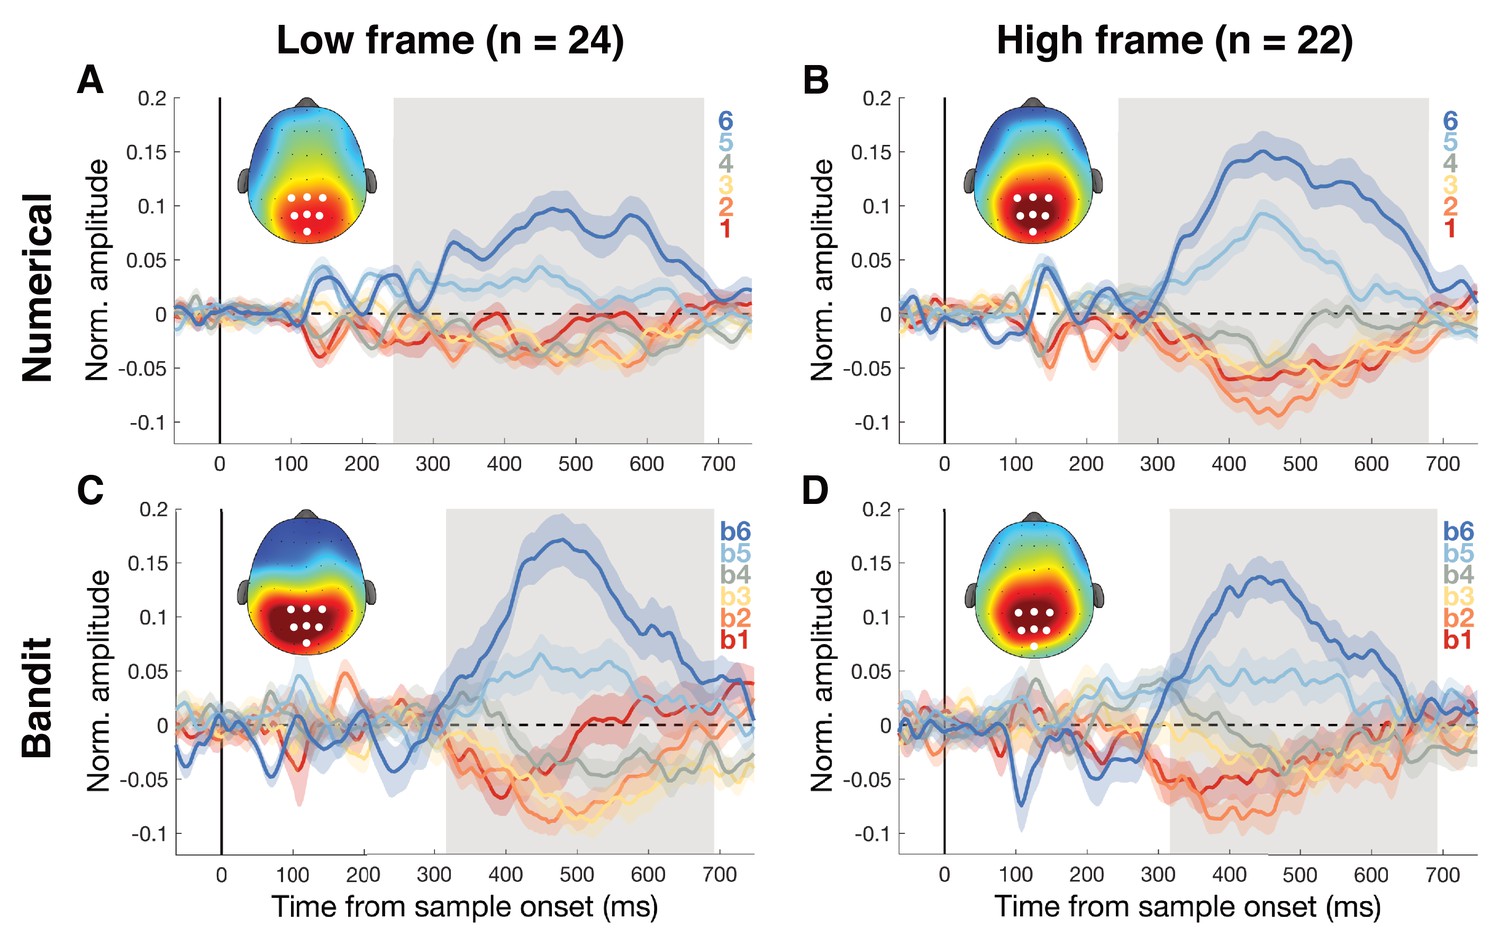
Grey-shaded areas show time of greatest disparity between signals (Kruskal-Wallis, PFDR <0.01). (A-B) Centro-parietal responses for numbers followed an ascending pattern from low to high numbers, independent of whether the task instructions asked to indicate the color with the lowest or highest average. Scalp maps show response amplitude for number six at the identified time window. (C-D) Centro-parietal responses for bandits followed the same ascending pattern, going from subjectively lowest valued bandit to the highest valued bandit. The bandit task was identical for both framing groups. Scalp maps show response amplitude for the highest valued bandit b6 at the identified time window.
Figure 5—figure supplement 2
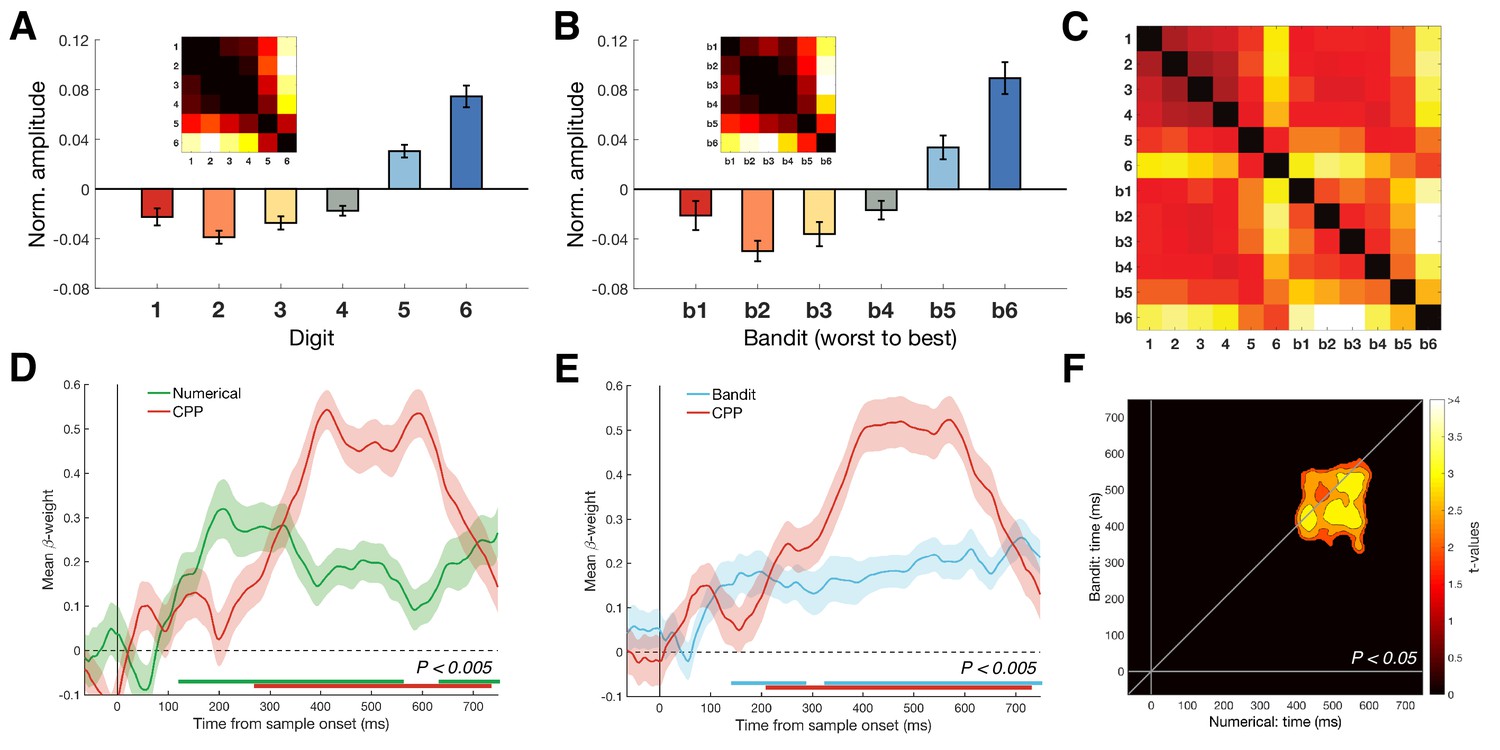
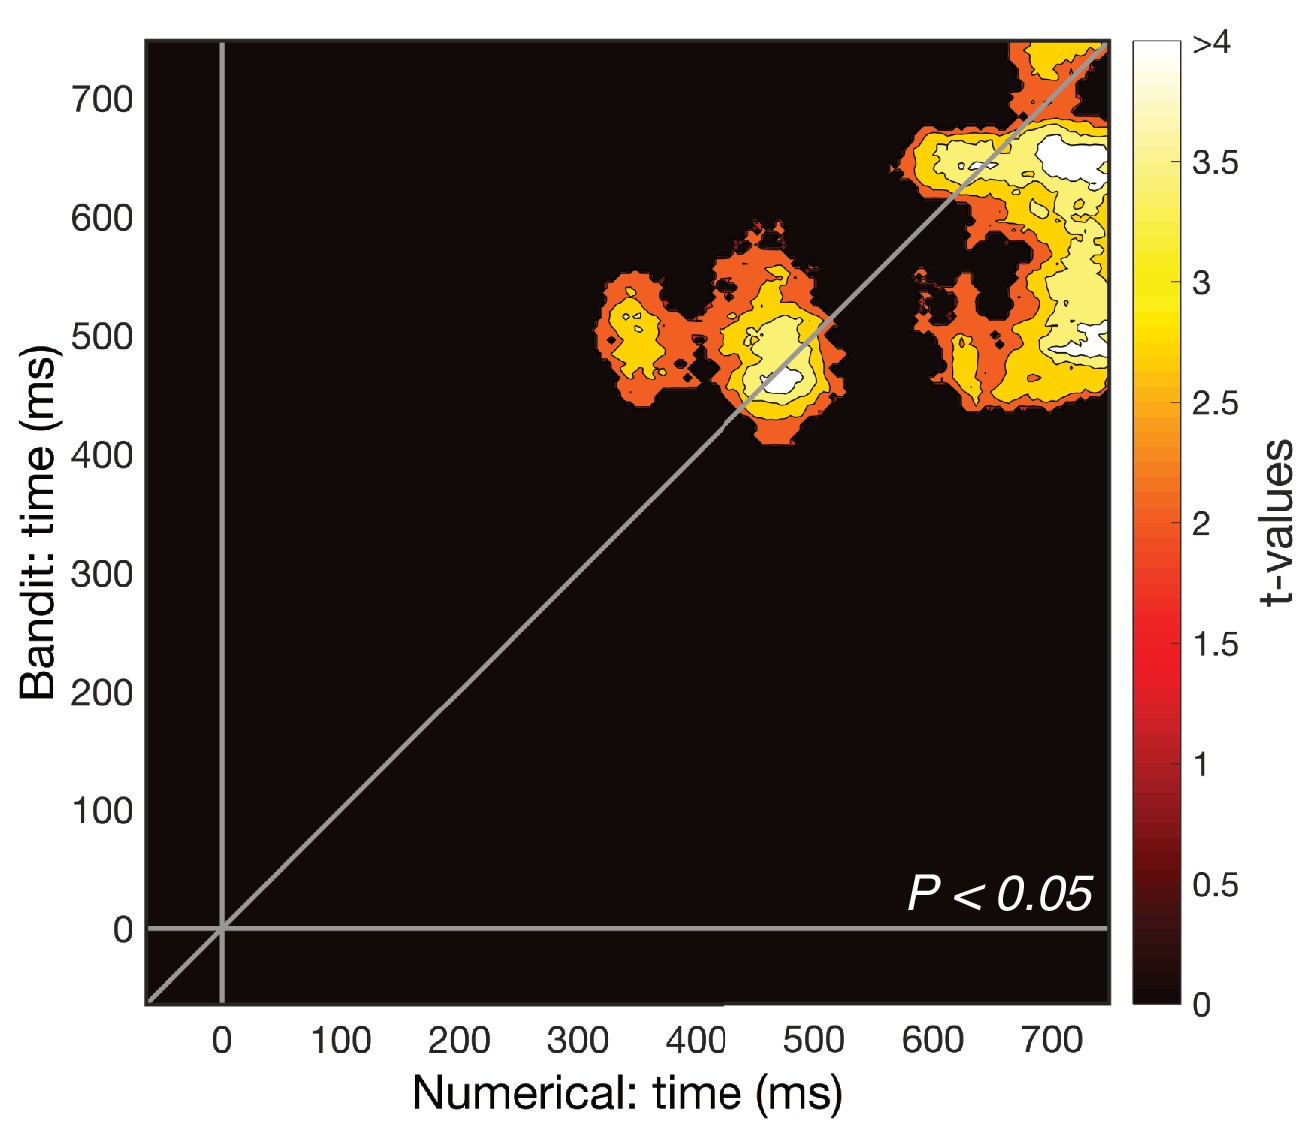
We tested whether the univariate CPP amplitude modulations could explain our multivariate findings.
The magnitude model was compared to a model RDM constructed from univariate CPP amplitude differences in a multiple regression. (A-B) CPP amplitudes were obtained by averaging the univariate centro-parietal response to each stimulus (digit or bandit) within the individually identified time windows from Figure 5A–B. CPP RDMs (inset) were constructed based on the differences between average amplitudes. Error bars represent SEM. (C) Average Euclidean distances of CPP amplitudes from both tasks combined (numerical: 1–6, bandit: b1-b6). The lower left quadrant, containing the between-task distances in CPP amplitudes, served as the CPP model RDM for the cross-validation analysis. (D-F) For each control analysis, the magnitude model significantly explained variance in the multivariate neural patterns even after entering the univariate CPP as a second regressor in a multiple regression (within-task comparison: Pcluster <0.005, bottom colored lines; cross-validation: Pcluster <0.05). Shaded colored area represents SEM.
Figure 5—figure supplement 3
Cross-validation after excluding the first principal dimension.
A more stringent test to control for univariate effects is to exclude the first dimension identified by SVD. Cross-temporal cross-validation on the reduced data revealed a smaller but significant cluster at the same time points as our main result and a previously unobserved later cluster (Pcluster <0.05). Consistent with our previous analyses (Figure 5A–C), this suggests there is a major univariate component to our multivariate findings, but the shared pattern also exists in higher dimensions of the data.
Figure 6
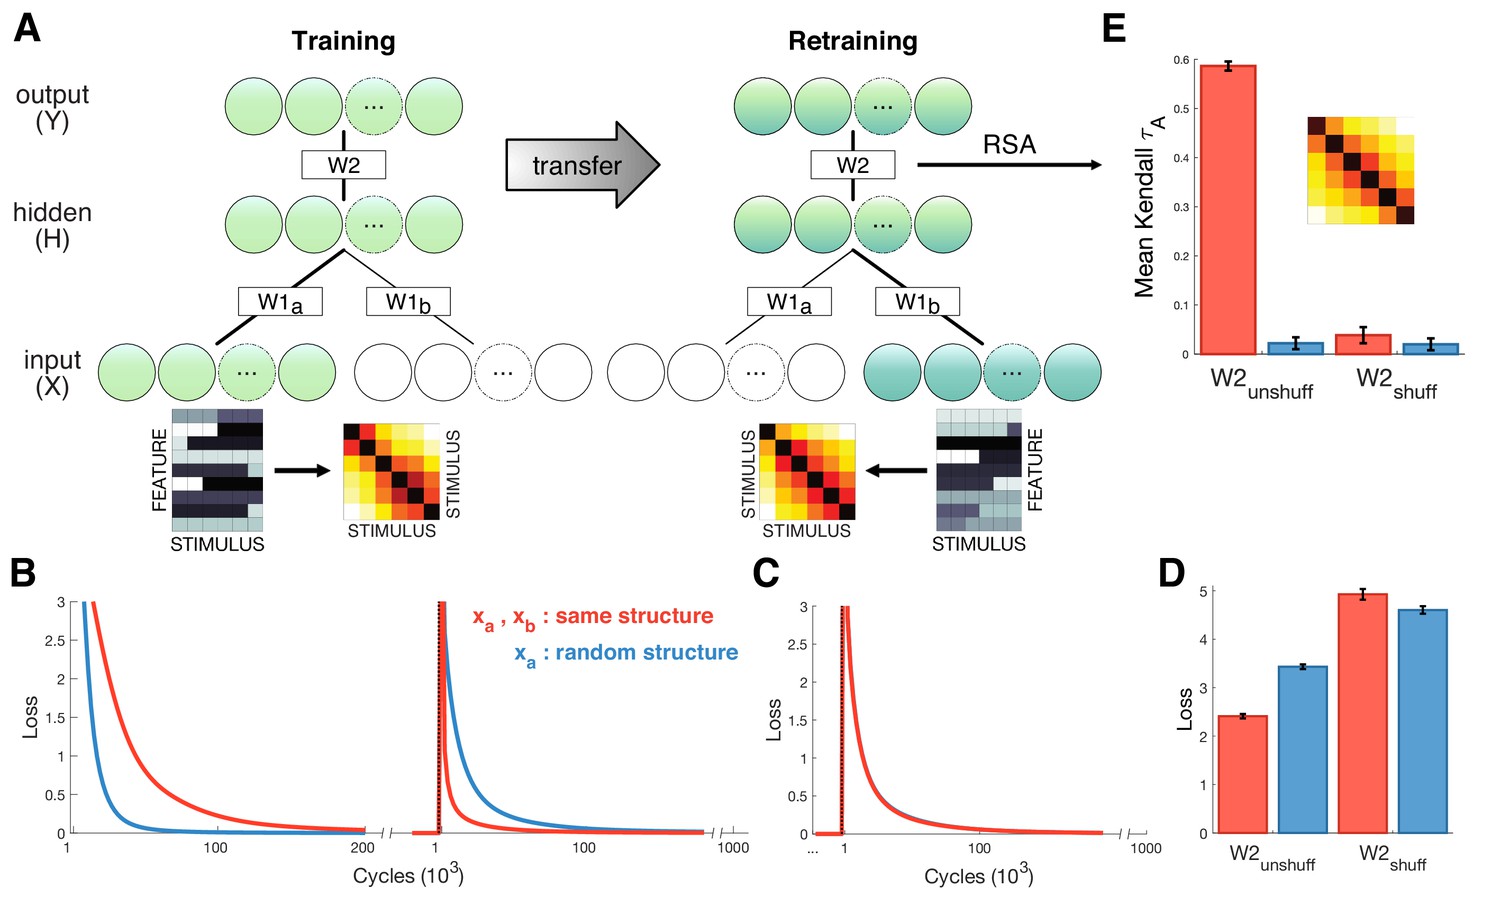
Neural network simulations.
(A) Schematic depiction of network structure and training. The network was first trained to classify inputs fed into units (lower green circles). Inputs consisted of six stimuli that either exhibited gradual increasing dissimilarity or were shuffled as a control (stimulus RDMs shown next to examples of and ). After convergence, the model was trained on new input that were fed into a separate input stream (lower blue circles). Inputs were different to but exhibited the same similarity structure. (B) Loss plotted over the course of training (left panel) and retraining (right panel) for the test (red) and shuffled control (blue) conditions. Learning was faster during training for control stimuli, but retraining was faster when and exhibited shared similarity structure. (C) Loss for control simulations where hidden-to-output weights W2 were shuffled between training and retraining, suggesting successful transfer depends on structure encoded in W2. (D) Mean loss for first 1000 cycles after retraining. (E) Cross-validation RSA on hidden unit activation for all stimuli in and after retraining. Hidden unit activations exhibit shared similarity structure only when W2 remains unshuffled and and share structure. Inset shows cross-validation RDM from hidden units for the test condition. Error bars show SEM over 100 network simulations with different initialization.
Videos
Video 1
The neural geometry of the first two dimensions of both tasks in shared space over time, identified through multidimensional scaling (MSD).
https://doi.org/10.7554/eLife.42816.016Additional files
-
Transparent reporting form
- https://doi.org/10.7554/eLife.42816.018
Download links
A two-part list of links to download the article, or parts of the article, in various formats.
Downloads (link to download the article as PDF)
Open citations (links to open the citations from this article in various online reference manager services)
Cite this article (links to download the citations from this article in formats compatible with various reference manager tools)
Neural structure mapping in human probabilistic reward learning
eLife 8:e42816.
https://doi.org/10.7554/eLife.42816


