Optimization-by-design of hepatotropic lipid nanoparticles targeting the sodium-taurocholate cotransporting polypeptide
- University of Basel, Switzerland
- University of British Columbia, Canada
- University Hospital Heidelberg, Germany
- University Hospital Heidelberg, INF, Germany
Figures
Figure 1 with 9 supplements
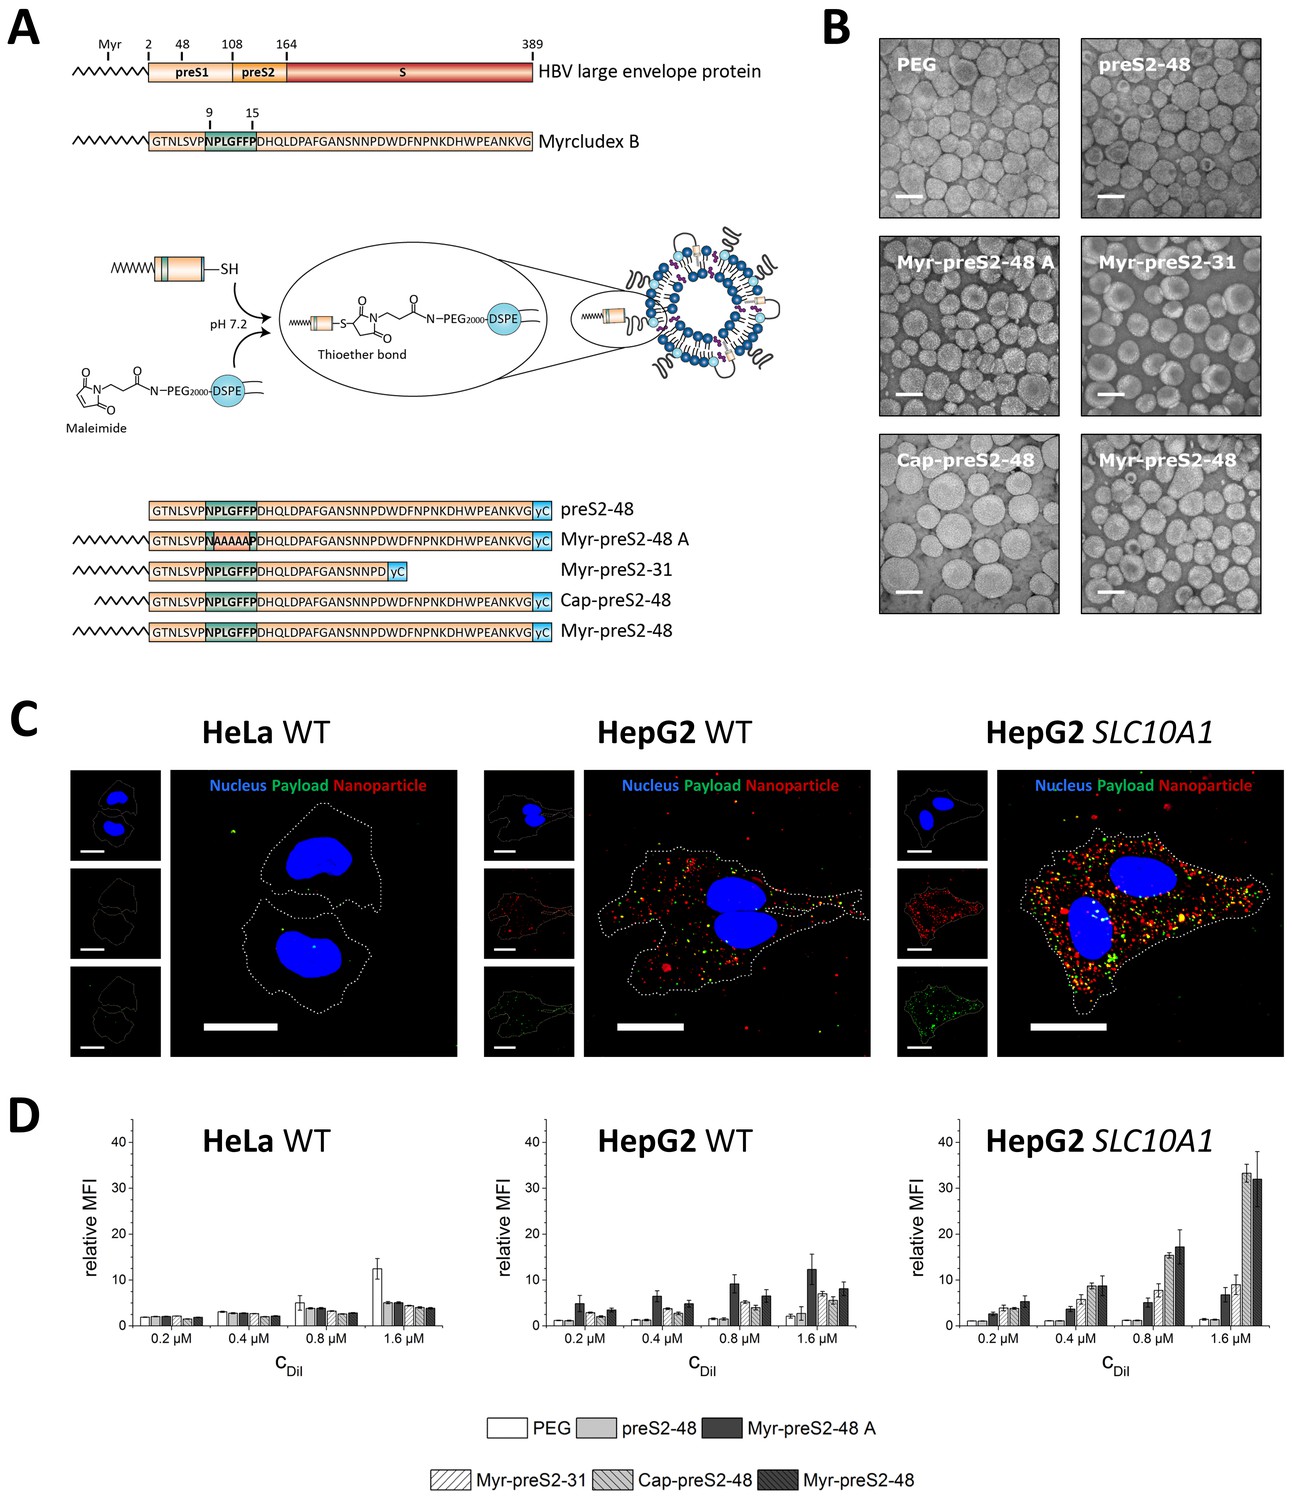
Hepatotropic nanoparticles based on liposomes modified with Myrcludex B-derived peptides for NTCP-specific targeting.
(A) Schematic representation of peptides derived from Hepatitis B virus (HBV) large envelope protein including the first entry inhibitor, Myrcludex B. Different peptides were conjugated via thiol function to the distal end of PEG chains integrated in the nanoparticle structure using maleimide chemistry. The most important amino acid sequence (9-15) for NTCP-specific binding is highlighted in green color in each lipopeptide. (B) Representative transmission electron microscopy images of different Myrcludex B-derived lipopeptide conjugated nanoparticles. Scale bar = 100 nm. (C) Uptake of Myrcludex B-modified nanoparticles into human cells with variable NTCP expression levels. Nanoparticles have a dual fluorescent label, that is lipophilic membrane label (DiI, red) and hydrophilic payload incorporation (carboxyfluorescein, green). Representative confocal laser scanning microscopy maximum intensity projections for Myr-preS2-48 modified nanoparticles after 30 min are shown. Dotted lines indicate cell membranes. Blue signal: Hoechst stain of cell nuclei. Scale bar = 10 µm. (D) Flow cytometry analysis of uptake rate into non-hepatic HeLa cells, liver derived HepG2 cells and SLC10A1 overexpressing HepG2 cells. Increasing concentrations of nanoparticles (CDiI) modified with different Myrcludex B-derived peptides were evaluated. Relative mean fluorescence intensities (MFI) of DiI signals normalized to untreated cells are given. All values are shown as mean ± SD of biological replicates (n ≥ 3 independent experiments). Numerical data for all graphs are shown in Figure 1—source data 1.
-
Figure 1—source data 1
Characterization of hepatotropic nanoparticles.
- https://doi.org/10.7554/eLife.42276.012
Figure 1—figure supplement 1
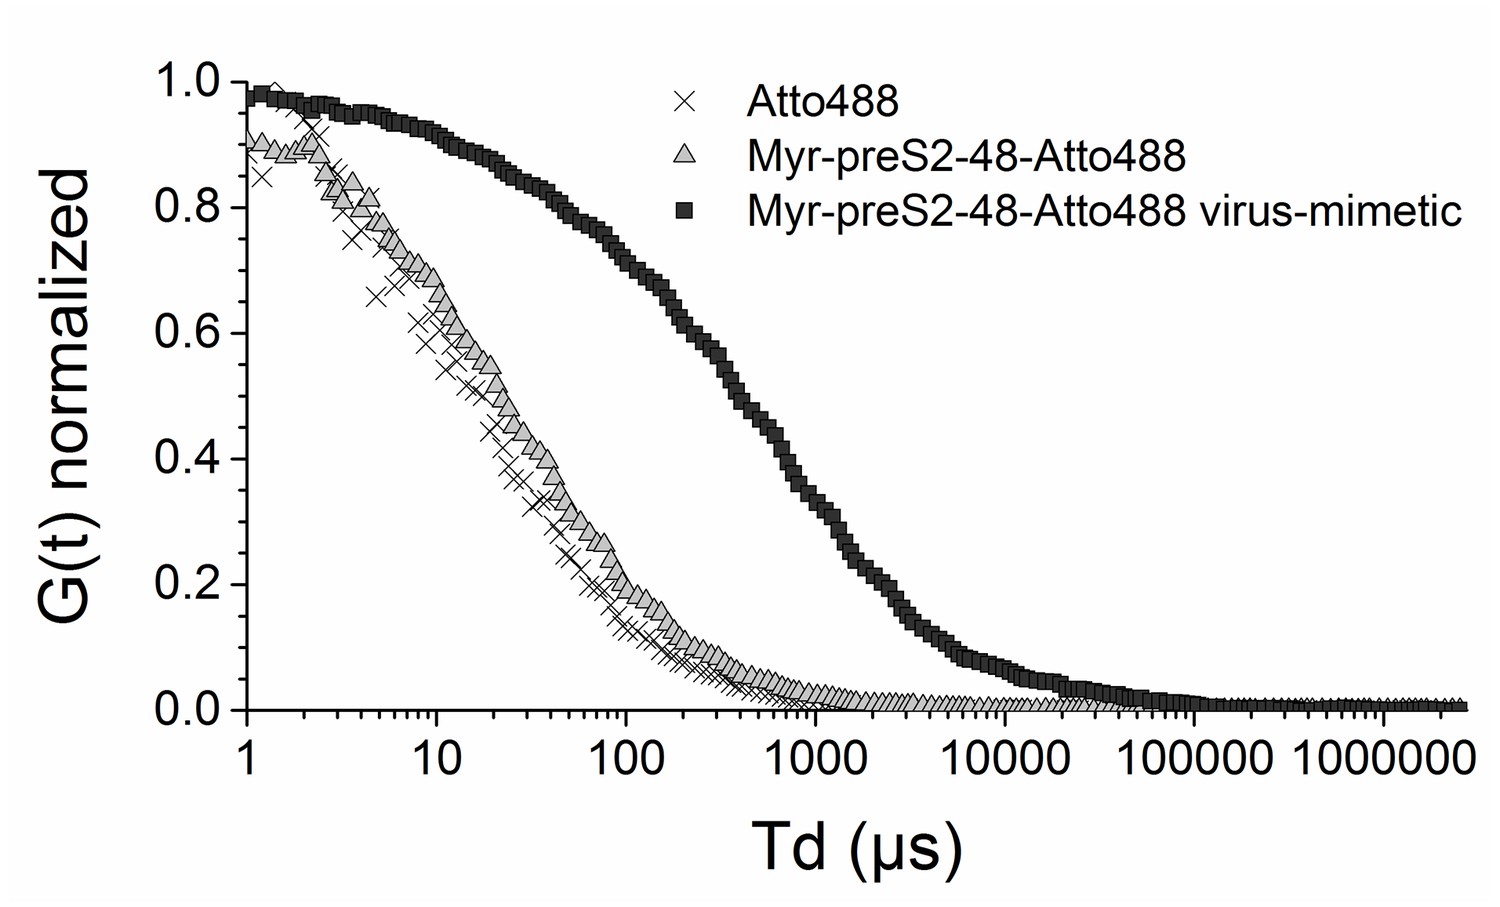
Characterization of hepatotropic nanoparticles based on liposomes modified with Myrcludex B (Myr-preS2-48) using fluorescence correlation spectroscopy.
Autocorrelation curves of Atto488 (black cross), Myr-preS2-48 Atto488 (gray triangle), and Myr-preS2-48-Atto488 conjugated nanoparticles (black square). For comparison curves are normalized to 1 (n = 3 independent samples). Numerical data are shown in Figure 1—source data 1.
Figure 1—figure supplement 2
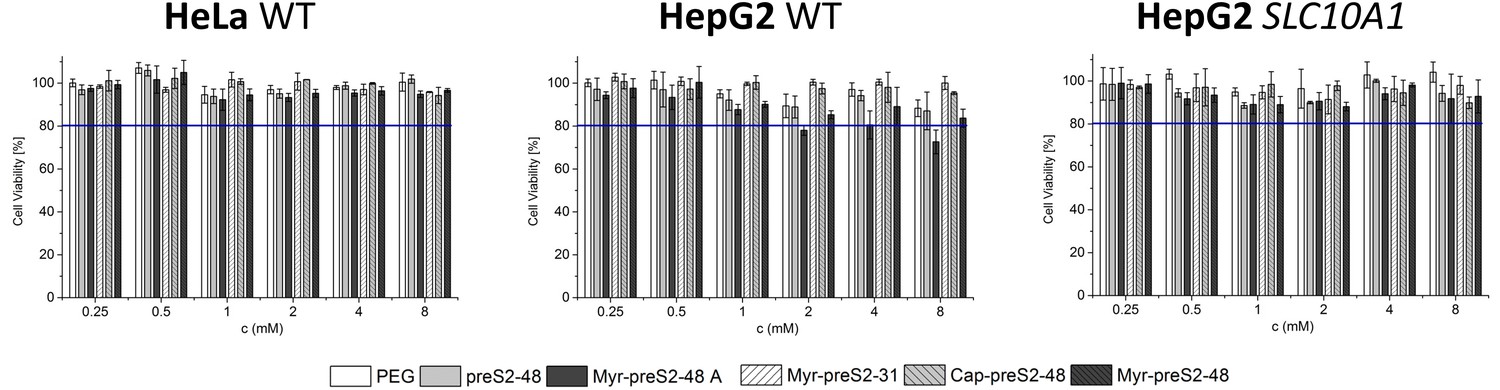
Assessment of cytocompatibility of nanoparticles modified with different Myrcludex B derived peptides using non-hepatic HeLa cells (HeLa WT), liver-derived wildtype HepG2 cells (HepG2 WT) and HepG2 cells overexpressing the human NTCP (HepG2 SLC10A1) by MTT assay.
All values are shown as mean ± SD of biological replicates (n = 3 independent experiments). Numerical data for all graphs are shown in Figure 1—source data 1.
Figure 1—figure supplement 3
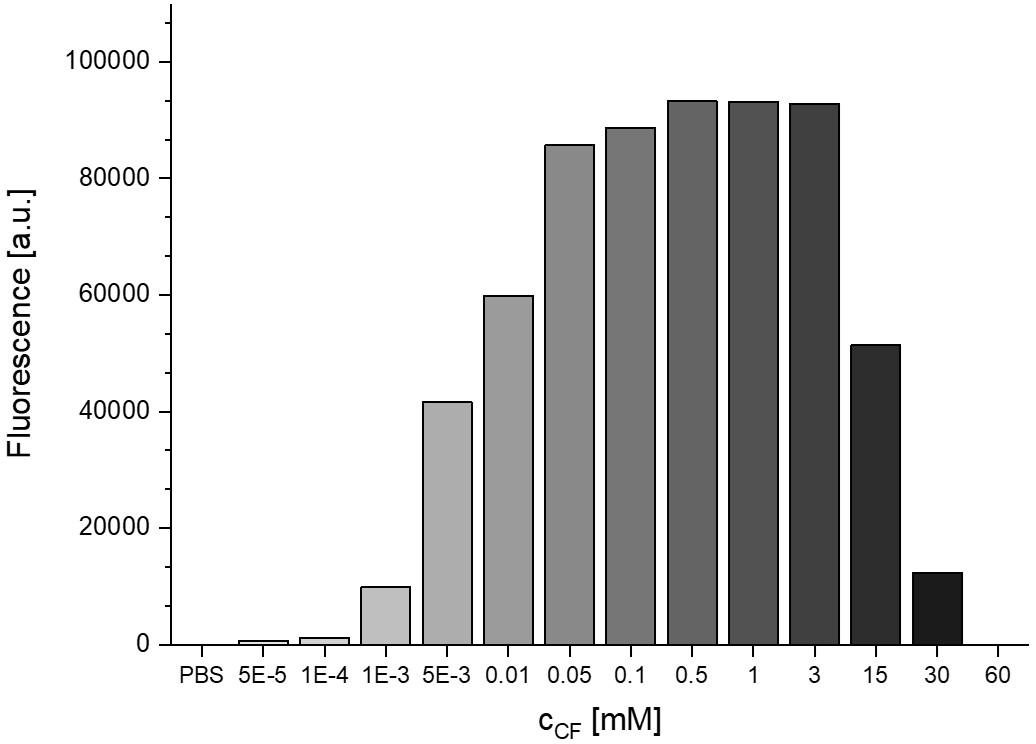
Concentration dependent fluorescence self-quenching of 5 (6)-carboxyfluorescein.
Fluorescence (arbitrary units, a.u.) of carboxyfluorescein in phosphate buffered saline (PBS, pH 7.4) at different concentrations (n = 1). Numerical data are shown in Figure 1—source data 1.
Figure 1—figure supplement 4
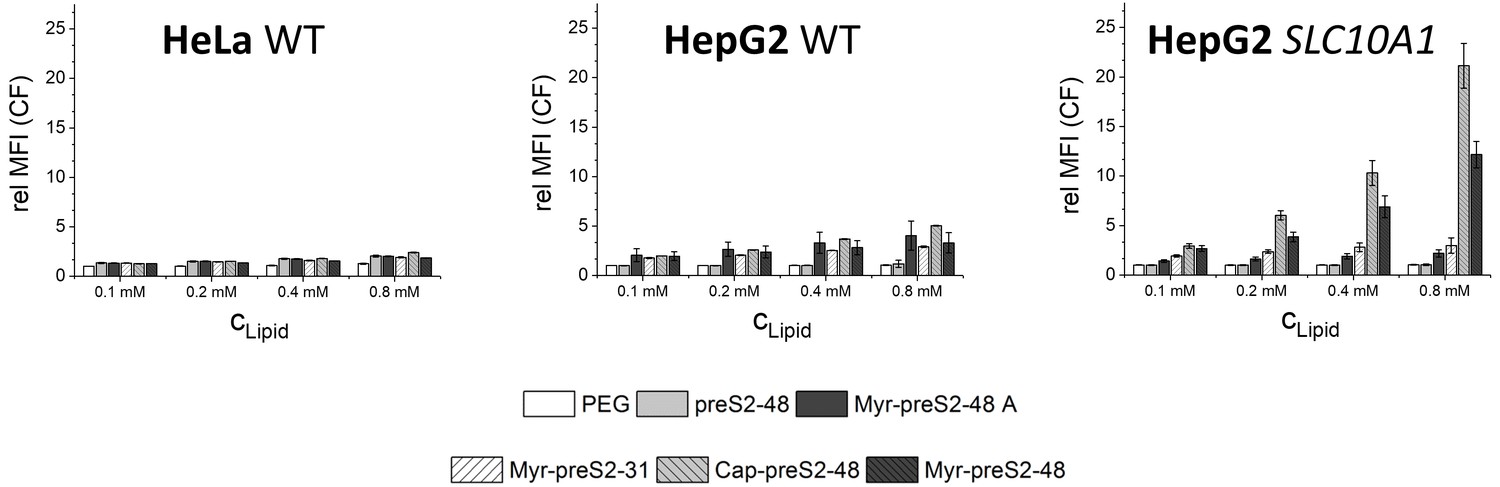
Flow cytometry analysis of nanoparticle uptake rate into non-hepatic HeLa cells, liver-derived HepG2 cells and SLC10A1 overexpressing HepG2 cells.
Increasing concentrations of nanoparticles (CLipid) modified with different Myrcludex B-derived peptides were evaluated. Relative mean fluorescence intensities (MFI) of CF signals normalized to untreated cells are given. All values are shown as mean ± SD of biological replicates (n ≥ 3 independent experiments). Numerical data for all graphs are shown in Figure 1—source data 1.
Figure 1—figure supplement 5
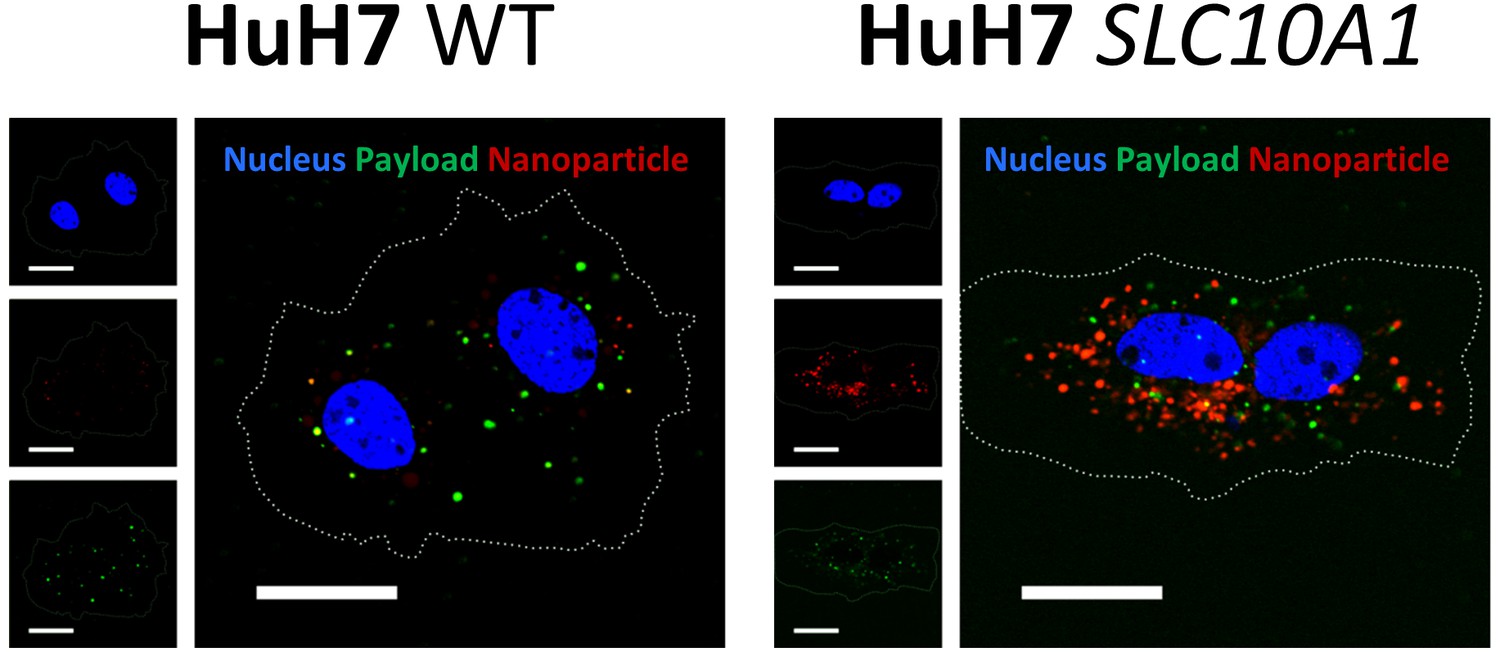
Uptake of Myrcludex B-modified nanoparticles into HuH7 liver-derived cells deficient (HuH7 WT) or overexpressing SLC10A1 (HuH7 SLC10A1).
Nanoparticles have a dual fluorescent label, that is lipophilic membrane label (DiI, red) and hydrophilic payload incorporation (carboxyfluorescein, green). Representative confocal laser scanning microscopy maximum intensity projections 30 min after liposome addition are shown. Blue signal: Hoechst stain of cell nuclei. Scale bar = 10 µm. Single fluorescent channels are presented as small images. Dotted lines indicate cell membranes.
Figure 1—figure supplement 6
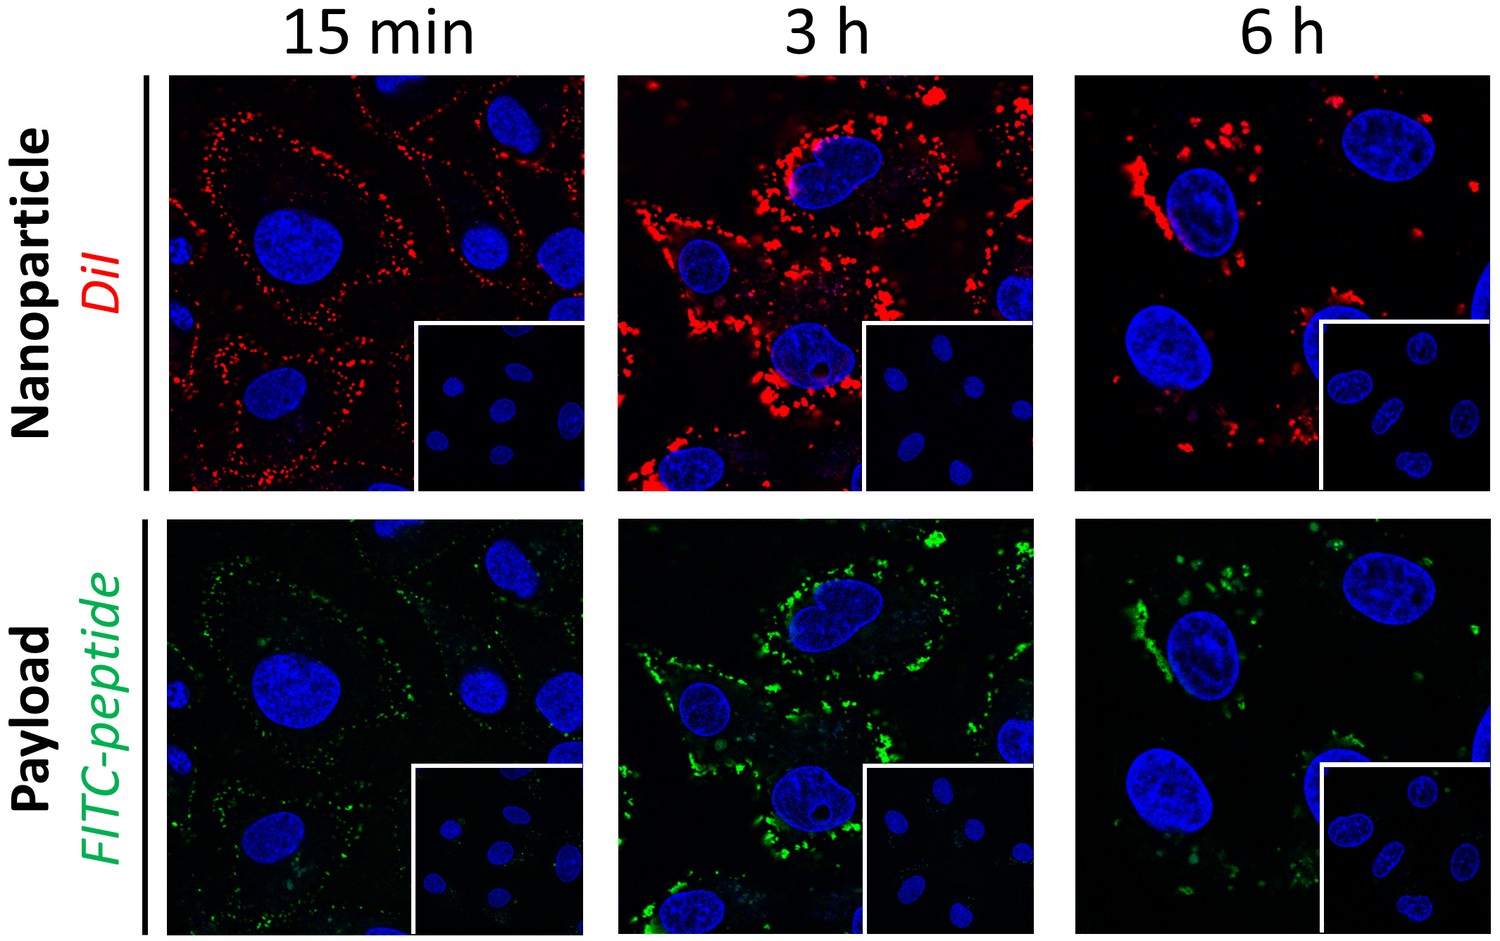
Time-dependent internalization of Myr-preS2-31 modified nanoparticles into SLC10A1 overexpressing HepG2 cells.
Nanoparticles have a dual fluorescent label, that is lipophilic membrane label (DiI, red) and hydrophilic payload incorporation (FITC-peptide, green). Representative confocal laser images for Myr-preS2-31 modified nanoparticles after specific time points are shown. Inserts represent confocal laser images for PEG nanoparticles at the same time point. Blue signal: Hoechst stain of cell nuclei.
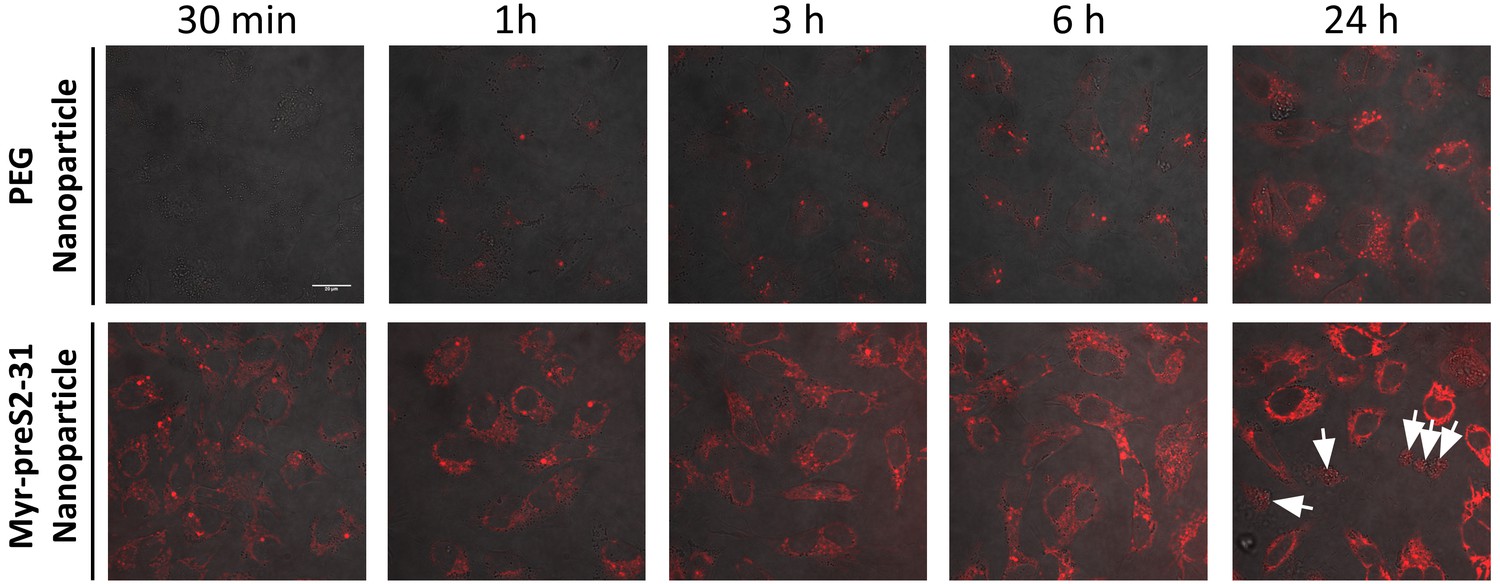
Figure 1—figure supplement 7
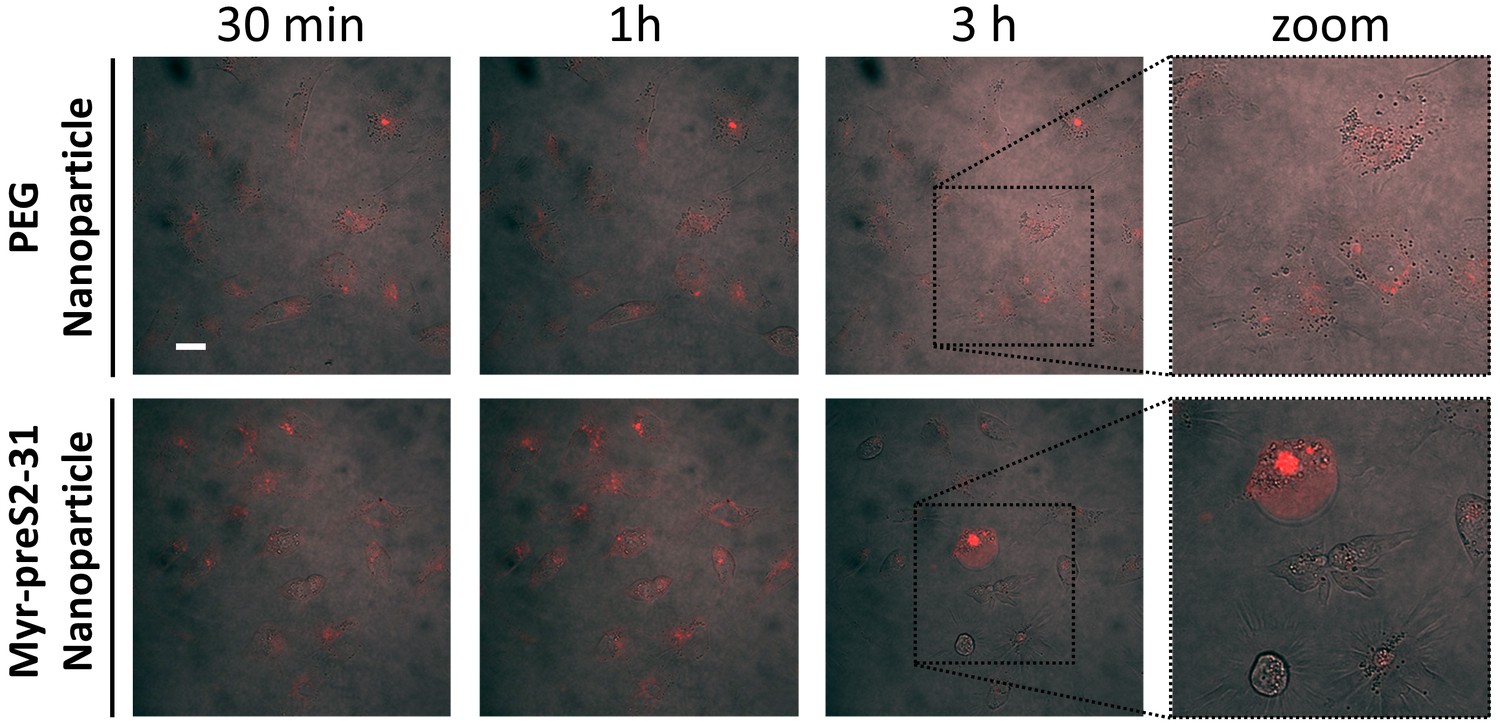
Time-dependent internalization and toxicity of propidium iodide loaded nanoparticles into SLC10A1 overexpressing HepG2 cells.
Nanoparticles were passively loaded with propidium iodide (red signal). Representative confocal laser images for PEG nanoparticles and Myr-preS2-31 modified nanoparticles after specific time points are shown. Scale bar = 20 µm.
Figure 1—figure supplement 8
Time-dependent internalization and toxicity of doxorubicin loaded nanoparticles into SLC10A1 overexpressing HepG2 cells.
Nanoparticles were actively loaded with doxorubicin (red signal) using a citrate buffer gradient. Representative confocal laser images for PEG nanoparticles and Myr-preS2-31 modified nanoparticles after specific time points are shown. Arrows indicate dead cells. Scale bar = 20 µm.
Figure 1—figure supplement 9
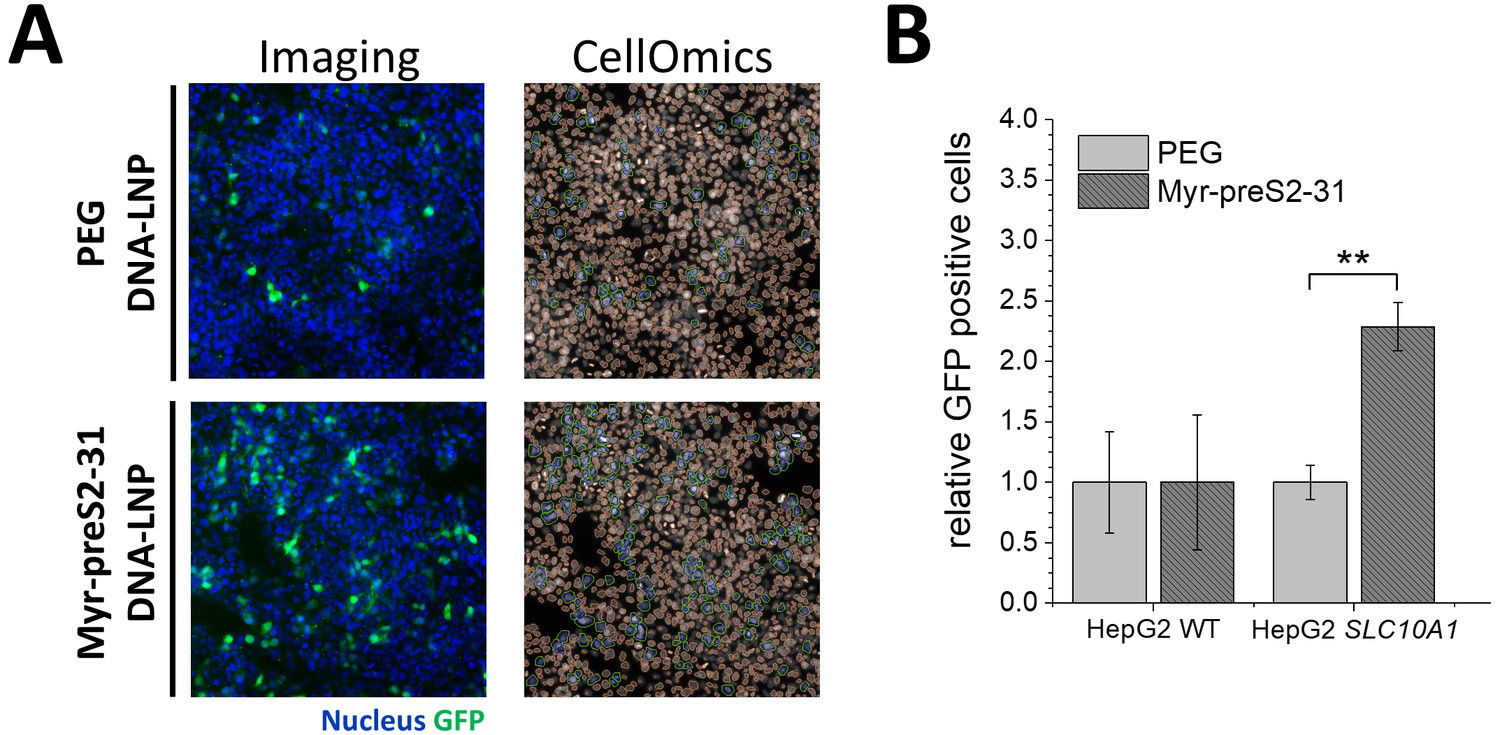
Activity of DNA loaded lipid nanoparticles (LNP).
LNP entrapping GFP coding DNA were modified with Myr-preS2-31 and compared to non-modified PEG DNA-LNP. (A) Representative fluorescence images of HepG2 SLC10A1 cells 24 h after PEG DNA-LNP and Myr-preS2-31 DNA-LNP treatment are shown. Blue signal: Hoechst stain of cell nuclei. Green signal: GFP expressing cells. CellOmics analysis was performed to quantify transfection efficiency. (B) Quantification of transfection efficiency. All values are shown as mean ± SD of biological replicates (n = 4 experiments). **p<0.01.
Figure 2 with 5 supplements
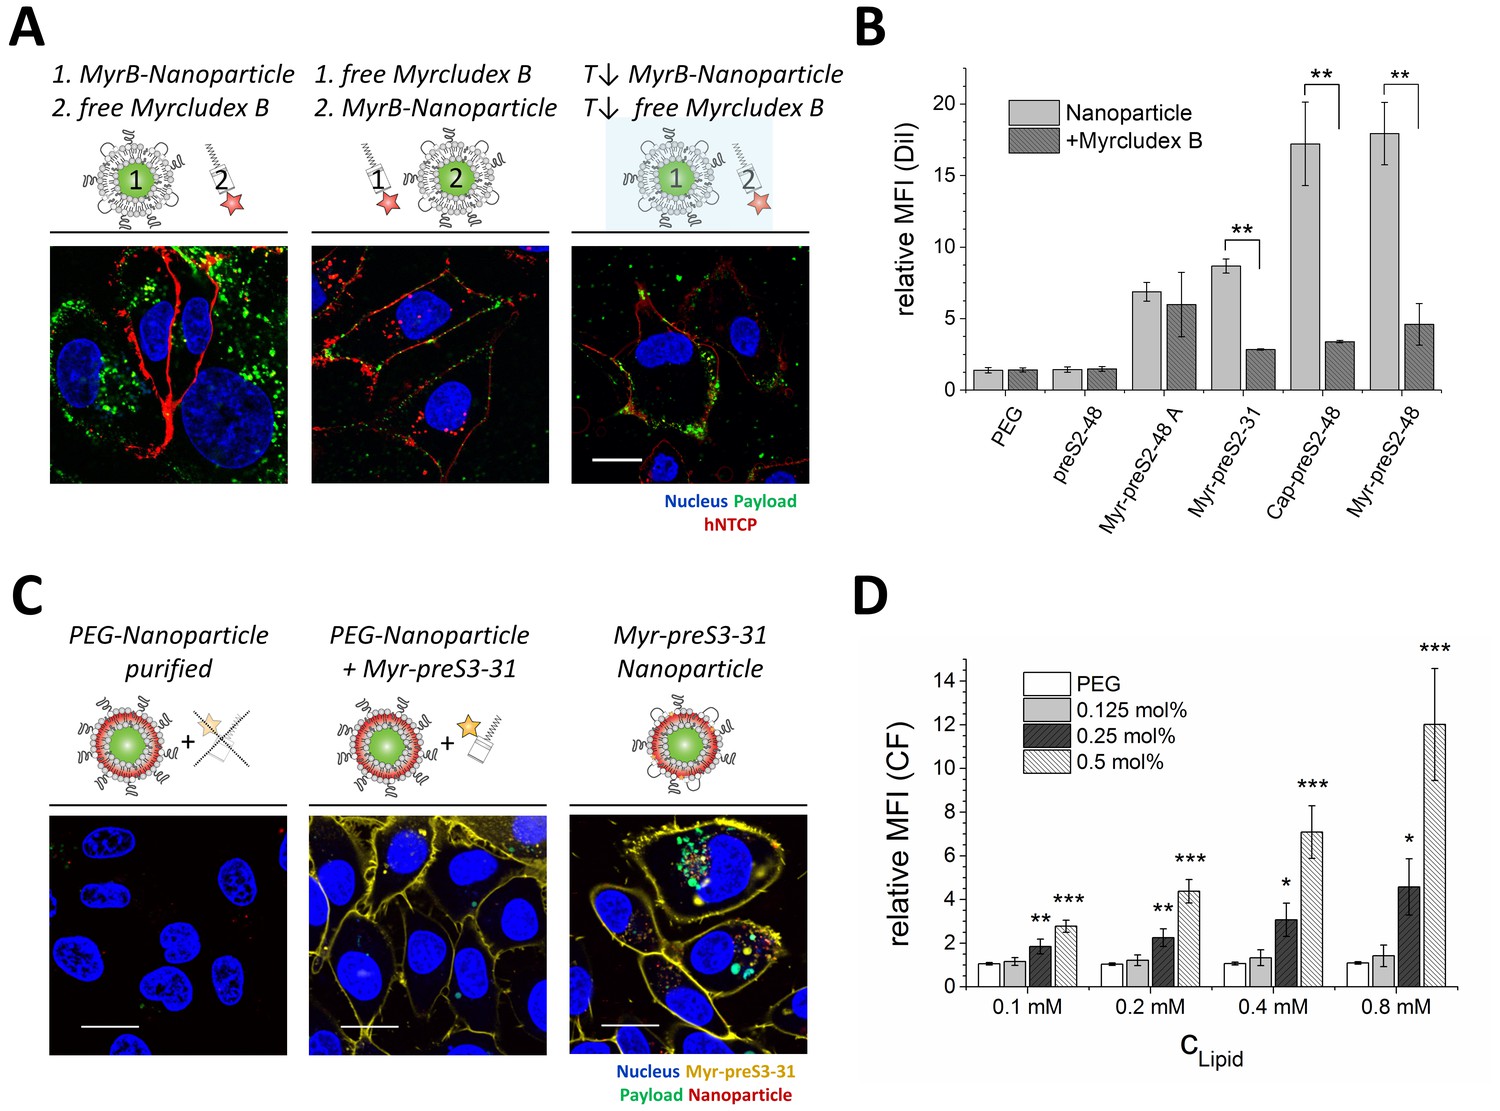
NTCP-specific and ligand-dependent uptake of Myrcludex B-derived lipopeptide conjugated nanoparticles into liver-derived cells in vitro.
(A) Competitive inhibition study of Myrcludex B (MyrB)-conjugated nanoparticle uptake (carboxyfluorescein payload, green signal) into HepG2 SLC10A1 already after 30 min. Free Atto-565 labeled Myrcludex B (red signal) was added after (left panel) or before (middle panel) nanoparticle. Uptake studies at lower temperature (T↓, 4°C, right panel) were performed to demonstrate energy-dependent process of nanoparticle internalization. Representative confocal laser scanning microscopy images are shown. Blue signal: Hoechst stain of cell nuclei. Scale bar = 10 µm. (B) Quantification of nanoparticle uptake in absence or presence of free Myrcludex B dependent on different Myrcludex B derived peptide modification. All values are shown as mean ± SD of biological replicates (n = 3 independent experiments). **p<0.01. (C) Uptake study of nanoparticles (membrane dye, DiI, red signal) loaded with carboxyfluorescein (green signal) into HepG2 SLC10A1 without, mixed or covalently modified with Atto-633 conjugated Myr-preS2-31 (yellow signal). Myr-preS2-31-K-Atto633 is covalently linked to surface via stable thioether bond (right panel). Representative confocal laser scanning microscopy images are shown. Blue signal: Hoechst stain of cell nuclei. Scale bar = 10 µm. (D) Concentration (CLipid) dependent uptake of nanoparticles modified with different amounts of Myr-preS2-31 analyzed by flow cytometry and based on CF signal. All values are shown as mean ± SD of biological replicates (n = 4 independent experiments). *p<0.05, **p<0.01, ***p<0.001. Numerical data for all graphs are shown in Figure 2—source data 1.
-
Figure 2—source data 1
Influence of ligand on cellular interactions.
- https://doi.org/10.7554/eLife.42276.021
Figure 2—figure supplement 1
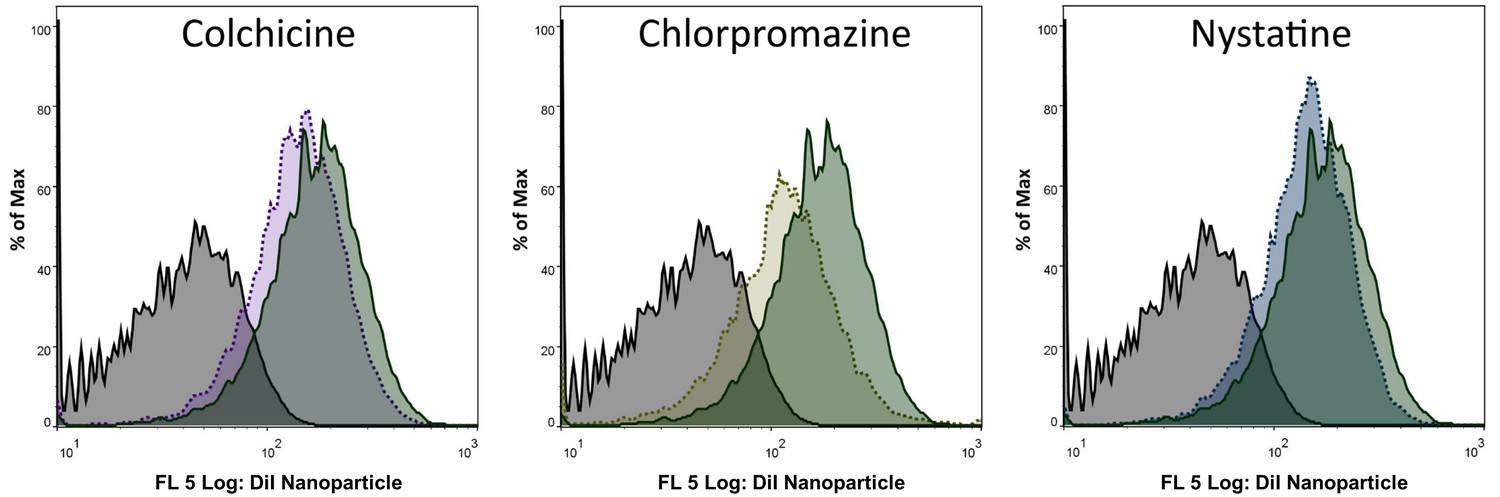
NTCP-dependent uptake mechanism of nanoparticles.
Flow cytometry analysis of nanoparticle internalization in presence of different pharmacological pathway inhibitors. Histograms of HepG2 SLC10A1 cells incubated with PBS (gray; solid line) and nanoparticles in absence (green; solid line) or presence of colchicine (micropinocytosis inhibitor, purple; dotted line), chlorpromazine (inhibitor of clathrin-mediated endocytosis, yellow; dotted line), or nystatine (inhibitor of caveolin-mediated endocytosis, blue; dotted line).
Figure 2—figure supplement 2
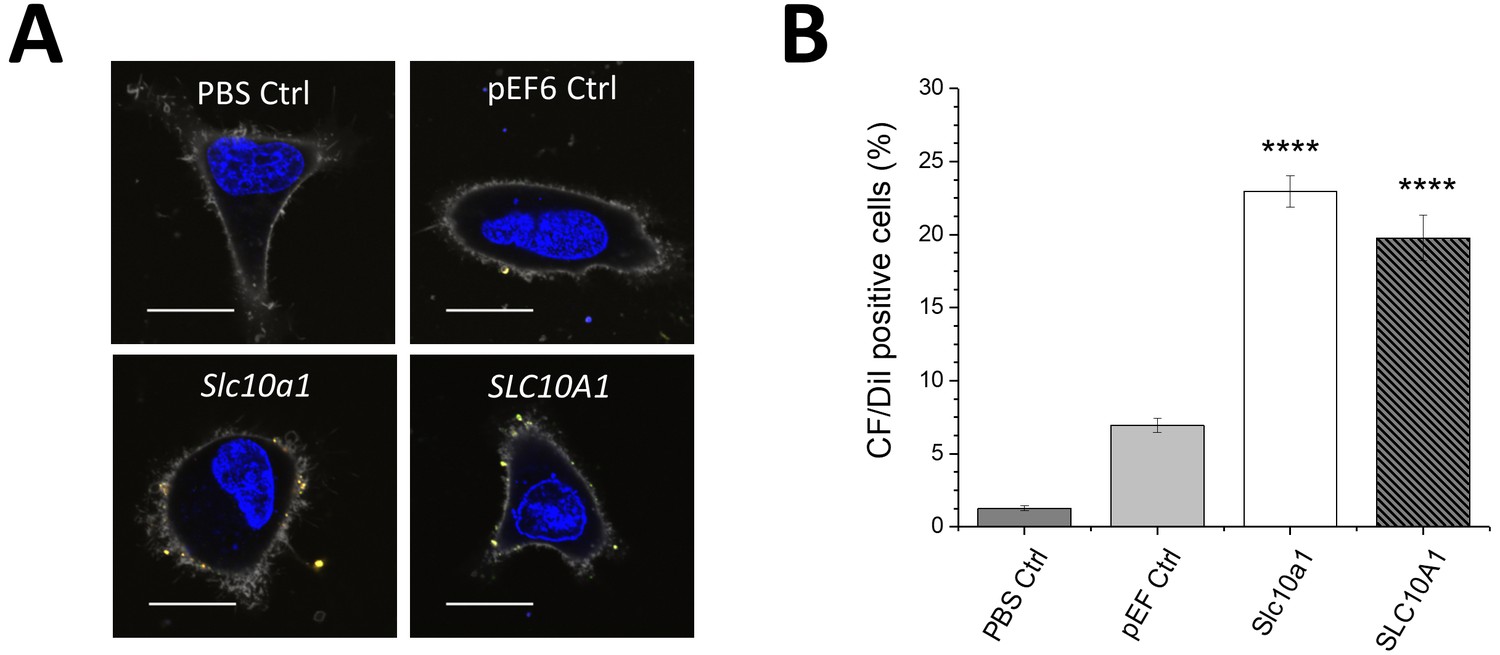
Uptake of Myrcludex B-modified nanoparticles into HeLa cells transfected with empty vector (pEF6 Ctrl), Slc10a1 or SLC10A1.
(A) Binding of nanoparticles was qualitatively assessed using confocal laser scanning microscopy. PBS served as mock control (PBS Ctrl). Representative images are shown 1 h after liposome addition. Blue signal: Hoechst stain of cell nuclei. Gray signal: Cell mask stain of plasma membrane. Yellow signal: DiI labeled liposomes loaded with carboxyfluorescein. Scale bar = 10 µm. (B) Quantification of liposome binding using flow cytometry revealed significant increase of cellular binding by overexpression of Slc10a1 or SLC10A1. All values are shown as mean ± SD of biological replicates (n = 3 independent experiments). ****p<0.001. Numerical data for all graphs are shown in Figure 2—source data 1.
Figure 2—figure supplement 3
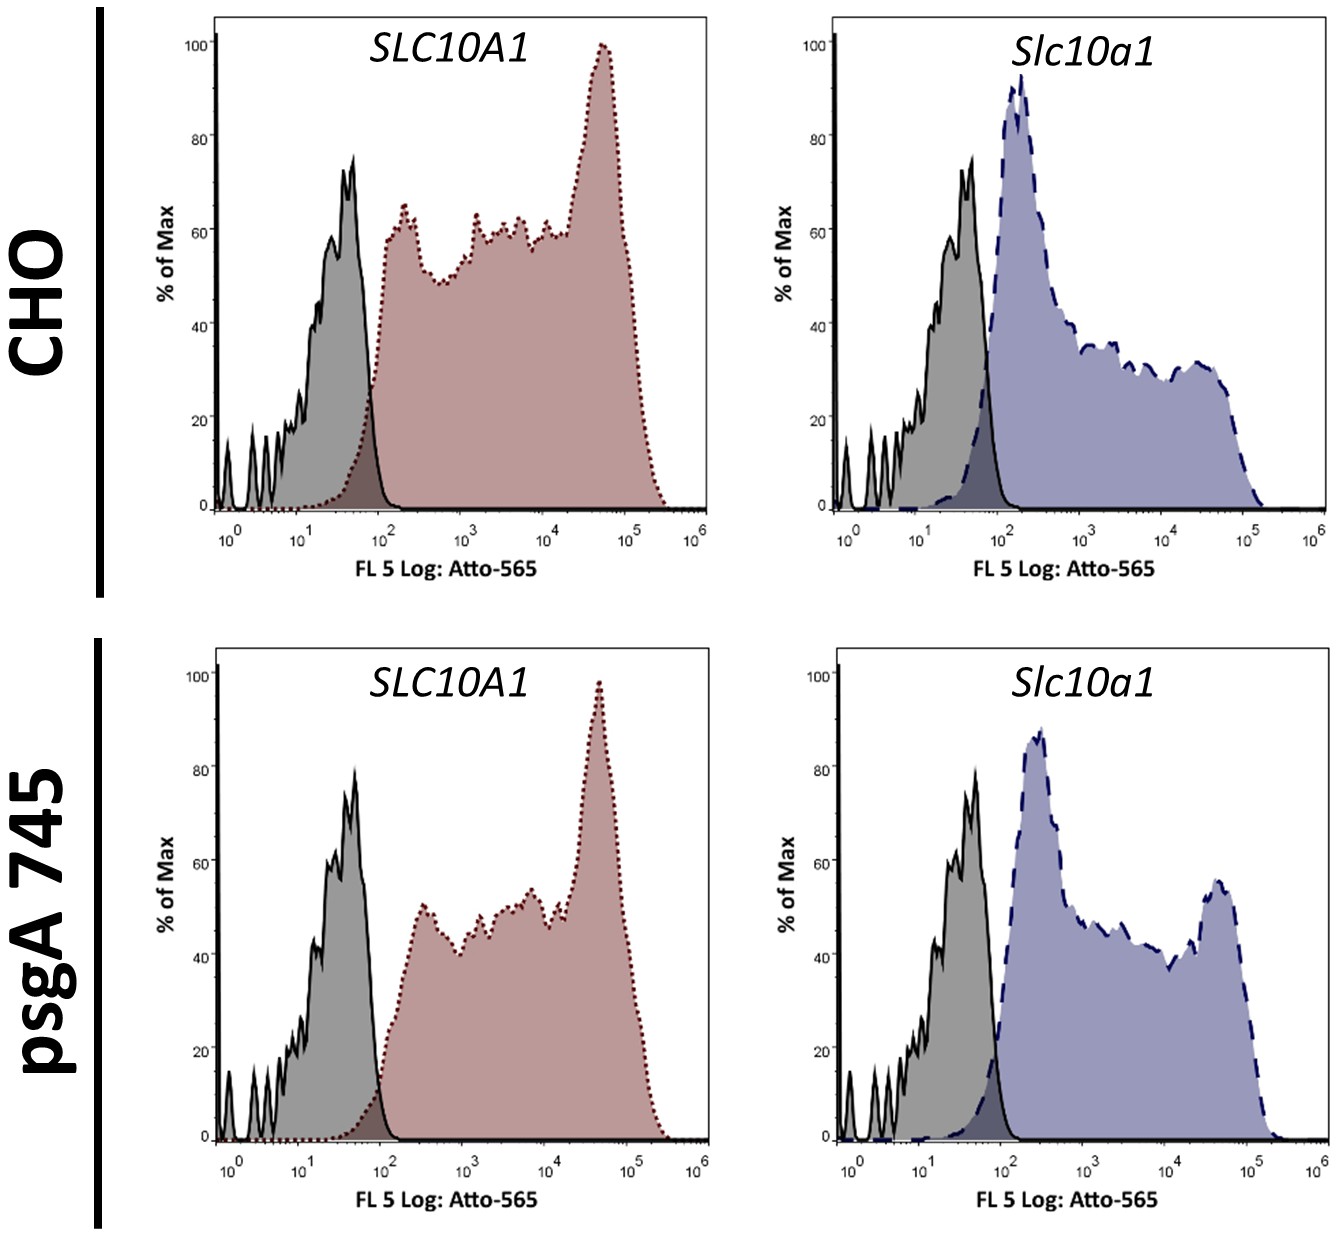
Influence of glycosaminoglycans (GAGs) on Myrcludex B binding.
Flow cytometry analysis of Myrcludex B binding to CHO or psgA745 cells NTCP deficient (pEF6 transfected), or overexpressing SLC10A1 or Slc10a1. psgA745 are CHO xylosyltransferase mutants deficient of GAGs. Histograms of Myrcludex B binding to cells transfected with empty vector (gray; solid line), SLC10A1 (red; dotted line) or Slc10a1 (blue; dashed line).
Figure 2—figure supplement 4
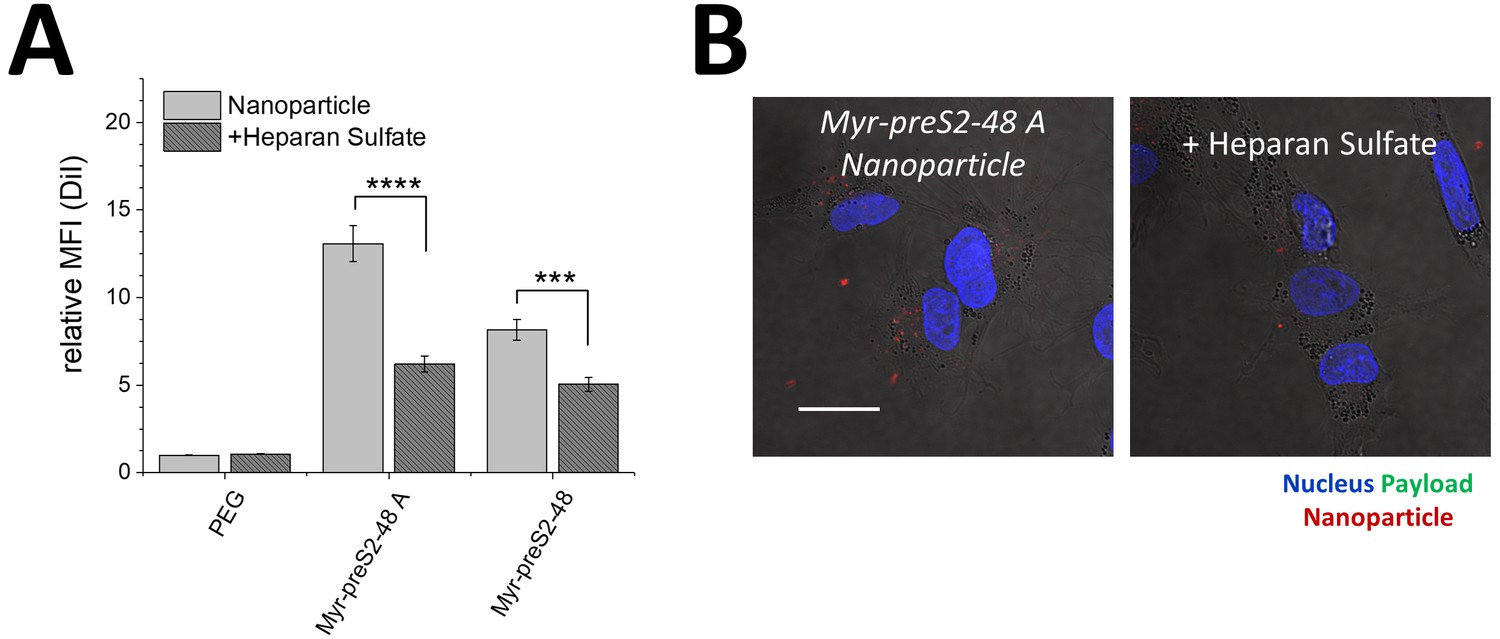
Uptake of nanoparticles into HepG2 WT cells in absence or presence of heparan sulfate.
(A) Binding of PEG, Myr-preS2-48 A and Myr-preS2-48 conjugated nanoparticles was quantitatively assessed using flow cytometry. A significant decrease of cellular binding was observed in presence of heparan sulfate. All values are shown as mean ± SD of biological replicates (n = 3 independent experiments). ***p<0.001, ****p<0.0001. Numerical data for all graphs are shown in Figure 2—source data 1. (B) Representative confocal laser scanning microscopy images of Myr-preS2-48 A nanoparticles (membrane dye, DiI, red signal) loaded with carboxyfluorescein (payload, green signal) internalized into HepG2 SLC10A1 in absence or presence of heparan sulfate. Blue signal: Hoechst stain of cell nuclei. Scale bar = 20 µm.
Figure 2—figure supplement 5
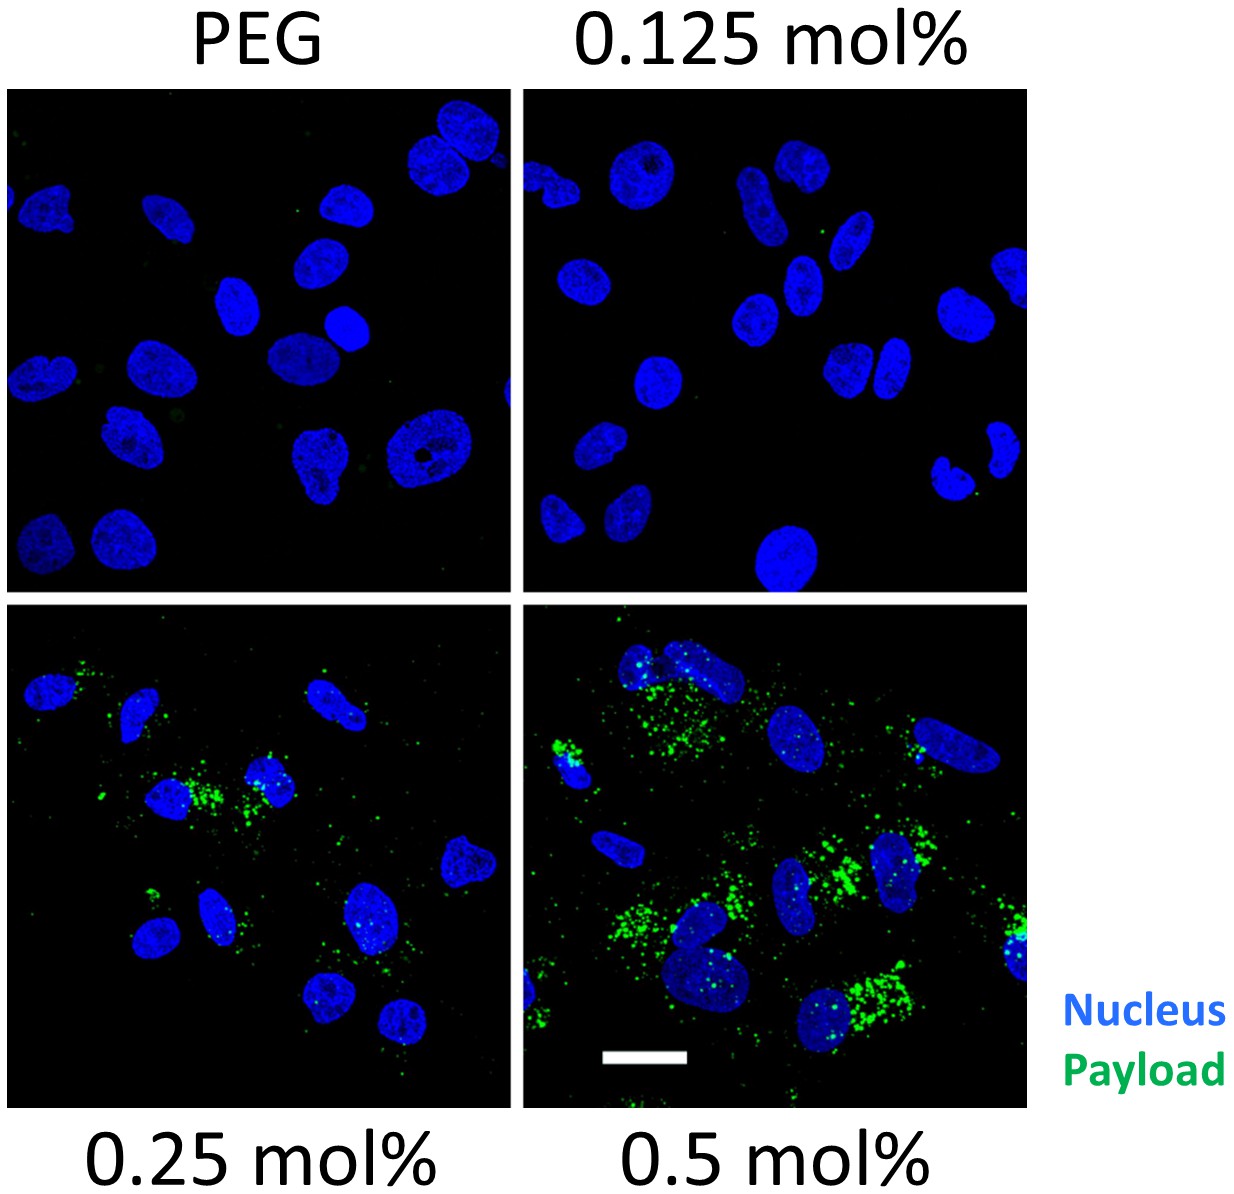
Ligand density dependent uptake of Myrcludex B-modified nanoparticles loaded with carboxyfluorescein (payload, green).
Representative confocal laser scanning microscopy maximum intensity projections are shown. Blue signal: Hoechst stain of cell nuclei. Scale bar = 10 µm.
Figure 3
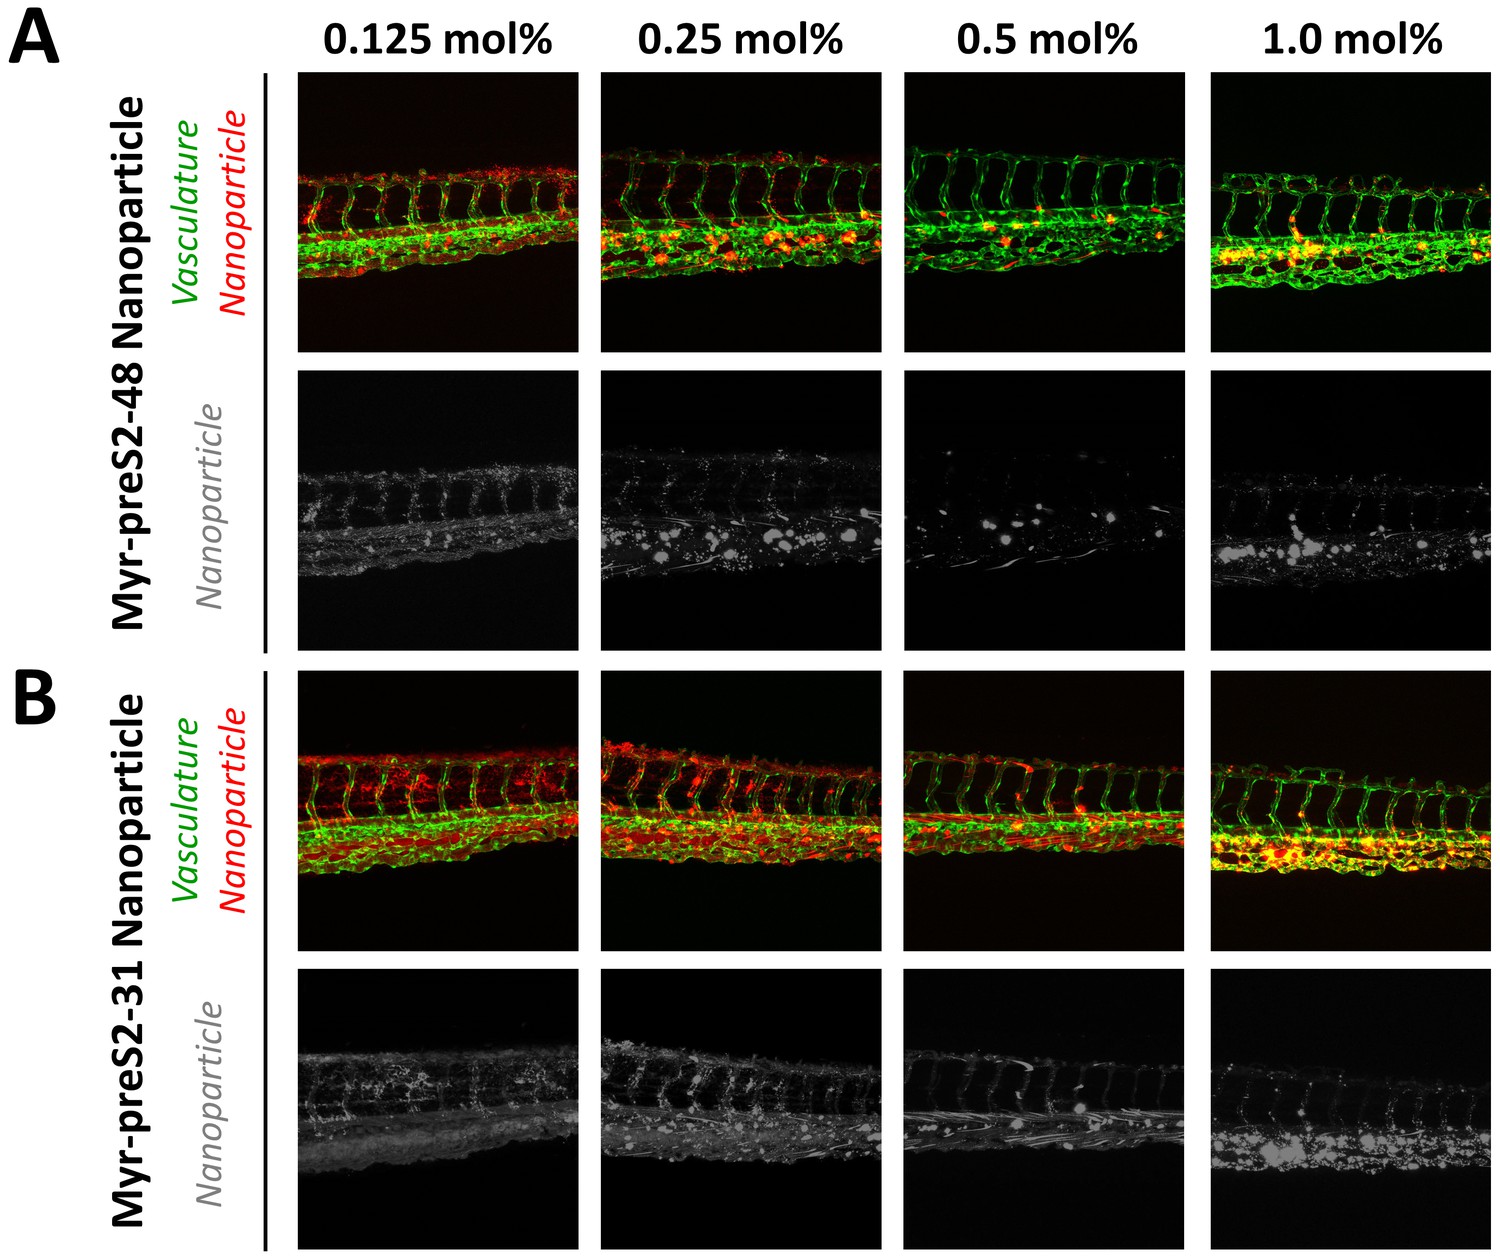
Systemic circulation of Myrcludex B-derived lipopeptide conjugated nanoparticles in vivo in the zebrafish model.
Nanoparticles were modified with different amounts of (A) Myr-preS2-48 or (B) short Myr-preS2-31 and injected into transgenic zebrafish embryos expressing green fluorescent protein in their vasculature endothelial cells (green signal). Membrane of nanoparticles was fluorescently labeled using DiI (red signal). Representative confocal laser scanning microscopy images of tail region 1 hpost injection.
Figure 4 with 1 supplement
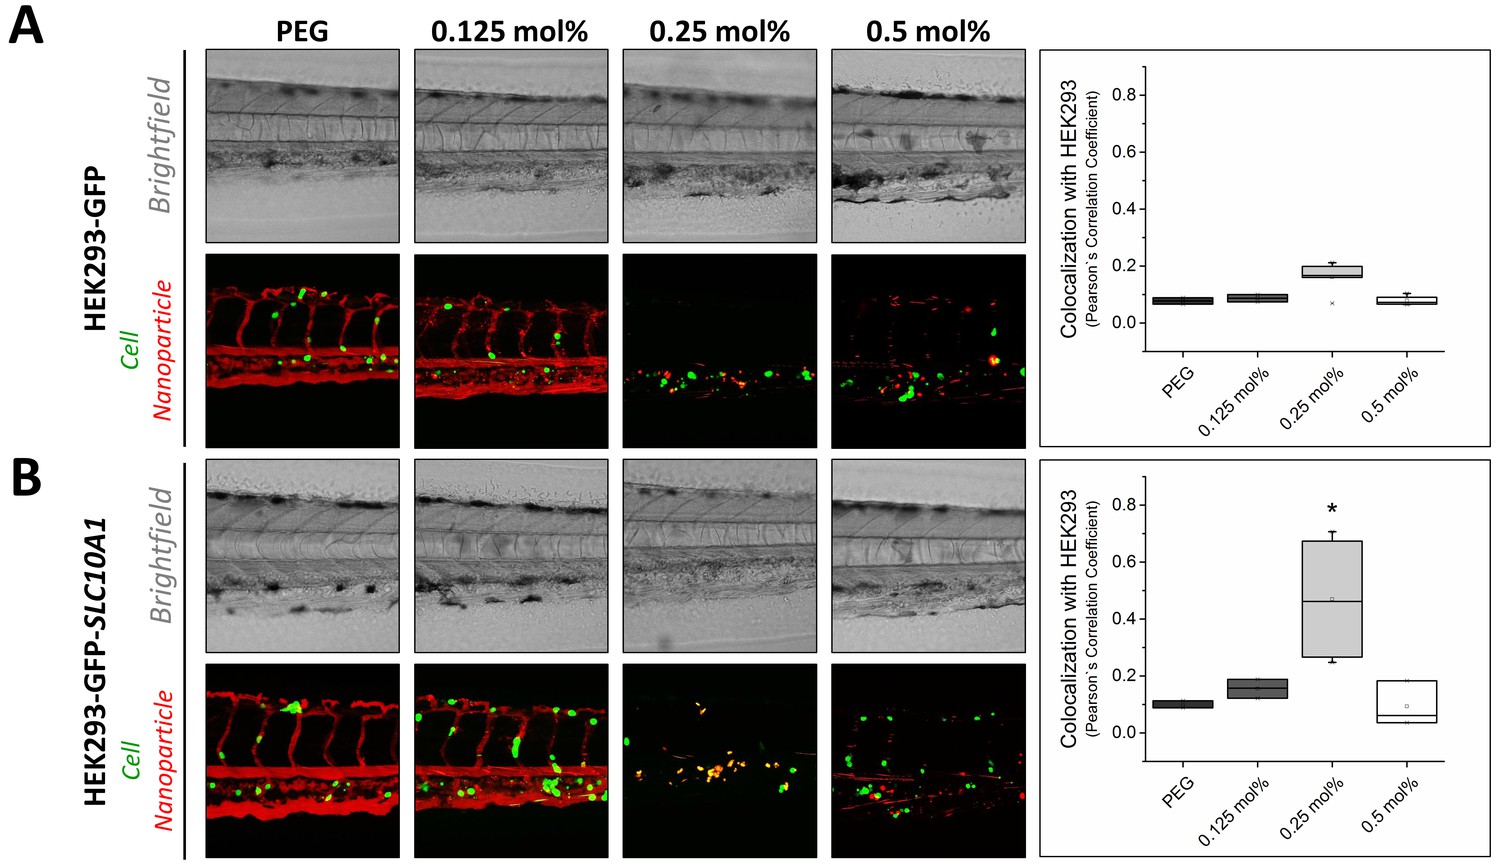
Targeting ability of Myr-preS2-31 conjugated nanoparticles in vivo in xenotransplanted zebrafish embryos.
Nanoparticles were modified with different amounts of Myr-preS2-31 and injected into wild type zebrafish embryos xenotransplanted with human, GFP expressing HEK293 cells (green signal), (A) deficient or (B) expressing SLC10A1. Membrane of nanoparticles was fluorescently labeled using DiI (red signal). Yellow signals demonstrate colocalization (i.e. binding and internalization) of nanoparticles with HEK293-GFP cells. Representative brightfield and fluorescence images of tail region 1 h post injection are shown. Quantitative analysis of nanoparticle binding to HEK293-GFP cells is represented by Pearson´s Correlation Coefficient (PCC). All values are shown as box plots of biological replicates (n ≥ 2 independent experiments). *p<0.05. Numerical data for all graphs are shown in Figure 4—source data 1.
-
Figure 4—source data 1
Targeting xenotransplanted cells in the zebrafish model.
- https://doi.org/10.7554/eLife.42276.025
Figure 4—figure supplement 1
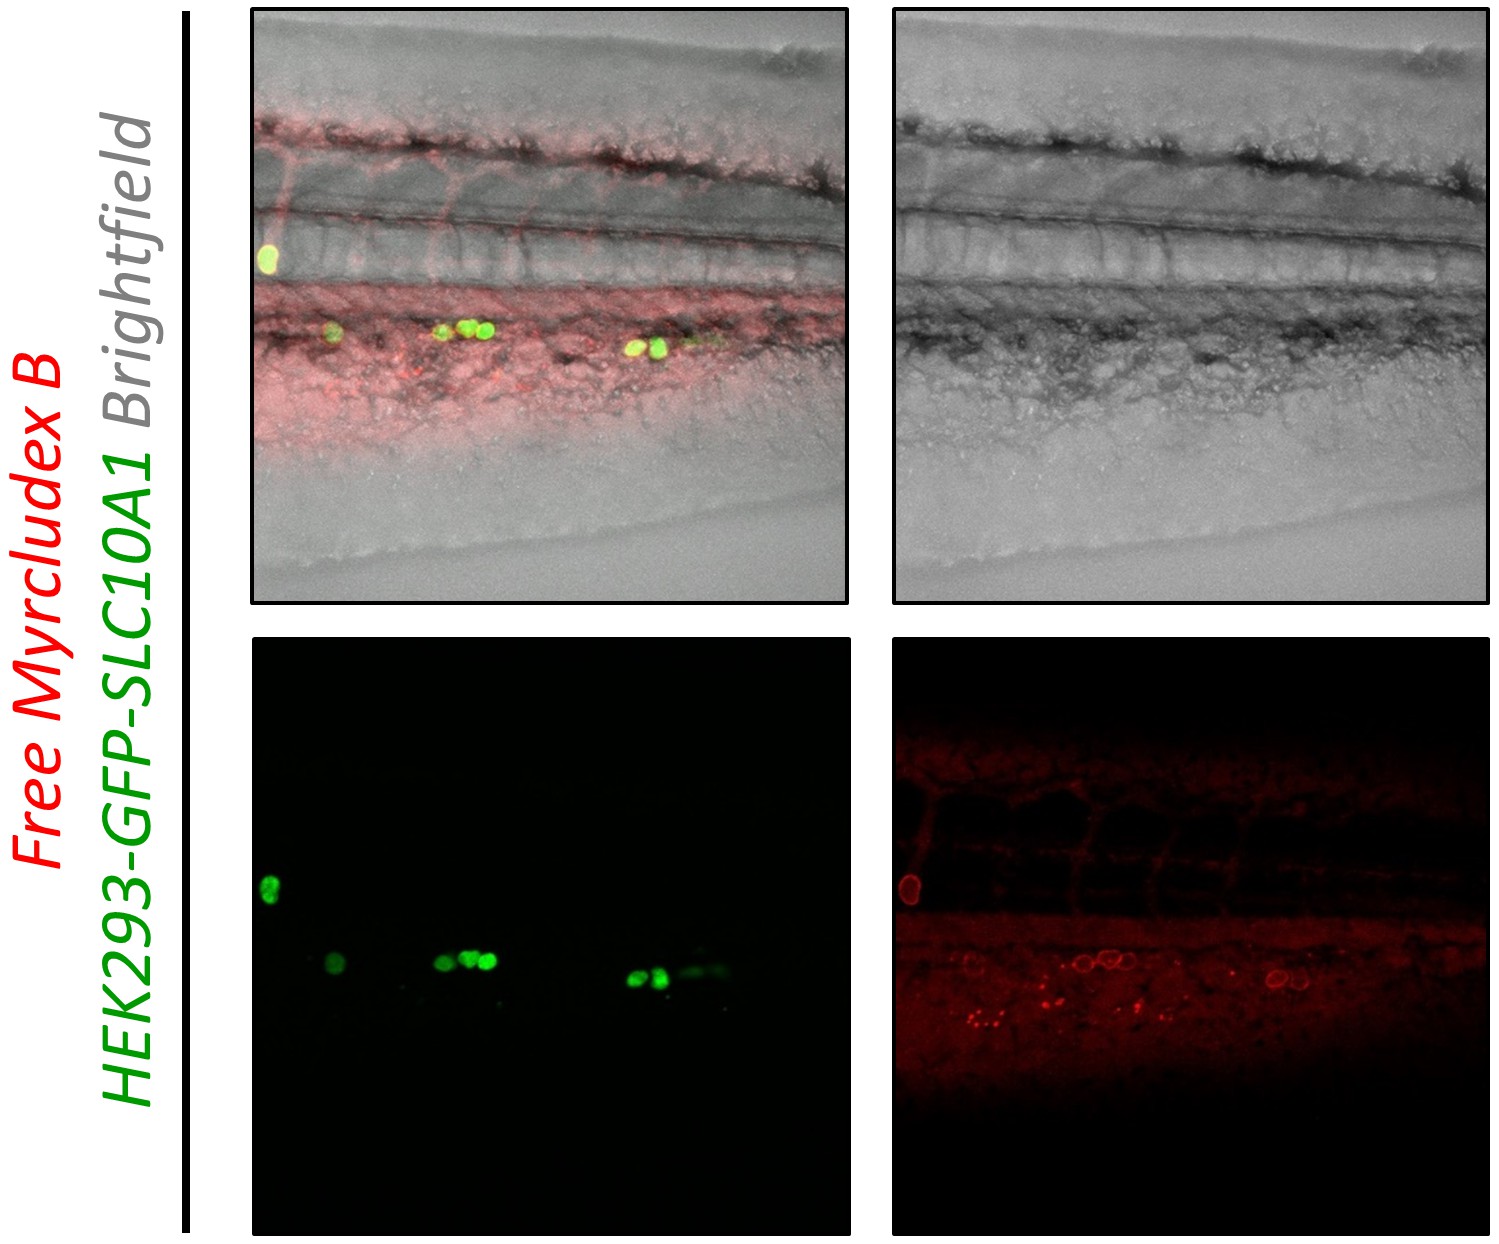
Targeting ability of free Myrcludex B in vivo in xenotransplanted zebrafish embryos.
Atto-565 labeled Myrcludex B (red signal) was injected into wild type zebrafish embryos xenotransplanted with human HEK293 cells expressing SLC10A1 (GFP, green signal). Red signals on surface of HEK293 cells demonstrate binding of Myrcludex B. Representative brightfield and fluorescence images of tail region including a merge image 1 h post injection are shown.
Figure 5 with 9 supplements
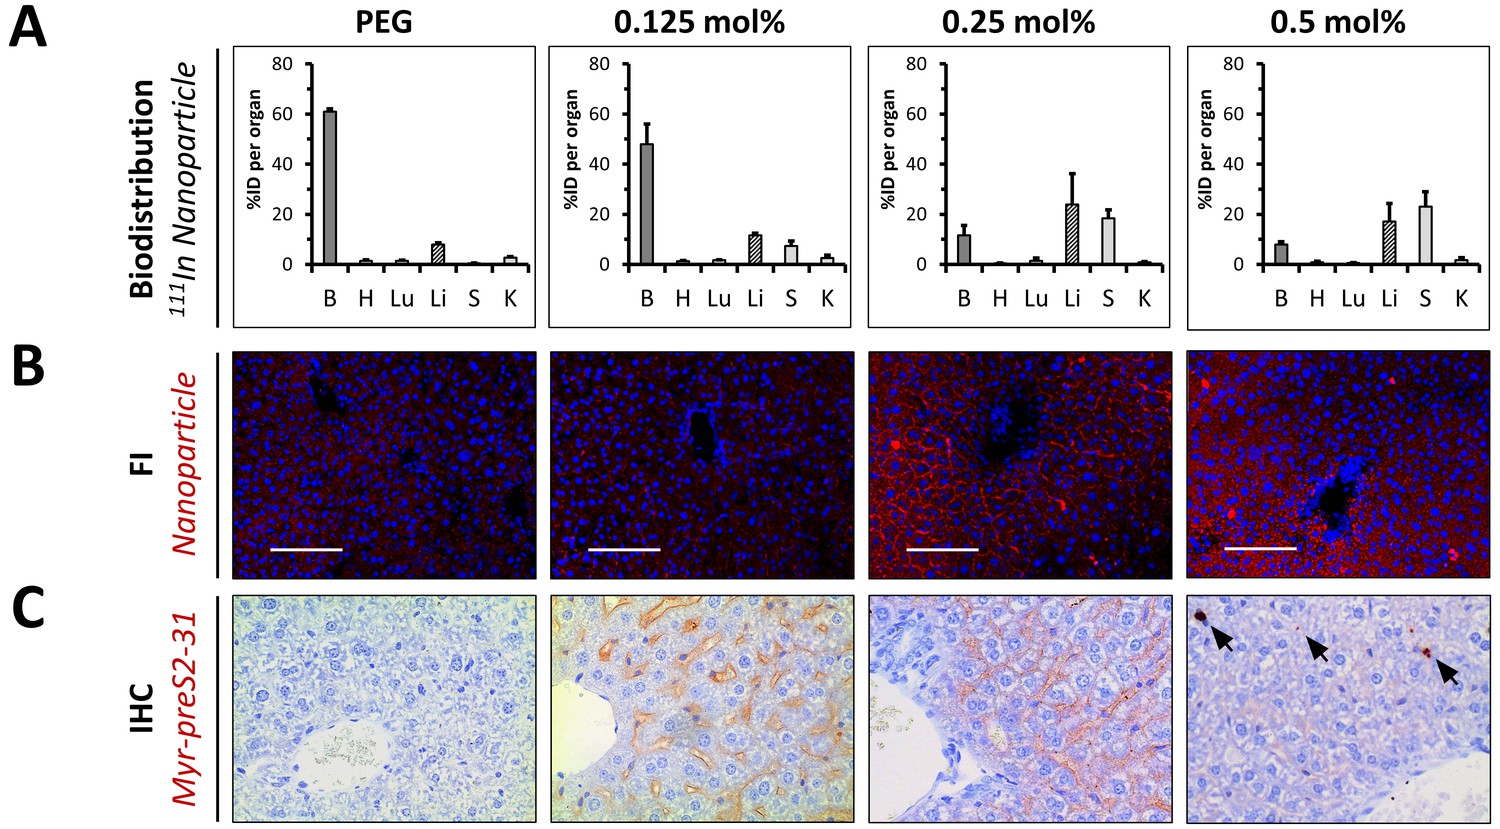
In vivo biodistribution and liver targeting of Myr-preS2-31 conjugated nanoparticles in mice.
Nanoparticles were modified with different amounts of Myr-preS2-31 and labeled with radioactive 111In and fluorescent membrane dye (DiI, red signal). (A) Quantitative biodistribution studies were performed 1 h post injection. Radioactivity of each organ was determined with a γ-counter and the percentage of injected dose (%ID) per organ was calculated. B = blood, H = heart, Lu = lung, Li = liver, S = spleen, K = kidney. All values are shown as mean ± SD of biological replicates (n = 4 independent experiments). Numerical data for all graphs are shown in Figure 5—source data 1. (B) Fluorescence imaging (FI) of nanoparticles (DiI, red signal) in liver cryo-sections. Blue signal: Hoechst stain of cell nuclei. Scale bar = 100 µm. (C) Immunohistochemistry (IHC) of Myr-preS2-31 (red signal) in the liver sections 1 h after intravenous injection. Mice liver sections were stained with anti-Myr-preS2-31 antibody (MA18/7). Blue signals represent cell nuclei. Arrows indicate distinct localized accumulations.
-
Figure 5—source data 1
Biodistribution in mice.
- https://doi.org/10.7554/eLife.42276.036
Figure 5—figure supplement 1
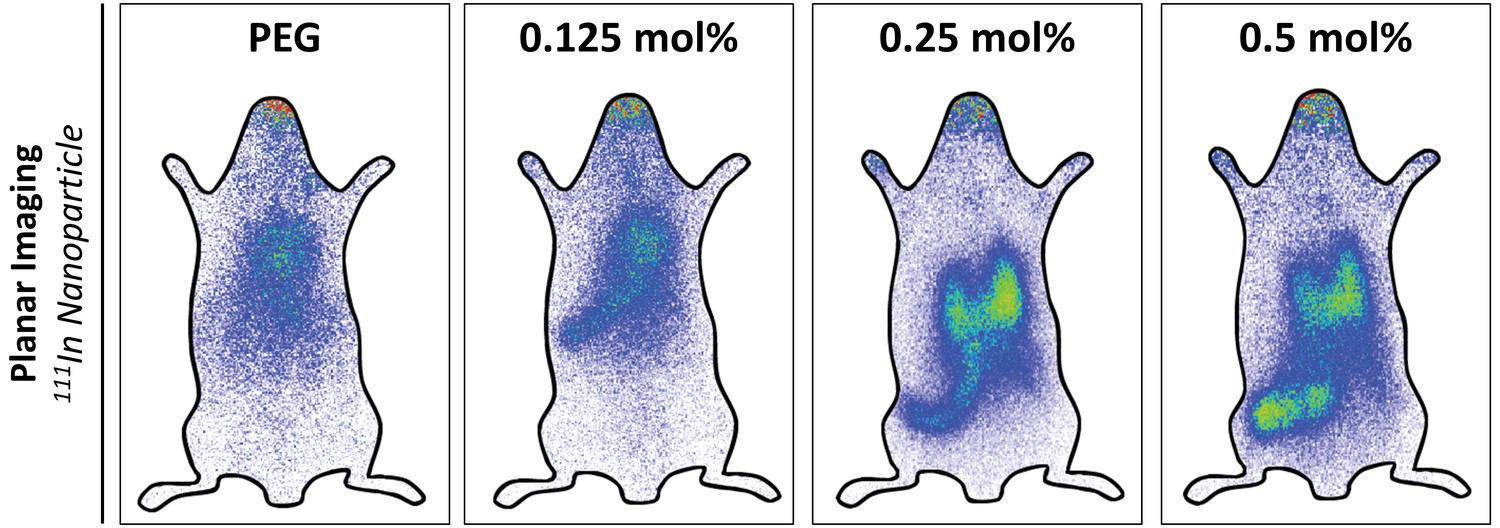
In vivo biodistribution and liver targeting of Myr-preS2-31 conjugated nanoparticles in mice.
Nanoparticles were modified with different amounts of Myr-preS2-31. Static planar imaging of mice in prone position 15 min after intravenous injection of different 111In labeled nanoparticles with approximately 8 MBq. Increase in Myr-preS2-31 modification (≥0.25 mol%) resulted in dominant location of radioactivity in a bilobed structure in the abdominal cavity with an enhanced intensity in the right lobe indicating the liver. In addition, nanoparticles with increased Myr-preS2-31 modification accumulated in an elongated structure in the far-left part of the abdomen under the liver, which is the spleen. For tissue identification and signal quantification see Figure 5A and Figure 5—figure supplements 2 and 3).
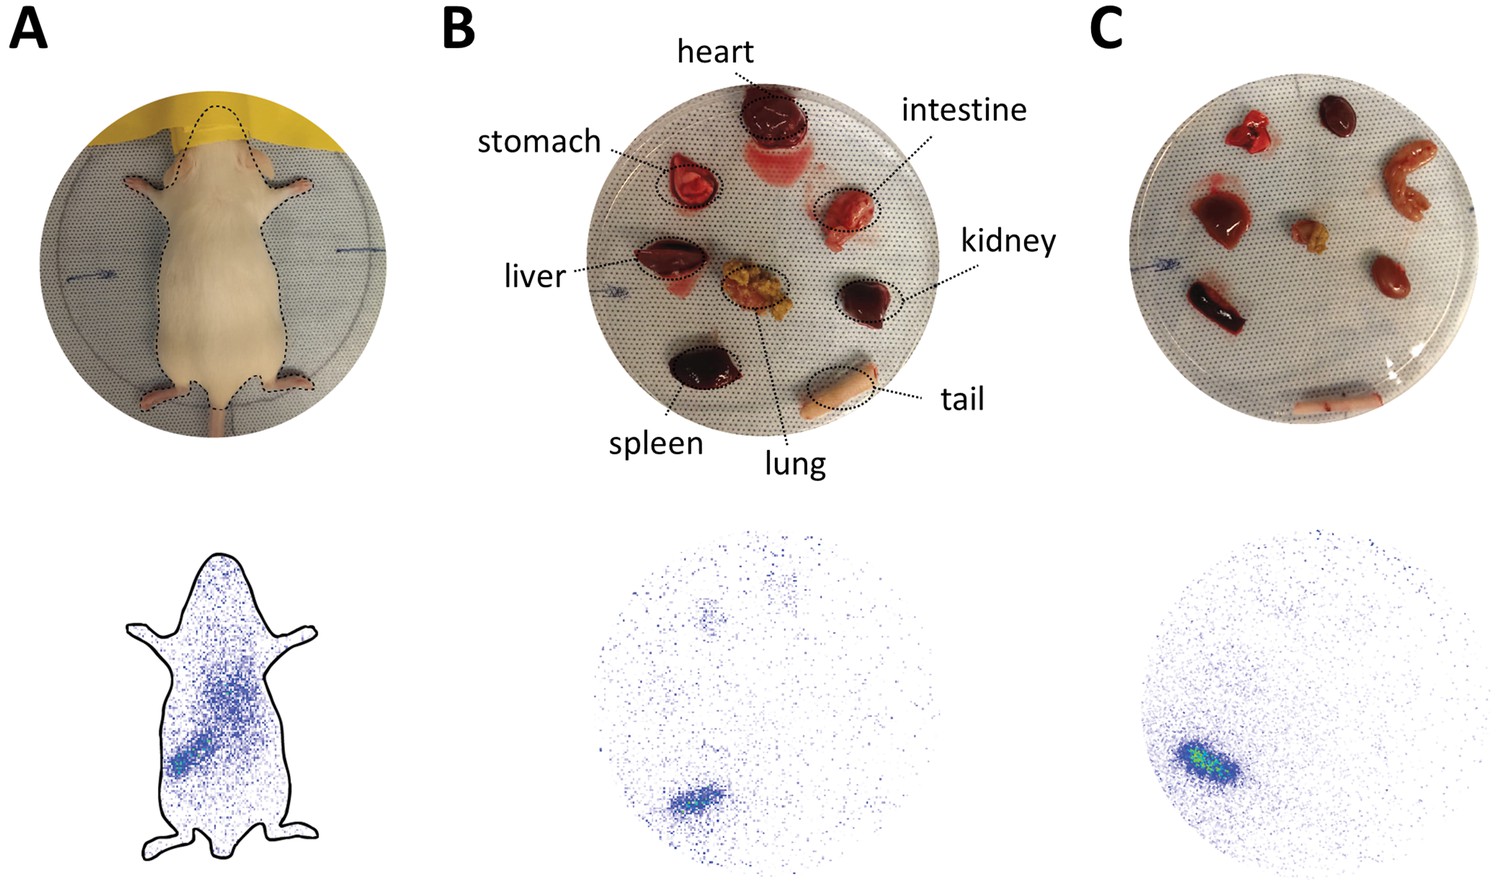
Figure 5—figure supplement 2
In vivo biodistribution and ex vivo organ distribution of PEGylated nanoparticles in mice.
(A) Static planar imaging of mice in prone position 15 min after intravenous injection of different 111In labeled nanoparticles. Planar ex vivo imaging of harvested organs from mice (B) 15 min and (C) 60 min post injection.
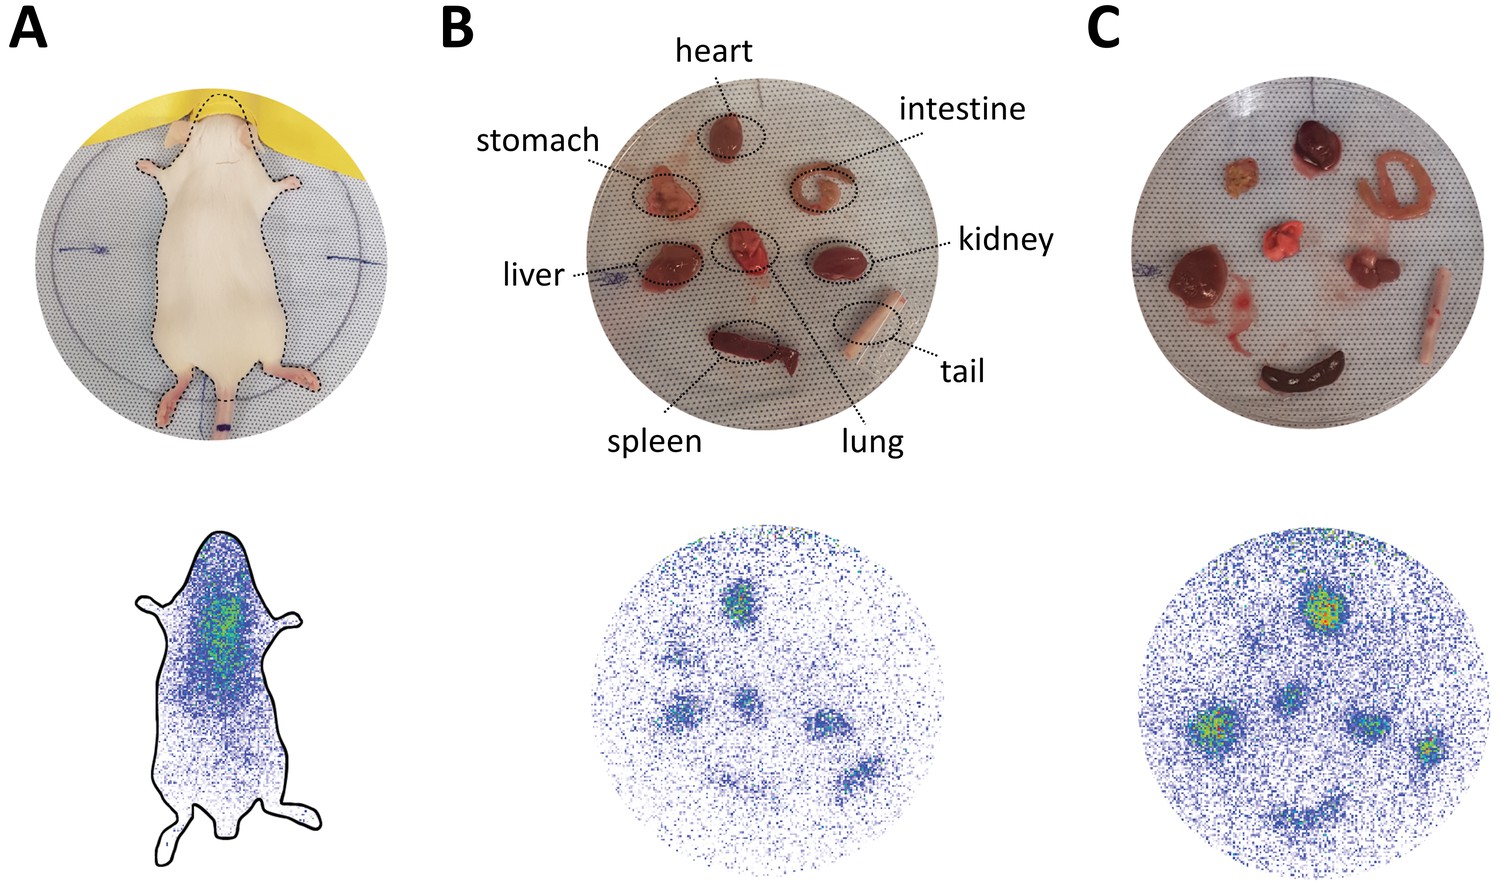
Figure 5—figure supplement 3
In vivo biodistribution and ex vivo organ distribution of nanoparticles with elevated Myr-preS2-31 modification.
(A) Static planar imaging of mice in prone position 15 min after intravenous injection of different 111In labeled nanoparticles. Planar ex vivo imaging of harvested organs from mice (B) 15 min and (C) 60 min post injection.
Figure 5—figure supplement 4
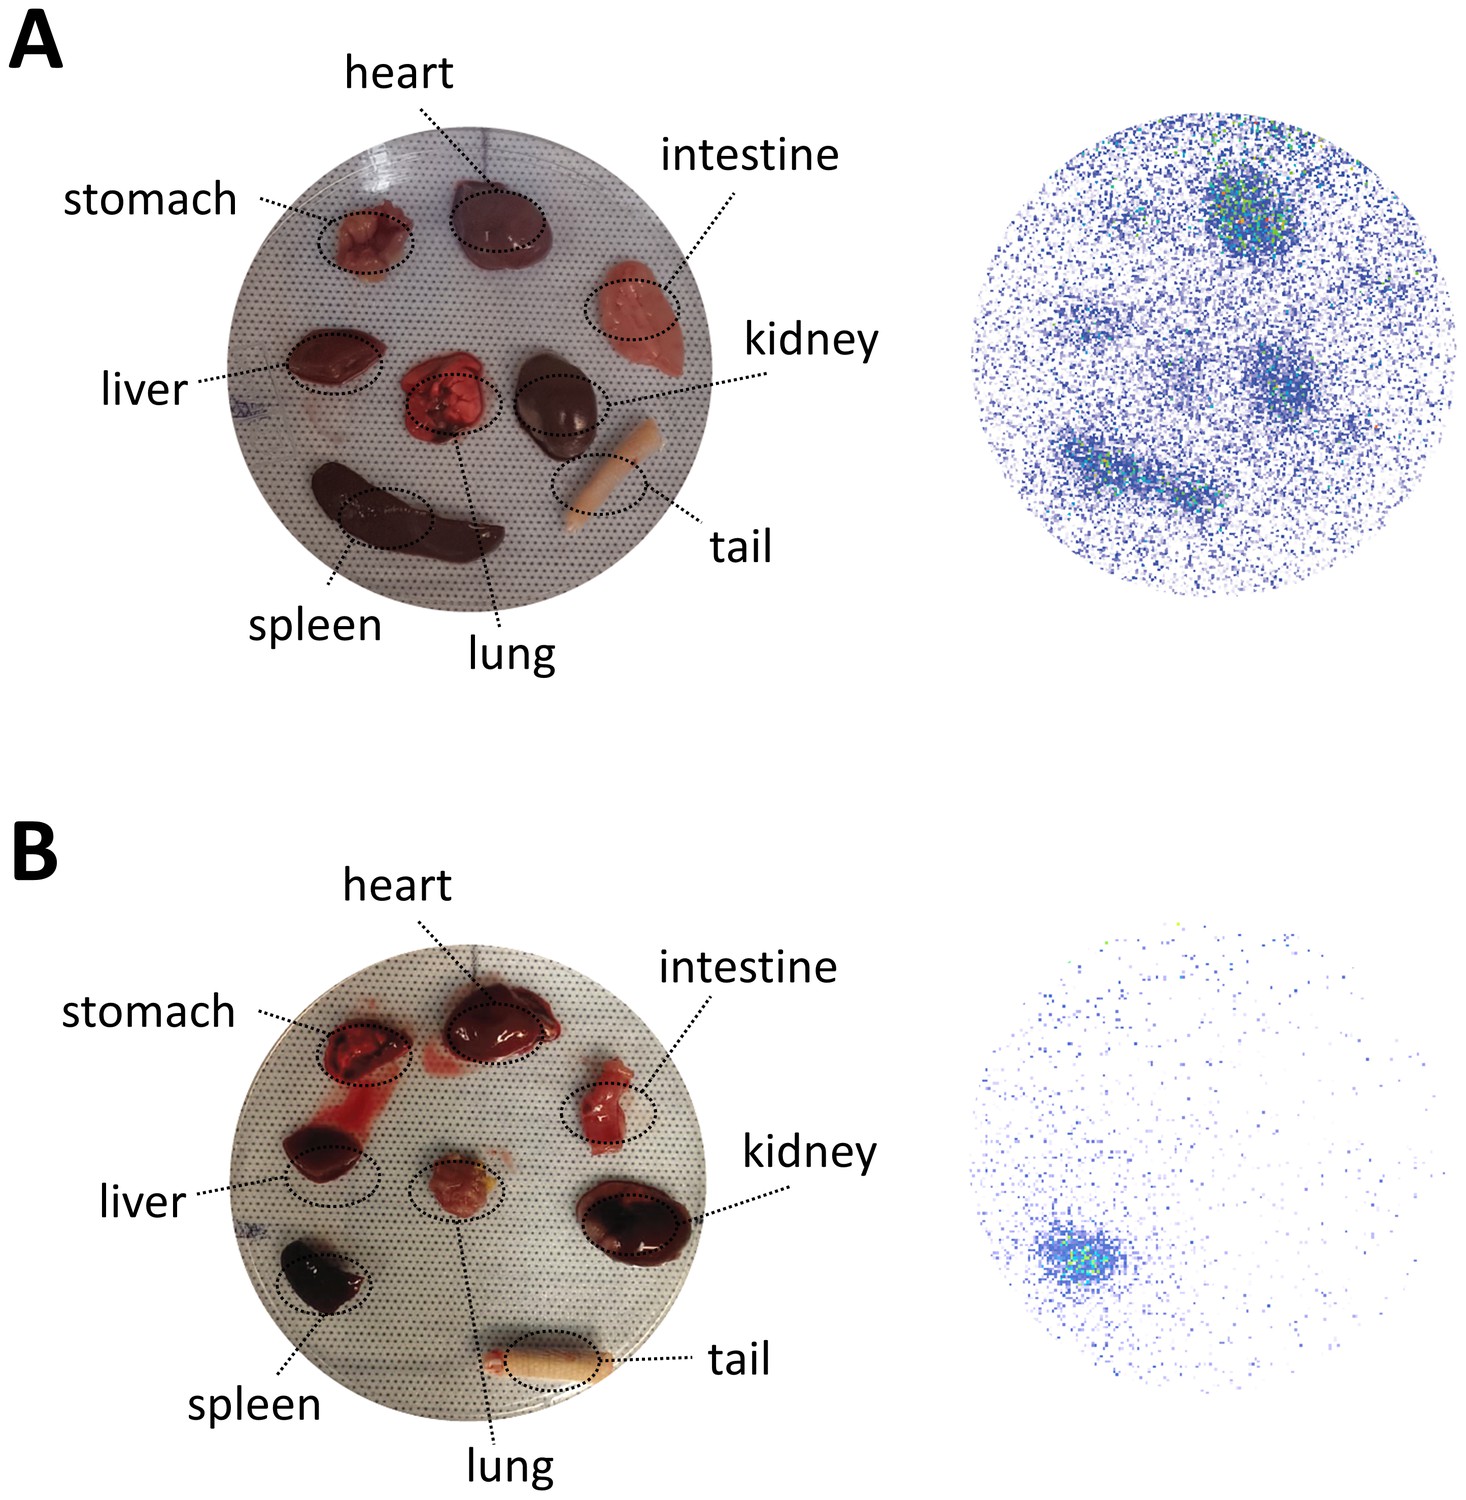
Organ biodistribution of different nanoparticles in rats.
Planar ex vivo imaging of harvested organs from rats injected with (A) PEGylated nanoparticles or (B) nanoparticles with elevated Myr-preS2-31 modification was performed 60 min post injection.
Figure 5—figure supplement 5
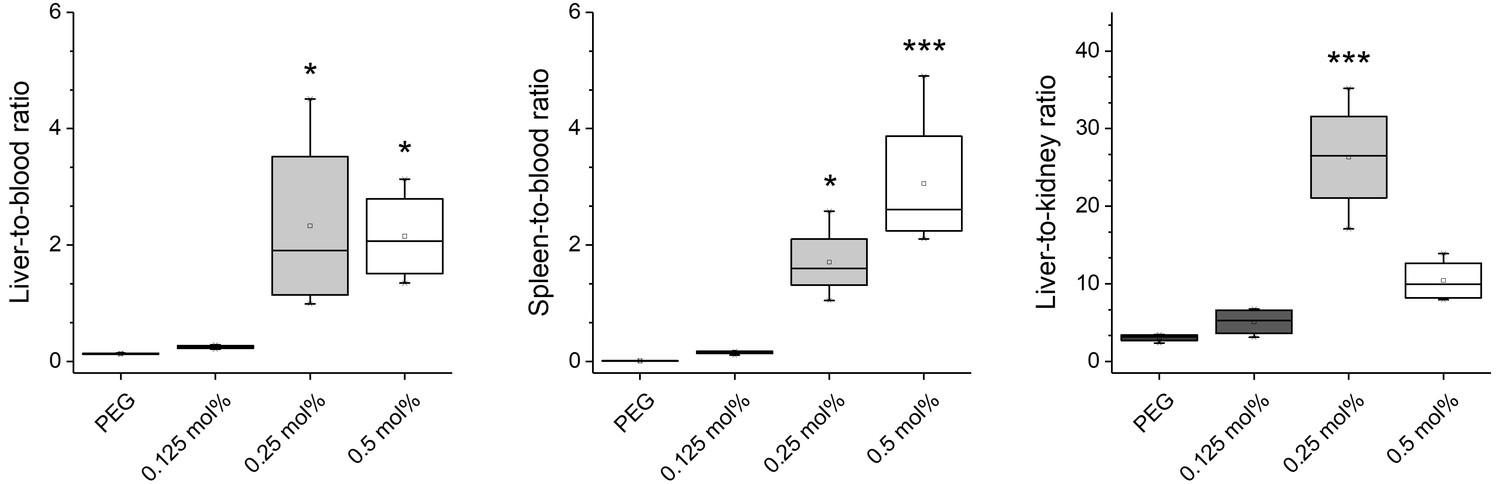
Organ ratios of ex vivo biodistribution analysis in mice.
Nanoparticles were modified with different amounts of Myr-preS2-31 and labeled with radioactive 111In. Quantitative biodistribution studies were performed 1 h post injection. Radioactivity of each organ was determined with a γ-counter. Ratios of injected dose (%ID) per organ between the blood pool level and selected organs, that is liver (i.e. target organ), spleen (i.e. clearance organ), and kidney (i.e. control organ since nanoparticle bound 111In should not show renal excretion) were calculated. All values are shown as box plots of biological replicates (n = 3 independent experiments). *p<0.05, **p<0.01, ***p<0.001.
Figure 5—figure supplement 6
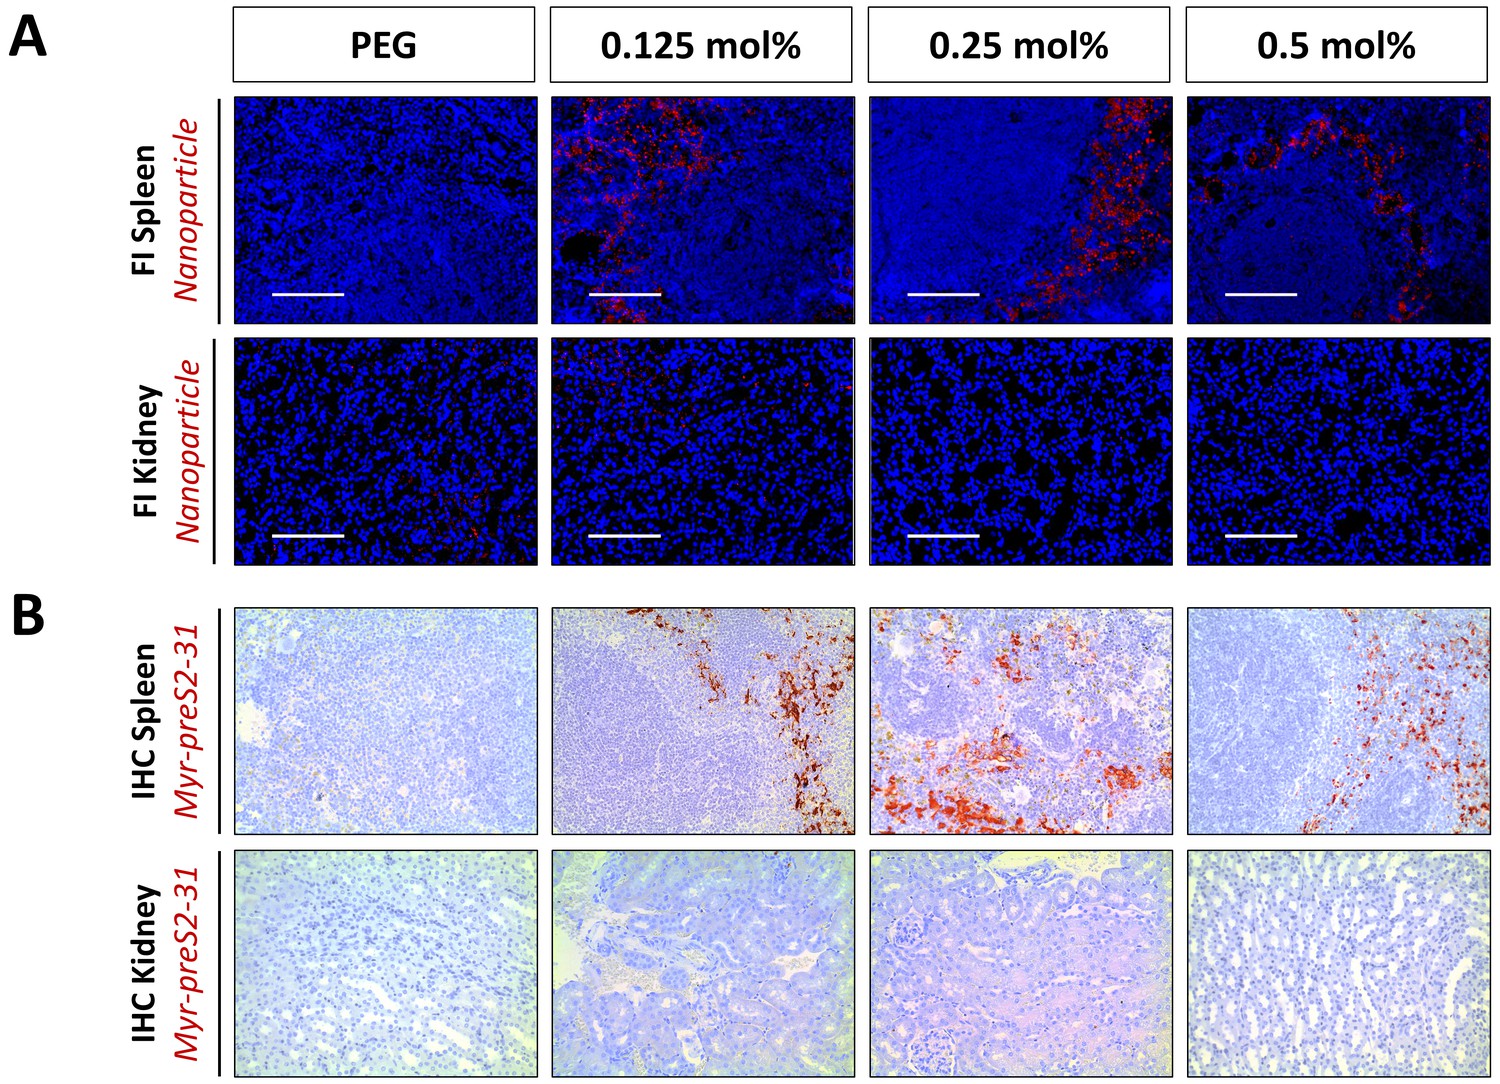
Intra-organ distribution of Myr-preS2-31-modified nanoparticles in spleen and kidney in vivo in mice dependent on ligand density.
(A) Fluorescence imaging (FI) of liposomes (DiI, red signal) in spleen and kidney cryo-sections. Blue signal: Hoechst stain of cell nuclei. Scale bar = 100 µm. (B) Immunohistochemistry (IHC) of Myr-preS2-31 distribution (red signal) in spleen and kidney. Tissue sections from mice were stained with anti-Myr-preS2-31 antibody (MA18/7). Blue signals represent cell nuclei.
Figure 5—figure supplement 7
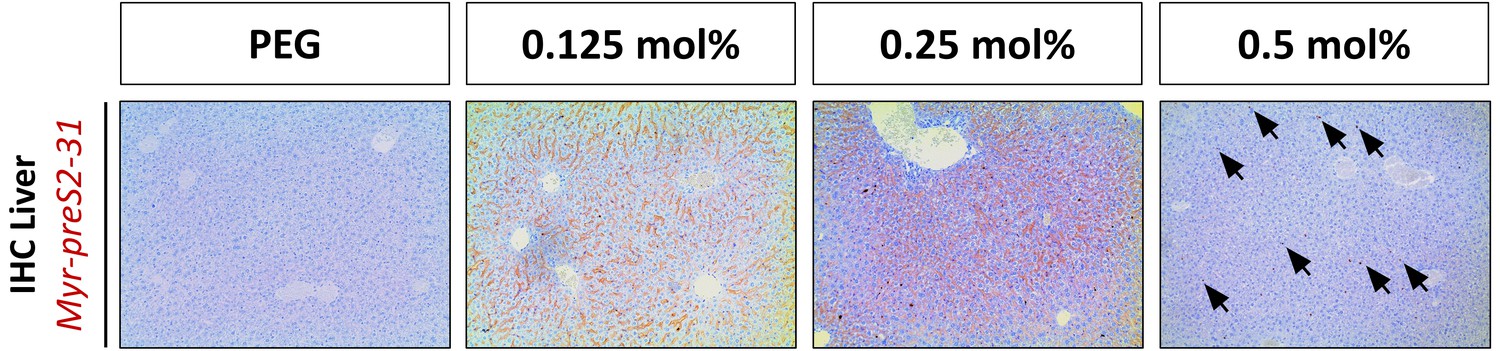
Liver targeting of Myr-preS2-31 conjugated nanoparticles in mice.
Representative low magnification images of immunohistochemistry (IHC) of Myr-preS2-31 (red signal) in liver sections 1 h after intravenous injection. Mice liver sections were stained with anti-Myr-preS2-31 antibody (MA18/7). Blue signals represent cell nuclei. Arrows indicate distinct localized accumulations.
Figure 5—figure supplement 8
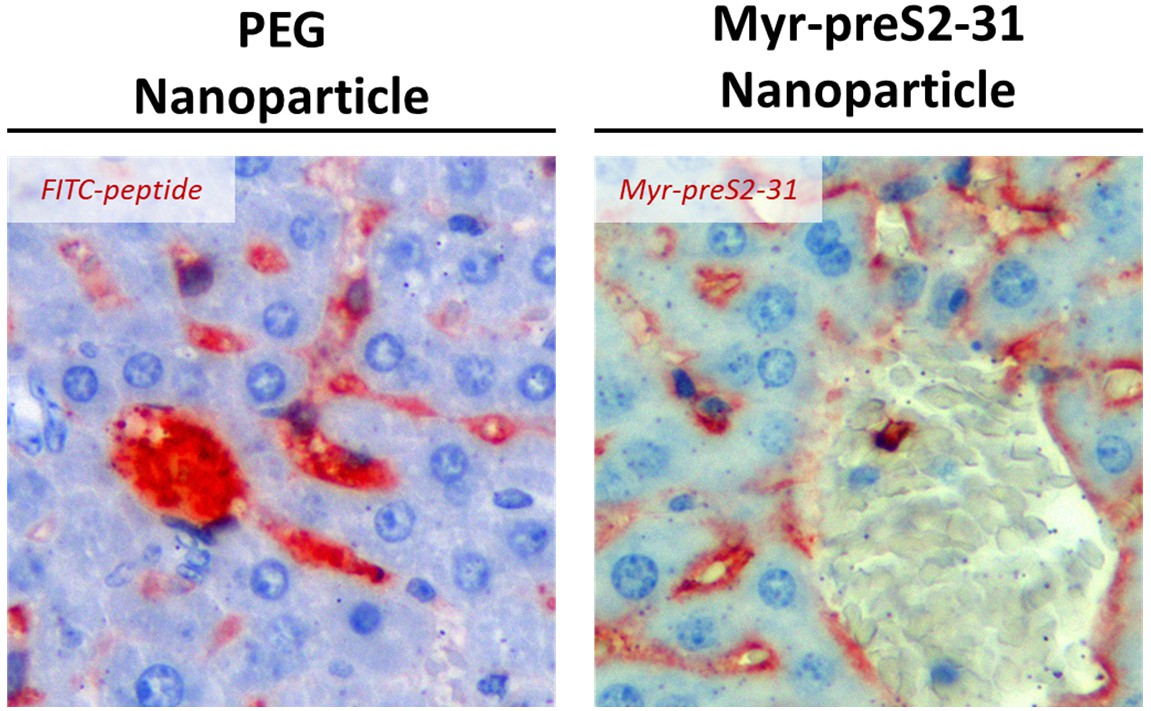
Specific binding of Myr-preS2-31 conjugated nanoparticles to sinusoidal membrane of hepatocytes.
Immunohistochemistry of FITC-payload (PEG nanoparticles) or Myr-preS2-31 (nanoparticles modified with 0.25 mol% Myr-preS2-31) in the liver sections 1 h after intravenous injection (red signals). Mice liver sections were stained with anti-FITC antibody or anti-Myr-preS2-31 antibody (MA18/7), respectively. Blue signals represent cell nuclei.
Figure 5—figure supplement 9
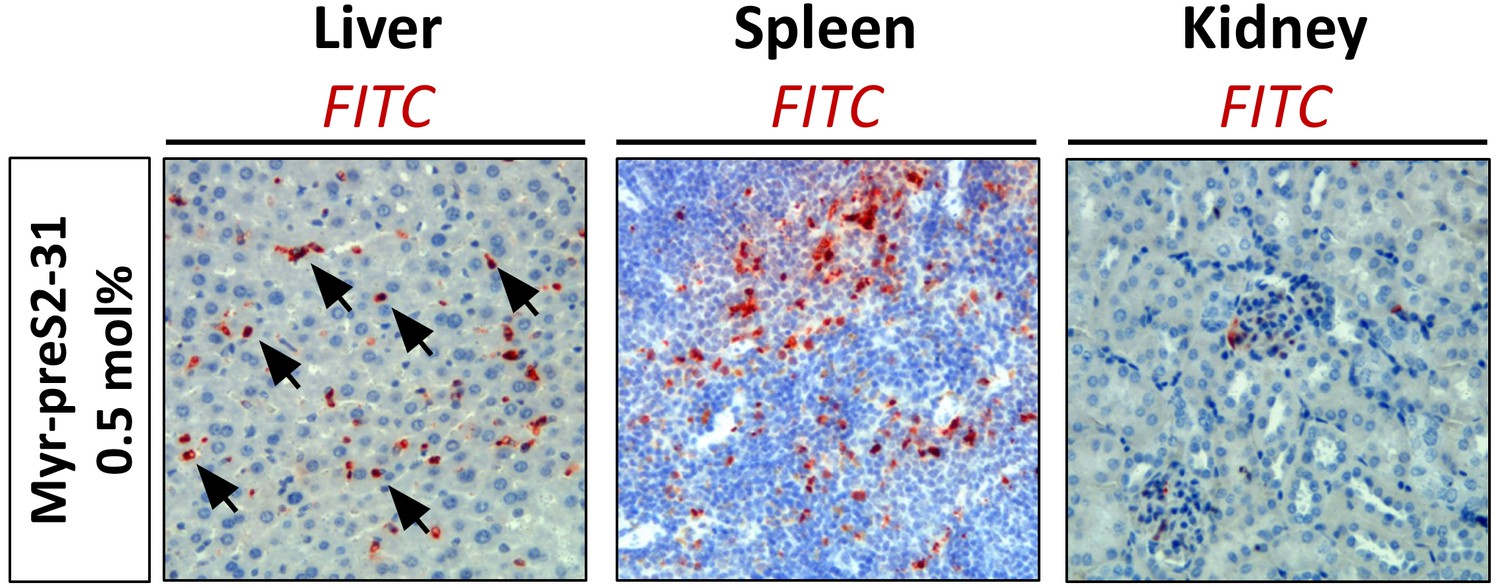
Biodistribution of nanoparticles modified with 0.5 mol% Myr-preS2-31 in mice.
Immunohistochemistry of nanoparticles` FITC payload (red signal) in the liver, spleen, kidney sections 1 h after intravenous injection. Tissue sections were stained with anti-FITC antibody. Blue signals represent cell nuclei. Arrows indicate distinct localized accumulations.
Figure 6
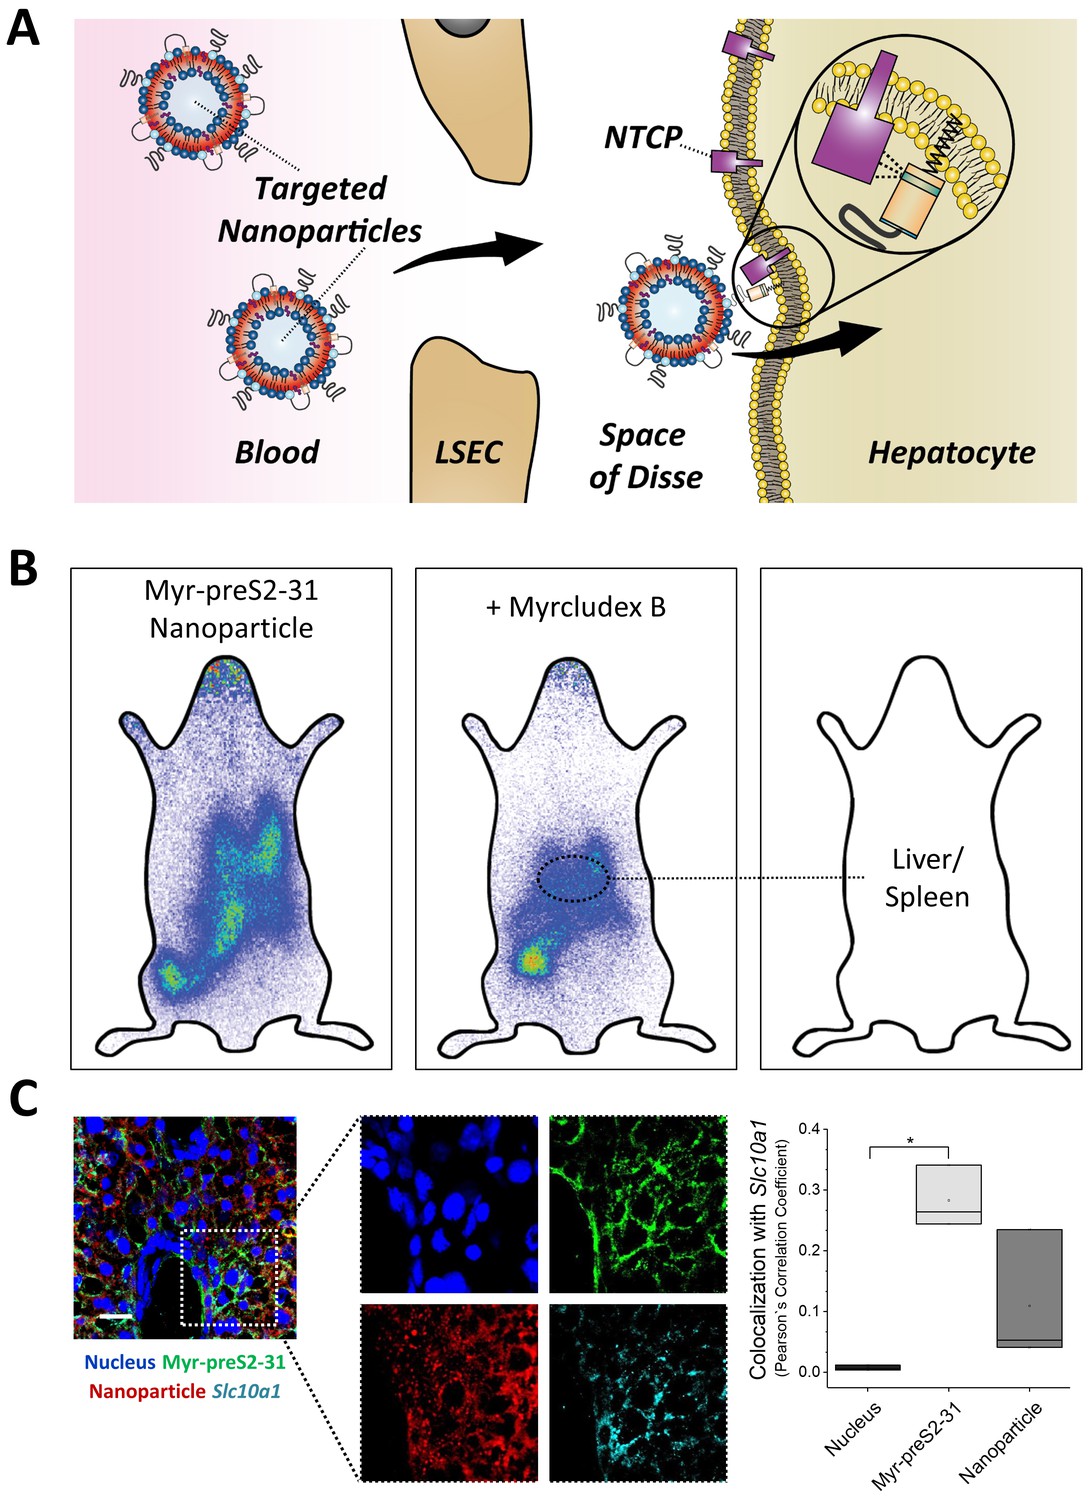
NTCP-specific uptake of Myr-preS2-31 conjugated nanoparticles into hepatocytes in vivo in mice.
(A) Schematic representation of NTCP-targeted nanoparticle binding to hepatocytes. Circulating nanoparticles pass the fenestrae of liver sinusoidal endothelial cells (LSEC) and subsequently bind to the NTCP in the basolateral membrane of hepatocytes facing the space of Disse. Prior to Myr-preS2-31 mediated NTCP binding, the myristoyl chain is inserted into the lipid bilayer. In close proximity to hepatocytes, acyl chain switches into cellular membrane due to high affinity of essential peptide sequence to NTCP binding site, thereby consolidating target transporter binding. (B) Nanoparticles were modified with 0.25 mol% of Myr-preS2-31 and labeled with radioactive 111In and fluorescent membrane dye (DiI, red signal). Planar imaging of mice 1 h post-injection. Competitive inhibition of liver binding by co-injection of free Myrcludex B clearly demonstrates NTCP-specific binding. Positions of liver and spleen are indicated by small circles. (C) Immunofluorescence staining of nanoparticles (red signal), targeting ligand (Myr-preS2-31, green signal, antibody staining), and Slc10a1 (cyan signal, antibody staining) in liver cryosections. Nuclei staining (blue signal) served as control for complete internalization; no overlap with Slc10a1. Scale bar = 20 µm. Colocalization analysis with Slc10a1 is represented by Pearson´s Correlation Coefficient (PCC). All values are shown as box plots of biological replicates (n = 3 independent experiments). *p<0.05. Numerical data for all graphs are shown in Figure 6—source data 1.
-
Figure 6—source data 1
Internalization into hepatocytes.
- https://doi.org/10.7554/eLife.42276.038
Tables
Table 1
Physicochemical characteristics of nanoparticles with different surface modifications.
Hydrodynamic size [nm], polydispersity index (PDI), and zeta potential [mV] were analyzed using dynamic and electrophoretic light scattering. All values are shown as mean ± SD of n ≥ 3 independent experiments. Numerical data for all nanoparticles are shown in Table 1—source data 1..
| Surface modification | Size [nm] ± SD | PDI ± SD | Zeta potential [mV] ± SD |
|---|---|---|---|
| PEG | 88.53 ± 5.89 | 0.05 ± 0.01 | −5.93 ± 0.63 |
| preS2-48 | 90.74 ± 5.83 | 0.06 ± 0.02 | −3.34 ± 1.38 |
| Myr-preS2-48 A | 90.77 ± 4.98 | 0.06 ± 0.04 | −13.35 ± 3.08 |
| Myr-preS2-31 | 89.10 ± 4.38 | 0.10 ± 0.02 | −9.82 ± 0.87 |
| Cap-preS2-48 | 134.28 ± 36.23 | 0.24 ± 0.04 | −8.39 ± 1.13 |
| Myr-preS2-48 | 92.21 ± 6.78 | 0.12 ± 0.08 | −10.70 ± 4.25 |
-
Table 1—source data 1
Physicochemical characterization of nanoparticles.
- https://doi.org/10.7554/eLife.42276.014
Key resources table
| Reagent type (species) or resource | Designation | Source or reference | Identifiers | Additional information |
|---|---|---|---|---|
| Cell line (H. sapiens) | HepG2 WT | DOI: 10.1111/hepr.12599 | RRID:CVCL_0027 | Cell depository of the Institute of Pathology (University Hospital of Basel, Switzerland) |
| Cell line (H. sapiens) | HepG2 SLC10A1 | DOI: 10.1053/j.gastro.2013.12.024 | RRID:CVCL_JY40 | Prof. Dr. Stephan Urban (University Hospital Heidelberg) |
| Cell line (H. sapiens) | HuH7 WT | DOI: 10.1111/hepr.12599 | RRID:CVCL_0336 | RIKEN Cell Bank (Ibaraki, Japan) |
| Cell line (H. sapiens) | HuH7 SLC10A1 | DOI: 10.1053/j.gastro.2013.12.024 | Prof. Dr. Stephan Urban (University Hospital Heidelberg) | |
| Cell line (H. sapiens) | HeLa WT | - | RRID:CVCL_0030 | Prof. Dr. Jörg Huwyler (University of Basel) |
| Cell line (H. sapiens) | HEK293-GFP | DOI: 10.1021/acsami.5b01684 | Prof. Dr. Jörg Huwyler (University of Basel) | |
| Cell line (Cricetulus griseus) | CHO | DOI: 10.1021/bi702258z | RRID:CVCL_0214 | Prof. Dr. Joachim Seelig (University of Basel) |
| Cell line (Cricetulus griseus) | psgA745 | DOI: 10.1021/bi702258z | Prof. Dr. Joachim Seelig (University of Basel) | |
| Genetic reagent (Danio rerio) | kdrl:EGFPs843 zebrafish | DOI: 10.1016/j.jconrel.2017.08.023 | https://zfin.org/ZDB-TGCONSTRCT-070117-47 | Prof. Dr. Markus Affolter (University of Basel) |
| Antibody | anti-Myr-preS2-31 antibody (MA18/7) | - | - | Prof. Dr. Wolfram Gerlich (Justus-Liebig-Universität Gießen); monoclonal human, 1:100 dilution |
| Antibody | anti-Slc10a1 (anti-Ntcp) | - | - | Prof. Bruno Stieger (University of Zurich); polyclonal rabbit, 1:100 dilution |
| Antibody | anti-FITC antibody | Invitrogen - ThermoFisher Scientific | Catalog # 71–1900 | polyclonal rabbit, 1:100 dilution |
| Software | OriginPro 9.1 software | - | RRID:SCR_014212 | OriginLab Corporation |
| Software | FlowJo VX software | - | RRID:SCR_008520 | TreeStar |
| Software | ImageJ Fiji | - | RRID:SCR_002285 | ImageJ |
Additional files
-
Transparent reporting form
- https://doi.org/10.7554/eLife.42276.039
Download links
A two-part list of links to download the article, or parts of the article, in various formats.
Downloads (link to download the article as PDF)
Open citations (links to open the citations from this article in various online reference manager services)
Cite this article (links to download the citations from this article in formats compatible with various reference manager tools)
Optimization-by-design of hepatotropic lipid nanoparticles targeting the sodium-taurocholate cotransporting polypeptide
eLife 8:e42276.
https://doi.org/10.7554/eLife.42276


