A Gs-coupled purinergic receptor boosts Ca2+ influx and vascular contractility during diabetic hyperglycemia
- University of California, Davis, United States
- University of Louisville, United States
- Sasse Surgical Associates, United States
- University of Nevada, United States
- VA Northern California Healthcare System, United States
Abstract
Elevated glucose increases vascular reactivity by promoting L-type CaV1.2 channel (LTCC) activity by protein kinase A (PKA). Yet, how glucose activates PKA is unknown. We hypothesized that a Gs-coupled P2Y receptor is an upstream activator of PKA mediating LTCC potentiation during diabetic hyperglycemia. Experiments in apyrase-treated cells suggested involvement of a P2Y receptor underlying the glucose effects on LTTCs. Using human tissue, expression for P2Y11, the only Gs-coupled P2Y receptor, was detected in nanometer proximity to CaV1.2 and PKA. FRET-based experiments revealed that the selective P2Y11 agonist NF546 and elevated glucose stimulate cAMP production resulting in enhanced PKA-dependent LTCC activity. These changes were blocked by the selective P2Y11 inhibitor NF340. Comparable results were observed in mouse tissue, suggesting that a P2Y11-like receptor is mediating the glucose response in these cells. These findings established a key role for P2Y11 in regulating PKA-dependent LTCC function and vascular reactivity during diabetic hyperglycemia.
https://doi.org/10.7554/eLife.42214.001Introduction
Diabetes is a major risk factor contributing to cardiovascular complications, including hypertension, increased risk of stroke, coronary disease, and organ failure (Whelton et al., 2018). These complications are often linked to the effects of elevated extracellular glucose (e.g. hyperglycemia - the hallmark metabolic abnormality in diabetes) on vascular function (Brown et al., 2010; Cooper et al., 2001; Tousoulis et al., 2013). In addition to endothelium-dependent alterations (Lagaud et al., 2001; Sena et al., 2013), endothelium-independent modifications, including enhanced contractility of arterial myocytes, are emerging as critical contributing factors to these complications (Aronson, 2008; DeFronzo et al., 2013; Fleischhacker et al., 1999; Montero et al., 2013; Nieves-Cintrón et al., 2018). Consistent with this notion, we and others recently demonstrated augmented vasoconstriction in response to acute and chronic elevations in extracellular glucose that were independent of endothelial function (Fleischhacker et al., 1999; Jackson et al., 2016; Nystoriak et al., 2017). We linked these glucose-mediated effects on vascular reactivity to an increase in L-type CaV1.2 channel (LTCC) activity in human and murine arterial myocytes (Navedo et al., 2010b; Nystoriak et al., 2017). This is critical, as Ca2+ influx via LTCCs is the main Ca2+ entry pathway in these cells and determines muscle contractility and arterial diameter (Knot and Nelson, 1998). Unexpectedly, we found that glucose-mediated potentiation of LTCCs involves phosphorylation of CaV1.2 at serine 1928 (Ser1928) by protein kinase A (PKA) (Morotti et al., 2017; Navedo et al., 2010b; Nystoriak et al., 2017). Yet, how glucose leads to PKA activation is unknown.
Elevations in cellular glucose have been shown to trigger autocrine release of nucleotides (e.g. ATP, UTP) into the extracellular space of many cells, including arterial myocytes (Costa et al., 2009; Hazama et al., 1998; Nilsson et al., 2006; Parodi et al., 2002). These extracellular nucleotides can then act on G protein-coupled P2Y receptors to induce a plethora of cellular responses (von Kügelgen and Harden, 2011). Previous studies demonstrated that elevations in extracellular glucose led to increases in intracellular Ca2+ ([Ca2+]i) in isolated arterial myocytes (Nilsson et al., 2006). Indeed, this glucose-mediated response was associated with enhanced autocrine release of nucleotides engaging P2Y receptors, but the contributing mechanisms as well as the identity of the P2Y receptor involved are unclear.
Eight functionally diverse G protein-coupled P2Y receptors have been identified (von Kügelgen and Harden, 2011). Most of these P2Y receptors are coupled to Gq/i proteins. Conversely, P2Y11 is the only P2Y receptor that is coupled to Gs (Communi et al., 1997; Kennedy, 2017; Schuchardt et al., 2012; von Kügelgen and Harden, 2011). Activation of this receptor could then activate adenylyl cyclase (AC) and PKA to underlie the glucose-induced effects on LTCC activity, but its role in arterial myocytes is unclear. P2Y11 receptors were first cloned from human tissue and subsequently identified in other species (Kennedy, 2017; von Kügelgen and Harden, 2011). Although the P2Y11 gene has not been found at the expected position in the mouse genome, recent rodent annotations related to this gene (e.g. XM_008766009.2 and XM_0130655917.2), as well as studies defining a functional role based on pharmacological data obtained from rat and mouse tissue hinted at the presence of at least a P2Y11-like receptor in mice (Kennedy, 2017). We, therefore, undertook a comprehensive approach to investigate whether upstream engagement of this Gs-coupled P2Y receptor is implicated in PKA activation leading to increased Ser1928 phosphorylation of vascular CaV1.2 that results in potentiation of LTCC activity during diabetic hyperglycemia. Accordingly, Western blot analysis, immunofluorescence confocal microscopy, Ground State Depletion (GSD) super-resolution nanoscopy, FRET-based cAMP imaging and voltage-clamp electrophysiology confirmed functional expression of P2Y11 in human arterial myocytes. We found that elevated glucose stimulates cAMP synthesis with the same magnitude as that observed upon application of the selective P2Y11 agonist NF546 or when both stimuli were given simultaneously, thus suggesting that glucose and NF546 signaling proceed through the same pathway. Nanometer proximity was observed between P2Y11 and PKA and P2Y11 and CaV1.2 at the sarcolemma of arterial myocytes, which facilitates a structural arrangement that may be essential for glucose effects on LTCC activity. Indeed, the NF546/glucose-induced cAMP signal resulted in enhanced Ser1928 phosphorylation and LTCC activity in human arterial myocytes, and these changes were prevented by the selective P2Y11 inhibitor NF340. Intriguingly, comparable functional data were observed in mouse arterial myocytes, suggesting that a P2Y11-like receptor could be mediating the glucose response in these cells that results in vasoconstriction (Kennedy, 2017). Thus, our data in human and murine tissue indicate a key role for a Gs-coupled P2Y receptor, which fits the distribution, pharmacological, and signaling profile of a P2Y11 or P2Y11-like receptor, respectively, as an upstream player in the regulation of LTCCs and vascular reactivity during diabetic hyperglycemia. These findings may have important clinical and therapeutic implications as they may point to P2Y11 as a potential target for treating diabetic vascular complications.
Results
Glucose-induced extracellular nucleotide release mediates Ser1928 phosphorylation, increased LTCC activity and vasoconstriction
In our first series of experiments, we pressurized (60 mmHg) mouse cerebral arteries to develop stable and spontaneous tone (Supplementary file 1 and 2). When increasing extracellular glucose from 10 mM to 20 mM D-glucose, there was a significant constriction (Figure 1A and Supplementary file 1 and 2), which is consistent with previous reports by our group and others (Jackson et al., 2016; Nystoriak et al., 2017). These extracellular D-glucose concentrations are used because they are within the range of observed nonfasting glucose levels in nondiabetic and diabetic mouse models (Lagaud et al., 2001; Moien-Afshari et al., 2008; Navedo et al., 2010b; Nieves-Cintrón et al., 2015; Nystoriak et al., 2014; Nystoriak et al., 2017). Considering that elevating glucose in the external milieu may trigger autocrine release of nucleotides (Costa et al., 2009; Hazama et al., 1998; Nilsson et al., 2006; Parodi et al., 2002), we investigated whether hydrolysis of extracellular nucleotides would ablate glucose-mediated vasoconstriction. For these experiments, pressurized arteries (60 mmHg) were pre-treated with the ectonucleotidase apyrase (0.32 U/mL) in a 10 mM D-glucose solution for 10 min. Apyrase-treated arteries failed to constrict to 20 mM D-glucose (Figure 1A and Supplementary file 2). Vasoconstriction in response to 60 mM potassium (K+) in which the membrane potential closely follows the equilibrium potential for K+ (~−20 mV) (Knot and Nelson, 1998), was similar in control and apyrase-treated arteries (Figure 1—figure supplement 1A and Supplementary file 1 and 2). These results suggest that differences in glucose-induced vasoconstriction were not due to an inability of apyrase-treated arteries to respond to 20 mM D-glucose. Furthermore, the glucose-induced constriction was not attributed to changes in osmolarity as treatment with equimolar concentrations of the nonpermeable mannitol (20 mM = 10 mM D-glucose +10 mM mannitol) had no effect on vascular reactivity (Figure 1—figure supplement 1B and Supplementary file 1 and 2).
Figure 1 with 2 supplements see all
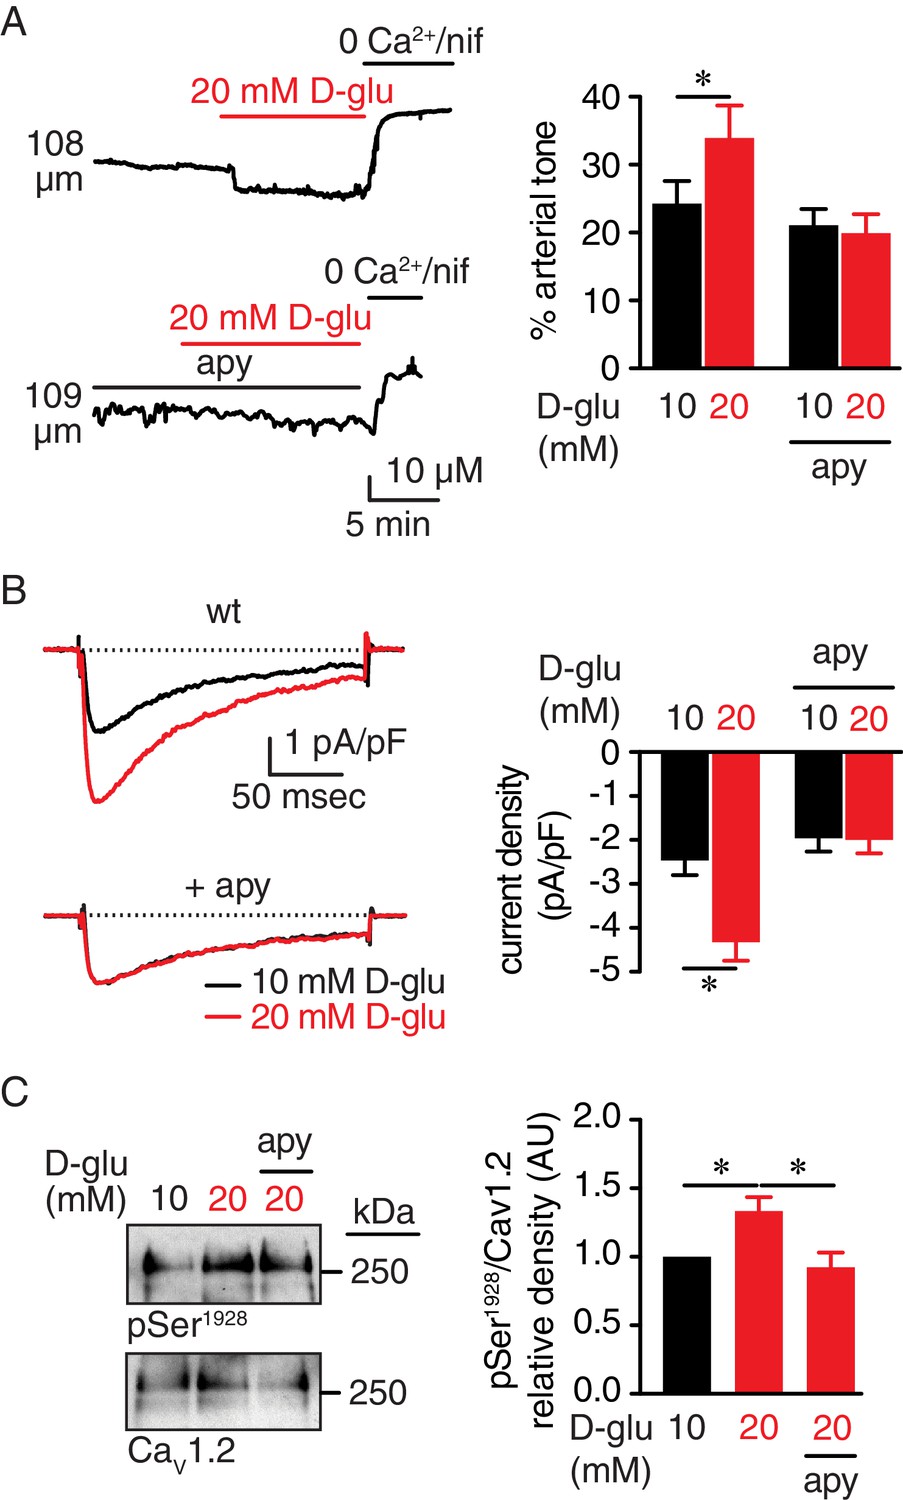
Extracellular nucleotides promote vasoconstriction, CaV1.2 activity and Ser1928 phosphorylation in response to 20 mM D-glucose in murine arterial myocytes.
(A) Representative diameter recordings and summary arterial tone data from pressurized (60 mmHg) wt mouse cerebral arteries before and after application of 20 mM D-glucose in the absence (n = 6 arteries from six mice) and presence (n = 6 arteries from six mice) of apyrase (apy; 0.32 U/ml; *p<0.05, Wilcoxon matched pairs test; Figure 1—source data 1). (B) Characteristic IBa recordings from the same cell and summary IBa data from wt mouse cerebral arterial myocytes evoked by step depolarizations from −70 to +10 mV before and after application of 20 mM D-glucose in the absence (n = 11 cells from five mice) and presence of apyrase (n = 9 cells from five mice) (*p<0.05, paired t test; Figure 1—source data 2). (C) Representative immunoblot detection of phosphorylated Ser1928 (pSer1928) and total CaV1.2 from wt mouse cerebral and mesenteric arteries after 10 min incubation with 10 mM or 20 mM D-glucose in the absence and presence of apyrase (n = 10 arterial lysates per condition), and quantification of pSer1928 (AU = arbitrary units) (*p<0.05, Kruskal-Wallis with Dunn’s multiple comparisons; Figure 1—source data 3).
-
Figure 1—source data 1
Excel spreadsheet containing the individual numeric values of % arterial tone analyzed in Figure 1A and corresponding raw diameters.
- https://doi.org/10.7554/eLife.42214.010
-
Figure 1—source data 2
Excel spreadsheet containing the individual numeric values of current density analyzed in Figure 1B.
- https://doi.org/10.7554/eLife.42214.011
-
Figure 1—source data 3
Excel spreadsheet containing the individual numeric values of pSer1928/CaV1.2 relative density analyzed in Figure 1C.
- https://doi.org/10.7554/eLife.42214.012
LTCC activity is critical for vascular reactivity (Knot and Nelson, 1998), and its function is enhanced in response to acute increases in glucose and in diabetes due to increased Ser1928 phosphorylation in the CaV1.2 carboxy terminal (Morotti et al., 2017; Navedo et al., 2010b; Nystoriak et al., 2017). We, thus, examined whether nucleotide degradation with apyrase prevents glucose-mediated increases in LTCC activity and Ser1928 phosphorylation. To assess this, we used patch-clamp electrophysiology in the whole-cell perforated configuration with barium (Ba2+) as the charge carrier, before and after application of nifedipine to determine the nifedipine-sensitive Ba2+ current (IBa) associated with LTCC activity in control and apyrase-treated cerebral arterial myocytes. We found that 20 mM D-glucose significantly enhanced IBa in wild type (wt) control arterial myocytes, but not in apyrase-treated cells (Figure 1B). The glucose effect on LTCC activity was not due to changes in osmolarity as 20 mM mannitol had no impact on IBa (Figure 1—figure supplement 1C).
We next performed Western blot analysis with a specific phospho-antibody against Ser1928 at CaV1.2 and a FP1 antibody for total CaV1.2 detection that have been extensively validated by our group (Buonarati et al., 2017; Davare et al., 1999; Hall et al., 2013; Nystoriak et al., 2017; Patriarchi et al., 2016). Indeed, we have previously shown that the immunoreactivity at 250 kDa of CaV1.2 with the phospho-specific antibody for Ser1928 (but not a phospho-specific antibody for Ser1700) and FP1 are completely eliminated in tissue from S1928A knockin mice (Patriarchi et al., 2016) and conditional CaV1.2 knockout mice (Buonarati et al., 2017), respectively. Data revealed increased phosphorylation of this residue in response to 20 mM D-glucose in control arterial lysates (Figure 1C and Figure 1—figure supplement 1D). However, this response was completely absent in arterial lysates exposed to 20 mM mannitol, thus ruling out any osmolarity effects (Figure 1—figure supplement 1E). Moreover, glucose-induced Ser1928 phosphorylation was hindered in lysates from apyrase-treated arteries (Figure 1C and Figure 1—figure supplement 1D). These results suggest that elevated glucose increases Ser1928 phosphorylation to potentiate LTCC activity through an autocrine mechanism involving secreted nucleotides.
To further test this possibility, LTCC activity was recorded in response to elevated glucose during continuous perfusion or static bath conditions (as above). The rationale for these experiments was to determine whether the wash out of nucleotides with flow can impact the glucose-induced potentiation of LTCCs. We found statistically similar IBa in cells exposed to 10 mM and 20 mM D-glucose under continuous bath perfusion (Figure 1—figure supplement 2). Conversely, IBa was significantly elevated in arterial myocytes exposed to 20 mM D-glucose when the bath perfusion was stopped (e.g. static bath conditions). These results suggest that secreted nucleotides could diffuse away under continuous flow, whereas under static bath conditions, they could accumulate in or around the area of release at the surface membrane of arterial myocytes to induce the optimal activation of the signaling pathway underlying increased LTCC activity in response to elevations in extracellular glucose.
P2Y11 receptors are in close proximity to CaV1.2 and PKAcat in arterial myocytes
Extracellular nucleotides are well-known activators of G-coupled P2Y receptors (von Kügelgen and Harden, 2011). P2Y11 is a Gs-coupled P2Y receptor that could activate PKA (Communi et al., 1997; Kennedy, 2017; Schuchardt et al., 2012; von Kügelgen and Harden, 2011), and this could lead to enhanced Ser1928 phosphorylation, LTCC activity, and vasoconstriction during diabetic hyperglycemia. Using Western blot analysis, we first validated the P2Y11 antibody in tsA-201 cells, which endogenously express P2Y11 (Dreisig and Kornum, 2016), by over-expressing human GFP-tagged P2Y11 and by knocking down the endogenous and over-expressed receptor with specific P2Y11 antisense oligodeoxynucleotides (ODNs) (Figure 2A and B). We subsequently detected an immunoreactive band of the expected molecular weight for P2Y11 (~40 kDa) in lysates from freshly dissected human adipose arteries (Figure 2C and Figure 2—figure supplement 1A). This band seems specific for P2Y11 since treatment of human arteries with specific human P2Y11 antisense ODNs knocked down ~50% of the basal P2Y11 protein abundance (Figure 2—figure supplement 1B). Confocal imaging and line profile analysis of P2Y11-associated fluorescence and the plasma membrane marker wheat germ agglutinin (WGA) suggest a prominent distribution of the receptor on the surface membrane of freshly dissociated human arterial myocytes (Figure 2D and E). This was not observed when the antibody for P2Y11 was omitted from the preparation (Figure 2—figure supplement 1C). These results suggest expression of P2Y11 in human arterial myocytes. We observed comparable results in mouse arterial lysates and arterial myocytes, including detection and knock down with P2Y11 ODNs of an immunoreactive band of the expected molecular weight for P2Y11 (Figure 2C and Figure 2—figure supplement 1A, B and D). A band of ~110–120 kDa was observed in mouse arterial lysates, perhaps reflecting the formation of heterodimers between the P2Y11 receptor itself or other purinergic/G protein-coupled receptors, as previously reported (Barragán-Iglesias et al., 2015; Barragán-Iglesias et al., 2014; Ecke et al., 2008; Nishimura et al., 2016). We also found expected distribution of P2Y11-like-associated fluorescence at the surface membrane of mouse arterial myocytes (Figure 2D and E), which was not observed when the primary antibody was omitted or boiled (Figure 2—figure supplement 1C and E).
Figure 2 with 1 supplement see all
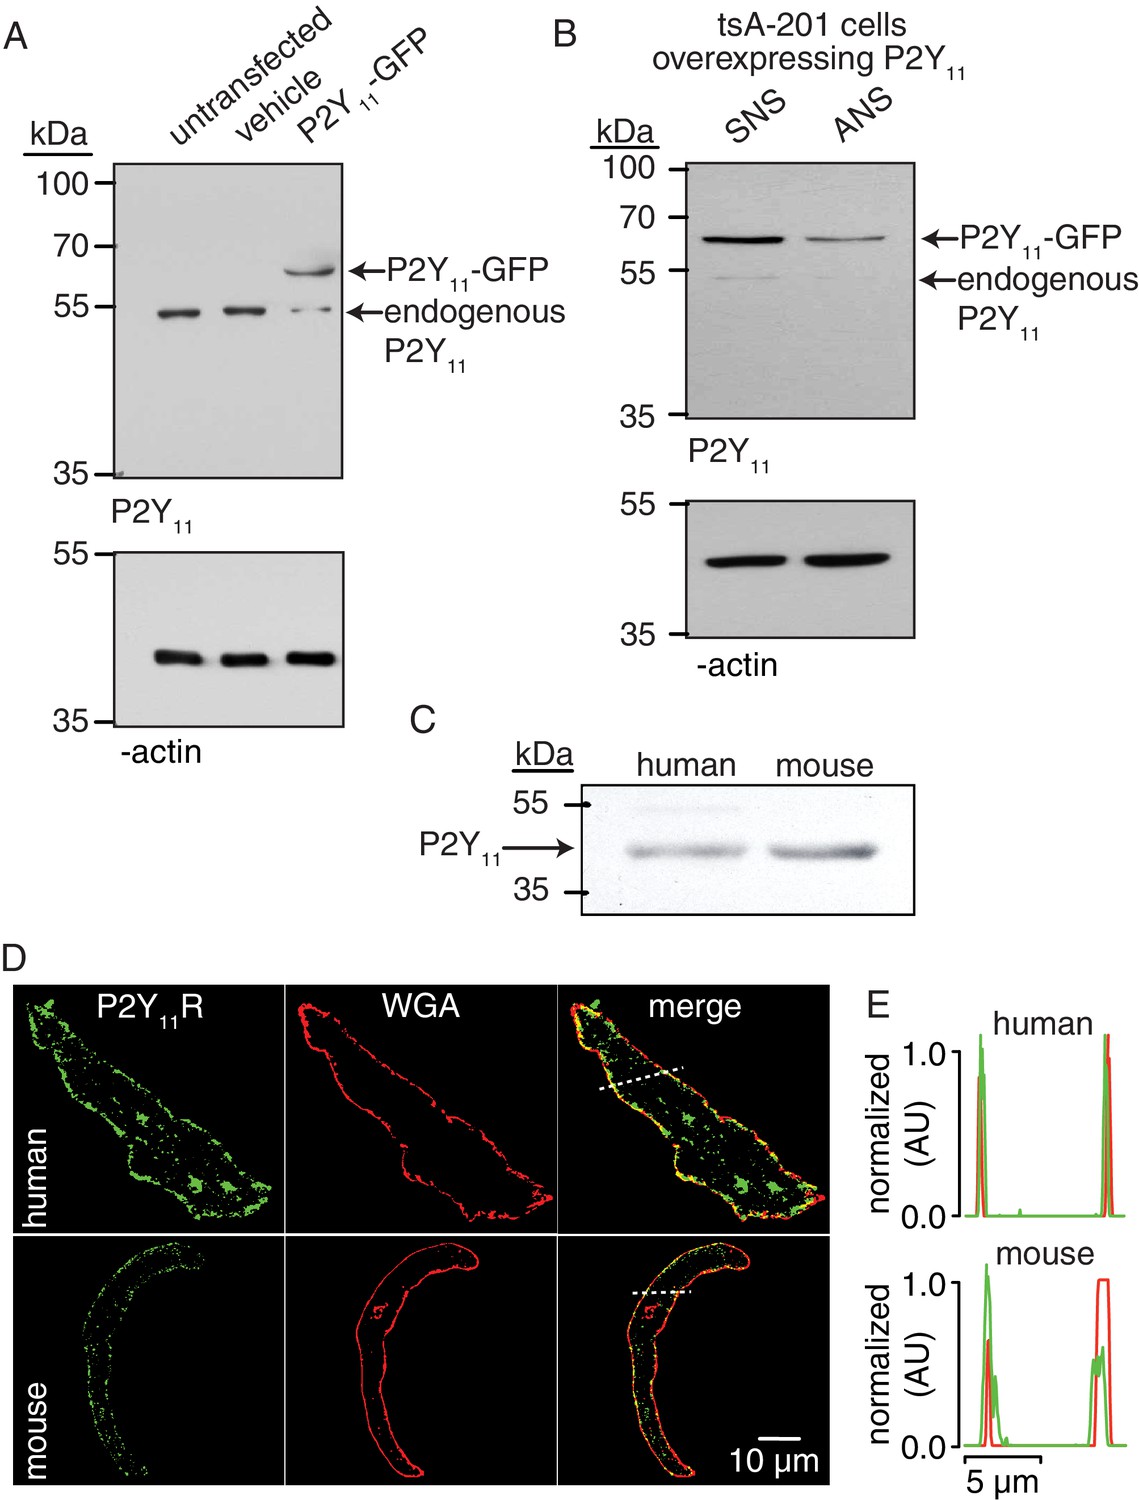
P2Y11 protein and distribution in arterial myocytes.
(A) Representative blot of immunoreactive bands of expected molecular weight for endogenous P2Y11 (~40 kDa), overexpressed P2Y11-GFP (~70 kDa), and β-actin (~43 kDa) in untransfected, vehicle-treated (empty transfection) and P2Y11-GFP transfected tsA-201 cells (n = 3 lysates per condition). Note that tsA-201 cells endogenously express P2Y11 (Dreisig and Kornum, 2016). (B) Representative blot of immunoreactive bands of expected molecular weight for endogenous P2Y11 (~40 kDa), overexpressed P2Y11-GFP (~70 kDa), and β-actin (~43 kDa) in tsA-cells transfected with P2Y11-GFP as well as corresponding P2Y11 sense (SNS) or antisense (ANS) ODNs (64% reduction in endogenous P2Y11 expression in cells treated with ANS; 62% reduction in P2Y11-GFP expression in P2Y11-GFP-transfected cells treated with ANS; n = 3 lysates per condition; Figure 2—source data 1). (C) Representative immunoblot detection of P2Y11 (~40 kDa) in lysates from human and wt mouse arteries (n = 3 arterial lysates per sample). (D) Representative confocal images of P2Y11-associated fluorescence (green), wheat germ agglutinin (WGA, red) and merged channels in human (n = 11 cells from three humans) and wt mouse (n = 14 cells from three mice) arterial myocytes. (E) Line profile of the P2Y11- and WGA-associated fluorescence from the area highlighted by the dotted lines in the representative human and mouse arterial myocytes in D.
-
Figure 2—source data 1
Excel spreadsheet containing the individual numeric values of P2Y11/ β-actin relative density corresponding to values reported in legend of Figure 2B.
- https://doi.org/10.7554/eLife.42214.016
If P2Y11 is involved in PKA-mediated activation of LTCCs in response to elevated glucose, we hypothesized that a subpopulation of these receptors should be localized in close proximity to CaV1.2 and PKAcat. To test this possibility, we examined the spatial relationship of P2Y11 with CaV1.2 and PKAcat in freshly dissociated human arterial myocytes using GSD super-resolution nanoscopy in the Total Internal Reflection Fluorescence (TIRF) configuration. This approach achieves a lateral resolution of ~20 nm with selective illumination of the (sub)sarcolemmal region. Note that the FP1 antibody against CaV1.2 has been extensively validated by our group (Buonarati et al., 2017; Hall et al., 2013; Nystoriak et al., 2017; Patriarchi et al., 2016). The PKAcat antibody was validated in arterial myocytes by pre-absorption with a blocking peptide (Figure 3—figure supplement 1). The GSD super-resolution localization maps (Figure 3A and B, bottom panels) for P2Y11, CaV1.2, and PKAcat obtained from conventional TIRF images (Figure 3A and B, top panels) showed that these proteins form clusters of various sizes (Figure 3C) and density (Figure 3D) at the sarcolemma of human arterial myocytes. Whereas clusters were broadly expressed throughout the sarcolemma, merged spatial maps of P2Y11 with CaV1.2 or PKAcat suggested a close association between a subset of these proteins (Figure 3E and F). Indeed, histograms of the P2Y11-to-nearest CaV1.2 or PKAcat distances revealed that the closest centroids for P2Y11-CaV1.2 and P2Y11- PKAcat were at 59 nm and 58 nm, respectively (Figure 3G and H). Similar results were observed using freshly dissociated mouse cerebral arterial myocytes (Figure 3—figure supplement 2). Clusters of P2Y11, CaV1.2, or PKAcat were never observed when primary antibodies were omitted from the human or mouse preparation (Figure 3—figure supplement 3A and B). To determine whether the interaction between a subpopulation of P2Y11 with a pool of CaV1.2 and PKA in arterial myocytes is the result of specific organization between two proteins, we compared the percentage of P2Y11 and CaV1.2/PKAcat overlap between experimental super-resolution localization maps and images containing randomized distribution of P2Y11, CaV1.2 and PKAcat. Randomized images for P2Y11-CaV1.2 and P2Y11-PKAcat were generated based on data derived from the experimental super-resolution localization maps for these pairs of proteins using the Coste’s randomization algorithm included in the JACoP plug-in in ImageJ (Bolte and Cordelières, 2006). Our analysis found that the percentage of overlap between P2Y11-CaV1.2 and P2Y11-PKAcat obtained from the experimental localization maps was significantly higher than that observed for a simulated random distribution between P2Y11-CaV1.2 and P2Y11-PKAcat (Figure 3I and Figure 3—figure supplement 3C). These results suggest an intimate association between subpopulations of P2Y11-CaV1.2 and P2Y11-PKAcat.
Figure 3 with 3 supplements see all
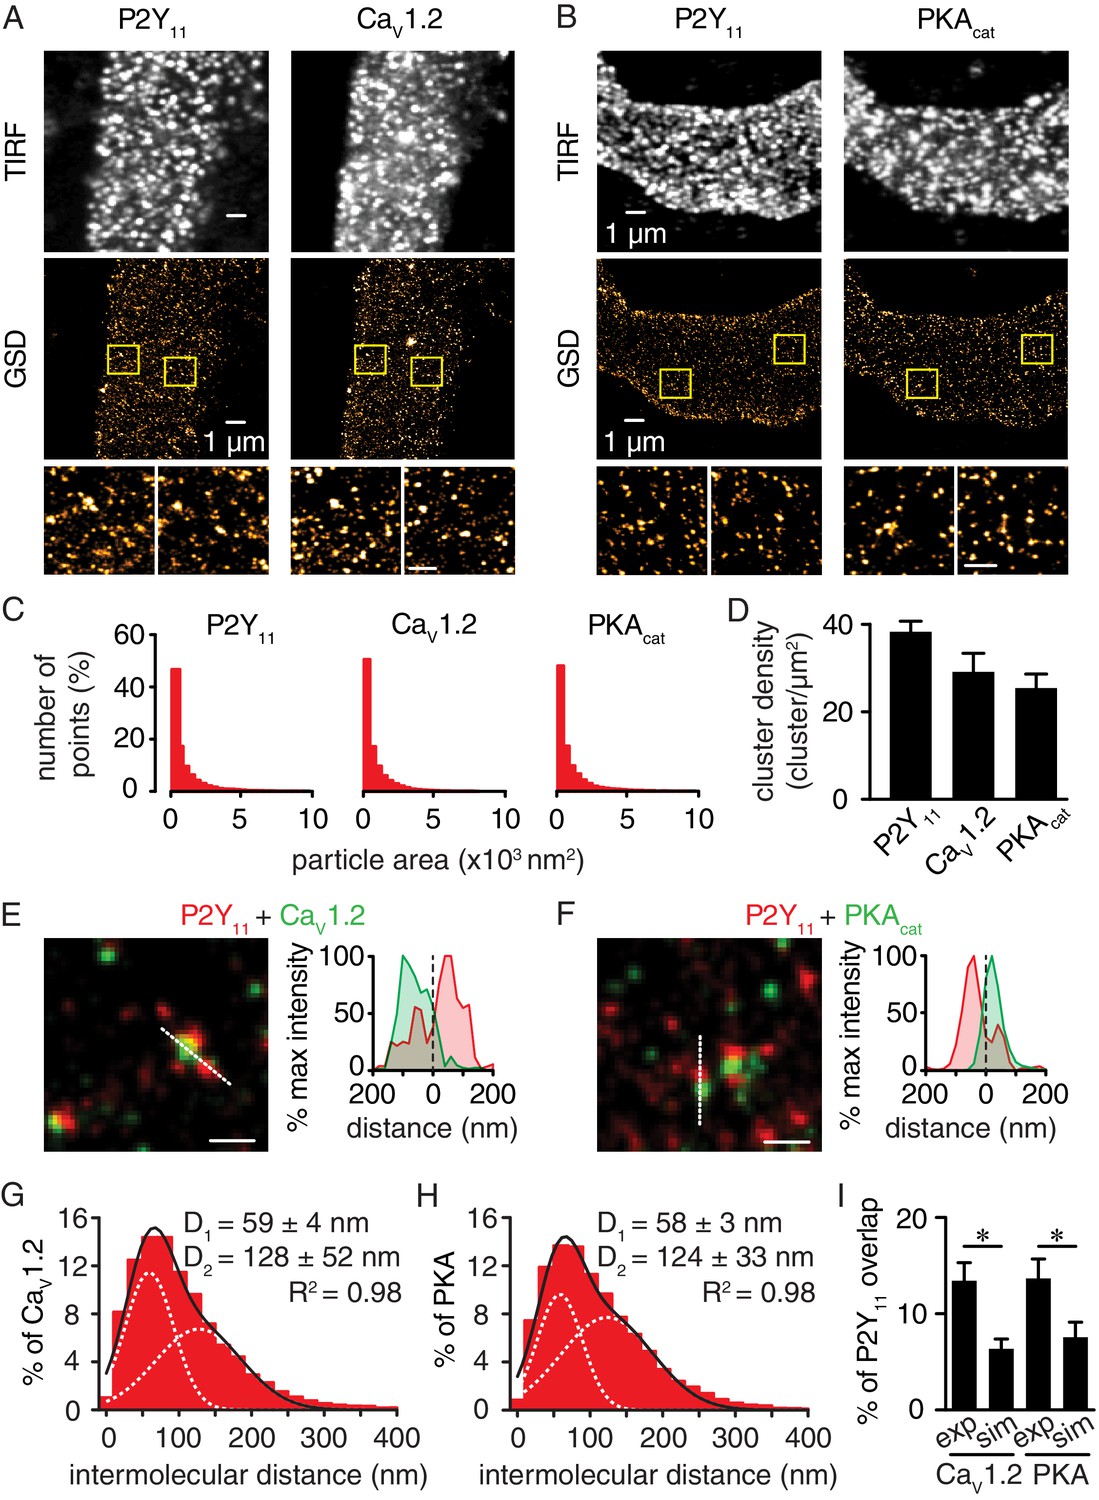
Nanometer organization of P2Y11 with CaV1.2 and PKAcat in human arterial myocytes.
Representative conventional TIRF images (top) and corresponding GSD reconstruction maps (bottom) from human arterial myocytes labeled for (A) P2Y11 and CaV1.2 and (B) P2Y11 and PKAcat. Lower panels display enhanced magnifications of areas shown in yellow boxes (scale bar, 400 nm). (C) Histograms of the area of P2Y11, CaV1.2 and PKAcat clusters in isolated human arterial myocytes (1621 ± 29, 1209 ± 16 and 1322 ± 20 nm2, respectively; Figure 3—source data 1). (D) Bar plot of cluster density for P2Y11, CaV1.2 and PKAcat (38 ± 2, 29 ± 4, and 25 ± 3 clusters/µm2, respectively; Figure 3—source data 2). Enlarged merged image (left) and associated x-y fluorescence intensity profile (right) from area highlighted by the dotted lines of sites of close proximity between (E) P2Y11 (red) and CaV1.2 (green) and (F) P2Y11 (red) and PKAcat (green) (scale bar, 200 nm). Histograms of the lowest intermolecular distance to P2Y11 centroids for (G) CaV1.2 (n = 19,611 particles from 6 cells; Figure 3—source data 3) and (H) PKAcat (n = 22,425 particles from 6 cells; Figure 3—source data 4) fluorescence particles. Data were fit with a sum of two Gaussian functions with depicted R2 and centroids. (I) Bar plot of % overlap of P2Y11 with CaV1.2 or PKAcat for experimental (CaV1.2: n = 36 segments from 12 cells; PKAcat: n = 22 segments from 11 cells) and randomized simulations images (CaV1.2: n = 6 segments from 6 cells; PKAcat: n = 6 segments from 6 cells) (*p<0.05, unpaired t test with Welch’s correction; Figure 3—source data 5).
-
Figure 3—source data 1
Excel spreadsheet containing the individual numeric values of frequency distribution histograms for cluster area in Figure 3C.
- https://doi.org/10.7554/eLife.42214.025
-
Figure 3—source data 2
Excel spreadsheet containing the individual numeric values for cluster density in Figure 3D.
- https://doi.org/10.7554/eLife.42214.026
-
Figure 3—source data 3
Excel spreadsheet containing the individual numeric values of frequency distribution histograms for intermolecular distance in Figure 3G.
- https://doi.org/10.7554/eLife.42214.027
-
Figure 3—source data 4
Excel spreadsheet containing the individual numeric values of frequency distribution histograms for intermolecular distance in Figure 3H.
- https://doi.org/10.7554/eLife.42214.028
-
Figure 3—source data 5
Excel spreadsheet containing the individual numeric values for % of P2Y11 overlap in Figure 3I.
- https://doi.org/10.7554/eLife.42214.029
We used the proximity ligation assay (PLA) as an additional analytical tool to examine the association between P2Y11 and CaV1.2 or PKAcat. PLA fluorescence puncta are only observed if proteins of interest are 40 nm or less apart (Fredriksson et al., 2002). We have extensively validated this approach in previous studies (Nieves-Cintrón et al., 2017; Nystoriak et al., 2017). Whereas PLA signals were absent when at least one primary antibody was omitted (Figure 4—figure supplement 1), robust fluorescent puncta were detected in human (Figure 4A and B) and mouse (Figure 4C and D) arterial myocytes co-labeled for P2Y11 and CaV1.2 or P2Y11 and PKAcat. Altogether, these results suggest that human P2Y11 or mouse P2Y11-like receptors are located on the surface membrane of arterial myocytes within nanometer proximity (~≤40 nm) of a subpopulation of CaV1.2 and PKAcat.
Figure 4 with 1 supplement see all
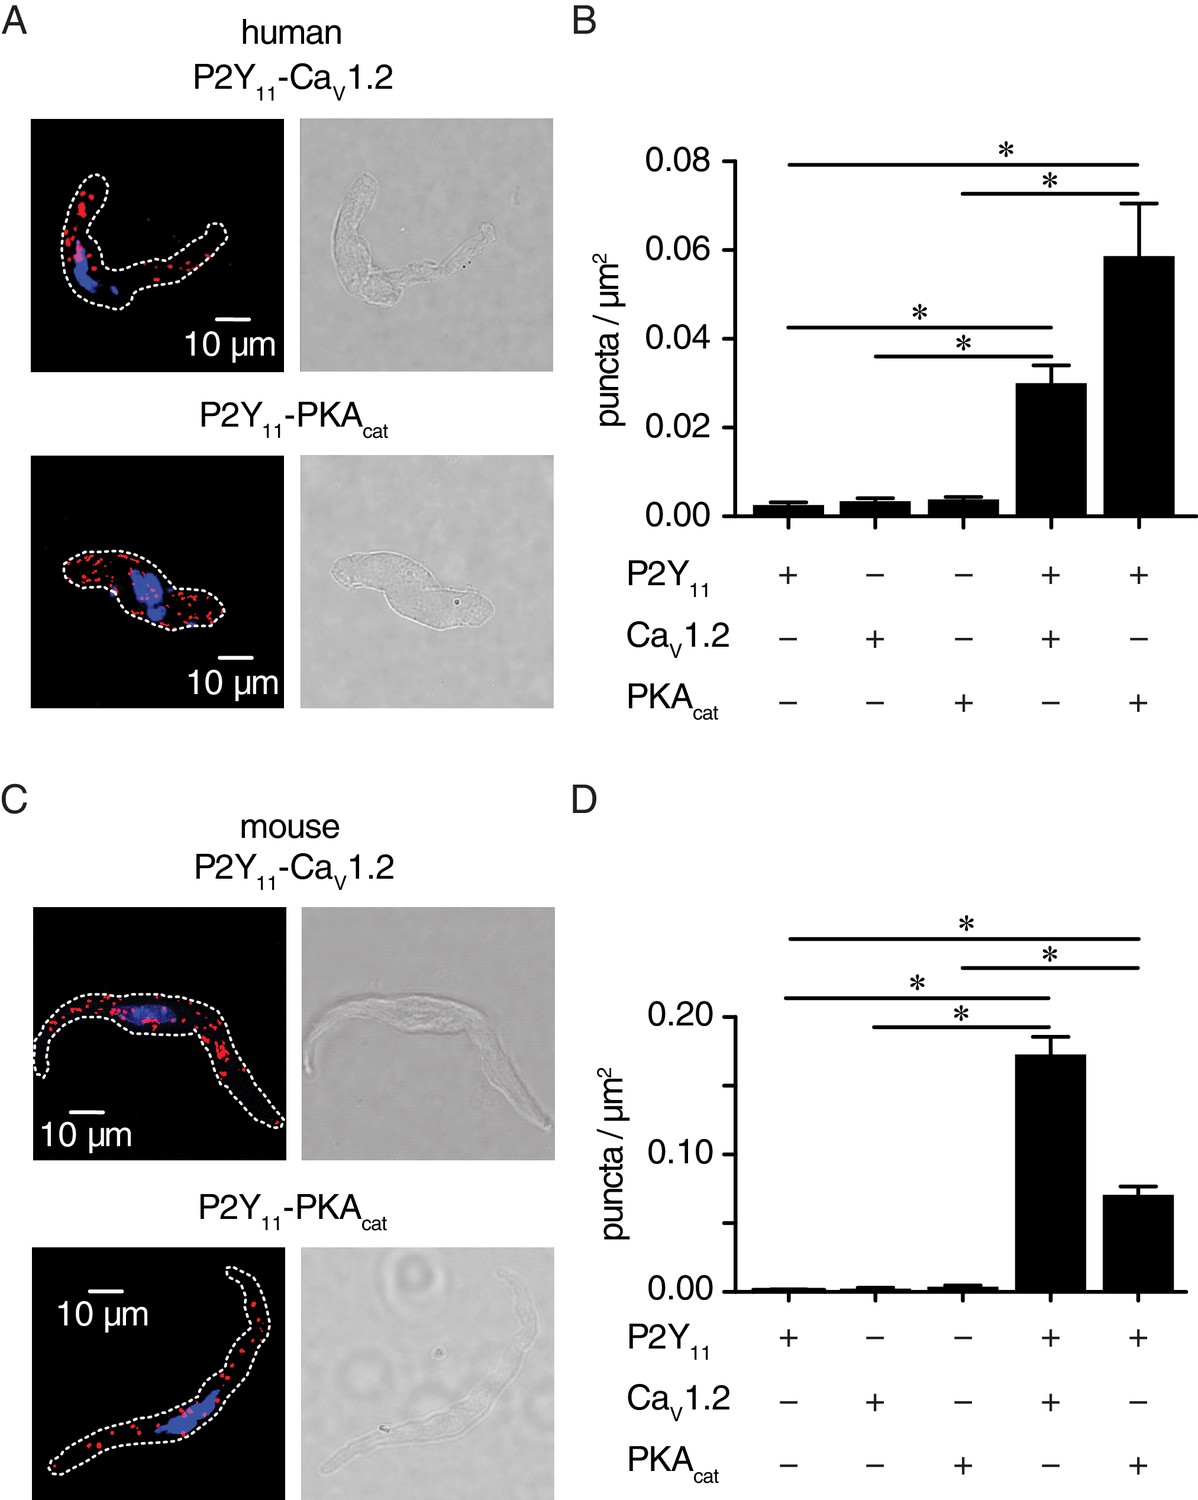
P2Y11 associates with CaV1.2 and PKAcat in human and murine arterial myocytes.
(A) Exemplary fluorescence PLA (red)/DAPI (blue) and differential interference contrast (right) images of human arterial myocytes labeled for P2Y11 + CaV1.2 and P2Y11 + PKAcat. (B) Quantification of PLA fluorescent puncta per cell area (puncta/µm2) for human arterial myocytes labeled for P2Y11 (n = 26 cells from three human samples), CaV1.2 (n = 20 cells from three humans), PKAcat (n = 17 cells from three humans), P2Y11 + CaV1.2 (n = 23 cells from three humans), and P2Y11 + PKAcat (n = 20 cells from three humans) (*p<0.05, Kruskal-Wallis with Dunn’s multiple comparisons; Figure 4—source data 1). (C) Representative fluorescence PLA (red)/DAPI (blue) and differential interference contrast (right) images of mouse arterial myocytes labeled for P2Y11 + CaV1.2 and P2Y11 + PKAcat. (D) Quantification of PLA fluorescent puncta per µm2 cell area for mouse arterial myocytes labeled for P2Y11 (n = 44 cells from six mice), CaV1.2 (n = 15 cells from six mice), PKAcat (n = 19 cells from six mice), P2Y11 + CaV1.2 (n = 25 cells from six mice), and P2Y11 + PKAcat (n = 29 cells from six mice) (*p<0.05, Kruskal-Wallis with Dunn’s multiple comparisons; Figure 4—source data 2).
-
Figure 4—source data 1
Excel spreadsheet containing the individual numeric values of puncta/µm2 graphs in Figure 4B.
- https://doi.org/10.7554/eLife.42214.032
-
Figure 4—source data 2
Excel spreadsheet containing the individual numeric values of puncta/µm2 graphs in Figure 4D.
- https://doi.org/10.7554/eLife.42214.033
Increased sarcolemmal cAMP synthesis in arterial myocytes in response to a P2Y11 agonist recapitulates glucose effects
P2Y11 can stimulate adenylyl cyclase (AC) activity to produce cAMP (Communi et al., 1997; Kennedy, 2017; Schuchardt et al., 2012; von Kügelgen and Harden, 2011). Thus, we first used a membrane-targeted Epac1-camps-based FRET sensor (ICUE3-PM) (Allen et al., 2006; Liu et al., 2011) expressed in tsA-201 cells to validate the P2Y11 pharmacology (Figure 5—figure supplement 1A) (Dreisig and Kornum, 2016). As expected, the highly selective P2Y11 agonist NF546 (500 nM) (Meis et al., 2010) increased cAMP synthesis in these cells. This NF546-induced cAMP response remained intact in cells pretreated with either selective P2Y1 (10 µM MRS2179) or P2Y6 (100 nM MRS2578) inhibitors but was prevented in cells exposed to the selective P2Y11 inhibitor NF340 (10 µM; 500-fold more selective for P2Y11 than other P2Y receptors) (Meis et al., 2010).
We recapitulated the NF546-induced cAMP response and its ablation by pretreatment with NF340 in primary, unpassaged human arterial myocytes expressing the ICUE3-PM sensor (Figure 5A and B). Increasing D-glucose concentration from 5 mM to 15 mM, which are glucose concentrations comparable to those observed in nondiabetic and diabetic patients respectively, induced a small yet significant increase in cAMP synthesis in human cells (Figure 5A and B). The glucose effects are not due to osmotic changes as equimolar concentrations of the non-permeable mannitol did not induce any cAMP synthesis (Figure 5—figure supplement 1B). As expected, the synthesis of cAMP was further amplified by the broad AC activator forskolin (1 μM) (Figure 5A) even in the presence of 20 mM mannitol (Figure 5—figure supplement 1B). Simultaneous application of 15 mM D-glucose +NF546 resulted in cAMP synthesis of a similar magnitude to that induced by independent treatments (Figure 5A and B). This suggests that the effects of elevated glucose and the NF546 compound may be acting through a similar pathway that requires activation of P2Y11. Consistent with this notion, application of NF546 by itself or 15 mM D-glucose +NF546 failed to induce cAMP synthesis in cells pretreated with NF340 (Figure 5A and B). Yet forskolin, which bypasses P2Y11, was still able to stimulate global cAMP production. Similar results were observed in murine arterial myocytes expressing the ICUE3-PM sensor (Figure 5C and D and Figure 5—figure supplement 1C). Intriguingly, cAMP synthesis in response to elevated glucose and the P2Y11 agonist NF546 was significantly larger in human myocytes compared to mouse cells (glucose: 0.077 ± 0.003 in human vs 0.045 ± 0.002 in mouse; NF546: 0.083 ± 0.005 in human vs 0.045 ± 0.004 in mouse; p<0.05). The reasons for this are currently unclear but may include intrinsic differences associated with species (human vs mouse), blood vessels (human adipose arteries vs mouse aortae) and expression patterns of the biosensor in human vs mouse cells (Reddy et al., 2018), as well as variations in protein expression and receptor/enzyme activity (e.g. P2Y11, AC and PDE expression/activity) in human vs mouse arterial myocytes. Whether either or all of these factors contribute to distinctive cAMP responses in human vs mouse arterial myocytes as well as their physiological implications remain to be determined. Nevertheless, our findings suggest a role for human P2Y11 and mouse P2Y11-like receptors in glucose-induced cAMP synthesis.
Figure 5 with 1 supplement see all

Glucose and the P2Y11 agonist NF546 increase sarcolemmal cAMP synthesis in arterial myocytes, and these effects are prevented by the P2Y11 antagonist NF340.
(A) Time course of YFP/CFP (donor/acceptor) FRET ratios (normalized to resting levels before treatment) in human arterial myocytes expressing the ICUE3-PM biosensor in response to 15 mM D-glucose (black; n = 19 cells from two humans), 500 nM NF546 (green; n = 18 cells from two humans) and 15 mM D-glucose +500 nM NF546 (red; n = 14 cells from two humans) before and after application of broad adenylyl cyclase agonist forskolin (1 µM). In a set of experiments, cells were first pre-treated with the P2Y11 antagonist NF340 (10 µM) for at least 15–20 min before treatment with 500 nM NF546 (orange; n = 15 cells from two humans) and 15 mM D-glucose +500 nM NF546 (blue; n = 13 cells from two humans). Horizontal bars indicate treatment. Increases in cAMP production are represented by decreases in YFP/CFP ratio due to binding of cAMP to the biosensor. (B) Bar plot of maximum FRET responses (YFP/CFP) for human arterial myocytes in response to the indicated treatment (*p<0.05, Kruskal-Wallis with Dunn’s multiple comparisons; Figure 5—source data 1. Statistical differences were compared between 15 mM D-glucose vs NF546, 15 mM D-glucose vs 15 mM D-glucose +NF546, 15 mM D-glucose vs NF546 +NF340, 15 mM D-glucose vs 15 mM D-glucose +NF546+NF340, NF546 vs NF546 +NF340, NF546 vs 15 mM D-glucose +NF546, NF546 vs 15 mM D-glucose +NF546+NF340, 15 mM D-glucose +NF546 vs 15 mM D-glucose +NF546+NF340). (C) Time course of YFP/CFP (donor/acceptor) FRET ratios (normalized to resting levels before treatment) in mouse arterial myocytes expressing the ICUE3-PM biosensor in response to 20 mM D-glucose (black; n = 83 cells from three mice), 500 nM NF546 (green; n = 13 cells from three mice) and 20 mM D-glucose +500 nM NF546 (red; n = 13 cells from three mice). Horizontal bars indicate treatment. In a set of experiments, cells were first pre-treated with the P2Y11 antagonist NF340 (10 µM) for at least 15–20 min before treatment with 500 nM NF546 (orange; n = 17 cells from three mice) and 20 mM D-glucose +500 nM NF546 (blue; n = 18 cells from three mice). Increases in cAMP production are represented by decreases in YFP/CFP ratio due to binding of cAMP to the biosensor. (D) Bar plot of maximum FRET responses (YFP/CFP) for mouse arterial myocytes in response to the indicated treatment (*p<0.05, Kruskal-Wallis with Dunn’s multiple comparisons; Figure 5—source data 2. Statistical differences were compared between all datasets).
-
Figure 5—source data 1
Excel spreadsheet containing the individual numeric values for maximum FRET responses in Figure 5B.
- https://doi.org/10.7554/eLife.42214.039
-
Figure 5—source data 2
Excel spreadsheet containing the individual numeric values for maximum FRET responses in Figure 5D.
- https://doi.org/10.7554/eLife.42214.040
The P2Y11 inhibitor NF340 prevents glucose-induced Ser1928 phosphorylation, LTCC activity and vasoconstriction
In our next series of experiments, we confirmed the glucose-induced increase in IBa detected in mouse arterial myocytes (Figure 1B) using freshly dissociated human arterial myocytes in which external glucose was elevated from 5 mM to 15 mM (Figure 6A and B). These results indicate that elevations in extracellular glucose also stimulate LTCC activity in human arterial myocytes (Nystoriak et al., 2017). The increase in IBa evoked by 15 mM D-glucose was prevented in human cells pretreated with NF340 (Figure 6A and B). Glucose-induced potentiation of IBa was also prevented in mouse arterial myocytes pretreated with NF340 (Figure 6C and D). However, inhibition of P2Y6 receptors with MRS2578, which has been implicated in myogenic tone regulation and glucose-induced NFAT activation in arterial myocytes (Brayden et al., 2013; Nilsson et al., 2006), failed to stop the increase in IBa in response to 20 mM D-glucose (Figure 6C and D). Note that basal IBa were similar in cells exposed to 10 mM D-glucose and 10 mM D-glucose +MRS2578, suggesting that inhibition of P2Y6 did not alter basal LTCC activity (Figure 6C and D). Altogether, these results suggest that P2Y6 receptors are not involved in glucose-induced potentiation of LTCC activity, and that these glucose effects are prevented with a P2Y11 inhibitor.
Figure 6 with 1 supplement see all
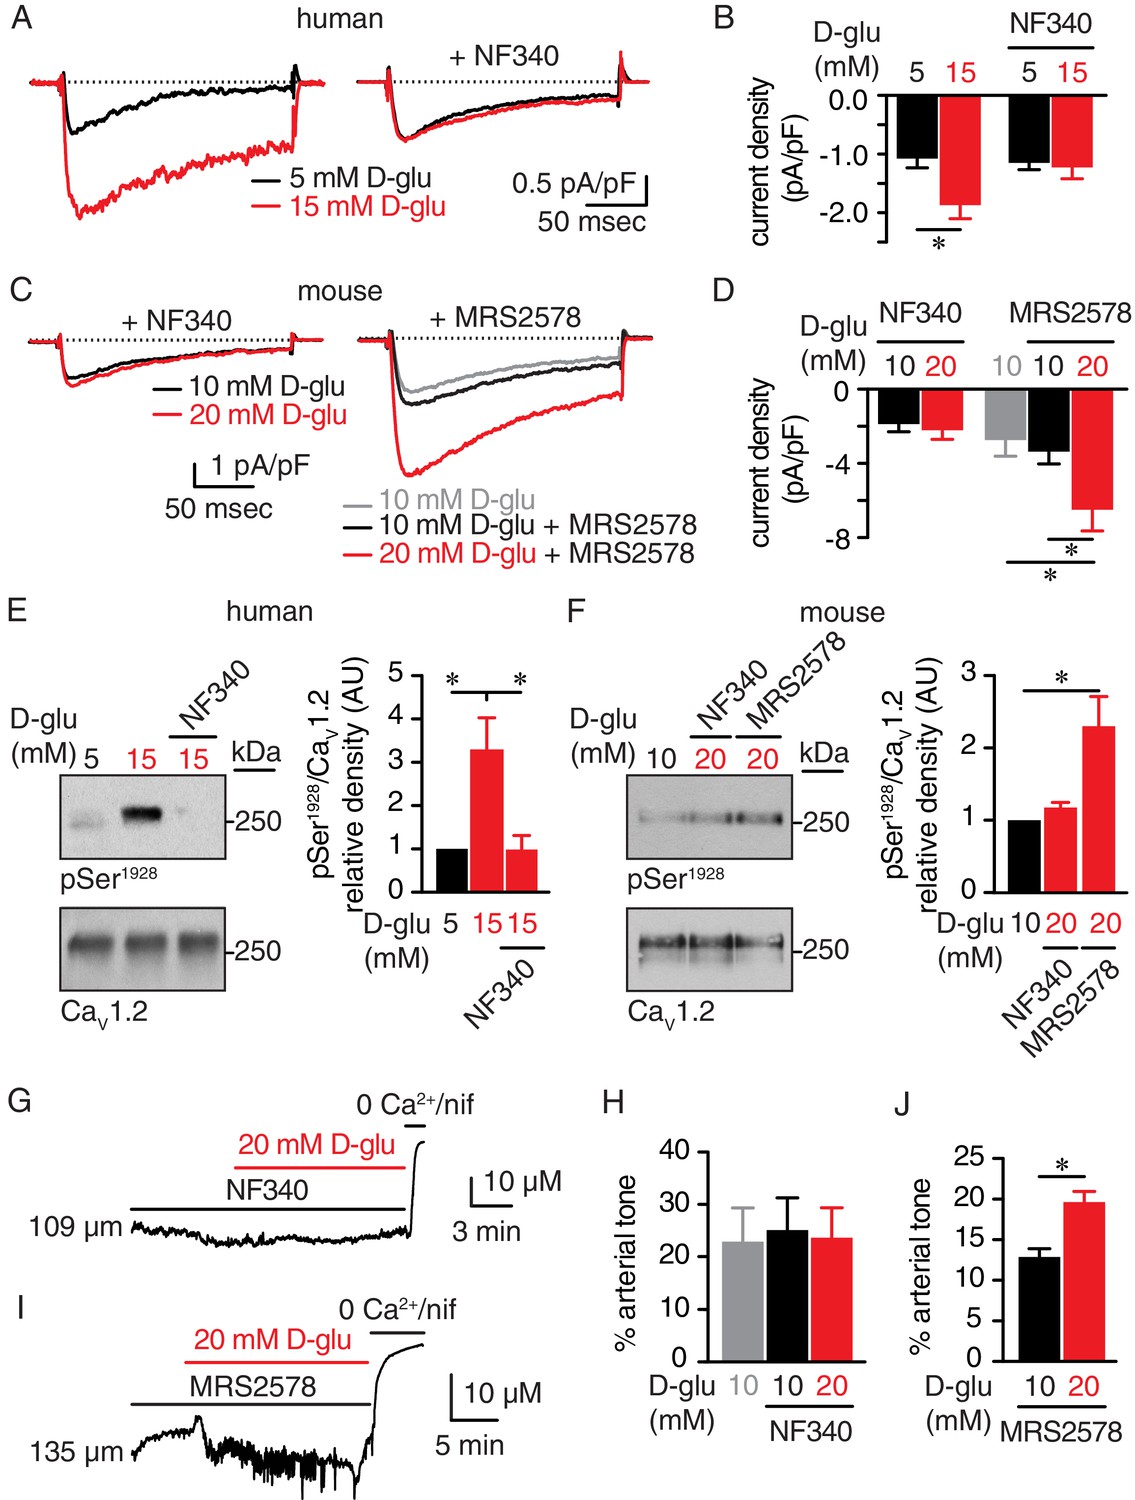
The P2Y11 inhibitor NF340 prevents glucose-induced elevations in Ser1928 phosphorylation, LTCC activity, and vasoconstriction in human and murine arterial myocytes.
(A) Representative IBa recordings from the same cell and (B) summary current density data obtained from freshly dissociated human arterial myocytes before and after increasing extracellular D-glucose from 5 mM to 15 mM in the absence (n = 12 cells from six humans) and presence (n = 10 cells from five humans) of NF340 (10 µM) (*p<0.05, paired t test; Figure 6—source data 1). (C) Exemplary IBa traces from the same cell and (D) amalgamated current density data recorded from mouse cerebral arterial myocytes treated with 10 µM NF340 (n = 8 cells from three mice) or 100 nM MRS2578 (n = 7 cells from five mice) before and after increasing extracellular D-glucose from 10 mM to 20 mM (*p<0.05, Kruskal-Wallis with Dunn’s multiple comparisons; Figure 6—source data 2). Representative immunoreactive bands for phosphorylated Ser1928 (pSer1928) and total CaV1.2 and densitometry for pSer1928/CaV1.2 ratio in lysates from (E) human arteries exposed to 5 mM and 15 mM D-glucose in the absence and presence of 10 µM NF340 (n = 6 arterial lysates per condition; *p<0.05, Kruskal-Wallis with Dunn’s multiple comparisons; Figure 6—source data 3) and (F) mouse cerebral and mesenteric arteries exposed to 10 mM or 20 mM D-glucose in the presence of 10 µM NF340 or 100 nM MRS2578 (n = 4 arterial lysates per condition; *p<0.05 Kruskal-Wallis with Dunn’s multiple comparisons; Figure 6—source data 4). Representative diameter recordings and summary data from pressurized (60 mmHg) mouse cerebral arteries exposed to (G–H) 10 µM NF340 (n = 4 arteries from four mice; Friedman with Dunn’s multiple comparisons; Figure 6—source data 5) or (I–J) 100 nM MRS2578 (n = 7 arteries from seven mice; *p<0.05, Wilcoxon matched pair test; Figure 6—source data 6) before and after application of 20 mM D-glucose.
-
Figure 6—source data 1
Excel spreadsheet containing the individual numeric values of current density analyzed in Figure 6B.
- https://doi.org/10.7554/eLife.42214.046
-
Figure 6—source data 2
Excel spreadsheet containing the individual numeric values of current density analyzed in Figure 6D.
- https://doi.org/10.7554/eLife.42214.047
-
Figure 6—source data 3
Excel spreadsheet containing the individual numeric values of pSer1928/CaV1.2 relative density analyzed in Figure 6E.
- https://doi.org/10.7554/eLife.42214.048
-
Figure 6—source data 4
Excel spreadsheet containing the individual numeric values of pSer1928/CaV1.2 relative density analyzed in Figure 6F.
- https://doi.org/10.7554/eLife.42214.049
-
Figure 6—source data 5
Excel spreadsheet containing the individual numeric values of % arterial tone analyzed in Figure 6H and corresponding raw diameters.
- https://doi.org/10.7554/eLife.42214.050
-
Figure 6—source data 6
Excel spreadsheet containing the individual numeric values of % arterial tone analyzed in Figure 6J and corresponding raw diameters.
- https://doi.org/10.7554/eLife.42214.051
Since the P2Y11 inhibitor hindered the glucose effects on LTCC activity, we also explored whether the NF340 compound interfered with the Ser1928 phosphorylation state of the channel and vascular reactivity in response to hyperglycemia. As observed in mouse arteries (Figure 1C), we found that elevating extracellular glucose significantly increased Ser1928 phosphorylation in human arterial lysates (Figure 6E; Figure 6—figure supplement 1A). Yet, this glucose-mediated increase in Ser1928 phosphorylation was prevented if arterial lysates were pretreated with NF340, whereas phosphorylation still occurred if arterial lysates were pretreated with the P2Y6 inhibitor MRS2578 (Figure 6E and F, and Figure 6—figure supplement 1A and B). Furthermore, vasoconstriction in response to elevated glucose was blocked in pressurized (60 mmHg) mouse cerebral arteries exposed to NF340 (Figure 6G and H and Supplementary file 2) but not to MRS2578 (Figure 6I and J and Supplementary file 2). Note that while arterial tone was similar in control and NF340-treated arteries, it was reduced in arteries exposed to MRS2578 (Figure 6I and J), which is in line with recent data showing that P2Y6 is a sensor of pressure-induced constriction (Brayden et al., 2013). Vasoconstriction in response to 60 mM K+ was similar in control and NF340 as well as MRS2578-treated arteries (Figure 6—figure supplement 1C and Supplementary file 1 and 2). We also evaluated a potential role for P2Y1 receptors in stimulating PKA-mediated vasoconstriction as these receptors have been suggested to crosstalk with P2Y11 to regulate their function in HEK cells and neurons (del Puerto et al., 2012; King and Townsend-Nicholson, 2008). Data revealed that the glucose-induced vasoconstriction was not altered by adding the selective P2Y1 inhibitor MRS2179 (10 μM) either before or after 20 mM D-glucose stimulation (Figure 6—figure supplement 1D and E and Supplementary file 1 and 2). These results suggest that the P2Y1 receptor is not involved in glucose-mediated vasoconstriction. Together, these data demonstrate the effectiveness of a P2Y11 inhibitor in blocking the remodeling of Ser1928 phosphorylation and LTCC activity that mediates vasoconstriction in response to elevated glucose.
The P2Y11 agonist NF546 stimulates Ser1928 phosphorylation, PKA-dependent LTCC activity and vasoconstriction
We next investigated whether a selective P2Y11 agonist could recapitulate the glucose-mediated Ser1928 phosphorylation and PKA-dependent LTCC activity. Using freshly dissociated human arterial myocytes, we found that IBa was significantly increased by application of NF546 (Figure 7A). This P2Y11 agonist also increased IBa at multiple membrane potentials in mouse arterial myocytes with no change in the current-voltage (I-V) relationship (Vmax = 14.9 ± 2.0 mV for 10 mM D-glucose and Vmax = 10.9 ± 1.1 mV for NF546; p=0.1085, extra sum-of-squares F test) (Figure 7B). The NF546-mediated increase in IBa was similar in magnitude to that induced by elevated glucose (Figure 7—figure supplement 1A). Similar IBa potentiation was also observed after application of the non-hydrolyzed ATP analog and potent P2Y11 agonist ATPγS (1 μM; Figure 7—figure supplement 1B) (von Kügelgen and Harden, 2011). Note that ATPγS stimulates P2Y11 activity with EC50 that ranges from 31 nM to 23 μM, depending on readout, cell type and species used, but it is still a more potent activator than ATP itself (Communi et al., 1999; Haas et al., 2014; Kennedy, 2017; Meis et al., 2010; Qi et al., 2001; Schuchardt et al., 2012; von Kügelgen and Harden, 2011). We further correlated the potentiation in IBa by NF546 to an elevation of Ser1928 phosphorylation in freshly dissected human and mouse arterial lysates (Figure 7C and Figure 7—figure supplement 1C). Since PKA is essential for glucose-mediated remodeling of IBa in arterial myocytes and can be activated downstream of P2Y11 (Navedo et al., 2010b; Nystoriak et al., 2017), we also examined its involvement in NF546-mediated potentiation of LTCC activity in arterial myocytes. Consistent with a key role for PKA, NF546 failed to upregulate IBa in arterial myocytes incubated with the PKA inhibitors PKI (100 nM) or rpcAMP (10 μM) (Figure 7D).
Figure 7 with 1 supplement see all
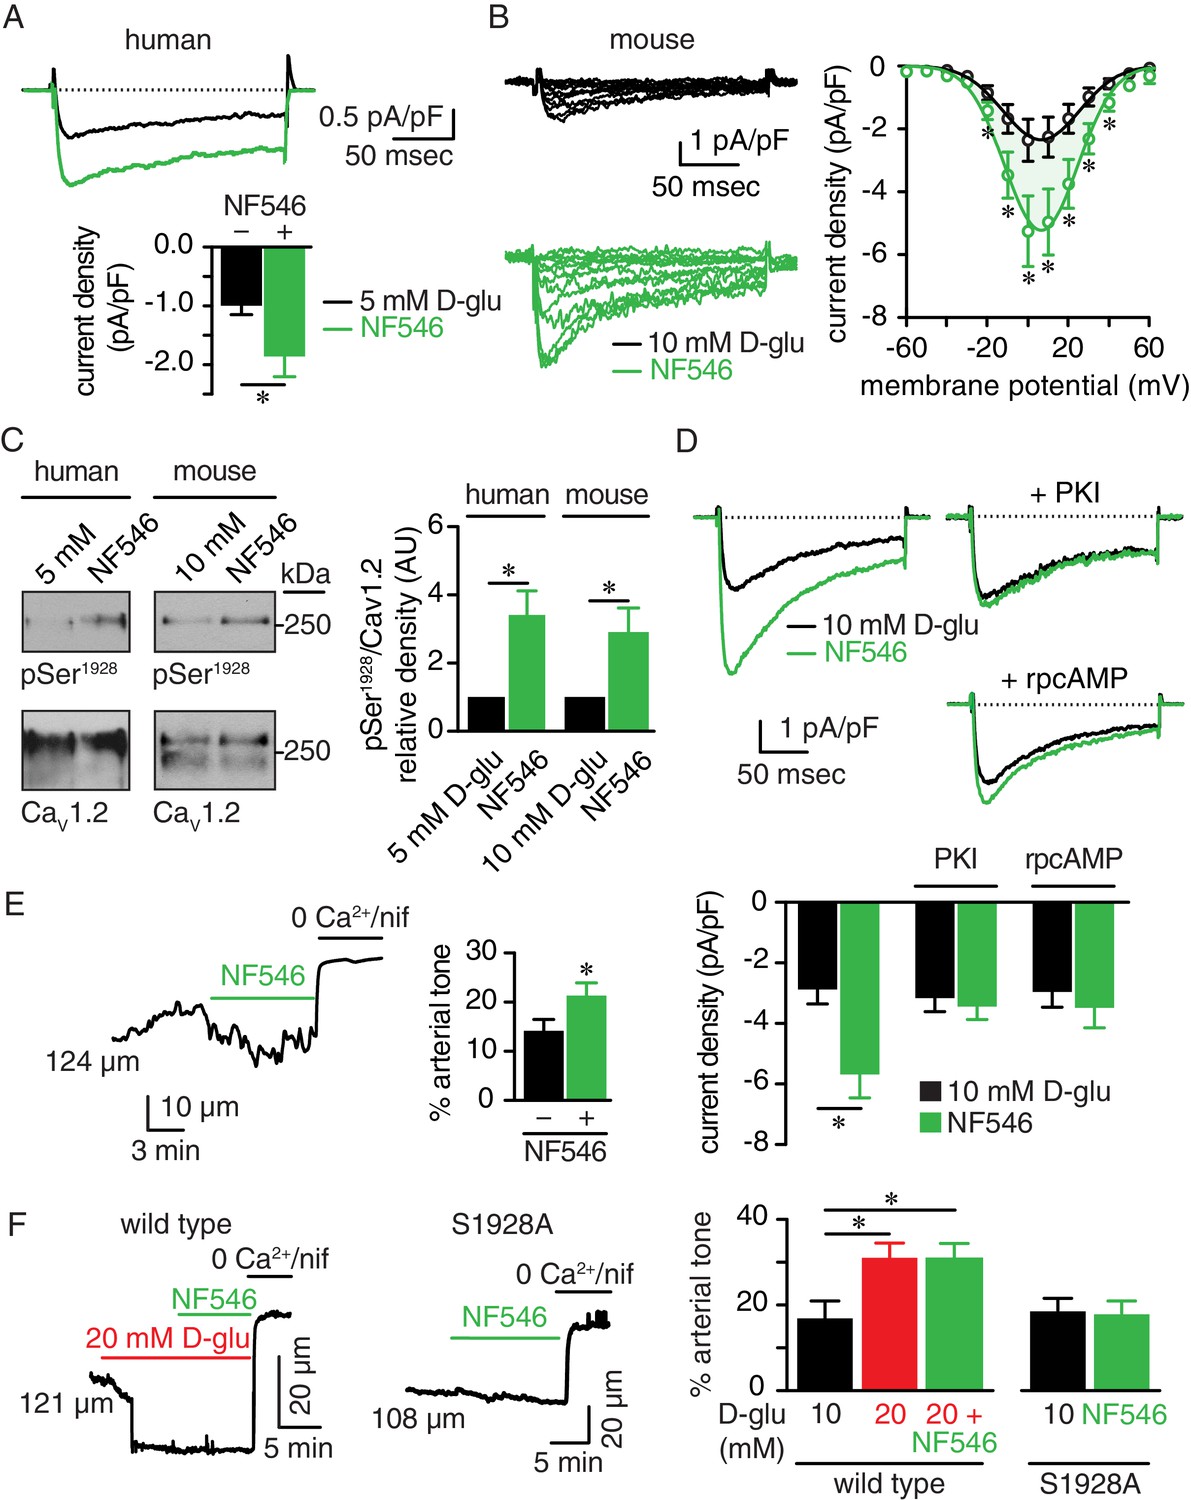
The P2Y11 agonist NF546 increases Ser1928 phosphorylation, LTCC activity, and induces vasoconstriction.
(A) Representative IBa recordings from the same cell (top) and summary IBa data (bottom) from freshly dissociated human arterial myocytes in response to step depolarizations from −70 to +10 mV before and after application of 500 nM NF546 (n = 11 cells from five humans; *p<0.05, paired t test; Figure 7—source data 1). (B) Representative IBa recordings from the same cell (left) triggered by step depolarization from −70 mV to voltages ranging from −60 to +60 mV before and after application of 500 nM NF546 in mouse cerebral arterial myocytes and corresponding IBa-voltage relationship (right) (n = 8 cells from five mice) (*p<0.05, paired t test; Figure 7—source data 2). (C) Exemplary immunoblot detection of phosphorylated Ser1928 (pSer1928) and total CaV1.2 from human (left) and mouse cerebral and mesenteric arteries (right) incubated with 500 nM NF546 and respective densitometry quantification of pSer1928/CaV1.2 ratio (n = 6 arterial lysates per condition for humans; n = 6 arterial lysates per condition for mice) (*p<0.05, Wilcoxon matched pairs test; Figure 7—source data 3). (D) Representative IBa recordings from the same cell (top) and summary IBa data (bottom) from mouse arterial myocytes evoked by step depolarizations from −70 to +10 mV before and after application of 500 nM NF546 in the absence (n = 9 cells, four mice) and presence of 100 nM PKI (n = 9 cells, five mice) or 10 µM rpcAMP (n = 9 cells, four mice) (*p<0.05, paired t test; Figure 7—source data 4). (E) Representative diameter recording and summary arterial tone data from pressurized (60 mmHg) mouse cerebral arteries exposed to 500 nM NF546 (n = 6 arteries, six mice) (*p<0.05, Wilcoxon matched pairs test; Figure 7—source data 5). (F) Representative diameter recordings and summary arterial tone data from pressurized (60 mmHg) wt mouse cerebral arteries exposed to 20 mM D-glucose before and after application of 500 nM NF546 (n = 6 arteries, six mice, left; *p<0.05, Friedman with Dunn’s multiple comparisons; Figure 7—source data 6) and S9128A mouse cerebral arteries after NF546 application (n = 4 from three mice, right; Figure 7—source data 6).
-
Figure 7—source data 1
Excel spreadsheet containing the individual numeric values of current density analyzed in Figure 7A.
- https://doi.org/10.7554/eLife.42214.057
-
Figure 7—source data 2
Excel spreadsheet containing the individual numeric values of current density analyzed in Figure 7B.
- https://doi.org/10.7554/eLife.42214.058
-
Figure 7—source data 3
Excel spreadsheet containing the individual numeric values of pSer1928/CaV1.2 relative density analyzed in Figure 7C.
- https://doi.org/10.7554/eLife.42214.059
-
Figure 7—source data 4
Excel spreadsheet containing the individual numeric values of current density analyzed in Figure 7D.
- https://doi.org/10.7554/eLife.42214.060
-
Figure 7—source data 5
Excel spreadsheet containing the individual numeric values of % arterial tone analyzed in Figure 7E and corresponding raw diameters.
- https://doi.org/10.7554/eLife.42214.061
-
Figure 7—source data 6
Excel spreadsheet containing the individual numeric values of % arterial tone analyzed in Figure 7F and corresponding raw diameters.
- https://doi.org/10.7554/eLife.42214.062
Having established that application of the P2Y11 agonist NF546 influences Ser1928 phosphorylation state as well as LTCC activity, we investigated whether it could also modulate arterial tone. Accordingly, pressurized (60 mmHg) arteries that developed stable arterial tone and responded to 60 mM K+ (Figure 7—figure supplement 1D and Supplementary file 1 and 2) showed significant constriction upon NF546 application (Figure 7E). Interestingly, NF546 did not induce further constriction in wt arteries previously exposed to 20 mM D-glucose (Figure 7F). Indeed, arterial tone was similar in arteries treated with 20 mM D-glucose or 20 mM D-glucose +NF546 (Supplementary file 1 and 2). Confirming a critical role for Ser1928, arteries from a S1928A knockin mouse in which phosphorylation of this CaV1.2 amino acid is prevented (Lemke et al., 2008; Nystoriak et al., 2017; Qian et al., 2017), failed to constrict to NF546 (Figure 7F and Supplementary file 1 and 2). Response of S1928A arteries to 60 mM K+ was similar to those observed for wt arteries (Figure 7—figure supplement 1D and Supplementary file 1 and 2). These results suggest that a P2Y11 agonist can induce Ser1928 phosphorylation, PKA-dependent LTCC potentiation and vasoconstriction, thus recapitulating glucose effects (Navedo et al., 2010b; Nystoriak et al., 2017), and providing further evidence of the involvement of human P2Y11 and mouse P2Y11-like receptors in these alterations.
Increased Ser1928 phosphorylation and LTCC activity during chronic diabetic hyperglycemia are prevented by a P2Y11 inhibitor
To explore whether a P2Y11 inhibitor could prevent changes in Ser1928 phosphorylation and LTCC activity during chronic diabetic hyperglycemia, we exposed isolated arteries for 48 hr to 10 mM D-glucose, 20 mM mannitol, 20 mM D-glucose or 20 mM D-glucose +NF340. This organ culture method prevents arterial myocyte phenotypic changes associated with prolonged culturing conditions. Furthermore, the exposure time is sufficient to induce many of the vascular remodeling phenomena associated with elevated glucose in arterial myocytes, including increased LTCC activity, decreased K+ channel activity and downstream activation of Ca2+-dependent transcription factors (Navedo et al., 2010b; Nieves-Cintrón et al., 2015; Nilsson et al., 2006; Nystoriak et al., 2014; Nystoriak et al., 2017). LTCC function was assessed by measuring single-channel activity using the cell-attached configuration from dissociated arterial myocytes under each experimental condition described above. We found that wt cells isolated from the 20 mM D-glucose but not the 20 mM mannitol treated group had significantly enhanced LTCC open probability (nPo) compared to those in the 10 mM D-glucose group (Figure 8A and B). This increase in LTCC activity during diabetic hyperglycemia, however, was prevented in arterial myocytes from arteries treated in the presence of the P2Y11 inhibitor NF340. Ser1928 phosphorylation was significantly elevated in arteries chronically exposed to 20 mM D-glucose, but this effect was completely abolished in the presence of NF340 (Figure 8C and Figure 8—figure supplement 1A). Consistent with a key role for Ser1928 phosphorylation in potentiation of LTCC activity in response to chronic elevations in glucose, LTCC nPo was similar in arterial myocytes from S1928A arteries incubated for 48 hr in 10 mM or 20 mM D-glucose (Figure 8—figure supplement 1B). These results suggest that treatment with a P2Y11 inhibitor can avert PKA-mediated Ser1928 phosphorylation and stimulated LTCC activity during diabetic hyperglycemia.
Figure 8 with 1 supplement see all
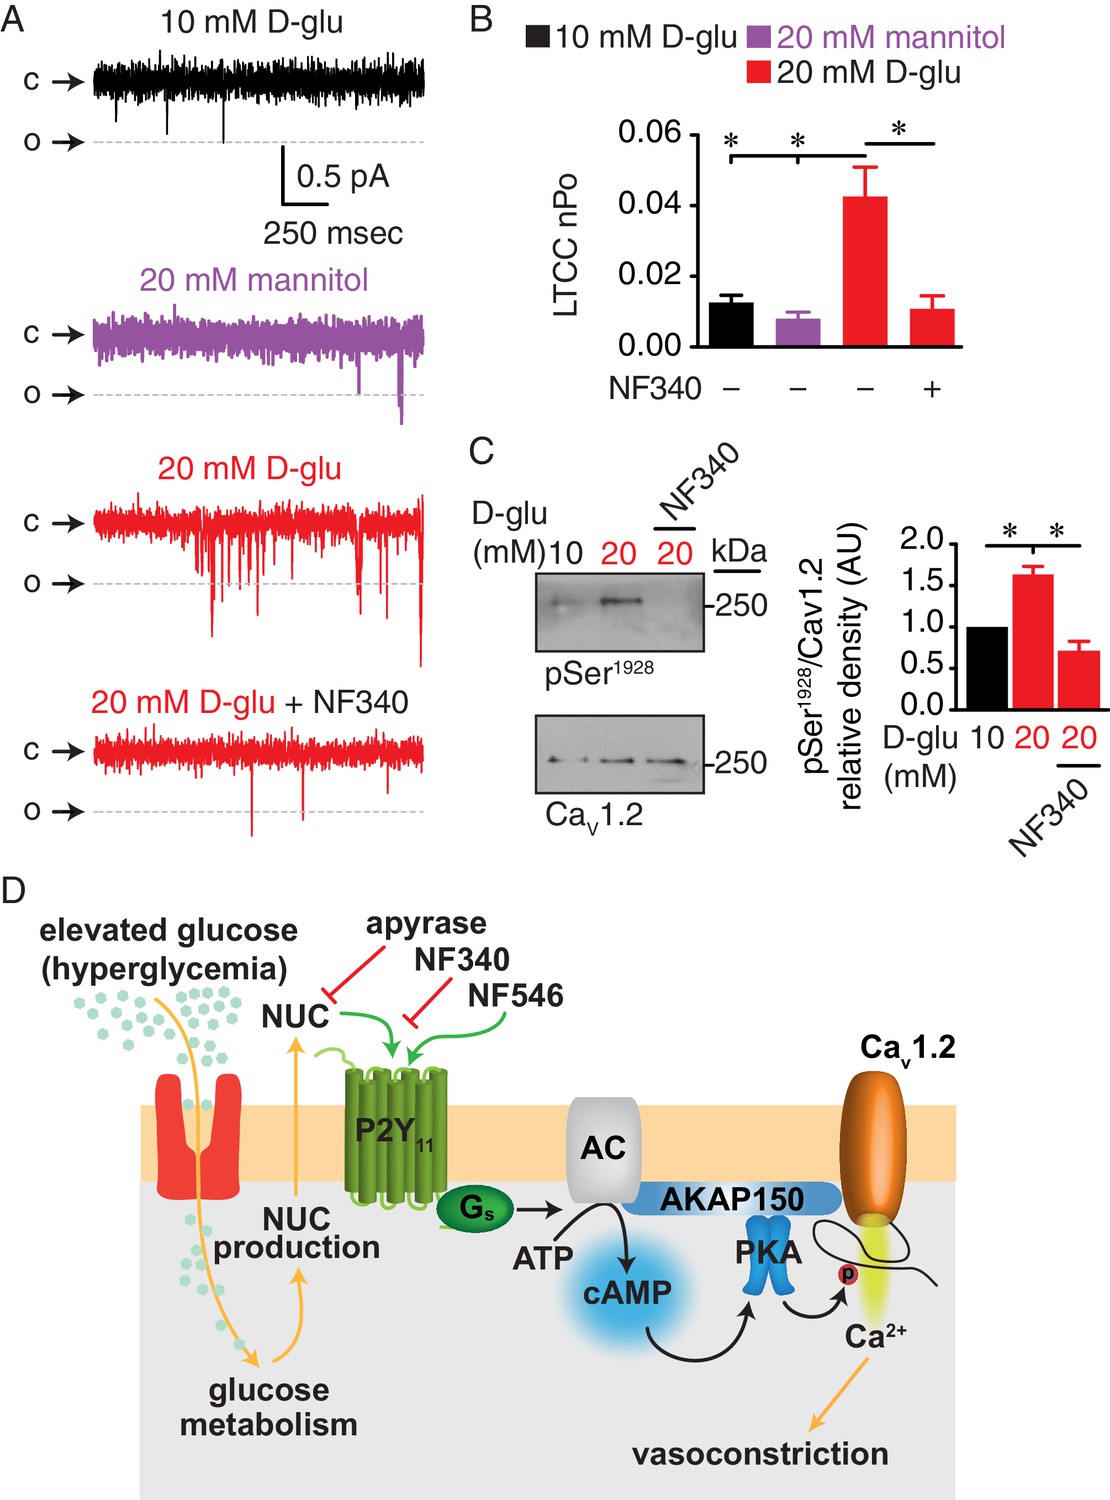
Augmented LTCC activity and Ser1928 phosphorylation in response to chronic extracellular glucose elevations are prevented in the presence of the P2Y11 antagonist NF340.
(A) Representative single LTCC recordings obtained during a 2 s step depolarization from −80 to −30 mV and (B) bar plot of LTCC nPo in arterial myocytes isolated from mouse cerebral arteries incubated for 48 hr in 10 mM D-glucose (n = 10 cells from three mice), 20 mM mannitol (n = 13 cells from four mice), 20 mM D-glucose (n = 10 cells from four mice) and 20 mM D-glucose +10 µM NF340 (n = 10 cells from four mice). Channel openings (o) are represented by downward deflections from baseline (c) (*p<0.05, one-way ANOVA with Tukey post hoc test; Figure 8—source data 1). (C) Representative immunoblot detection of phosphorylated Ser1928 (pSer1928) and total CaV1.2 from mouse cerebral and mesenteric arteries incubated for 48 hr in 10 mM D-glucose, 20 mM D-glucose and 20 mM D-glucose +10 µM NF340 and densitometry quantification of pSer1928/CaV1.2 ratio (n = 7 arterial lysates per condition) (*p<0.05, Kruskal-Wallis with Dunn’s multiple comparisons; Figure 8—source data 2). (D) Proposed model for the role of P2Y11 in PKA-dependent stimulation of LTCC activity and vasoconstriction during diabetic hyperglycemia (NUC = nucleotides).
-
Figure 8—source data 1
Excel spreadsheet containing the individual numeric values of LTCC nPo analyzed in Figure 8B.
- https://doi.org/10.7554/eLife.42214.066
-
Figure 8—source data 2
Excel spreadsheet containing the individual numeric values of pSer1928/CaV1.2 relative density analyzed in Figure 8C.
- https://doi.org/10.7554/eLife.42214.067
Discussion
Increased arterial myocyte contractility and vasoconstriction in response to elevated extracellular glucose contribute to vascular complications in diabetes (Cooper et al., 2001; Fleischhacker et al., 1999; Jackson et al., 2016; Montero et al., 2013; Nieves-Cintrón et al., 2015; Nystoriak et al., 2017). This endothelium-independent component is attributed, at least in part, to glucose-induced decreases in K+ channel expression and activity (Jackson et al., 2016; Nieves-Cintrón et al., 2015; Nieves-Cintrón et al., 2017; Nieves-Cintrón et al., 2018; Nystoriak et al., 2014; Straub et al., 2009), transcriptional remodeling through NFATc3 signaling (Nieves-Cintrón et al., 2015; Nieves-Cintrón et al., 2018; Nilsson et al., 2006; Nystoriak et al., 2014), and alterations in PKC/Rho kinase signaling (Abd-Elrahman et al., 2015; Hien et al., 2016; Kizub et al., 2010). Our group has additionally established, in human and mouse arterial tissue, PKA-mediated potentiation of LTCC activity via increased phosphorylation of the pore-forming CaV1.2 subunit at Ser1928 as a key event that contributes to vascular complications during diabetic hyperglycemia (Morotti et al., 2017; Navedo et al., 2010b; Nystoriak et al., 2017). The classic molecular machinery stimulating PKA activity implicates activation of upstream effector enzymes (e.g. AC) and G protein-coupled receptors (GPCR). In the present study, using native human arteries and arterial myocytes, we identified a Gs-coupled P2Y receptor with the molecular, pharmacological, and signaling properties of P2Y11 as the GPCR underlying the glucose triggering cascade that results in PKA-dependent potentiation of LTCCs (Figure 8D). Indeed, P2Y11 is known to associate with ACs to stimulate cAMP/PKA signaling (Communi et al., 1997; Pucéat et al., 1998). Similar results were observed in mouse arteries and arterial myocytes, indicating that a P2Y11-like receptor could be mediating the glucose response in these cells. The implications of these observations are profound, as they may shed light on unique mechanisms of diabetic vascular complications.
Elevations in extracellular glucose have been shown to promote autocrine release of nucleotides in a number of cells, including arterial myocytes (Costa et al., 2009; Hazama et al., 1998; Nilsson et al., 2006; Parodi et al., 2002). This glucose-induced release of nucleotides has been associated with increased global [Ca2+]i in arterial myocytes, but the mechanisms and functional implications were not clearly established (Nilsson et al., 2006). This prompted us to examine whether extracellular nucleotides could be mediating glucose effects on LTCC activity and vascular reactivity. Our first major finding was that hydrolysis of extracellular nucleotides by the ectonucleotidase apyrase prevented the increases in Ser1928 phosphorylation, LTCC activity and vasoconstriction in response to elevations in extracellular glucose (Figure 1). Outcomes from LTCC recordings under continuous flow or static bath conditions (Figure 1—figure supplement 2) further support the involvement of extracellular nucleotide signaling in mediating the glucose effects. Given the well-established function of extracellular nucleotides in activating P2Y receptors (see (von Kügelgen and Harden, 2011)), our studies also pointed to the potential contribution of at least one of the eight known P2Y receptors in this process. In line with this concept, our multidisciplinary approach using human tissue suggested involvement of a P2Y receptor fitting the profile for the P2Y11 subtype. Intriguingly, similar results were observed using mouse tissue/cells, suggesting a role for a P2Y11-like receptor. To date, this is the only Gs-coupled P2Y, which could activate AC, leading to increased cAMP synthesis and thereby PKA activation. Considering the essential actions of PKA on LTCC activity and vasoconstriction in response to elevated glucose (Morotti et al., 2017; Navedo et al., 2010b; Nystoriak et al., 2017), we submit that such changes may proceed through activation of this purinergic signaling pathway.
Few studies have examined the role of P2Y11 in the cardiovascular system. Current knowledge suggests that this receptor is associated with positive inotropic effects of ATP on cardiomyocytes and its activity seems to be impaired during cardiomyopathy (Balogh et al., 2005). Moreover, a polymorphism (Ala-87-Thr) in P2Y11 has been linked to increased risk of acute myocardial infarction and C-reactive protein blood levels (Amisten et al., 2007). These results indicate a role for P2Y11 in cardiac (dys)function. However, the functional significance of P2Y11 in the vasculature, and particularly in arterial myocytes, is virtually unknown. In the present study, Western blot analysis detected an immunoreactive band of the expected molecular weight for P2Y11 (e.g. ~40 ± 10 kDa) in human arterial lysates (Figure 2C). We confirmed robust distribution of the receptor at the expected plasma membrane location in isolated human arterial myocytes (Figure 2D). In line with the expected function for this GPCR, we corroborated localized subplasmalemmal cAMP synthesis upon receptor stimulation with a highly selective P2Y11 agonist (NF546 (Meis et al., 2010); Figure 5). Notably, 20 mM D-glucose triggered cAMP synthesis of the same magnitude as the NF546 compound, and simultaneous application of NF546 and 20 mM D-glucose did not have any additional effect when compared with individual treatment exposure, suggesting that both stimuli proceed through the same signaling pathway. In support of this possibility, the specific P2Y11 antagonist NF340 (Meis et al., 2010) blocked the NF546 and NF546 + 20 mM D-glucose effects on cAMP synthesis (Figure 5). The P2Y11 antagonist also prevented increased Ser1928 phosphorylation and LTCC activity in response to acute elevations in extracellular glucose (Figure 6), while the P2Y11 agonist NF546 recapitulated all the glucose-induced, PKA-dependent effects (Figure 7). Moreover, the NF340 compound hampered glucose-induced changes in Ser1928 phosphorylation levels and LTCC activity during chronic hyperglycemic conditions resembling those observed during diabetes (Figure 8). Altogether, these results revealed a role for human P2Y11 or mouse P2Y11-like receptor in arterial myocytes, particularly during glucose signaling, and suggest that this GPCR may be involved in the initiation and/or progression of arterial myocyte dysfunction leading to vascular complications during diabetic hyperglycemia. Our results may also have profound clinical implications as they add to a growing body of evidence implicating a role for altered P2Y11 function in a number of pathological conditions (Nishimura et al., 2017), which could make them a potential therapeutic target.
Our findings indicating that elevated extracellular glucose triggers PKA-dependent potentiation of LTCC activity to induce vasoconstriction were unexpected, as PKA activity has been traditionally associated with vasodilation due, in part, to increased K+ channel activity. A reasonable prediction was that glucose could influence LTCCs via a cAMP/PKA signaling pathway that is distinct from that governing K+ channels as occurs upon β adrenergic stimulation (Moore et al., 2014). Such separation in cAMP would require precise subsarcolemmal compartmentalization of key proteins and signaling molecules (including GPCR, signaling enzyme, second messenger, effector protein and substrate). In the case of PKA-dependent effects on LTCC function in response to elevated glucose, this separation would include seclusion of a Gs-coupled receptor, AC, PKA and CaV1.2. Indeed, Tajada et al recently showed that optimal ion channel regulation by effector proteins is constrained by their nanometer distance between each other (Tajada et al., 2017). In support of this possibility, our recent work revealed nanometer proximity of a subpopulation of CaV1.2 (~10% of CaV1.2 clusters) to pools of PKA (Nystoriak et al., 2017). Here, we found a close association (≤40–90 nm) between pools of P2Y11 and CaV1.2 as well as P2Y11 and PKA (Figure 3). Moreover, given the cAMP biosensor data demonstrating that both glucose and the P2Y11 agonist NF546 induce localized subsarcolemmal cAMP synthesis (Figure 5), it is also likely that P2Y11 may be in close proximity to a specific AC isoform in arterial myocytes - the identity of which remains to be established. Nevertheless, this implicates the formation of a distinctive nanomolecular domain likely containing P2Y11, AC, PKA and CaV1.2 in arterial myocytes (Figure 8D), although its confirmation is beyond the scope of this study. This nanodomain may ensure the necessary signaling compartmentalization required for PKA-mediated effects on LTCC activity and vascular reactivity in response to elevated glucose.
The spatial organization of the P2Y11/AC/PKA/CaV1.2 nanodomain could be facilitated by scaffold proteins, such as A kinase anchoring proteins (AKAPs). These AKAPs fine tune signal transduction by localizing GPCRs, signaling enzymes and effector proteins in close proximity to their substrates (Johnstone et al., 2018; Langeberg and Scott, 2015). The A kinase anchoring protein 150 (AKAP150; murine ortholog of human AKAP79) is of particular interest as it has been shown to interact with AC, PKA and CaV1.2 (Bauman et al., 2006; Efendiev et al., 2010; Gao et al., 1997; Murphy et al., 2014; Navedo et al., 2008; Nystoriak et al., 2017; Zhang et al., 2013). Intriguingly, although AKAP79/150 can associate with multiple GPCRs (Fraser et al., 2000; Zhang et al., 2011), no report to date has linked it to any purinergic receptor. Localization of P2Y11 within the same AKAP79/150-driven complex may be critical as this scaffold protein is necessary for increased L-type Ca2+ channel activity in response to elevated glucose (Nystoriak et al., 2017). Two possibilities that do not exclude a fundamental role for AKAP79/150 are 1) direct interaction of P2Y11 with the scaffold protein and/or 2) association of the receptor with a pool of CaV1.2 within the AKAP79/150 complex. Future studies should examine these exciting alternatives as they may provide further insight into mechanisms regulating LTCCs and vascular reactivity during diabetic hyperglycemia.
A lingering question is how nucleotides, such as ATP, are released in response to glucose to modulate arterial myocyte excitability. Although our data do not identify the specific nucleotide, ATP release is particularly interesting as this nucleotide is an effective vasoactive agent and the endogenous P2Y11 agonist (Communi et al., 1997; Kennedy, 2017; Schuchardt et al., 2012; von Kügelgen and Harden, 2011). Indeed, ATP can activate P2Y11 with an EC50 that ranges from 1.8 to 17 μM, depending on the readout and the cell type used (Communi et al., 1999; Haas et al., 2014; Meis et al., 2010; Qi et al., 2001). Moreover, P2Y11 can be activated by ATP/ATP-derived nucleotides with the following potency order: ATPγS > dATP > ATP>>>ADP, with other nucleotides such as UTP and UDP having minimal or no influence on receptor activation (Kennedy, 2017; Schuchardt et al., 2012; von Kügelgen and Harden, 2011). Our recent study suggested that glucose effects on LTCC activity and vascular reactivity require glucose transport into the cell and subsequent metabolism that can generate ATP (Nystoriak et al., 2017). ATP can then be transported out of the cell through ATP-binding cassettes, vesicular exocytosis, plasma membrane F1F0-ATPase, connexin hemichannels and pannexin channels to induce activation of P2Y11 (Lohman et al., 2012). We thus speculate that one of these ATP transporters could form part of the AKAP/P2Y11/AC/PKA/CaV1.2 nanocomplex to provide another layer of compartmentalization that facilitates PKA-dependent regulation of LTCC function and vascular reactivity in response to elevations in extracellular glucose.
In summary, our data in human and murine tissue provide evidence of a Gs-coupled purinergic receptor that fits the profile of P2Y11 or a P2Y11-like receptor, respectively, as a key upstream component in the signaling cascade regulating LTCC activity and vascular reactivity during diabetic hyperglycemia. Data start to define a unique nanomolecular complex likely formed by AKAP/P2Y11/AC/PKA/CaV1.2. This nanocomplex can organize glucose signaling and help explain the intriguing consequences of glucose-induced PKA activation on LTCC function and vascular reactivity, which may have significant pathological implications, and therapeutic potential to treat vascular complications during diabetic hyperglycemia.
Materials and methods
Key resources table
| Reagent type (species) or resource | Designation | Source or reference | Identifiers | Additional information |
|---|---|---|---|---|
| Strain (Mus musculus), C57BL/6J | wild-type | Jackson Laboratories | stock # 000664 | |
| Strain (Mus musculus) | S1928A | (Lemke et al., 2008) | ||
| Cell line (human embryonal kidney) | tsA-201 | Sigma-Aldrich | 96121229 | SV40 transformed |
| Oligodeoxynucleotide, sense | P2Y11 SNS ODN | Integrated DNA Technologies | human P2Y11 sequence (NC_000019.10): 5’-CAACGTCTCGGGTAAGGAGAA-3’ and 5’-ATGAGGAAGGAAACGTGGGT-3’ | last three bases on the 3’ end were phosphoro-thioated |
| Oligodeoxynucleotide, antisense | P2Y11 ANS ODN | Integrated DNA Technologies | human P2Y11 sequence (NC_000019.10): 5’-CAAGGCCACCCTAACCACTG-3’ and 5’-CTCTCCCTTCCCTGCGTTA-3’ | last three bases on the 3’ end were phosphoro-thioated |
| DNA construct | human P2Y11 | UMR cDNA Resource Center | www.cDNA.org; clone ID P2Y1100000 | tagged with GFP at C- terminus |
| Antibody | anti-FP1 (CaV1.2; custom rabbit) | (Davare et al., 2000) | dilutions: 1:100 for immunoblot and PLA; 10 µg/mL for GSD | |
| Antibody | anti-CH3P (pSer1928, custom rabbit) | (Davare et al., 2000) | 1:50-1:100 dilutions | |
| Antibody | anti-β-actin (mouse monoclonal) | Abcam | ab8226 RRID: AB_30637 | 1:1000 dilution |
| Antibody | anti-α-tubulin (mouse monoclonal) | Active Motif | 39527; clone 5-B-1–2 | 1:500 dilution |
| Antibody | anti-P2Y11 (rabbit polyclonal) | Abcam | ab180739 | 1:100-1:200 dilutions |
| Antibody | anti-P2Y11 (goat polyclonal) | Santa Cruz Biotechnology | sc-69588; clone C-18 RRID: AB_21559 | dilutions: 1:100 for stainings (PLA, classical) and 10 µg/mL for GSD |
| Antibody | anti-PKAcatα, β, γ (mouse monoclonal) | Santa Cruz Biotechnology | sc-28315; clone A-2 | 1:200 dilution |
| Antibody | PKAcatα, β, γ blocking peptide | Santa Cruz Biotechnology | sc-28315 P; clone A-2 | 1:20 dilution for 1 µg of primary antibody |
| Antibody | anti-PKAcat α, β, γ (rabbit polyclonal) | Santa Cruz Biotechnology | sc-28892; clone H-95 | dilutions: 1:200 for PLA and 10 µg/mL for GSD |
| Antibody | Alexa Fluor 488 conjugate of wheat germ agglutinin | Life Technologies | W7024 | |
| Antibody | Alexa Fluor 568-conjugated donkey anti-goat | Molecular Probes | A11057 RRID: AB_142581 | 5 mg/mL dilution |
| Antibody | Alexa Fluor 568-conjugated donkey anti-mouse | Molecular Probes | A10037 | 5 mg/mL dilution |
| Antibody | Alexa Fluor 568-conjugated donkey anti-rabbit | Molecular Probes | A11011 RRID: AB_143157 | 2 µg/mL dilution |
| Antibody | Alexa Fluor 647-conjugated donkey anti-goat | Molecular Probes | A21447 RRID: AB_141844 | 2 µg/mL dilution |
| Antibody | goat anti-rabbit IgG (H + L)-horseradish peroxidase conjugate | Bio-Rad | 170–6515 RRID: AB_11125142 | 1:10000 dilution |
| Antibody | goat anti-mouse IgG (H + L)-horseradish peroxidase conjugate | Bio-Rad | 170–6516 | 1:10000 dilution |
| Chemical compound, drug | sodium pentobarbital (Fatal-Plus) | Vortech Pharma-ceuticals | NDC 0298-9373-68 | |
| Chemical compound, drug | mannitol | Fisher Scientific | BP686 | |
| Chemical compound, drug | NF340 | Santa Cruz Biotechnology | sc-361274 | |
| Chemical compound, drug | NF546 | Tocris | 3892 | |
| Chemical compound, drug | apyrase | New England Biolabs | M0398L | |
| Chemical compound, drug | nifedipine | Sigma-Aldrich | N7634 | |
| Chemical compound, drug | Bay K-8644 | Sigma-Aldrich | 71145-03-4 | |
| Chemical compound, drug | forskolin | Sigma-Aldrich | F6886 | |
| Chemical compound, drug | amphotericin B | Sigma-Aldrich | A4888 | |
| Chemical compound, drug | MRS2578 | Santa Cruz Biotechnology | sc-204103A | |
| Chemical compound, drug | MRS2179 | Tocris | 1454889-37-2 | |
| Chemical compound, drug | protein kinase A inhbitor (PKI) | Sigma-Aldrich | P9115 | fragment 14–22, myristoylated trifluoroacetate salt |
| Chemical compound, drug | Rp-Adenosine 3’,5’-cyclic monophos-phorothioate triethylam-monium salt (rpcAMP) | Sigma-Aldrich | A165 | |
| Chemical compound, drug | Adenosine 5’-[γ-thio] triphosphate tetralithium salt (ATPγS) | Sigma-Aldrich | A1388 | |
| Software, algorithm | GraphPad Prism | GraphPad Prism, RRID: SCR_002798 | ||
| Software, algorithm | ImageJ | Fiji, RRID: SCR_002285 | ||
| Software, algorithm | pCLAMP10 | Molecular Devices | electrophysiology | |
| Software, algorithm | LASAF | Leica | GSD | |
| Software, algorithm | IonOptix | IonOptix | arterial diameter recordings | |
| Software, algorithm | Metaflor | Molecular Devices | FRET |
Animals
Male wild type C57BL/6J (wt) or knockin mice in which Ser1928 of CaV1.2 was mutated to Ala (S1928A) (Lemke et al., 2008) of 5 to 8 weeks of age were euthanized with a lethal dose of sodium pentobarbital (250 mg/kg; intraperitoneally), as approved by the University of California, Davis Animal Care and Use Committee (protocol #: 20321).
Human tissue
Request a detailed protocolExcised adipose arteries from human patients undergoing surgical sleeve gastrectomy were used for this study (Supplementary file 3). Samples were obtained after Institutional Review Board (IRB) approval from the University of Nevada Reno School of Medicine (IRB ID: 2013–019) and in accordance with the guidelines of the Declaration of Helsinki. The need for informed consent was waived by IRBs at the University of Nevada Reno School of Medicine (IRB ID: 2013–019) and the University of California Davis (IRB ID: 597267–1) because the tissue is considered ‘waste’, has no codification that could be used to identify patients and was determined not to be human subject research in accordance with United States of America federal regulations, as defined by 45 CFR 46.102(f). This precludes the acquisition of detailed clinical profiles other than sex, age and whether the patient is nondiabetic or diabetic. Only samples from nondiabetic patients were used. No exclusions were made due to medication history, sex or presence of comorbidities. Collected tissue was placed in cold phosphate-buffered saline (PBS) solution containing (in mM): 138 NaCl, 3 KCl, 10 Na2HPO4, 2 NaH2PO4, 5 D-glucose, 0.1 CaCl2, and 0.1 MgSO4, pH 7.4 with NaOH until used.
Arterial myocyte isolation
Request a detailed protocolMouse cerebral arteries were dissected in ice-cold dissection buffer containing (in mM): 140 NaCl, 5 KCl, 2 MgCl2, 10 D-glucose, 10 HEPES, pH 7.4, with NaOH. Arteries were digested in dissection buffer containing papain (1 mg/mL) and dithiothreitol (1 mg/mL) at 37° C for 7 min, followed by incubation in dissection buffer containing collagenase type F (0.7 mg/mL) and collagenase type H (0.3 mg/mL) at 37° C for 7 min. Arteries were washed in ice-cold dissection buffer and gently triturated with glass pipettes to disperse the cells, which were kept in ice-cold dissection buffer until use.
Single human arterial myocytes (Supplementary file 3) were isolated as previously described (Nieves-Cintrón et al., 2017; Nystoriak et al., 2017). Briefly, small diameter adipose arteries from human samples were enzymatically digested in dissection solution supplemented with papain (26 U/mL) and dithiothreitol (1 mg/mL) at 37° C for 15 min, followed by incubation in dissection solution containing collagenase type H (1.95 U/mL), elastase (0.5 mg/mL), and trypsin inhibitor (1 mg/mL) at 37° C for 10 min. Cells were then washed three times in ice-cold dissection buffer, triturated with glass pipettes to disperse the individual cells, and maintained in ice-cold dissection buffer until use.
For unpassaged, cultured human and mouse arterial myocytes, human adipose arteries and mouse aortas were dissected out and placed in ice-cold Dulbecco’s Modified Eagle Medium (DMEM; Gibco – Life Technologies, Grand Island, NY) containing 1X glutamate, 1X pyruvate, 1X penicillin/streptavidin and fungizone (0.25 g/mL). Artery segments were subsequently transferred and incubated in a DMEM solution containing 2.2 mg/mL of collagenase Type 2 (Worthington) at 37° C for 15 min to remove the adventitia. To disperse and culture unpassaged arterial myocytes, the tissue was cut into 2–5 mm segments and incubated at 37° C with constant shaking in a buffer containing (in mM): 134 NaCl, 6 KCl, CaCl2, 10 HEPES, and 7 D-glucose supplemented with 2.2 mg/mL collagenase Type 2 (Worthington). The digestion was stopped by adding an equal volume of DMEM containing 5% fetal bovine serum. Digested tissue was then centrifuged for 5 min at 14,000 rpm. The supernatant was removed and the pellet containing the digested tissue was resuspended in DMEM containing 1X glutamate, 1X pyruvate, 5% serum and 5 mM D-glucose, resulting in dispersion of individual arterial myocytes. Cells were then seeded on glass coverslips coated with laminin and kept in an incubator at 37° C with 5% CO2 for 2–3 days before adenoviral transduction or lysis for immunoblotting (see section below).
Arterial diameter measurements
Request a detailed protocolFreshly isolated posterior mouse cerebral arteries were cannulated on glass micropipettes mounted in a 5 mL myograph chamber (University of Vermont Instrumentation and Model Facility), as described previously (Nieves-Cintrón et al., 2017; Nystoriak et al., 2014; Nystoriak et al., 2017). Arteries were allowed to equilibrate at an intravascular pressure of 20 mmHg, while being continuously superfused (37° C, 30 min, 3–5 mL/min) with physiological saline solution composed of (in mM): 119 NaCl, 4.7 KCl, 2 CaCl2, 24 NaHCO3, 1.2 KH2PO4, 1.2 MgSO4, 0.023 EDTA, and 10 D-glucose aerated with 5% CO2/95% O2. Bath pH was closely monitored and maintained at 7.35 to 7.4. After equilibration, intravascular pressure was increased to 60 mmHg and arteries allowed to develop stable myogenic tone. Arteries not exhibiting stable tone after ~1 hr were discarded. To assess the response of arterial diameter to hyperglycemia, D-glucose was increased from 10 mM to 20 mM in the perfusion solution. Arterial tone data are presented as a percent decrease in diameter relative to the maximum passive diameter at 60 mmHg obtained using Ca2+-free saline solution containing nifedipine (1 µM) at the end of the experiment.
Electrophysiology
Request a detailed protocolAll experiments were performed at room temperature (22–25° C). Both whole-cell and single-channel data were acquired using an Axopatch 200B amplifier and Digidata 1440 digitizer (Molecular Devices). Recording electrodes were pulled from borosilicate capillary glass using a micropipette puller (model P-97, Sutter Instruments) and subsequently polished to achieve resistances that ranged from 3.5 to 6.5 MΩ. L-type Ca2+ channel currents were assessed in freshly dissociated arterial myocytes using the perforated whole-cell mode of the patch-clamp technique with Ba2+ as a charge carrier (IBa) after myocytes were allowed to attach (10 min) to a glass coverslip in a recording chamber. Borosilicate glass pipettes were filled with a solution containing (in mM): 120 CsCl, 20 tetraethylammonium chloride (TEA-Cl), 1 EGTA, and 20 HEPES with amphotericin B (250 µg/mL; pH adjusted to 7.2 with CsOH). The bath solution consisted of (in mM): 115 NaCl, 10 TEA-Cl, 0.5 MgCl2, 10 D-glucose, 5 CsCl, 20 BaCl2, and 20 HEPES, pH adjusted to 7.4 with CsOH. IBa were elicited by 200 ms depolarizing pulses from a holding potential of −70 mV to +10 mV. IBa were first recorded in the presence of 10 mM D-glucose under static flow conditions. This solution was then exchanged for a solution containing either 20 mM D-glucose, 20 mM mannitol or NF546 at a rate of 2.1 mL/min. Flow was stopped after 3 min, and IBa were recorded again under static flow conditions at least 5 min after the indicated treatment was initiated. In some experiments, arterial myocytes were pretreated for 10–15 min with indicated inhibitors prior to IBa recordings. For experiments comparing IBa before and after elevated glucose under continuous flow and static bath conditions, cells were patched in a bath solution containing 10 mM D-glucose at a perfusion rate of 2.1 mL/min. After establishment of a stable gigaseal for at least 5 min, IBa were recorded in the presence of 10 mM D-glucose under continuous flow. Those cells that showed robust IBa in 10 mM D-glucose were then perfused with a bath solution containing 20 mM D-glucose under continuous flow for at least 5 min before recording of IBa again. Subsequently, IBa were recorded one more time on the same cell, 5 min after stopping the bath perfusion (e.g. static bath conditions). Currents were sampled at 10 kHz and low pass-filtered at 5 kHz. The CaV1.2 blocker nifedipine (1 μM) was applied at the end of each experiment to determine the nifedipine-sensitive component. The I-V relationship of nifedipine-sensitive IBa was determined by 200 ms depolarizing steps from −70 mV to voltages ranging from −60 to +60 mV in increments of +10 mV. The I-V relationship for averaged data sets was fit with a peak Gaussian function: I(V)=Imax x exp(−0.5((V – Vmax)/b)2), where Imax is peak I, Vmax is V at Imax, and b is the slope of the distribution, as described previously (Nystoriak et al., 2017). A voltage error of 10 mV attributable to the liquid junction potential of the recording solutions was corrected offline.
The cell-attached configuration of the patch-clamp technique was used to examine single-channel Ca2+ currents in arterial myocytes using Ca2+ as the charge carrier, as previously described (Cheng et al., 2011; Dixon et al., 2015; Dixon et al., 2012; Navedo et al., 2010a; Nystoriak et al., 2017). Resting membrane potential was fixed to ~0 mV using a high K+ bath solution (Hess et al., 1986; Zampini et al., 2006) composed of (in mM): 145 KCl, 10 NaCl, and 10 HEPES, pH adjusted to 7.4 with NaOH. Pipette solution was composed of (in mM): 120 TEA-Cl, 110 CaCl2, and 10 HEPES with BayK-8644 (500 nM), which promotes longer open times of the channel thereby increasing the probability of sweeps with channel activity. Single L-type Ca2+ currents were elicited by a 2 s depolarizing step from a holding of −70 mV to −30 mV. Single-channel currents were sampled at 10 kHz and low pass filtered at 2 kHz, followed by a Gaussian filter (500 Hz) during analysis. Capacitive currents were compensated by subtraction of blank sweeps. When nifedipine was included in the patch pipette, CaV1.2 activity was negligible. Single-channel openings and nPo were analyzed using the single-channel event half-amplitude detection algorithm from pCLAMP 10.
Immunoprecipitation and immunoblotting
Request a detailed protocolHuman adipose arteries, mouse cerebral and mesenteric arteries, and mouse arterial myoyctes were homogenized in a RIPA lysis buffer solution composed of 50 mM Tris-HCl (pH 7.4), 150 mM NaCl, 5 mM EGTA, 10 mM EDTA, 1% nonyl phenoxypolyethoxylethanol-40 (NP-40), 10% glycerol, 0.05% sodium dodecyl sulfate (SDS), 0.4% deoxycholic acid (DOC) with protease inhibitors (1 µg/ml pepstatin A, 10 µg/ml leupeptin, 20 µg/mL aprotinin, and 200 nM phenylmethylsulfonyl fluoride) and phosphatase inhibitors (2 µM microcystin LR, 1 mM p-nitrophenyl phosphate, 50 mM Na-pyrophosphate, and 50 mM NaF), then sonicated for 5 min at 4° C and cleared by centrifugation (15,000 X g) for 20 min at 4° C. For Ser1928 phosphorylation experiments, the soluble fraction was incubated on a head-over-head tilter with protein A-Sepharose beads and a purified custom antibody against CaV1.2 (5 µg of FP1; see Davare et al., 2000) or nonspecific rabbit immunoglobulin G (IgG) control for 4 hr at 4° C. Beads were washed three times with washing buffer containing (in mM): 150 NaCl, 10 EDTA, 10 EGTA, 10 Tris-HCl (pH 7.4), 0.1% Triton X-100, pH 7.4. Samples were extracted in Laemmli Sample Buffer (Bio-Rad) for 5 min at 95° C for immunoprecipitation (Ser1928 phosphorylation) experiments and 15 min at 80° C for other immunoblot experiments. Proteins were separated by SDS-polyacrylamide gel electrophoresis at 75–100 V for 1.5 hr in a stacking gel polymerized from 3% acrylamide and a resolving phase polymerized from 7.5% (Ser1928 phosphorylation) or 10% acrylamide. Proteins were then transferred to a polyvinylidene difluoride membrane at 50 V for 600 min at 4° C. All membranes, except for P2Y11 blots (10% Odyssey blocking buffer; LI-COR Biosciences), were blocked in 5% nonfat dried milk in tris-buffered saline with 0.05% Tween 20 (TBS-T) for 1 hr at room temperature before primary antibody incubation for 2–3 hr at room temperature. Antibodies and dilutions were as follows: rabbit anti-CH3P (pSer1928; 1:50-1:100),(Davare et al., 2000) rabbit anti-FP1 (CaV1.2; 1:100) (Davare et al., 2000), rabbit anti-P2Y11 (Abcam, 1:100-1:200); mouse anti-β-actin (Abcam, 1:1000), and anti α-tubulin (Active Motif, 1:500). Except for the P2Y11 antibody, which was diluted in 1% bovine serum albumin, all antibodies were diluted in 5% nonfat dried milk in TBS-T. After washing, membranes were then incubated 1 hr at room temperature with horseradish peroxidase-labeled goat anti-rabbit (Bio-Rad; 1:10,000) or goat-anti-mouse antibodies (Bio-Rad; 1:10,000) diluted in 5% nonfat dried milk in TBS-T or 5% Odyssey in TBS-T (P2Y11 only) and developed on autoradiography film using chemiluminescence (Classico [Millipore] and Femto [Thermo Fisher Scientific]). For Ser1928 phosphorylation and P2Y11 knock down experiments, total CaV1.2 and β-actin, respectively, were used for normalization (density expressed as percentage of total CaV1.2/β-actin and these ratios were normalized to the ratio of the control band to get the relative density of pSer1928/CaV1.2 or P2Y11/β-actin for all treatments). For Ser1928 phosphorylation quantification in Figure 1—figure supplement 1E, triplicates were run in parallel and all values were normalized to the ratio of the loading control band (e.g. α-tubulin obtained from the same samples) to get the pSer1928/α-tubulin ratio for all treatments. The pSer1928/α-tubulin ratios were then normalized to the first control band ratio to obtain the relative density of pSer1928/α-tubulin. Densitometry analysis for bands was performed with ImageJ software (National Institutes of Health) as follow. Developed films were scanned to tiff files, uploaded to ImageJ and color inverted. Immunoreactive bands were outlined and light intensity per area was measured. Doublet bands were outlined and measured as one signal. Intensity of equal area above and below each immunoreactive band was measured to average and then subtract the background signal. Importantly, films were exposed for increasing time periods to ensure signals were in the linear range as described in Davare and Hell (2003) and Hall et al. (2006). β-actin and α-tubulin were used as a loading control in some experiments.
Organ culture
Request a detailed protocolFreshly isolated arteries for acute Ser1928 phosphorylation experiments were incubated for 5 min at room temperature in a physiological saline solution composed of (in mM): 119 NaCl, 4.7 KCl, 2 CaCl2, 24 NaHCO3, 1.2 KH2PO4, 1.2 MgSO4, 0.023 EDTA, and 10 (5 for humans) D-glucose aerated with 5% CO2/95% O2 to reach a pH of 7.35–7.4. Arteries were then incubated for 10 min at room temperature in a similar physiological solution containing the specified treatment. Following incubation, arteries were immediately placed in RIPA lysis buffer with protease and phosphatase inhibitors (as described in immunoblotting section). For chronic exposure experiments, arteries were placed in DMEM/F-12 (Gibco-Life Technologies, Grand Island, NY) supplemented with L-glutamine (2 mM) containing 10 mM, 20 mM D-glucose or 20 mM mannitol in the absence or presence of 10 µM NF340 and incubated for 48 hr at 37° C. After incubation, arteries were quickly washed in PBS and then placed in RIPA lysis buffer with protease and phosphatase inhibitors for immunoblotting.
Immunofluorescence
Request a detailed protocolImmunofluorescent labeling of freshly dissociated arterial myocytes was performed as described previously (Navedo et al., 2008), using a goat-anti P2Y11 (Santa Cruz Biotechnology, clone C-18; 1:100) or a mouse-anti PKAcat α, β, γ (Santa Cruz Biotechnology, clone A-2, 1:200) antibodies in PBS supplemented with 0.1% BSA. Alexa Fluor 488 conjugated wheat germ agglutinin (WGA; Life Technologies) was used to stain for the plasma membrane. The secondary antibodies were Alexa Fluor 568-conjugated donkey anti-goat and donkey anti-mouse (5 mg/mL; Molecular Probes). In control experiments, the PKAcat antibody was preabsorbed with a PKAcat blocking peptide (Santa Cruz Biotechnology, A-2; 1:20 for 1 μg of primary antibody). Cells were imaged (512 × 512 pixel images) using an Olympus FV1000 confocal microscope paired with an Olympus 60x oil immersion lens (NA = 1.4) and a zoom of 3.0 (pixel size = 0.1 µm). P2Y11-associated fluorescence was not detected in negative control experiments in which the primary antibody was substituted for PBS or boiled to test for antibody specificity. Cells for each group were imaged with the same laser power, gain settings, and pinhole.
Proximity ligation assay
Request a detailed protocolA Duolink In Situ PLA kit (Sigma) (Fredriksson et al., 2002) was used to detect complexes consisting of P2Y11 and CaV1.2 and P2Y11 and PKAcat in freshly isolated arterial myocytes as previously described (Nieves-Cintrón et al., 2017; Nystoriak et al., 2017). Briefly, cells were plated on glass coverslips and allowed to adhere (1 hr, room temperature) prior to fixing with 4% paraformaldehyde (20 min), quenching in 100 mM glycine (15 min), and washing in PBS (2 × 3 min). Cells were permeabilized with 0.1% Triton X-100 (20 min) and then blocked (1 hr, 37° C) in 50% Odyssey blocking solution (LI-COR Bioscience). Cells were incubated overnight at 4° C with a specific combination of two primary antibodies in 0.1% Odyssey +0.05% Triton X-100 PBS solution: goat anti-P2Y11 (Santa Cruz Biotechnology, clone C-18; 1:100), custom rabbit anti-FP1 (CaV1.2, 1:100) (Davare et al., 2000) and rabbit anti-PKAcat α, β, γ (Santa Cruz Biotechnology, clone H-95, 1:200). Cells were incubated with only one primary antibody as negative controls. After primary antibody incubation, cells were washed with Duolink buffer A (2 × 5 min). Oligonucleotide-conjugated secondary antibodies (PLA probes: anti-goat MINUS and anti-rabbit PLUS) were used to detect P2Y11 and CaV1.2 and P2Y11 and PKAcat (1 hr, 37° C). Following incubation with probes, cells were washed with Duolink buffer A (2 × 5 min) and a ligation solution composed of two distinct oligonucleotides, complementary to the probes, and ligase was added (30 min, 37° C) to allow hybridization with the probes and formation of a closed DNA circle at sites of dual labeling, which serves as a template for a rolling circle amplification reaction (100 min, 37° C). After the amplification step, cells were washed with Duolink buffer B (2 × 10 min) and 1% buffer B (1 × 1 min). Coverslips were allowed to dry and subsequently mounted on a microscope slide with Duolink mounting medium. The fluorescence signal was detected using an Olympus FV1000 confocal microscope coupled with a 60x oil immersion lens (NA, 1.4). Images were collected at different optical planes (z-axis step = 0.5 µm). The stack of images for each sample was combined into a single-intensity projection image that was subsequently used for analysis of number of puncta/µm2 per cell.
Immunolabeling and Ground State Depletion (GSD) microscopy
Request a detailed protocolIsolated arterial myocytes were allowed to adhere to a coverslip (1 hr) before fixing with 3% paraformaldehyde +0.1% glutaraldehyde solution in PBS (10 min) followed by washes with PBS (3 × 15 min). Cells were then incubated for 5 min with 0.1% sodium borohydride in H2O, followed by 3 × 5 min washes with PBS and incubated in permeabilization/blocking solution consistent of 0.05% Triton X-100% and 20% SEA BLOCK (Thermo Scientific) for 1 hr at room temperature. Cells were exposed overnight to primary antibodies [goat anti-P2Y11 (Santa Cruz Biotechnology, clone C-18), custom rabbit anti-CaV1.2 (FP1 (Davare et al., 2000)) or rabbit anti-PKAcat α, β, γ (Santa Cruz Biotechnology, clone H-95)] diluted in blocking buffer to a concentration of 10 µg/mL. Cells were briefly washed 3x with PBS, followed by additional longer washes (3x for 15 min). For secondary antibodies, donkey Alexa Fluor 647-conjugated antibody recognizing goat IgG (2 µg/mL; Molecular Probes) and donkey Alexa Fluor 568-conjugated antibody recognizing rabbit IgG (2 µg/mL; Molecular Probes) diluted in blocking buffer were added for 1 hr at room temperature. Secondary Ab was washed 3x with PBS, followed by longer washes (3x for 15 min). Specificity of secondary antibodies was tested in control experiments in which primary antibodies were omitted from the preparation (no 1° antibody controls). For imaging, coverslips were mounted on microscope slides with a round cavity containing MEA-GLOX imaging buffer (NeoLab Migge Laborbedarf-Vertriebs GmbH, Germany) and sealed with Twinsil (Picodent, Germany). The imaging buffer was composed of 10 mM MEA (cysteamine), 0.56 mg/mL glucose oxidase, 34 µg/mL catalase, and buffer containing 10% w/v glucose, 10 mM NaCl, and 50 mM Tris-HCl, pH 8.
Super-resolution images of arterial myocytes were obtained using a super resolution ground state depletion system (SR-GSD, Leica) dependent on stochastic single-molecule localization, equipped with high-power lasers (532 nm, 2.1 kW/ cm2; 642 nm, 2.1 kW/ cm2) and an additional 30 mW, 405 nm laser. A 160x HCX Plan-Apochromat (NA 1.47) oil immersion lens and an electron-multiplying charge-coupled device (EMCCD) camera (iXon3 897; Andor Technology) were used to acquire images (Dixon et al., 2015). The camera was running in frame-transfer mode at a frame rate of 100 Hz (10 ms exposure time). Fluorescence was detected through Leica high-power TIRF filter cubes (532 HP-T, 642 HP-T) with emission band-pass filters of 550–650 nm and 660–760 nm. Reconstruction of P2Y11, CaV1.2, and PKA distribution from 30,000 images used the coordinates of centroids obtained by fitting single-molecule fluorescence signals with a 2D Gaussian function using a LASAF software (Leica). The localization accuracy of the system is limited by the statistical noise of photon counting; the precision of localization is proportional to DLR/√N, where DLR is the diffraction-limited resolution of a fluorophore and N is the average number of detected photons per switching event, assuming the point-spread functions are Gaussian (Dempsey et al., 2011; Fölling et al., 2008). The full width at half maximum for single-molecule signals was ~20 nm as recently calculated by our group (Tajada et al., 2017). Localizations produced from less than 800 photons were filtered out of the reconstruction. All pixels with intensity above a user-defined threshold were binarized, evaluated and segmented into individual objects and included as clusters in our analysis. Cluster size and density were determined using the Analyze Particle option in the ImageJ software (National Institute of Health). The JACoP plug-in in the ImageJ software was used to unbiasedly and automatically determine the shortest intermolecular distances for P2Y11 and CaV1.2 as well as P2Y11 and PKAcat following the protocol described by Bolte and Cordelières (2006). Intermolecular distance histograms were generated from the JACoP plug-in output data and fitted with a sum of two Gaussian functions of the following equation: Y =Y0 + (A1 / (w1 x √(π/2))) x exp(−2 x ((X - XC1)/w1)2) + (A2 / (w2 x √(π/2))) x exp(−2 x ((X - XC2)/w2)2), where Y0 is the Y offset, A1 and A2 are the areas of the distribution of distances, XC1 and XC2 are the x values of distance at the center of the distribution, and w1 and w2 are the widths of each distribution in nanometers. To calculate the percentage of complete P2Y11 overlap, we first quantified the number of clusters/objects in the thresholded, binarized localization maps for P2Y11 and CaV1.2 as well as P2Y11 and PKAcat using the Analyze Particle tool in ImageJ. The binarized localization maps of P2Y11 were then multiplied by those corresponding to the paired CaV1.2 or PKAcat localization maps. The number of objects obtained from this operation were then divided by the number of clusters/objects present in the original binarized localization maps for P2Y11. This method only detects objects that are 100% overlapping with each other in two independent images (e.g localization maps for P2Y11 and CaV1.2). Random simulation of image pairs for P2Y11 and CaV1.2 or P2Y11 and PKAcat were generated based on the original super-resolution localization maps for each pair of proteins using the Coste’s randomization algorithm included in the JACoP plug-in in ImageJ (Bolte and Cordelières, 2006) from six different cells per condition. Parameters for the Coste’s randomization algorithm were selected to generate simulated images with relative similar cluster size and density to those observed in the original super-resolution localization maps for each protein. Each randomized image was generated after undergoing 1000 randomization rounds. Randomized images were binarized prior to analysis and the percentage of complete P2Y11 overlap from the randomized image pairs was calculated as described above.
Cell culture, transfection of tsA-201 cells, and reverse permeabilization
Request a detailed protocoltsA-201 were obtained from Sigma-Aldrich (cat#: ECACC 96121229). These cells are included in the European Collection of Authenticated Cell Cultures. tsA-201 cells were cultured in DMEM supplemented with 1X pyruvate, 1X glutamax, 8% fetal bovine serum (FBS) and 5 mM glucose (without phenol red) at 37° C in a 5% CO2 incubator. Cells were transfected at 60–70% confluence with human P2Y11 tagged with GFP at C-terminus (UMR cDNA Resource Center - www.cDNA.org; clone ID P2Y1100000) with JetPRIME transfection reagent (Polyplus transfection SA, NY) for approximately 36 hr. P2Y11 sense and antisense oligodeoxynucleotides (ODNs; 2 µM; Integrated DNA Technologies) were transfected in tsA-201 cells 24 hr after initial transfection with P2Y11-GFP. The cells were gently washed with 1X PBS and then removed with a cell scrapper using a RIPA lysis buffer solution composed of 50 mM Tris base, 150 mM NaCl, 5 mM EGTA, 10 mM EDTA, 1% nonyl phenoxypolyethoxylethanol-40 (NP-40), 10% glycerol, 0.05% sodium dodecyl sulfate (SDS), 0.4% deoxycholic acid (DOC) with protease inhibitors (1 µg/mL pepstatin A, 10 µg/mL leupeptin, and 20 µg/mL aprotinin). Antisense and sense ODNs for P2Y11 were designed and checked for specificity using Prime BLAST against the human P2Y11 sequence (NC_000019.10). The sequences used for the antisense ODNs were as follows: 5’-CAAGGCCACCCTAACCACTG-3’ and 5’-CTCTCCCTTCCCTGCGTTA-3’. The sequences for sense ODNs were 5’-CAACGTCTCGGGTAAGGAGAA-3’ and 5’-ATGAGGAAGGAAACGTGGGT-3’. For all ODNs, the last three bases on the 3’ end were phosphorothioated to reduce degradation by cellular nucleases. ODNs were dissolved in nuclease-free water to a 1 mM concentration.
Human adipose arteries were permeabilized in a solution containing (in mM): 120 KCl, 2 MgCl2, 10 EGTA, 5 Na2ATP, 20 TES (2-[(2-Hydroxy-1, 1-bis(hydroxymethyl)ethyl)amino] ethanesulfonic acid, N-[Tris(hydroxymethyl)methyl]−2-aminoethanesufonic acid), pH adjusted to 6.8 with NaOH. Arteries were first incubated in permeabilization solution for 20 min at 4°C, followed by a 4 hr incubation at 4°C in a solution supplemented with ODNs (2 µM). Arteries were placed in an ODN-containing solution with elevated MgCl2 (10 mM) for 1 hr at room temperature. Permeabilization was reversed by incubating arteries for 30 min at room temperature in MOPS physiological solution composed of (in mM): 140 NaCl, 5 KCl, 10 MgCl2, 5 D-glucose, and 2 MOPS, pH adjusted to 7.1 with NaOH. Arteries were incubated in a MOPS solution containing 0.01, 0.1, and 1.8 mM CaCl2 in 15 min intervals, increasing Ca2+ gradually. After completing reverse permeabilization, arteries were cultured in D-MEM/F-12 culture media supplemented with L-glutamine (2 mM) for 2.5 days at 37°C. Arteries were then lysed and used for Western blot (see Immunoblotting section).
Adenovirus infection of unpassaged arterial myocytes and Fluorescence Resonance Energy Transfer (FRET)
Request a detailed protocolLaminin (Life Technologies, Grand Island, NY) diluted 100x in sterile-filtered PBS (137 mM NaCl, 2.7 mM KCl, 10 mM Na2HPO4, 1.8 mM KH2PO4, pH = 7.4) was used to coat #0 glass coverslips (Karl Hecht, Sondheim, Germany). After adding diluted laminin (100 µL per coverslip), coverslips were placed in a 37° C incubator with 5% CO2 for a minimum of 2 hr, then moved to 24-well plate wells (Falcon, Tewksbury, MA), and washed 3x with sterile-filtered PBS. Freshly dissociated human adipose arterial myocytes and mouse aortic cells were plated on the laminin-coated coverslips with 500 μL of serum-containing media for 48 hr in a 37° C incubator with 5% CO2. Media was then replaced with 500 μL of serum-free media-containing virus coding for the membrane-targeted Epac1-camps-based FRET sensor (ICUE3-PM) (Allen et al., 2006; Liu et al., 2011) and placed at 37° C with 5% CO2 for another 36 hr. Viruses were produced using the AdEasy system (Qbiogene, Carlsbad, CA) (Luo et al., 2007). After infection, media was changed to serum-free media without virus. Glass coverslips were transferred to glass bottom culture dishes (MatTek, Ashland, MA) containing 3 mL PBS at room temperature.
A Zeiss AXIO Observer A1 inverted fluorescence microscope (San Diego, CA) equipped with a Hamamatsu Orca-Flash 4.0 digital camera (Bridgewater, NJ) and controlled by Metaflor software (Molecular Devices, Sunnyvale, CA) acquired phase contrast, CFP480, and FRET images. Phase contrast and CFP480 images were collected with 20x and 40x oil immersion objective lenses, while FRET images were collected using only the 40x oil immersion objective lens. Images for FRET analysis were recorded by exciting the donor fluorophore at 430–455 nm and measuring emission fluorescence with two filters (475DF40 for cyan and 535DF25 for yellow). Images were subjected to background subtraction and acquired every 30 s with exposure time of 200 ms for each channel. The donor/acceptor FRET ratio was calculated and normalized to the ratio value of baseline. CFP480 images were acquired by exciting the donor fluorophore at 430–455 nm and measuring emission fluorescence with the 475DF40 filter for 25 ms. Averages of normalized curves and maximal response to stimulation were graphed based on FRET ratio changes. Binding of cAMP to ICUE3-PM led to decreases in the YFP/CFP ratio, indicating increases in cAMP levels.
Chemicals and statistics
Request a detailed protocolAll chemical reagents were from Sigma-Aldrich (St. Louis, MO) unless otherwise stated. Data were analyzed using GraphPad Prism software and expressed as mean ±SEM. Data were assessed for potential outliers using the GraphPad Prism Outlier Test and for normality of distribution using appropriate tests. Statistical significance was then determined using suitable paired or unpaired Student’s t-test, nonparametric tests or One-way analysis of variance (ANOVA) for multiple comparisons with proper post hoc test. p<0.05 was considered statistically significant (denoted by * in figures).
Data availability
All data generated or analyzed during this study are included in the manuscript as supporting files - source data files for each dataset.
References
-
Abnormal Rho-associated kinase activity contributes to the dysfunctional myogenic response of cerebral arteries in type 2 diabetesCanadian Journal of Physiology and Pharmacology 93:177–184.https://doi.org/10.1139/cjpp-2014-0437
-
Reading dynamic kinase activity in living cells for high-throughput screeningACS Chemical Biology 1:371–376.https://doi.org/10.1021/cb600202f
-
Hyperglycemia and the pathobiology of diabetic complicationsAdvances in Cardiology 45:1–16.https://doi.org/10.1159/000115118
-
Phospholipase C and cAMP-dependent positive inotropic effects of ATP in mouse cardiomyocytes via P2Y11-like receptorsJournal of Molecular and Cellular Cardiology 39:223–230.https://doi.org/10.1016/j.yjmcc.2005.03.007
-
Participation of peripheral P2Y1, P2Y6 and P2Y11 receptors in formalin-induced inflammatory pain in ratsPharmacology Biochemistry and Behavior 128:23–32.https://doi.org/10.1016/j.pbb.2014.11.001
-
A guided tour into subcellular colocalization analysis in light microscopyJournal of Microscopy 224:213–232.https://doi.org/10.1111/j.1365-2818.2006.01706.x
-
Purinergic receptors regulate myogenic tone in cerebral parenchymal arteriolesJournal of Cerebral Blood Flow & Metabolism 33:293–299.https://doi.org/10.1038/jcbfm.2012.169
-
Intensive glycemic control and cardiovascular disease: an updateNature Reviews Cardiology 7:369–375.https://doi.org/10.1038/nrcardio.2010.35
-
Cloning of a human purinergic P2Y receptor coupled to phospholipase C and adenylyl cyclaseJournal of Biological Chemistry 272:31969–31973.https://doi.org/10.1074/jbc.272.51.31969
-
Pharmacological characterization of the human P2Y11 receptorBritish Journal of Pharmacology 128:1199–1206.https://doi.org/10.1038/sj.bjp.0702909
-
Mechanisms of diabetic vasculopathy: an overviewAmerican Journal of Hypertension 14:475–486.https://doi.org/10.1016/S0895-7061(00)01323-6
-
High glucose changes extracellular adenosine triphosphate levels in rat retinal culturesJournal of Neuroscience Research 87:1375–1380.https://doi.org/10.1002/jnr.21956
-
The A-kinase anchor protein MAP2B and cAMP-dependent protein kinase are associated with class C L-type calcium channels in neuronsJournal of Biological Chemistry 274:30280–30287.https://doi.org/10.1074/jbc.274.42.30280
-
Pathophysiologic approach to therapy in patients with newly diagnosed type 2 diabetesDiabetes Care 36 Suppl 2:S127–S138.https://doi.org/10.2337/dcS13-2011
-
A critical look at the function of the P2Y11 receptorPurinergic Signalling 12:427–437.https://doi.org/10.1007/s11302-016-9514-7
-
Protein detection using proximity-dependent DNA ligation assaysNature Biotechnology 20:473–477.https://doi.org/10.1038/nbt0502-473
-
Cell surface measurements of ATP release from single pancreatic β cells using a novel biosensor techniquePfl�Gers Archiv European Journal of Physiology 437:31–35.https://doi.org/10.1007/s004240050742
-
Distinct and complementary roles for α and β isoenzymes of PKC in mediating vasoconstrictor responses to acutely elevated glucoseBritish Journal of Pharmacology 173:870–887.https://doi.org/10.1111/bph.13399
-
cAMP signaling compartmentation: adenylyl cyclases as anchors of dynamic signaling complexesMolecular Pharmacology 93:270–276.https://doi.org/10.1124/mol.117.110825
-
P2Y11receptors: properties, distribution and functionsAdvances in Experimental Medicine and Biology 1051:107–122.https://doi.org/10.1007/5584_2017_89
-
Involvement of P2Y1 and P2Y11 purinoceptors in parasympathetic inhibition of colonic smooth muscleJournal of Pharmacology and Experimental Therapeutics 324:1055–1063.https://doi.org/10.1124/jpet.107.131169
-
Influence of type II diabetes on arterial tone and endothelial function in murine mesenteric resistance arteriesJournal of Vascular Research 38:578–589.https://doi.org/10.1159/000051094
-
Signalling scaffolds and local organization of cellular behaviourNature Reviews Molecular Cell Biology 16:232–244.https://doi.org/10.1038/nrm3966
-
Unchanged beta-adrenergic stimulation of cardiac L-type calcium channels in ca v 1.2 phosphorylation site S1928A mutant miceJournal of Biological Chemistry 283:34738–34744.https://doi.org/10.1074/jbc.M804981200
-
FRET-based direct detection of dynamic protein kinase A activity on the sarcoplasmic reticulum in cardiomyocytesBiochemical and Biophysical Research Communications 404:581–586.https://doi.org/10.1016/j.bbrc.2010.11.116
-
Mechanisms of ATP release and signalling in the blood vessel wallCardiovascular Research 95:269–280.https://doi.org/10.1093/cvr/cvs187
-
NF546 [4,4'-(carbonylbis(imino-3,1-phenylene-carbonylimino-3,1-(4-methyl-phenylene)-carbonylimino))-bis(1,3-xylene-alpha,alpha'-diphosphonic acid) tetrasodium salt] is a non-nucleotide P2Y11 agonist and stimulates release of interleukin-8 from human monocyte-derived dendritic cellsJournal of Pharmacology and Experimental Therapeutics 332:238–247.https://doi.org/10.1124/jpet.109.157750
-
Exercise restores coronary vascular function independent of myogenic tone or hyperglycemic status in db/db miceAmerican Journal of Physiology-Heart and Circulatory Physiology 295:H1470–H1480.https://doi.org/10.1152/ajpheart.00016.2008
-
Elevated Ca2+ sparklet activity during acute hyperglycemia and diabetes in cerebral arterial smooth muscle cellsAmerican Journal of Physiology-Cell Physiology 298:C211–C220.https://doi.org/10.1152/ajpcell.00267.2009
-
Selective down-regulation of KV2.1 function contributes to enhanced arterial tone during diabetesThe Journal of Biological Chemistry 290:7918–7929.https://doi.org/10.1074/jbc.M114.622811
-
High glucose activates nuclear factor of activated T cells in native vascular smooth muscleArteriosclerosis, Thrombosis, and Vascular Biology 26:794–800.https://doi.org/10.1161/01.ATV.0000209513.00765.13
-
Purinergic P2Y receptors: molecular diversity and implications for treatment of cardiovascular diseasesPharmacology & Therapeutics 180:113–128.https://doi.org/10.1016/j.pharmthera.2017.06.010
-
Differential coupling of the human P2Y(11) receptor to phospholipase C and adenylyl cyclaseBritish Journal of Pharmacology 132:318–326.https://doi.org/10.1038/sj.bjp.0703788
-
Illuminating cell signaling with genetically encoded FRET biosensors in adult mouse cardiomyocytesThe Journal of General Physiology 150:1567–1582.https://doi.org/10.1085/jgp.201812119
-
P2Y purinoceptors as potential emerging therapeutical target in vascular diseaseCurrent Pharmaceutical Design 18:6169–6180.https://doi.org/10.2174/138161212803582504
-
Endothelial dysfunction — A major mediator of diabetic vascular diseaseBiochimica Et Biophysica Acta (BBA) - Molecular Basis of Disease 1832:2216–2231.https://doi.org/10.1016/j.bbadis.2013.08.006
-
Regulation of intracerebral arteriolar tone by K(v) channels: effects of glucose and PKCAmerican Journal of Physiology. Cell Physiology 297:C788–C796.https://doi.org/10.1152/ajpcell.00148.2009
-
Distance constraints on activation of TRPV4 channels by AKAP150-bound pkcα in arterial myocytesThe Journal of General Physiology 149:639–659.https://doi.org/10.1085/jgp.201611709
-
Diabetes mellitus-associated vascular impairment: novel circulating biomarkers and therapeutic approachesJournal of the American College of Cardiology 62:667–676.https://doi.org/10.1016/j.jacc.2013.03.089
-
Molecular pharmacology, physiology, and structure of the P2Y receptorsAdvances in Pharmacology 61:373–415.https://doi.org/10.1016/B978-0-12-385526-8.00012-6
-
2017 ACC/AHA/AAPA/ABC/ACPM/AGS/APhA/ASH/ASPC/NMA/PCNA guideline for the prevention, detection, evaluation, and management of high blood pressure in adults: a report of the American college of cardiology/American heart association task force on clinical practice guidelinesHypertension 71:e13–e115.https://doi.org/10.1161/HYP.0000000000000065
-
Single-channel L-type Ca2+ currents in chicken embryo semicircular canal type I and type II hair cellsJournal of Neurophysiology 96:602–612.https://doi.org/10.1152/jn.01315.2005
-
AKAP79/150 signal complexes in G-protein modulation of neuronal ion channelsJournal of Neuroscience 31:7199–7211.https://doi.org/10.1523/JNEUROSCI.4446-10.2011
-
Adenylyl cyclase anchoring by a kinase anchor protein AKAP5 (AKAP79/150) is important for postsynaptic β-adrenergic signalingJournal of Biological Chemistry 288:17918–17931.https://doi.org/10.1074/jbc.M112.449462
Article and author information
Author details
Funding
National Heart, Lung, and Blood Institute (R01HL098200)
- Manuel F Navedo
National Heart, Lung, and Blood Institute (R01HL121059)
- Manuel F Navedo
National Institute of Neurological Disorders and Stroke (R01NS078792)
- Johannes W Hell
National Institute on Aging (R01AG055357)
- Johannes W Hell
National Institute of General Medical Sciences (T32GM099608)
- Maria Paz Prada
National Heart, Lung, and Blood Institute (T32HL086350)
- Arsalan U Syed
- Matthew A Nystoriak
National Institute of Diabetes and Digestive and Kidney Diseases (R01DK57236)
- Sean M Ward
National Institute of Neurological Disorders and Stroke (F31NS086226)
- Olivia R Buonarati
American Heart Association (16SDG27260070)
- Matthew A Nystoriak
American Heart Association (18POST34060234)
- Debapriya Ghosh
National Heart, Lung, and Blood Institute (R01HL127764)
- Yang K Xiang
National Heart, Lung, and Blood Institute (R01HL112413)
- Yang K Xiang
University of California, Davis (Academic Federation Innovative Development Award)
- Madeline Nieves-Cintrón
The funders had no role in study design, data collection and interpretation, or the decision to submit the work for publication.
Acknowledgements
We thank members of the Navedo Lab for technical support. We also thank Dr. Charles Kennedy from the University of Strathclyde for helpful discussions and advice on purinergic signaling in the vasculature.
Ethics
Human subjects: This statement is already in our Materials and Methods section - Samples were obtained after Institutional Review Board (IRB) approval from the University of Nevada Reno School of Medicine (IRB ID: 2013-019) and in accordance with the guidelines of the Declaration of Helsinki. The need for informed consent was waived by IRBs at the University of Nevada Reno School of Medicine (IRB ID: 2013-019) and the University of California Davis (IRB ID: 597267-1) because the tissue is considered "waste", has no codification that could be used to identify patients and was determined not to be human subject research in accordance with United States of America federal regulations, as defined by 45 CFR 46.102(f). This precludes the acquisition of detailed clinical profiles other than sex, age and whether the patient nondiabetic or diabetic. Only samples from nondiabetic patients were used.
Animal experimentation: This statement is already in our Materials and Methods section -Male wild-type C57BL/6J (wt) mice of 5 to 8 weeks of age were euthanized with a lethal dose of sodium pentobarbital (250 mg/kg; intraperitoneally), as approved by the University of California, Davis Animal Care and Use Committee (protocol #: 20321).
Version history
- Received: September 21, 2018
- Accepted: February 16, 2019
- Version of Record published: March 1, 2019 (version 1)
Copyright
© 2019, Prada et al.
This article is distributed under the terms of the Creative Commons Attribution License, which permits unrestricted use and redistribution provided that the original author and source are credited.
Metrics
-
- 1,747
- views
-
- 164
- downloads
-
- 34
- citations
Views, downloads and citations are aggregated across all versions of this paper published by eLife.
Download links
A two-part list of links to download the article, or parts of the article, in various formats.
Downloads (link to download the article as PDF)
Open citations (links to open the citations from this article in various online reference manager services)
Cite this article (links to download the citations from this article in formats compatible with various reference manager tools)
A Gs-coupled purinergic receptor boosts Ca2+ influx and vascular contractility during diabetic hyperglycemia
eLife 8:e42214.
https://doi.org/10.7554/eLife.42214
Further reading
-
- Cell Biology
- Neuroscience
Mutations in Drosophila Swiss Cheese (SWS) gene or its vertebrate orthologue Neuropathy Target Esterase (NTE) lead to progressive neuronal degeneration in flies and humans. Despite its enzymatic function as a phospholipase is well-established, the molecular mechanism responsible for maintaining nervous system integrity remains unclear. In this study, we found that NTE/SWS is present in surface glia that forms the blood-brain-barrier (BBB) and that NTE/SWS is important to maintain its structure and permeability. Importantly, BBB glia-specific expression of Drosophila NTE/SWS or human NTE in the sws mutant background fully rescues surface glial organization and partially restores BBB integrity, suggesting a conserved function of NTE/SWS. Interestingly, sws mutant glia showed abnormal organization of plasma membrane domains and tight junction rafts accompanied by the accumulation of lipid droplets, lysosomes, and multilamellar bodies. Since the observed cellular phenotypes closely resemble the characteristics described in a group of metabolic disorders known as lysosomal storage diseases (LSDs), our data established a novel connection between NTE/SWS and these conditions. We found that mutants with defective BBB exhibit elevated levels of fatty acids, which are precursors of eicosanoids and are involved in the inflammatory response. Also, as a consequence of a permeable BBB, several innate immunity factors are upregulated in an age-dependent manner, while BBB glia-specific expression of NTE/SWS normalizes inflammatory response. Treatment with anti-inflammatory agents prevents the abnormal architecture of the BBB, suggesting that inflammation contributes to the maintenance of a healthy brain barrier. Considering the link between a malfunctioning BBB and various neurodegenerative diseases, gaining a deeper understanding of the molecular mechanisms causing inflammation due to a defective BBB could help to promote the use of anti-inflammatory therapies for age-related neurodegeneration.
-
- Cell Biology
- Structural Biology and Molecular Biophysics
Mutations in the human PURA gene cause the neurodevelopmental PURA syndrome. In contrast to several other monogenetic disorders, almost all reported mutations in this nucleic acid-binding protein result in the full disease penetrance. In this study, we observed that patient mutations across PURA impair its previously reported co-localization with processing bodies. These mutations either destroyed the folding integrity, RNA binding, or dimerization of PURA. We also solved the crystal structures of the N- and C-terminal PUR domains of human PURA and combined them with molecular dynamics simulations and nuclear magnetic resonance measurements. The observed unusually high dynamics and structural promiscuity of PURA indicated that this protein is particularly susceptible to mutations impairing its structural integrity. It offers an explanation why even conservative mutations across PURA result in the full penetrance of symptoms in patients with PURA syndrome.


