Microglial SIRPα regulates the emergence of CD11c+ microglia and demyelination damage in white matter
- Gunma University Graduate School of Health Sciences, Japan
- University of Fukui, Japan
- Assiut University, Egypt
- Kobe University Graduate School of Medicine, Japan
- Gunma University Graduate School of Medicine, Japan
- Umeå University, Sweden
- Weizmann Institute of Science, Israel
Figures
Figure 1
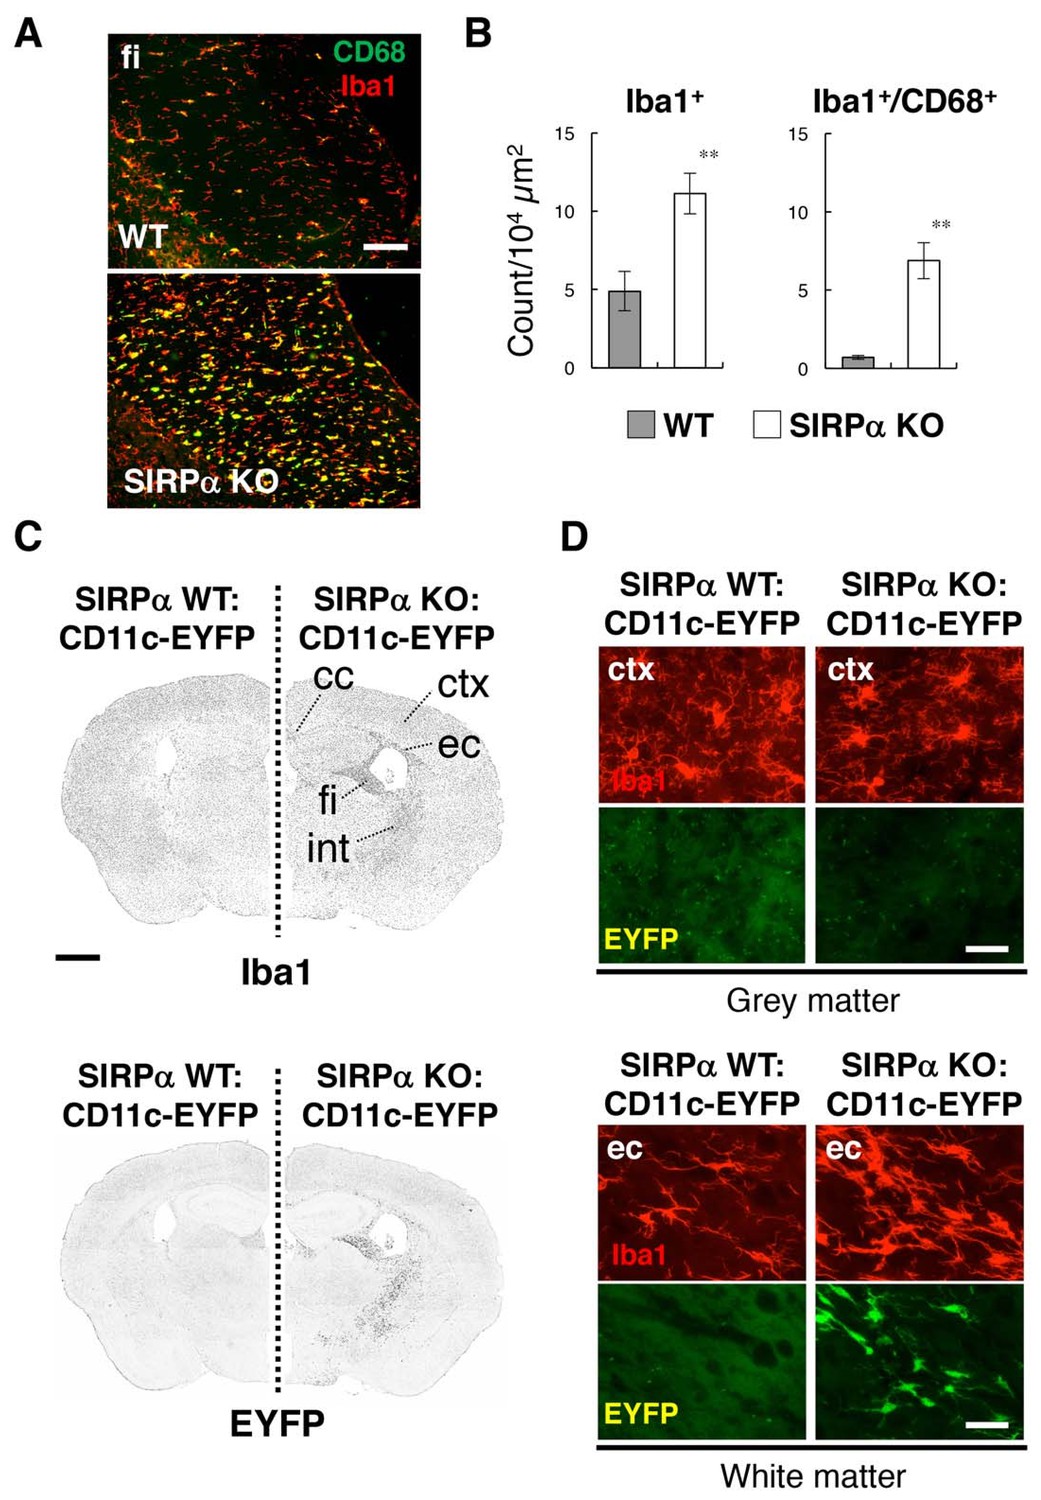
Activation of microglia in the brain white matter of SIRPα KO mice.
(A) Immunofluorescence staining of coronal brain sections prepared from control (WT) or SIRPα null mutant mice (SIRPα KO) with antibodies to Iba1 (red) and CD68 (green). Merged images are shown. fi, fimbria. (B) Quantitative analysis of the number of Iba1+ (left panel) and Iba1+/CD68+ (right panel) microglia in the fimbria of WT (filled bars) and SIRPα KO mice (open bars) at 18–20 wks of age. Data are the means ± SEM (n = 6 images from three mice for each genotype). **p<0.01 (Welch’s t-test). (C, D) Immunofluorescence staining with a specific antibody for Iba1 of coronal brain sections prepared from control CD11c–EYFP Tg mice (at 30–32 wks of age) carrying a homozygous SIRPα WT allele (SIRPα WT:CD11c–EYFP, left side) or a SIRPα null mutation (SIRPα KO:CD11c–EYFP, right side). Images in panel (C) are lower-magnification images of the immunoreactivity of Iba1 (upper panels) and of the fluorescence of EYFP in the same sections (lower panels). Images were converted to grey scale and then inverted to clarify the fluorescence signal. Images in panel (D) are higher-magnification images of the immunoreactivity of Iba1 (red) and fluorescence of EYFP (green) in grey matter (ctx, cerebrum cortex; upper panels) and white matter (ec, external capsule; lower panels). cc, corpus callosum; ec, external capsule; fi, fimbria; int, internal capsule. Data are representative of at least three independent animals. Scale bars: 100 μm (A), 1 mm (C), and 50 μm (D).
Figure 2
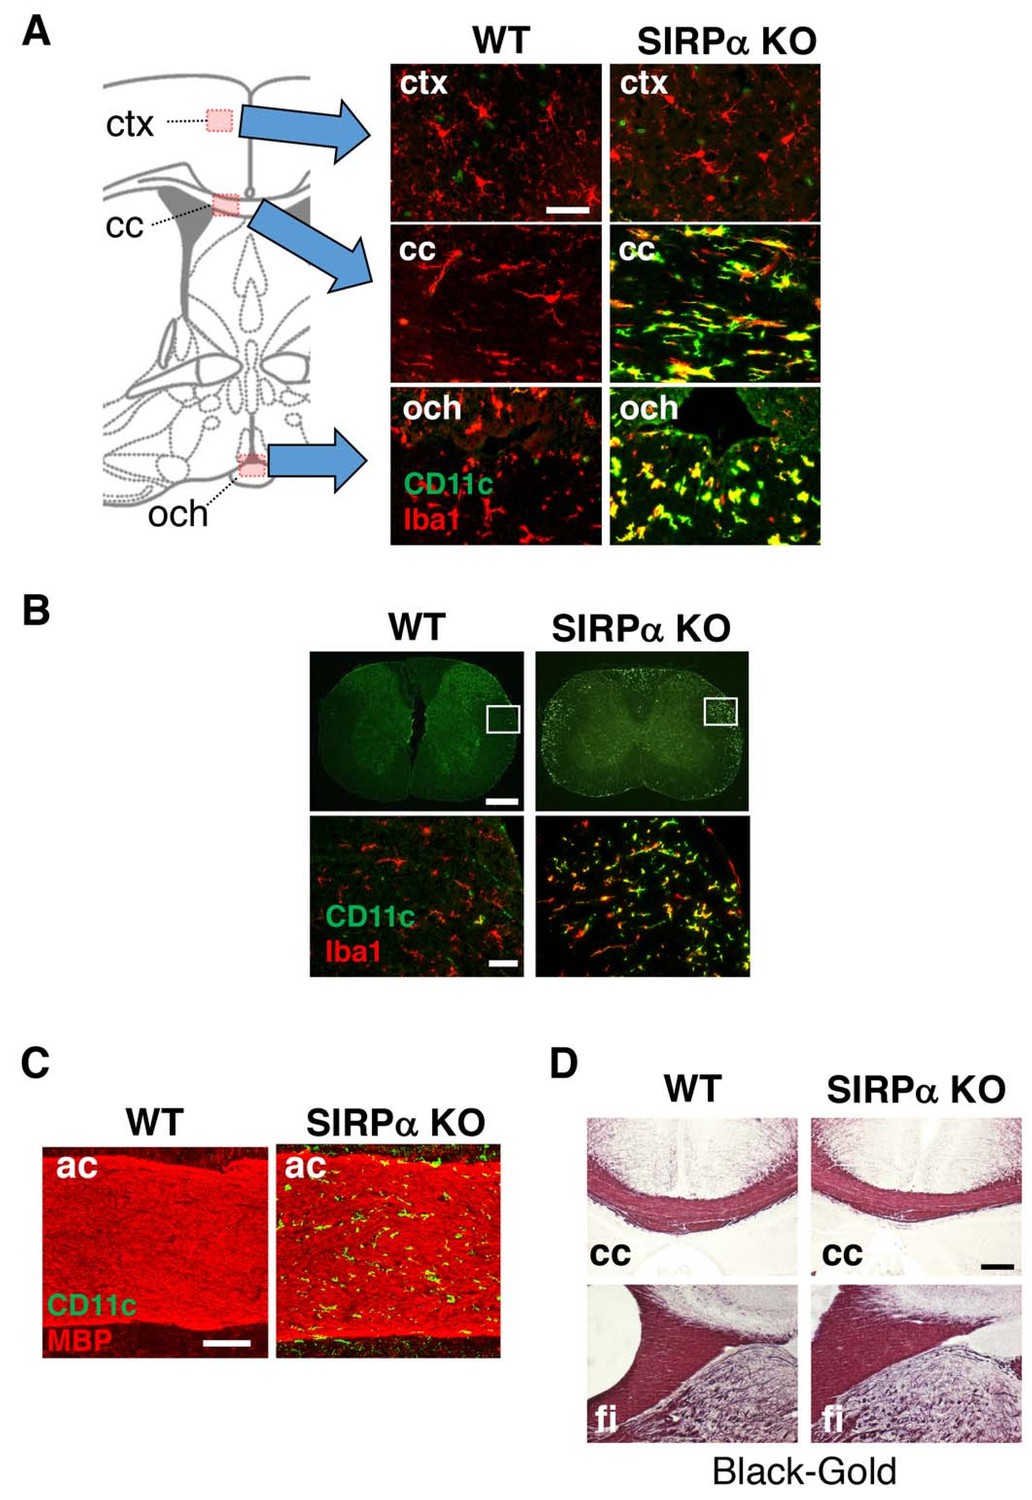
CD11c+ microglia in the white matter of SIRPα KO mice.
(A, B) Coronal sections were prepared from brain (A) and spinal cord (B) of control (WT) or SIRPα null-mutant mice (SIRPα KO) at 18–20 wks of age and stained with specific antibodies for Iba1 (red) and CD11c (green). In panel (A), merged images are shown. Schematic diagrams of brain sections are shown on the left side. The boxed areas in panel (B) are shown at a higher magnification in the lower panels. cc, corpus callosum; ctx, cerebrum cortex; och, optic chiasma. (C, D) Coronal brain sections of control (WT) or SIRPα null-mutant mice (SIRPα KO) at 29–32 (C) or 10–11 (D) wks of age were stained with antibodies to myelin basic protein (MBP) (red) and CD11c (green) (C), or Black-Gold (D). ac, anterior commissure; cc, corpus callosum; fi, fimbria. Data are representative of at least three independent animals. Scale bars: 50 μm (A, B lower panels), 1 mm (B upper panels), 100 μm (C), and 200 μm (D).
Figure 3 with 2 supplements
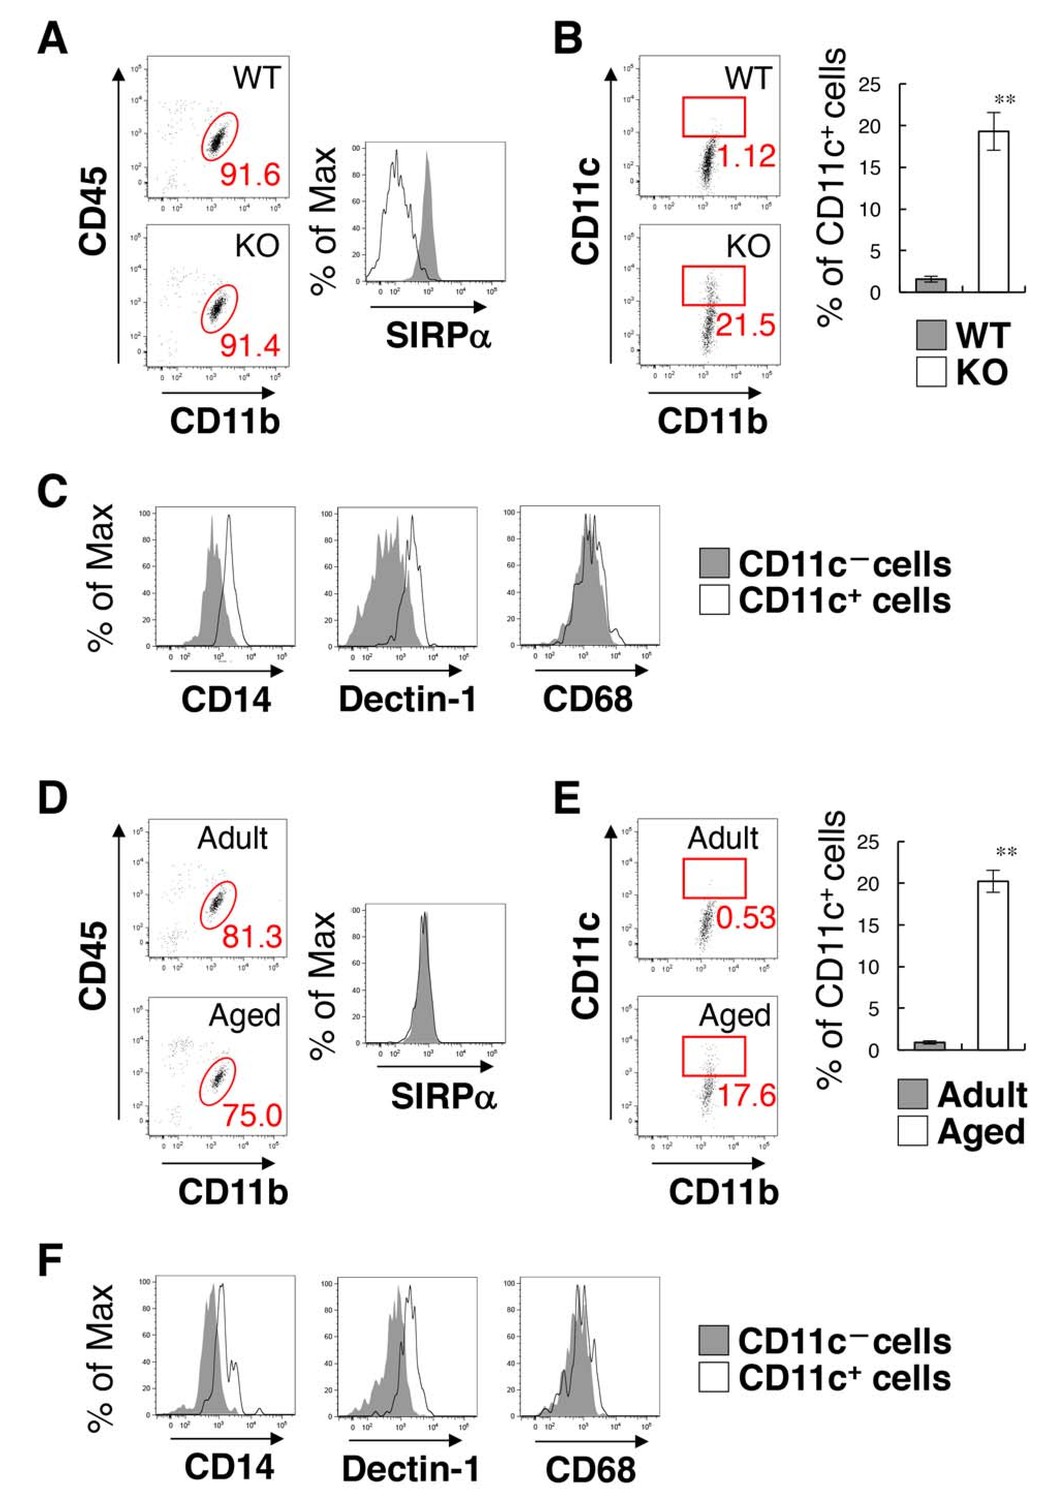
Flow cytometry analysis of microglia in SIRPα KO mice and WT aged mice.
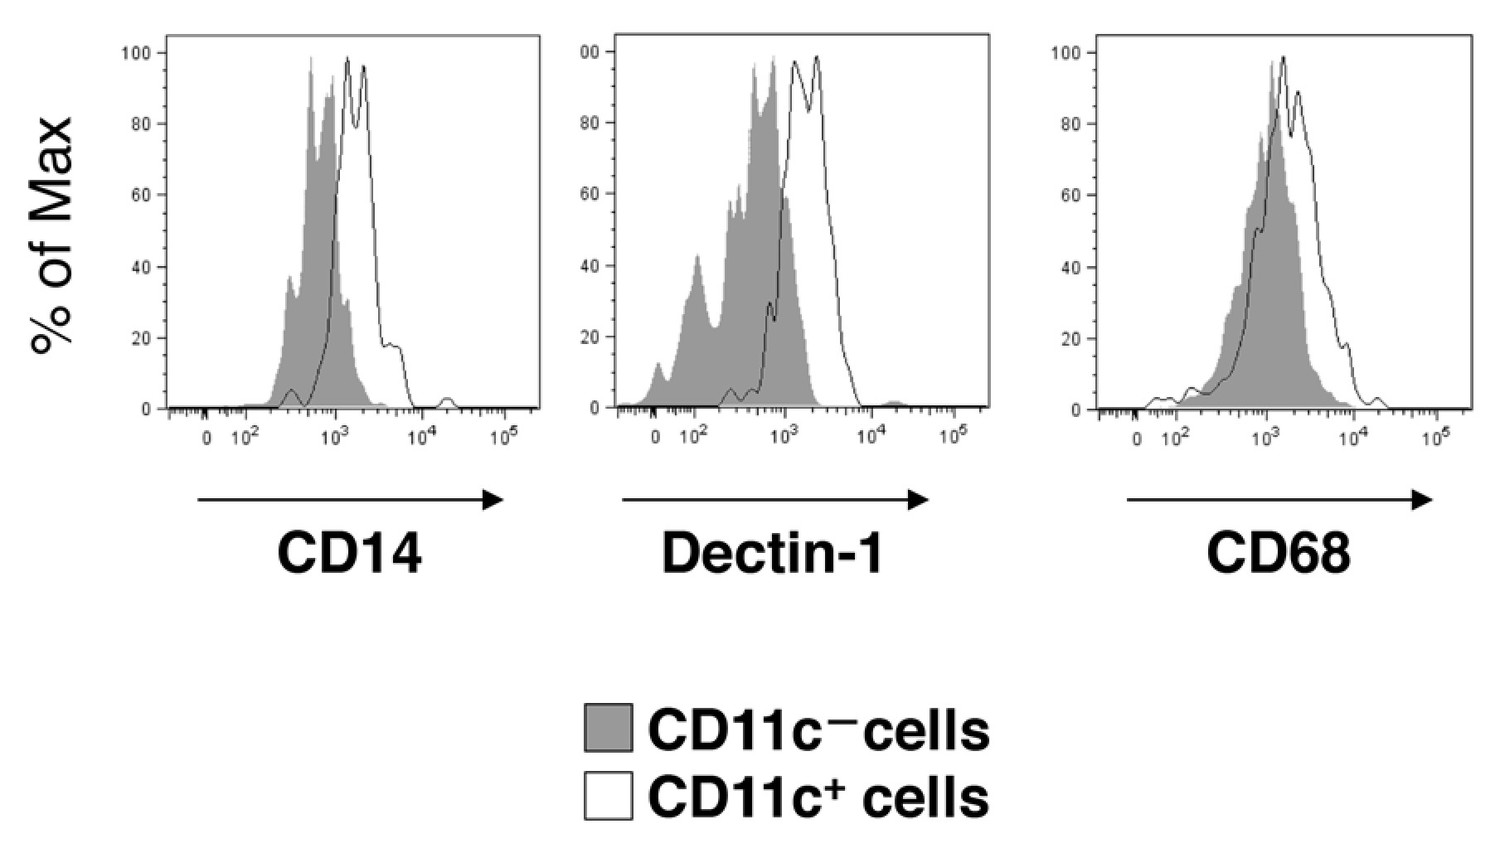
(A) Cells isolated from the spinal cord of control WT or SIRPα KO (KO) mice at 14 wks of age were incubated with a PE-conjugated monoclonal antibody (mAb) to SIRPα, a PerCP–Cy5.5-conjugated mAb to CD45, and an FITC-conjugated mAb to CD11b. The expression of CD11b and CD45 on monocyte cells or of SIRPα on CD11b+/CD45dim/lo microglia was analysed by flow cytometry. The percentage of CD11b+/CD45dim/lo microglia among putative monocytes is indicated in each plot (left plots). The expression profiles for SIRPα on CD11b+/CD45dim/lo microglia are shown in the right panel. (B) Cells prepared as in panel (A) from WT or SIRPα KO mice at 14–21 wks of age were stained with antibodies to CD45, CD11b, and CD11c, and analysed by flow cytometry. The percentage of CD11b+/CD45dim/lo/CD11c+ microglia among total CD11b+/CD45dim/lo microglia is indicated in each plot. Quantitative data are shown in the right panel. Filled and open bars indicate WT and SIRPα KO mice, respectively. (C) Cells prepared from SIRPα KO mice were stained for CD45, CD11b and CD11c, as well as for CD14, Dectin-1, or CD68. Plots were gated on CD11b+/CD45dim/lo cells, and CD14, Dectin-1, or CD68 on CD11c–positive and -negative microglia were analysed. The expression profiles for each molecule in CD11b+/CD45dim/lo microglia are shown. (D) Cells isolated from adult (18 wks of age) or aged (104 wks of age) mice were isolated and analysed as in panel (A). (E) Cells prepared as in panel (D) from adult (16–18 wks of age) or aged (69–105 wks of age) mice were analysed as in (B). Quantitative data are shown in the right panel. Filled and open bars indicate adult and aged mice, respectively. (F) Cells prepared from aged mice were analysed as in panel (C).Data in panels (B) and (E) are the means ± SEM (n = 5 (B) and 3 (E) independent experiments). **p<0.01 (Welch’s t-test). Other data are representative of at least 3–5 independent experiments. Filled and open traces in panels (A), (C, F), and (D) indicate WT and SIRPα KO mice (A), CD11c– and CD11c+ cells (C, F), and adult and aged mice (D), respectively.
Figure 3—figure supplement 1
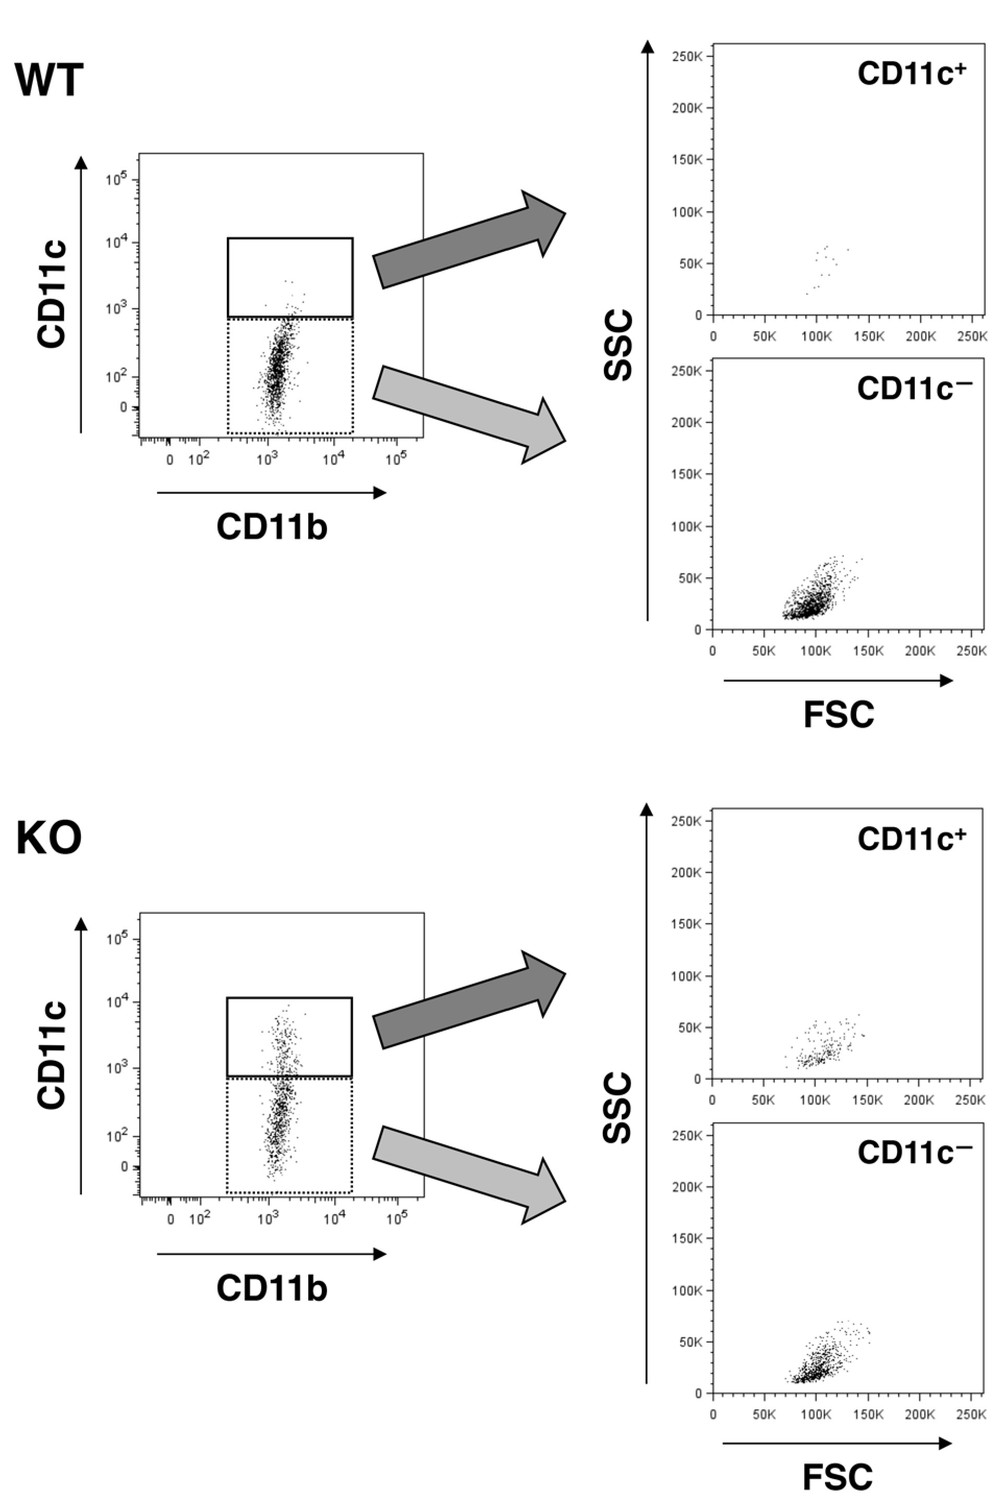
Forward (FSC) and side (SSC) scatter distribution of CD11c+microglia.
FSC/SSC distribution of WT (upper panels) and SIRPαKO (lower panels) microglia were analysed. CD11c+ and CD11c— microglia in the left panels (events in the solid and dotted rectangles, respectively) are presented on the FSC/SSC plots in the right panels. Scatter plots in the left panels are identical to those shown in Figure 3B. All data used in Figure 3B were analysed in the same way, and representative results are shown.
Figure 3—figure supplement 2
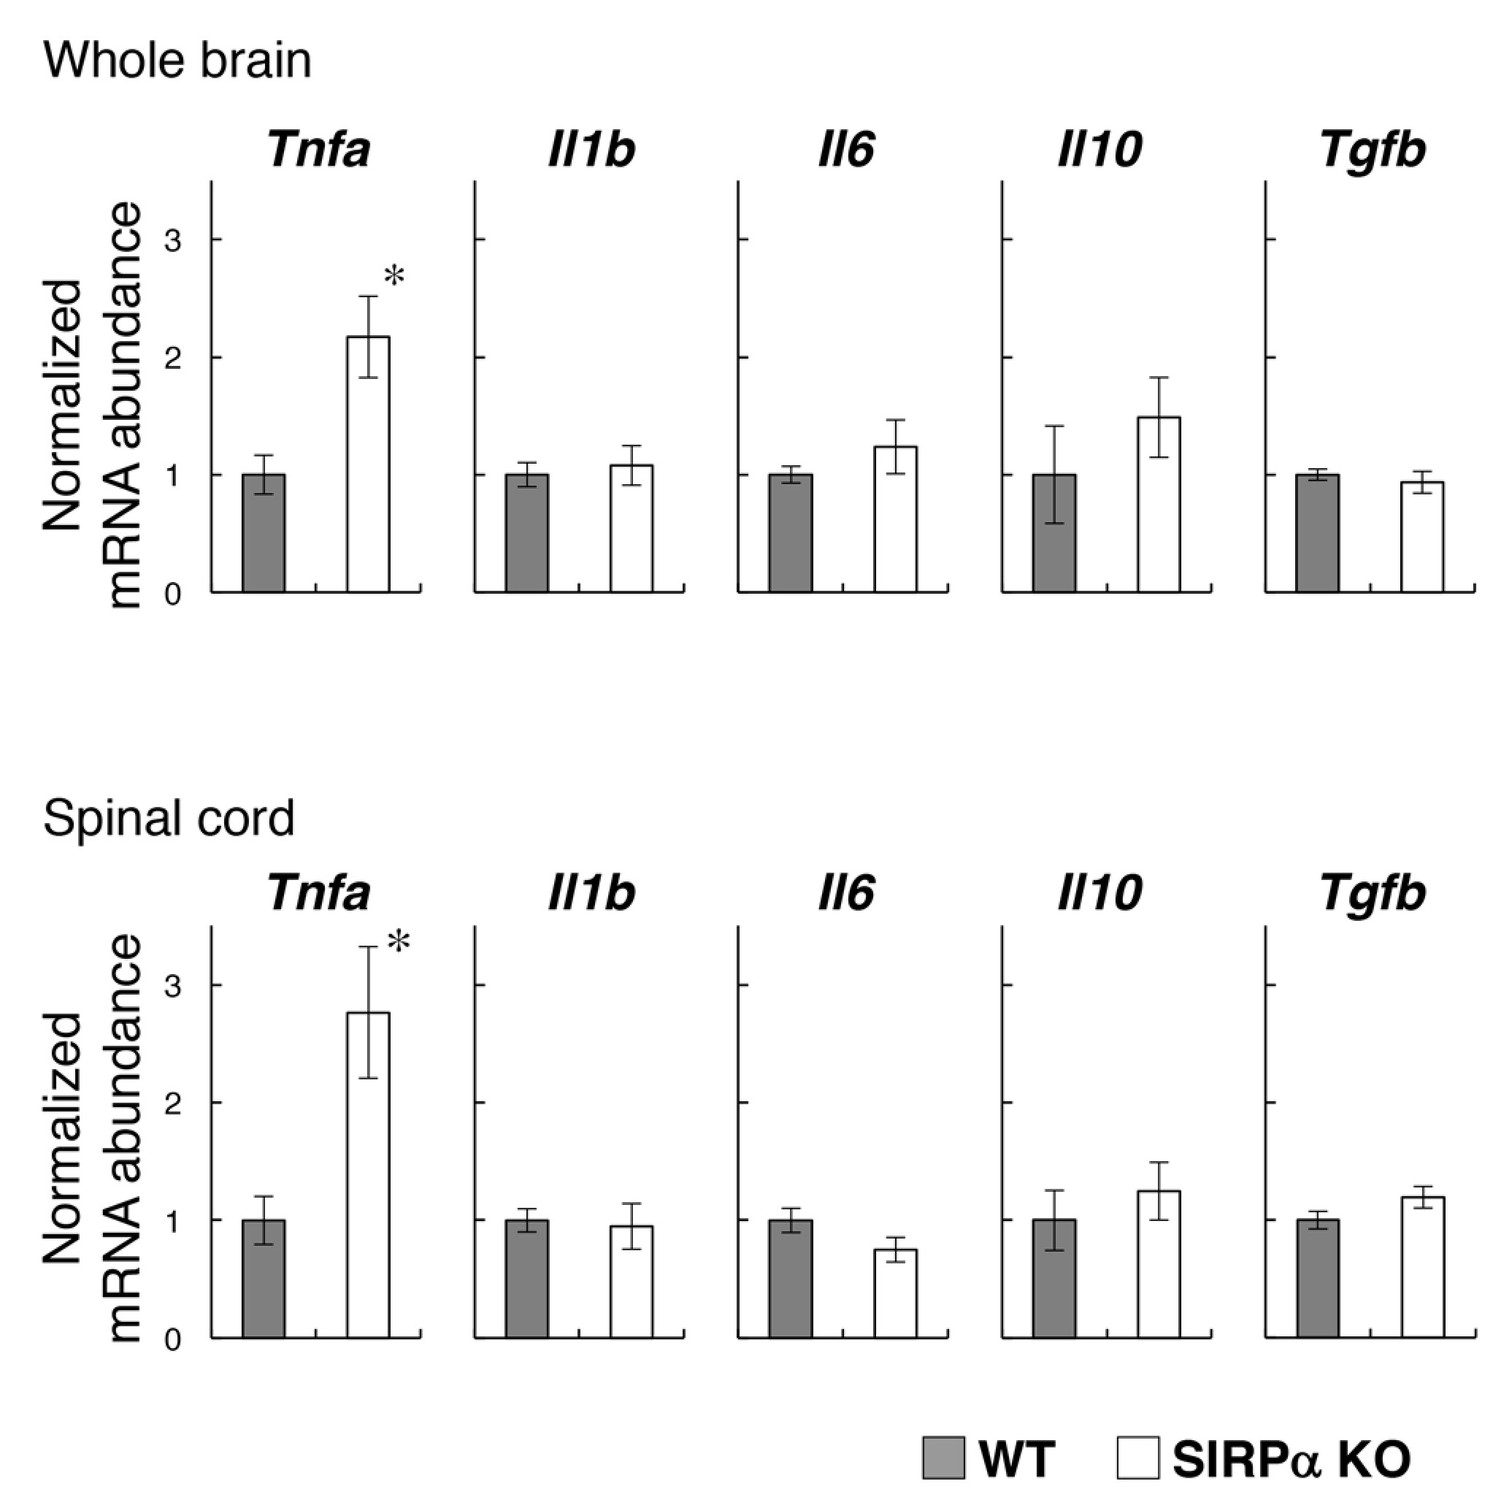
Expression of pro- and anti-inflammatory cytokines in the brain and spinal cord of SIRPα KO mice.
Whole brains and spinal cords were dissected from WT or SIRPα KO mice at 13–20 wks of age for the isolation of total RNA. The expressions of the indicated cytokines were then determined by quantitative polymerase chain reaction (PCR) analysis. The amount of each mRNA was normalised to that of glyceraldehyde-3-phosphate dehydrogenase (GAPDH) mRNA and is presented relative to the mean value for control WT mice. Filled and open bars indicate WT and SIRPα KO mice, respectively. Data are the means ± SEM (n = 6 mice for each genotype). *p<0.05 (Welch’s t-test).
Figure 4
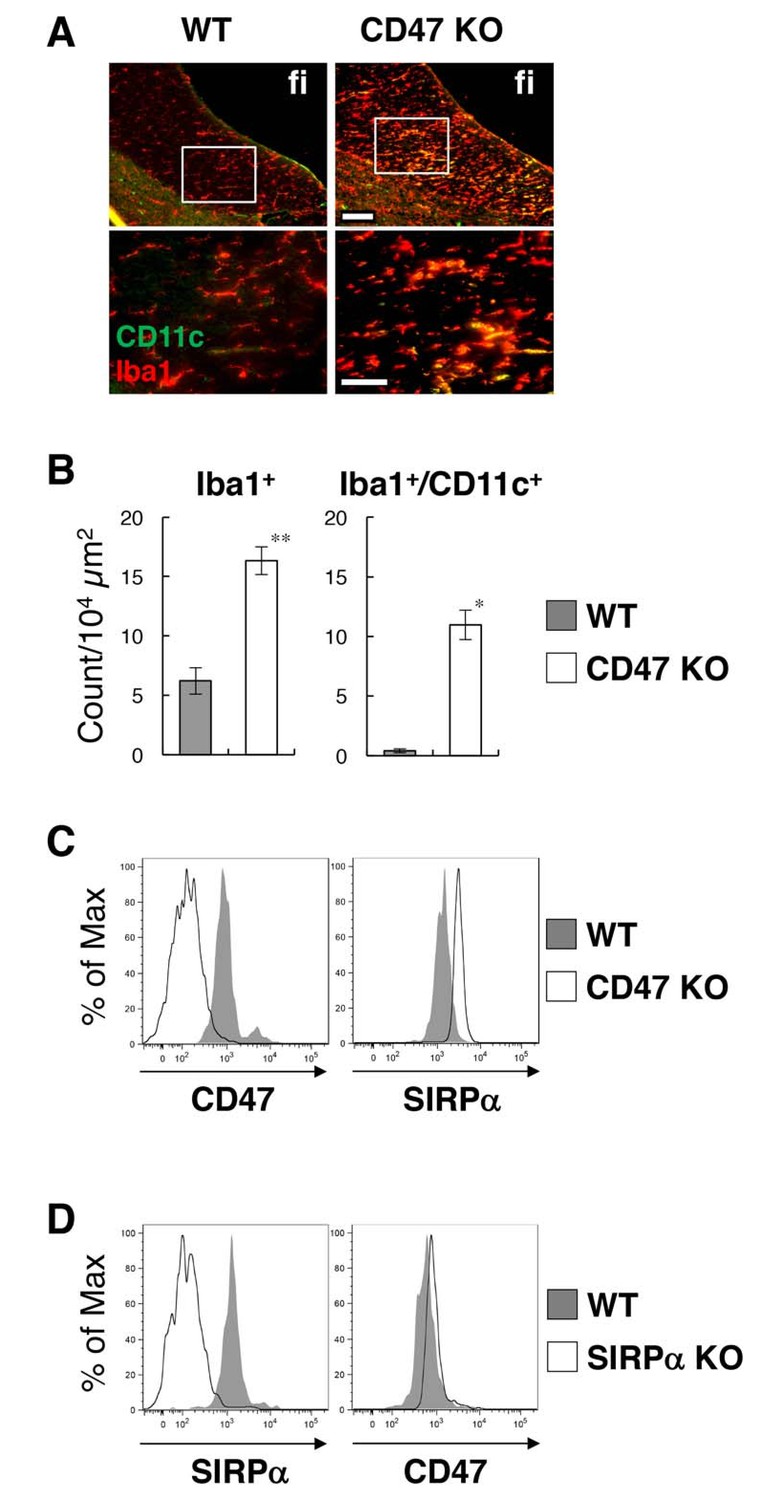
Activation of microglia in the brain white matter of CD47 KO mice.
(A) Immunofluorescence staining of coronal brain sections prepared from control (WT) or CD47 KO mice at 19 wks of age with antibodies to Iba1 (red) and CD11c (green). Merged images are shown. The boxed areas in the upper panels are shown at higher magnification in the lower panels. fi, fimbria. Scale bars: 100 μm (upper panels), 50 μm (lower panels). (B) Quantitative analysis of the number of Iba1+ (left panel) and Iba1+/CD11c+ (right panel) microglia in the fimbria of WT (filled bars) and CD47 KO mice (open bars) at 13–27 wks of age. Data are the means ± SEM (n = 3 images from 3 mice for each genotype). **p<0.01, *p<0.05 (Welch’s t-test). (C, D) Cells were isolated from the spinal cord of WT or CD47 KO mice at 14–16 wks of age (C), or from brain of WT or SIRPα KO female mice at 12 wks of age (D). Expressions of SIRPα and CD47 on CD11b+/CD45dim/lo microglia were analysed by flow cytometry. Filled and open traces indicate WT and CD47 KO (C) or SIRPα KO (D) mice, respectively. Data in (C) are representative of at least three independent experiments. Data in panel (D) are also representative of th independent experiments with brain (n = 2, one male pair and one female pair) and spinal cord (n = 1, one female pair) microglia.
Figure 5 with 2 supplements
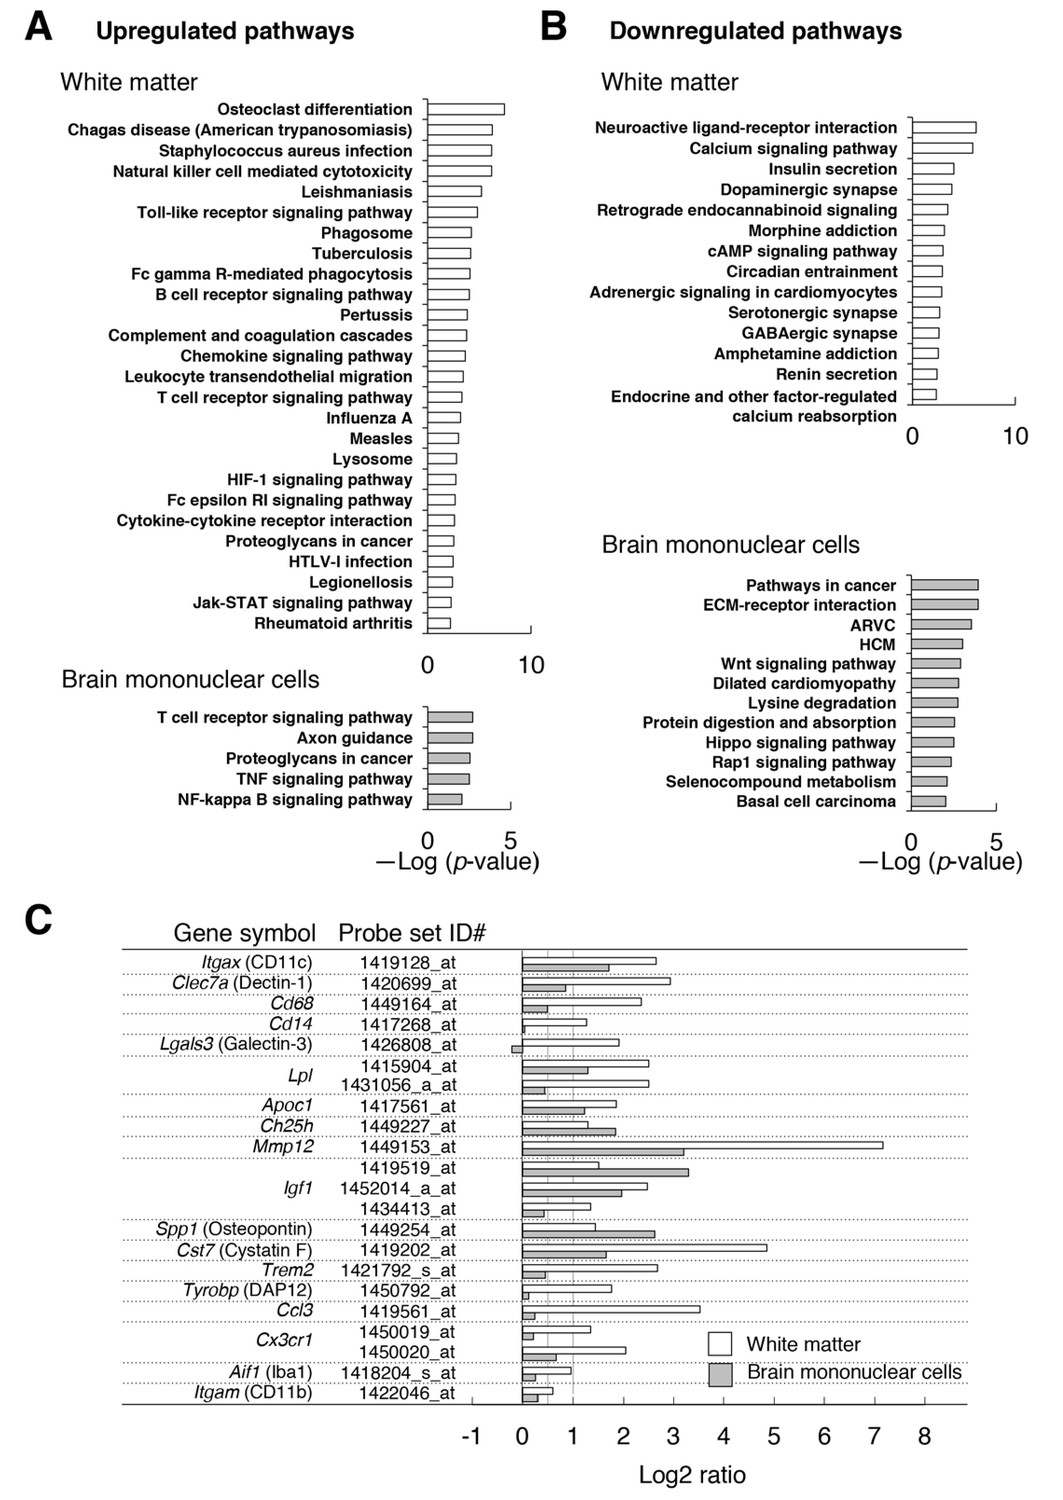
Microarray transcriptome analyses of the white matter and the brain mononuclear cells of CD47 KO mice.
(A,B) The results of Kyoto Encyclopedia of Genes and Genomes (KEGG) pathway analysis with DAVID. Statistically significant (p-value <0.01) KEGG enrichment pathways of up- (A) or downregulated (B) genes in the white matter (optic nerve and optic tract) (upper panels) or in the brain mononuclear cells (lower panels) of CD47 KO mice. Enrichment score is expressed as –Log (p-value). ARVC, Arrhythmogenic right ventricular cardiomyopathy; HCM, Hypertrophic cardiomyopathy. (C) The expression changes of selected genes that are characteristic of microglia or of de- and re-myelination processes. For each probe set on the microarray, the fold-change of gene expression in the CD47 KO mice compared with WT mice was expressed as a log2 ratio. Open and filled bars represent data for white matter and the brain mononuclear cells, respectively. Probe set ID#: Affymetrix probe set ID number for Mouse 430 2.0 Gnome Arrays.
Figure 5—figure supplement 1
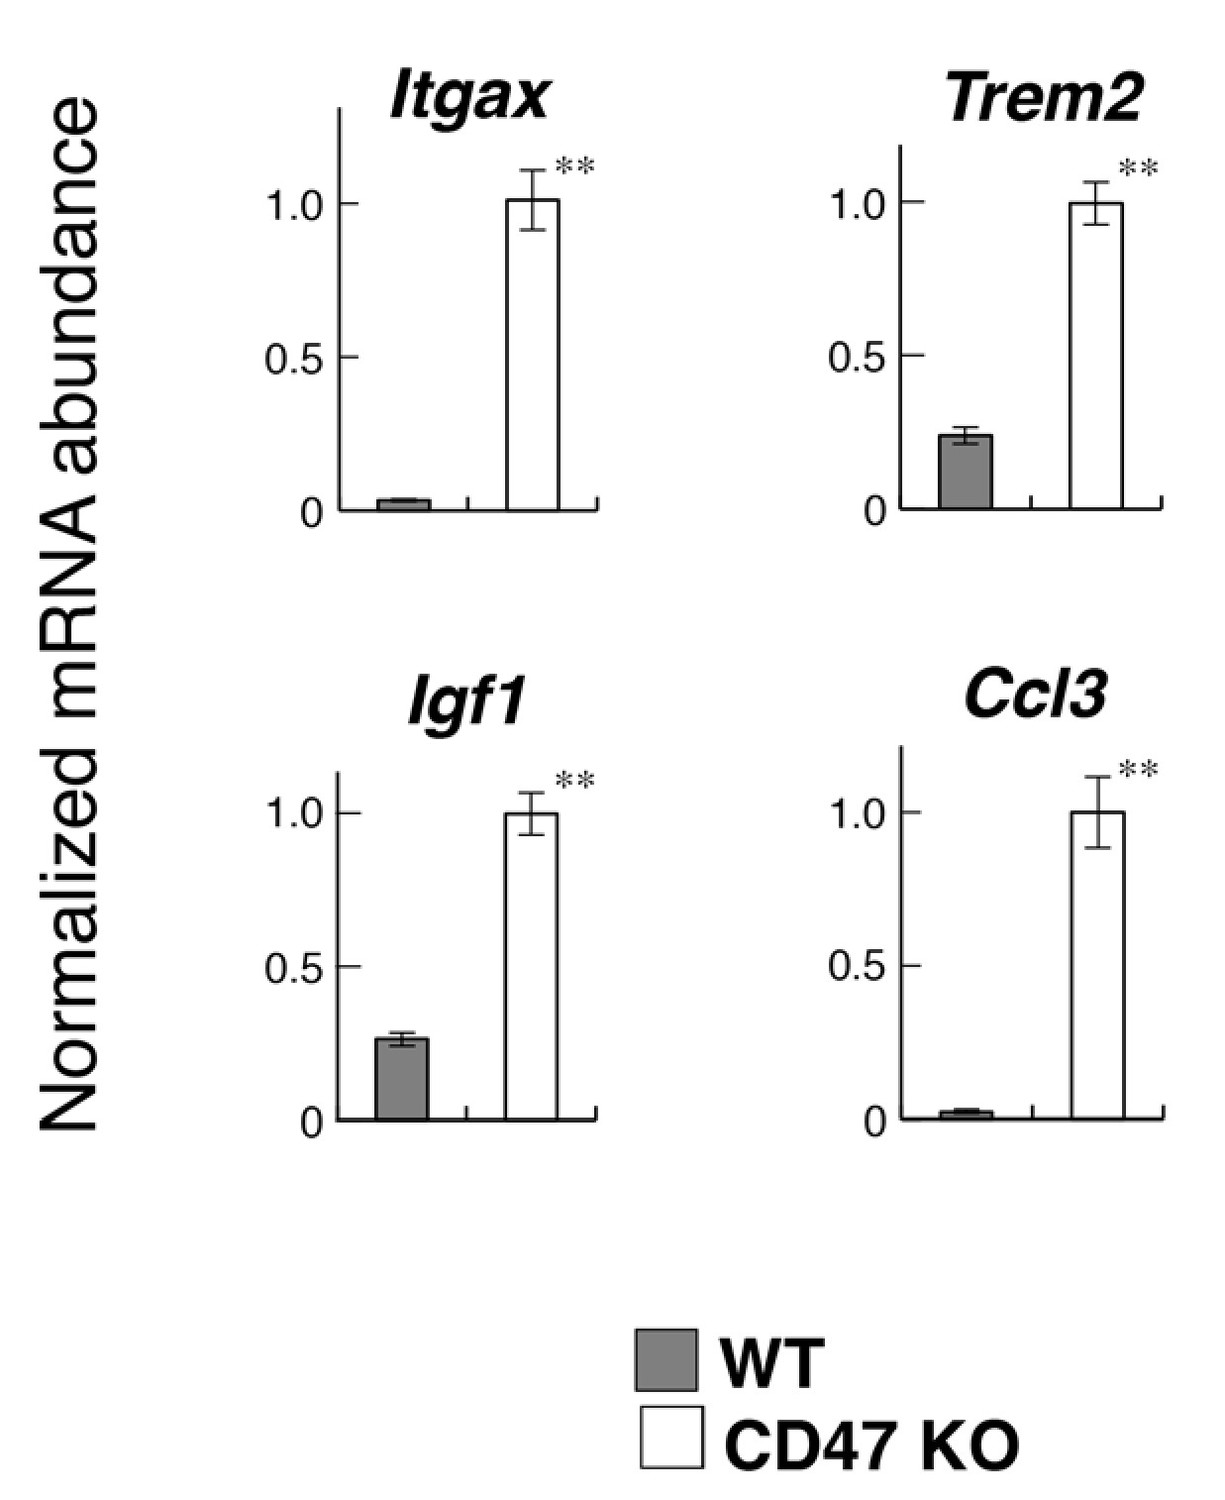
Quantitative PCR analyses of white matter RNA.
Total RNA samples from the optic chiasm and optic nerve of CD47 KO and WT mice (n = 4 and 6, respectively) were subjected to quantitative PCR analysis to determine the expression levels of the indicated genes. The amount of each mRNA was normalised to that of glyceraldehyde-3-phosphate dehydrogenase (GAPDH) mRNA and presented relative to the mean value for control WT mice. Filled and open bars indicate WT and SIRPα KO mice, respectively. Data are the means ± SEM. **p<0.01 (Welch’s t-test).
Figure 5—figure supplement 2
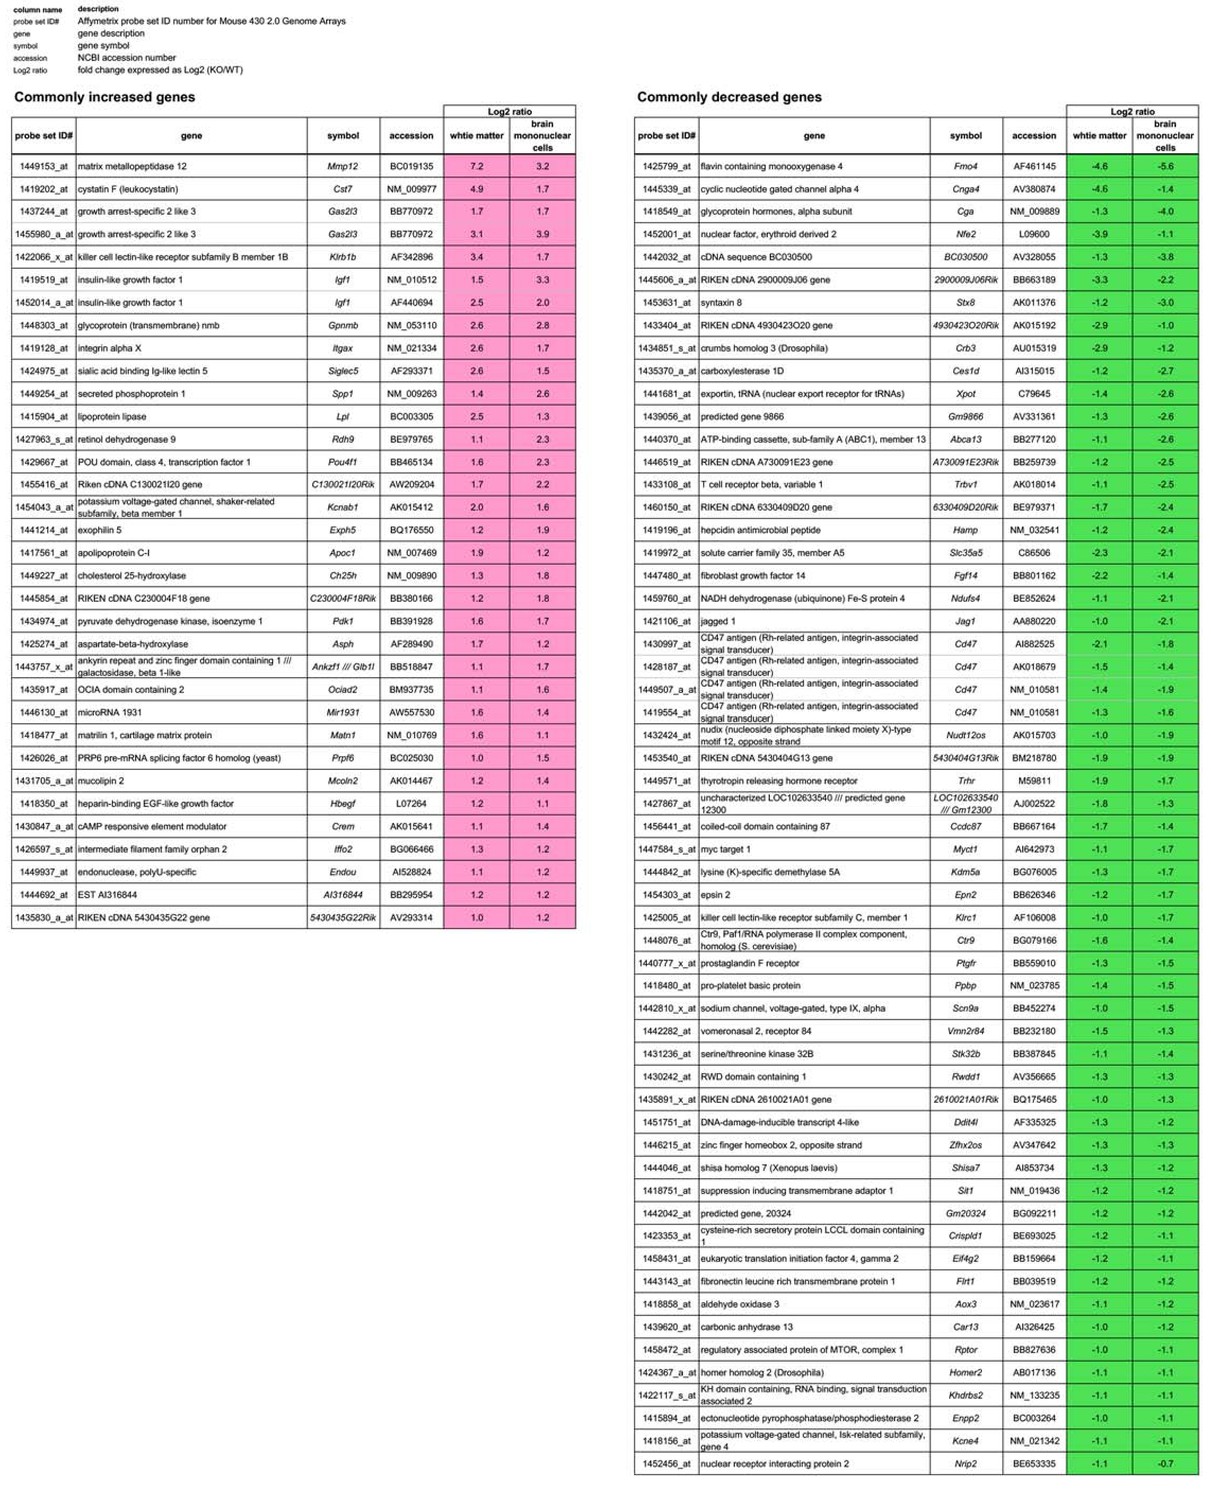
Genes whose expression levels are commonly changed from WT levels in both the white matter and the brain mononuclear cells of CD47 KO mice.
The genes whose expression levels are commonly changed more than 2-fold (|Log2 ratio| > 1) from WT levels in both the white matter and the brain mononuclear cells of CD47 KO mice are listed. Probe set ID#, Affymetrix probe set ID number for Mouse 430 2.0 Genome Arrays; gene, gene description; symbol, gene symbol; accession, NCBI accession number; Log2 ratio, fold change expressed as Log2 (KO/WT).
-
Figure 5—figure supplement 2—source data 1
Source data of Figure 5—figure supplement 2.
- https://doi.org/10.7554/eLife.42025.011
Figure 6 with 2 supplements
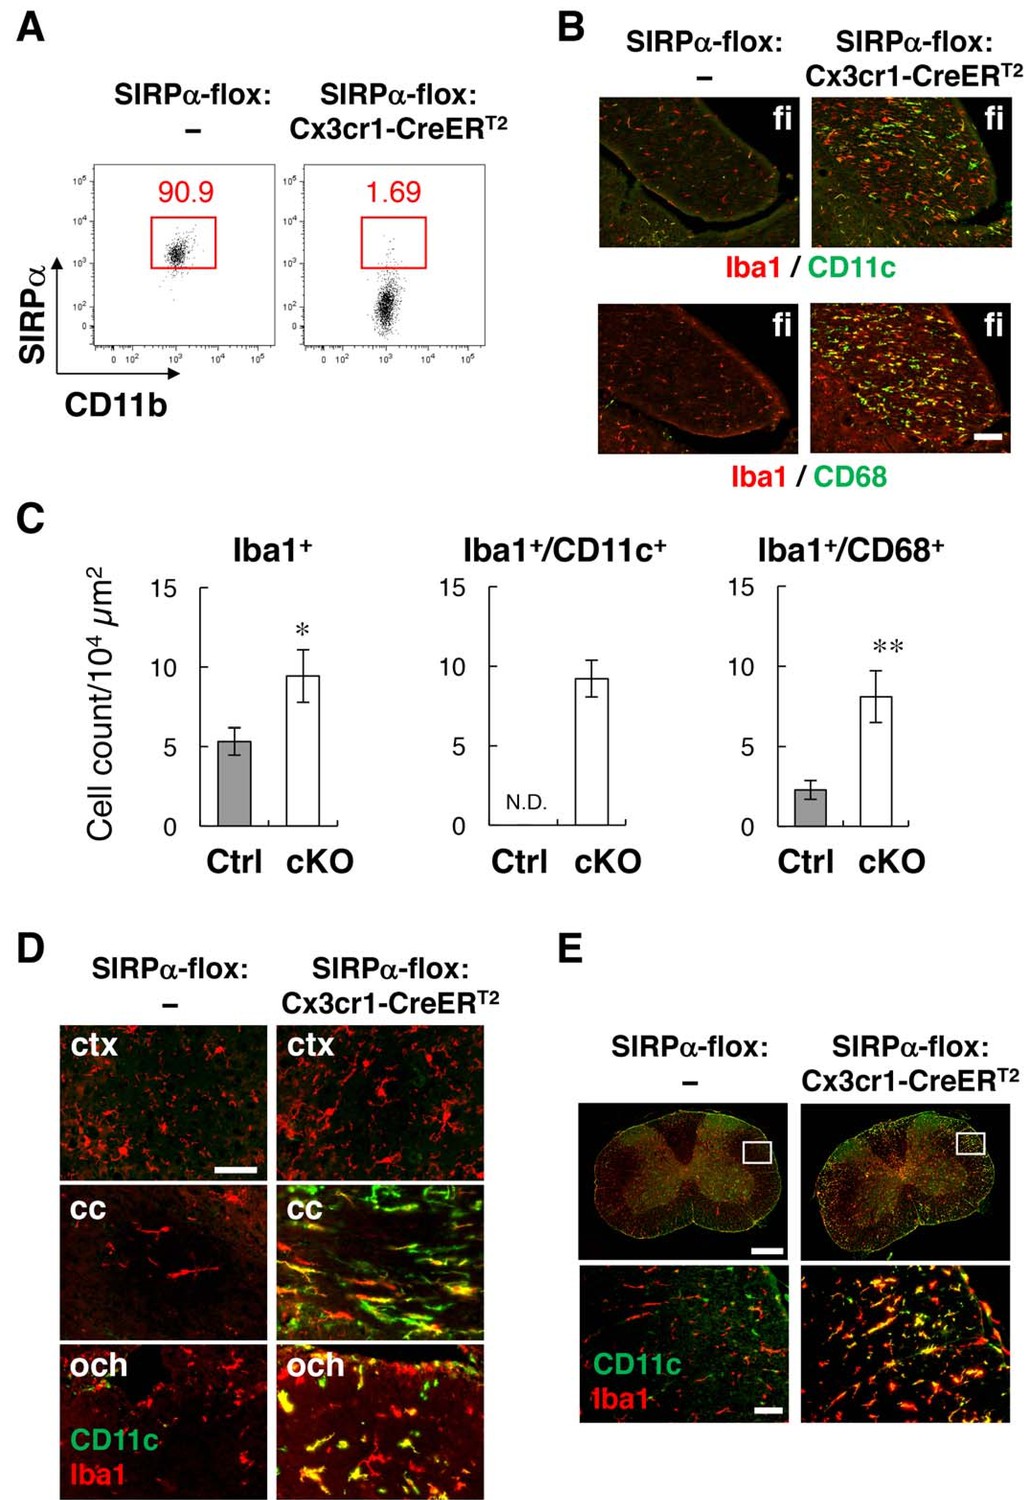
Phenotypes of microglia-specific SIRPα cKO mice.
(A) Cells isolated from the brains of control (SIRPα-flox:—) or microglia-specific SIRPα cKO (SIRPα-flox:Cx3cr1–CreERT2) female mice at 11 wks of age were stained as in Figure 3A. The percentage of CD11b+/CD45dim/lo/SIRPα+ or /SIRPα– microglia among total CD11b+/CD45dim/lo microglia is indicated in each plot. Data are representative of four independent experiments with microglia prepared from brain (n = 2) and spinal cord (n = 2). (B) Immunofluorescence staining of coronal brain sections prepared from control and SIRPα cKO mice at 22–30 wks of age with antibodies to Iba1 (red) and CD11c (green in upper panels) or CD68 (green in lower panels). Merged images are shown. (C) Quantitative analysis of the number of Iba1+ (left panel) and Iba1+/CD11c+ (middle panel) and Iba1+/CD68+ (right panel) microglia in the fimbria of control (Ctrl) and SIRPα cKO (cKO) mice at 22–30 wks of age. Filled and open bars indicate control and SIRPα cKO mice, respectively. Data are the means ± SEM (n = 4–13 images from 2–6 mice for each genotype). *p<0.05, **p<0.01 (Welch’s t-test). N.D., not detected. (D, E) Coronal sections were prepared from the brain (D) and spinal cord (E) of control or SIRPα cKO mice at 26–29 wks of age and stained with specific antibodies for Iba1 (red) and CD11c (green). Merged images are shown. The boxed areas in upper half of panel (E) are shown at a higher magnification in the lower half. cc, corpus callosum; ctx, cerebrum cortex; fi, fimbria; och, optic chiasma. Data in panels (B), (D), and (E) are representative of at least four independent animals. Scale bars: 100 μm (B), 50 μm (D, E bottom images), 1 mm (Etop images).
Figure 6—figure supplement 1
Flow-cytometry analysis of microglia in SIRPα cKO mice.
Cells isolated from the spinal cord of SIRPα cKO mice at 25–28 wks of age were stained for CD45, CD11b and CD11c, as well as for CD14, Dectin-1, or CD68. CD11b+/CD45dim/lo cells were gated, and the expression of CD14, Dectin-1, or CD68 on CD11c-positive and -negative microglia was analysed. Expression profiles for each molecule in CD11b+/CD45dim/lo microglia are shown. Filled and open traces indicate CD11c– and CD11c+ cells, respectively. Similar results were obtained from another independent experiment using female animals.
Figure 6—figure supplement 2

Immunohistochemical analysis of CD11c+ cell-specific SIRPα cKO mice.
Brain sections prepared from control (SIRPα-flox:—) and CD11c+ cell-specific SIRPα cKO (SIRPα-flox:CD11c-Cre) mice at 25 wks of age were immunostained with antibodies to Iba1 (red) and CD11c (green). Merged images are shown. fi, fimbria. Data are representative of at least three independent animals. Scale bar: 100 μm.
Figure 7
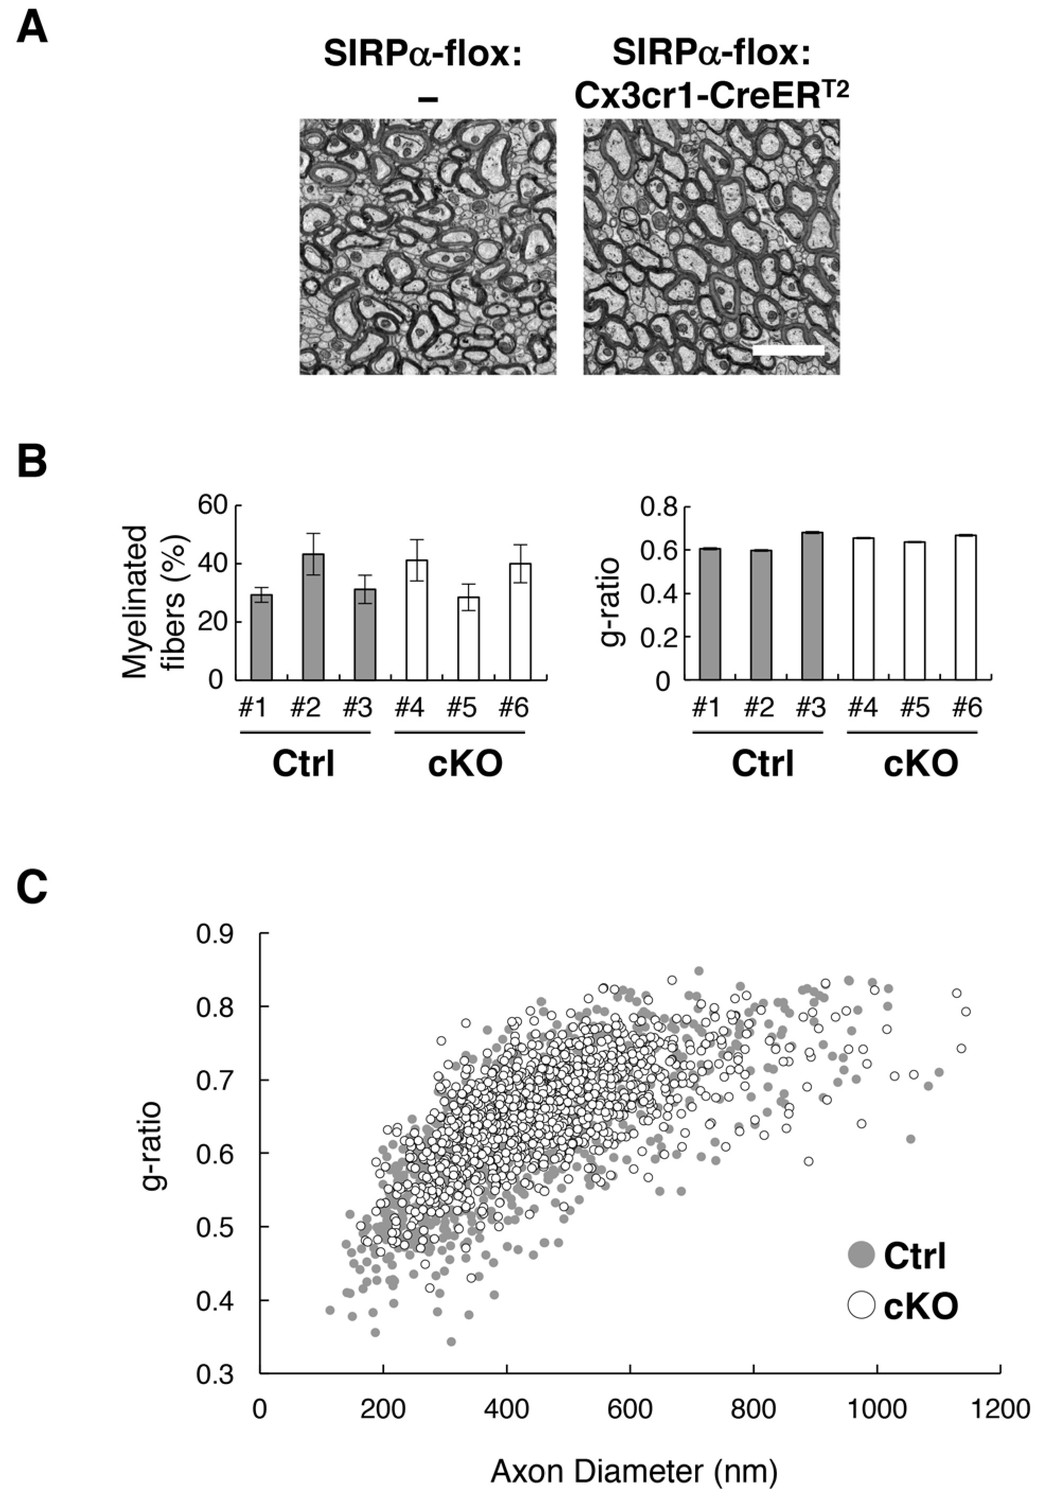
Normal myelin structure in microglia-specific SIRPα cKO mice.
(A) Electron microscopic analysis of axon fibres in the anterior commissure of control (SIRPα-flox:—) and microglia-specific SIRPα cKO mice (SIRPα-flox:Cx3cr1-CreERT2) at 26–27 wks of age. Scale bar: 2 μm. (B) Quantitative data for the myelination ratio (percentage of myelinated axons in the total number of axons) and the g-ratio (a ratio of the inner axonal diameter to the total outer diameter of myelinated axons) in the anterior commissure of three control (#1–#3, filled bars) and three SIRPα cKO mice (#4–#6, open bars). The myelination ratio and the g-ratio were calculated from 9 to 10 images (109–465 axons/image) (n = 9–10) and 317–562 myelinated axons in 9–10 images (n = 317–562), respectively, for each mouse. Data are the means ± SEM. (C) Scatter plot showing total g-ratio data as a function of the axon diameters. Filled and open circles indicate control (n = 1147 axons from mice #1–#3) and SIRPα cKO mice (n = 1437 axons from mice #4–#6), respectively.
Figure 8

Alleviation of cuprizone-induced demyelination in SIRPα cKO mice.
(A) Control (SIRPα-flox:— (Ctrl)) or SIRPα cKO (SIRPα-flox:Cx3cr1-CreERT2 (cKO)) mice at 19–30 wks of age were fed a 0.2% (w/w) cuprizone (Cpz) diet. After 3 or 5 wks of Cpz feeding (Cpz 3 wks, Cpz 5 wks), brain samples were prepared. Other groups of mice were returned to a normal diet after 5 wks of Cpz treatment and allowed to recover for 2 wks prior to the tissue analysis (Rec 2 wks). Mice fed a normal diet without Cpz for 3 or 7 wks were analysed as controls (Basal). Brain sections were subjected to immunofluorescence staining with specific antibodies for MBP, Iba1 (red), CD11c (green), and Olig2 (white). Arrowheads and arrows indicate typical demyelination (MBP) or microgliosis (dense immunoreactivity for Iba1) in the corpus callosum (arrowheads) and hippocampal alveus (arrows). Asterisks indicate abnormally strong immunoreactivity of MBP at Cpz 3 wks. Scale bars: 500 μm for MBP, Iba1, and CD11c; 100 μm for Olig2. (B, C, D) Ratio of demyelination area to the white matter (WM) area (including corpus callosum and hippocampal alveus) in the analysed image at Cpz 5 wks (B), or the ratio of the Iba1-positive (C) or CD11c-positive (D) area to the WM area at Basal, Cpz 3–5 wks, and Rec 2 wks, were quantified by the immunoreactivity of MBP, Iba1, and CD11c, respectively. Data are the means ± SEM. A total of eight images obtained from four mice (0 — Basal; 3 — Cpz 3 wks; 5 — Cpz 5 wks), or a total of four images obtained from two mice (5 + 2 — Rec 2 wks) were analysed at each time point for each genotype. *p<0.05, ∆p=0.06 (Welch’s t-test). (E) The number of Olig2+ oligodendrocytes were quantified in the WM area in the analysed image. Data are the means ± SEM. A total of 12–16 images obtained from four mice (0 — Basal; 3 — Cpz 3 wks; 5 — Cpz 5 wks), or a total of eight images obtained from two mice (5 + 2 — Rec 2 wks), were analysed for each genotype. §§§p<0.005 for Ctrl mice, †††p<0.005 for cKO mice (Welch’s t-test) versus the basal value for the respective genotypes. No statistical difference was found between the two genotypes. Filled and open bars or circles in panels (B, C, D, E) indicate control and SIRPα cKO mice, respectively.
Tables
Key resources table
| Reagent type (species) or resource | Designation | Source or reference | Identifiers | Additional information |
|---|---|---|---|---|
| Genetic reagent (Mus musculus) | Sirpa–/– (SIRPα KO) | PMID: 25818708 | RRID:MGI:5767142 | Dr. Takashi Matozaki (Kobe University, Japan) |
| Genetic reagent (M. musculus) | Itgax-Venus (CD11c–EYFP) | PMID: 15543150 | RRID:MGI:3835666 | The Jackson Laboratory (Bar Harbor, ME) |
| Genetic reagent (M. musculus) | Cd47–/– (CD47 KO) | PMID: 8864123 | RRID:MGI:1861955 | Dr. Pre-Arne Oldenborg (Umeå University, Sweden) |
| Genetic reagent (M. musculus) | Sirpaflox/flox | PMID: 25818708 | RRID:MGI:5767141 | Dr. Takashi Matozaki (Kobe University, Japan) |
| Genetic reagent (M. musculus) | Cx3cr1tm2.1(cre/ERT2)Jung (Cx3cr1–CreERT2) | PMID: 23273845 | RRID:MGI:5467985 | Dr. Steffen Jung (Weizmann Institute of Science, Israel) |
| Genetic reagent (M. musculus) | Itgax-cre (CD11c–Cre) | PMID: 17591855 | RRID:MGI:3763248 | The Jackson Laboratory (Bar Harbor, ME) |
| Antibody | Rabbit polyclonal antibodies (pAbs) to Iba1 | Wako (Osaka, Japan) (Cat# 019–19741) | RRID:AB_839504 | IHC (1:250) |
| Antibody | Biotin-conjugated Armenian hamster monoclonal antibody (mAb) to mouse CD11c (clone HL3) | BD Pharmingen (Cat# 553800) | RRID:AB_395059 | IHC (1:200) |
| Antibody | Rat mAbs to CD68 (clone FA-11) | BioLegend (Cat# 137001) | RRID:AB_2044003 | IHC (1:50) |
| Antibody | PerCP-Cy5.5 conjugated rat mAb to CD45 (30-F11) | BD Biosciences (Cat# 550994) | RRID:AB_394003 | FCM (1:100) |
| Antibody | FITC-conjugated rat mAb to mouse CD11b (clone M1/70) | BD Biosciences (Cat# 553310) | RRID:AB_394774 | FCM (1:100) |
| Antibody | Rat mAb to mouse CD16/CD32 (clone 2.4G2) | BD Biosciences (Cat# 553141) | RRID:AB_394656 | FCM (1:400) |
| Antibody | Streptavidin-conjugated allophycocyanin (APC) | BD Biosciences (Cat# 554067) | RRID:AB_10050396 | FCM (1:200) |
| Antibody | PE conjugated rat mAb to mouse CD172a (SIRPa) (clone P84) | eBioscience (Cat# 12-1721-80) | RRID:AB_11149864 | FCM (1:100) |
| Antibody | PE conjugated rat mAbs to CD68 (clone FA-11) | BioLegend (Cat# 137013) | RRID:AB_10613469 | FCM (1:100) |
| Antibody | PE conjugated rat mAb to mouse CD14 (clone Sa14-2) | BioLegend (Cat# 123309) | RRID:AB_940582 | FCM (1:100) |
| Antibody | PE conjugated recombinant antibody (Ab) to Dectin-1 (REA154) | Miltenyi Biotec (Cat# 130-102-987) | RRID:AB_2651541 | FCM (1:5) |
| Antibody | PE conjugated recombinant Ab to CD47 (REA170) | Miltenyi Biotec (Cat# 130-103-108) | RRID:AB_2659745 | FCM (1:10) |
| Antibody | Rat mAb to myelin basic protein (MBP) (clone 12) | Merck (Cat# MAB386) | RRID:AB_94975 | IHC (1:500) |
| Antibody | Rabbit pAb to Olig2 | Immuno-Biological Laboratories (Gunma, Japan) (Cat# 18953) | RRID:AB_1630817 | IHC (1:400) |
| Antibody | Alexa Fluor 488 goat anti-rabbit IgG | Molecular Probes (Cat# A11034) | RRID:AB_2576217 | IHC (1:200) |
| Antibody | Cy3-conjugated AffiniPure Goat anti-rabbit IgG | Jackson Immuno Research (Cat# 111-165-144) | RRID:AB_2338006 | IHC (1:400) |
| Antibody | Cy3-conjugated AffiniPure Goat anti-rat IgG | Jackson Immuno Research (Cat# 112-165-167) | RRID:AB_2338251 | IHC (1:200) |
| Antibody | Cy3-conjugated AffiniPure Goat anti-mouse IgG | Jackson Immuno Research (Cat# 115-165-166) | RRID:AB_2338692 | IHC (1:400) |
| Antibody | Streptavidin, Alexa Fluor 488 conjugate | Molecular Probes (Cat# S11223) | RRID:AB_2336881 | IHC (1:400) |
| Commercial assay or kit | Black-Gold II myelin staining kit | Merck | Cat# AG105 | |
| Commercial assay or kit | Tyramide Signal Amplification (TSA) Biotin System kit | Perkin Elmer | Cat# NEL700A001KT | |
| Commercial assay or kit | RNeasy Mini kit | Qiagen | Cat# 74106 | |
| Commercial assay or kit | QuantiTect Reverse Transcription kit | Qiagen | Cat# 205313 | |
| Commercial assay or kit | QuantiTect SYBR Green PCR kit | Qiagen | Cat# 204143 or 24163 | |
| Commercial assay or kit | GeneChip 3’IVT Express Kit | Affymetrix | Cat# 901228 or 901229 | |
| Commercial assay or kit | Ovation Pico WTA system V2 | NuGEN | Cat# 3302–12/−60/–A01 | |
| Commercial assay or kit | Encore Biotin Module | NuGEN | Cat# 4200–12/−60/–A01 | |
| Chemical compound, drug | Tamoxifen | Toronto Research Chemicals Inc. | Cat# T006000 | |
| Chemical compound, drug | 4',6-Diamidino-2- phenylindole | Nacalai Tesque (Kyoto, Japan) | Cat# 11034–56 | |
| Chemical compound, drug | Percoll | GE Healthcare Life Science (Uppsala, Sweden) | Cat# 17089102 | |
| Chemical compound, drug | Sepasol RNA I | Nacalai Tesque (Kyoto, Japan) | Cat# 09379–55 | |
| Chemical compound, drug | cuprizone | Sigma | Cat# C9012-25G | |
| Software, algorithm | FlowJo 8.8.4 software | Tree Star Inc. | RRID:SCR_008520 | |
| Software, algorithm | iTEM software | Olympus SIS | ||
| Software, algorithm | ImageJ | PMID: 22930833 | RRID:SCR_003070 | |
| Software, algorithm | Database for Annotation, Visualization and Integrated Discovery (DAVID) ver. 6.8 | PMID: 19033363 PMID: 19131956 | RRID:SCR_001881 |
Additional files
-
Supplementary file 1
Gene expression changes in the white matter of CD47 KO mice.
All genes changed more than 2-fold (|Log2 ratio| > 1) in the white matter of CD47 KO mice are listed. Probe set ID#, Affymetrix probe set ID number for Mouse 430 2.0 Genome Arrays; gene, gene description; symbol, gene symbol; accession, NCBI accession number; Log2 ratio, fold change expressed as Log2 (KO/WT).
- https://doi.org/10.7554/eLife.42025.017
-
Supplementary file 2
Gene expression changes in the brain mononuclear cells of CD47 KO mice.
All genes changed more than 2-fold (|Log2 ratio| > 1) in the brain mononuclear cells of CD47 KO mice were listed. Probe set ID#, Affymetrix probe set ID number for Mouse 430 2.0 Genome Arrays; gene, gene description; symbol, gene symbol; accession, NCBI accession number; Log2 ratio, fold change expressed as Log2 (KO/WT).
- https://doi.org/10.7554/eLife.42025.018
-
Supplementary file 3
Immunostaining of SIRPα in the spleen of SIRPα cKO mice.
Spleens were isolated from control (SIRPα-flox:—) and SIRPα cKO (SIRPα-flox:Cx3cr1-CreERT2) mice 4 (upper panels) or 12 (lower panels) weeks after the administration of tamoxifen (TAM). Immunofluorescence staining with specific antibodies to SIRPα (red) are shown. The white pulp areas (WP) were surrounded by a white dotted line. Scale bar: 200 μm.
- https://doi.org/10.7554/eLife.42025.019
-
Supplementary file 4
Expression of CD47 on microglia prepared from SIRPα cKO mice.
Cells were isolated from the spinal cord of control (SIRPα-flox:— (Ctrl)) or SIRPα cKO (SIRPα-flox:Cx3cr1-CreERT2) mice at 25–28 wks of age, and the expression of SIRPα and CD47 on CD11b+/CD45dim/lo microglia were analysed by flow cytometry. Expression profiles for SIRPα and CD47 in CD11b+/CD45dim/lo microglia are shown. Filled and open traces indicate control and SIRPα cKO mice, respectively.
- https://doi.org/10.7554/eLife.42025.020
-
Supplementary file 5
An example of the quantification of demyelination size in the white matter of cuprizone -fed mice.
A brain section prepared fromSIRPα-flox:— mice fed with a 0.2% (w/w) cuprizone diet for five weeks (Cpz 5 wks) were subjected to immunofluorescence staining with specific antibodies to MBP (red in the left panel). The white matter area analysed in the image is surrounded by a yellow line. Demyelination area with low MBP-immunoreactivity in the white matter area was shown in the right panel as filled (black) area. Ratio of area size (pixel number) of the demyelination area (black in the right panel) to that of the white matter area (black + white in the right panel) was calculated. alv, hippocampal alveus; cc, corpus callosum; cg, cingulum. Scale bar: 200 μm.
- https://doi.org/10.7554/eLife.42025.021
-
Transparent reporting form
- https://doi.org/10.7554/eLife.42025.022
-
Reporting standard 1
NC3Rs ARRIVE guidelines checklist.
- https://doi.org/10.7554/eLife.42025.023
Download links
A two-part list of links to download the article, or parts of the article, in various formats.
Downloads (link to download the article as PDF)
Open citations (links to open the citations from this article in various online reference manager services)
Cite this article (links to download the citations from this article in formats compatible with various reference manager tools)
Microglial SIRPα regulates the emergence of CD11c+ microglia and demyelination damage in white matter
eLife 8:e42025.
https://doi.org/10.7554/eLife.42025


