Anatomical and physiological foundations of cerebello-hippocampal interaction
- CNRS UMR 8246, INSERM, UMR-S 1130, Sorbonne Universités, University Pierre and Marie Curie, France
- CNRS and Aix Marseille Université, France
Figures
Figure 1 with 5 supplements
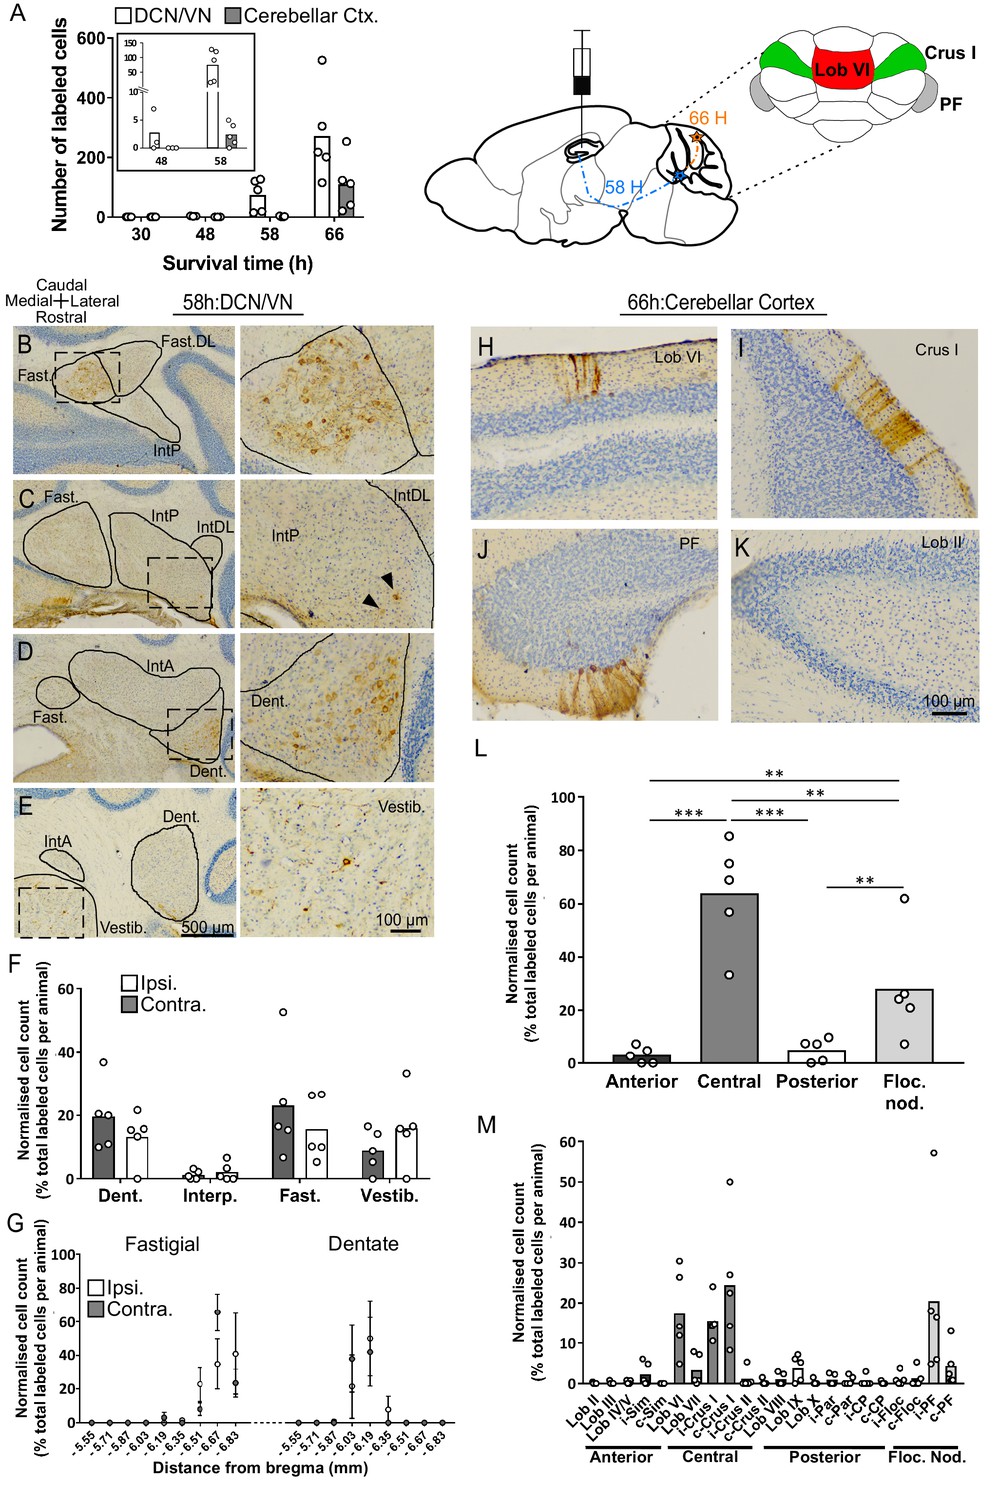
Topographically restricted regions of cerebellar cortex are connected to the hippocampus.
(A) Left, mean number of labeled cells in the deep cerebellar nuclei (DCN), vestibular nuclei (VN) and cerebellar cortex at different survival times following rabies injection in left hippocampal dentate gyrus. Box shows a magnification of the labeling at 48 and 58 hr (n = 5 mice for 58 hr and 66 hr, 30 hr, n = 4 mice and 48 hr, n = 3 mice). Middle, schematic representation of rabies injection site and survival times required to reach the cerebellar and vestibular nuclei (58 hr, dashed blue line), and cerebellar cortex (66 hr, orange line). Upper right, schematic view of the posterior cerebellar cortex indicating regions of highest labeling following rabies virus injection (red, vermis lobule VI; green, Crus I; gray, paraflocculus). (B-E) Representative photomicrographs showing labeling in the cerebellar and vestibular nuclei 58 hr post-infection. Left panels show low-magnification view, right panels show magnified view of area indicated by dashed box. Solid arrow heads indicate the presence of the very few labeled cells in the IntP. (F) Pooled, normalized counts of rabies labeled cells in the ipsi- and contralateral cerebellar and vestibular nuclei 58 hr post-infection (n = 5 mice). No significant differences were found between ipsi- and contralateral nuclei (nuclei x hemisphere two-way ANOVA, hemisphere effect F (1, 4)=1.31×10⁻⁵, p=0.99, interaction effect F (3, 12)=2.79, p=0.09, nuclei effect F (3, 12)=9.38, p=0.002). (G) Normalized cell counts in the fastigial nucleus (left) and dentate nucleus (right), according to their rostro-caudal position relative to bregma. Open circles, contralateral count; filled circles, ipsilateral count (n = 5 mice). (H-K) Representative photomicrographs of the resultant labeling in lobule VI, Crus I, paraflocculus and lobule II at 66 hr post-infection. (L) Normalized count of rabies labeled cells in anterior (black bar; lobule II to lobule IV/V); central (dark gray bar; lobule VI to Crus II); posterior (clear bar; lobule VIII and lobule IX) and flocculonodular (Floc. Nod., light gray bar; lobule X, flocculus and paraflocculus) cerebellum 66 hr post-infection (n = 5 mice; one-way ANOVA with FDR correction, F (3, 16)=19.11, p<0.0001). (M) Normalized cell count of rabies labeled cells in all assessed lobules 66 hr post-infection. Color coding of bars indicate assignment of lobules to either anterior, central, posterior or vestibular cerebellum as indicated in L. Abbreviations: Dent., Dentate nucleus; Fast., fastigial nucleus; Fast. DL, dorsolateral fastigial nucleus; Floc. Nod., flocculonodular lobe; Interp., nucleus interpositus; IntA, nucleus interpositus anterior; IntDL, dorsolateral nucleus interpositus; IntP, nucleus interpositus posterior; i-Sim, ipsilateral simplex lobule; c-Sim, contralateral simplex lobule; i-Crus I, ipsilateral Crus I; c-Crus I, contralateral Crus I; i-Crus II, ipsilateral Crus II; c-Crus II, contralateral Crus II; i-Par, ipsilateral paramedian lobule; c-Par, contralateral paramedian lobule; i-CP, ipsilateral copula; c-CP, contralateral copula; i-Floc, ipsilateral flocculus; c-Floc, contralateral flocculus; i-PF, ipsilateral paraflocculus; c-PF, contralateral paraflocculus; Vestib., vestibular nuclei. ** q < 0.01, *** q < 0.001.
-
Figure 1—source data 1
Summary table of RABV labeling in the cerebellum 58 hr post hippocampal infection.
Quantification of the number of rabies-positives cells in the ipsi- (i.) and contra-lateral (c.) side of the cerebellar cortex, the deep cerebellar and vestibular nuclei. Nu, nucleus; Lob, lobule; pm, paramedian lobe; cop, copula pyramidis.
- https://doi.org/10.7554/eLife.41896.008
Figure 1—figure supplement 1
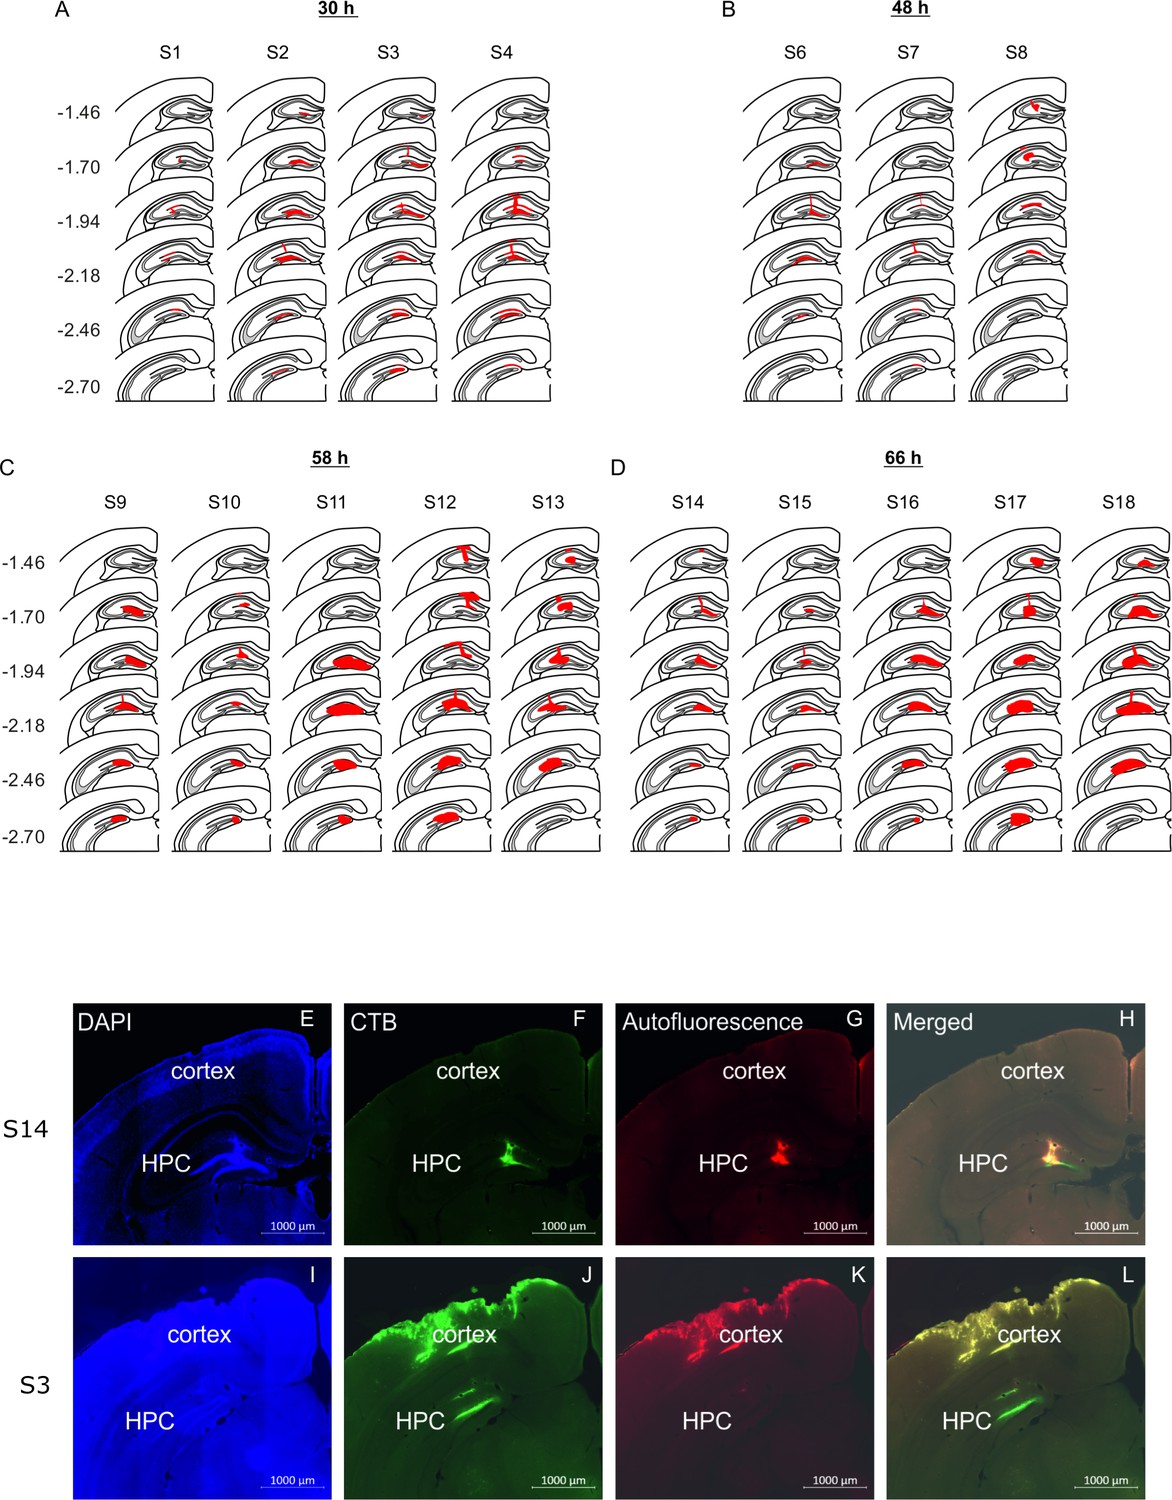
Location of rabies virus injections for the four experimental groups.
RABV was co-injected with fluorescent CTB to visualize the injection spread. (A-D) The location of the injection is indicated by the red area on a standard coronal outline of the left hippocampus for the 30 hr (A), the 48 hr (B), the 58 hr (C) and the 66 hr (D) survival time groups. Rostro-caudal position relative to bregma is indicated on the left (mm). Experimental ID for each case is shown above the sections. (E) Representative photomicrographs from two mice (S14 and S3) illustrating the spread of CTB used to define the site of rabies injection in the hippocampus.
Figure 1—figure supplement 2
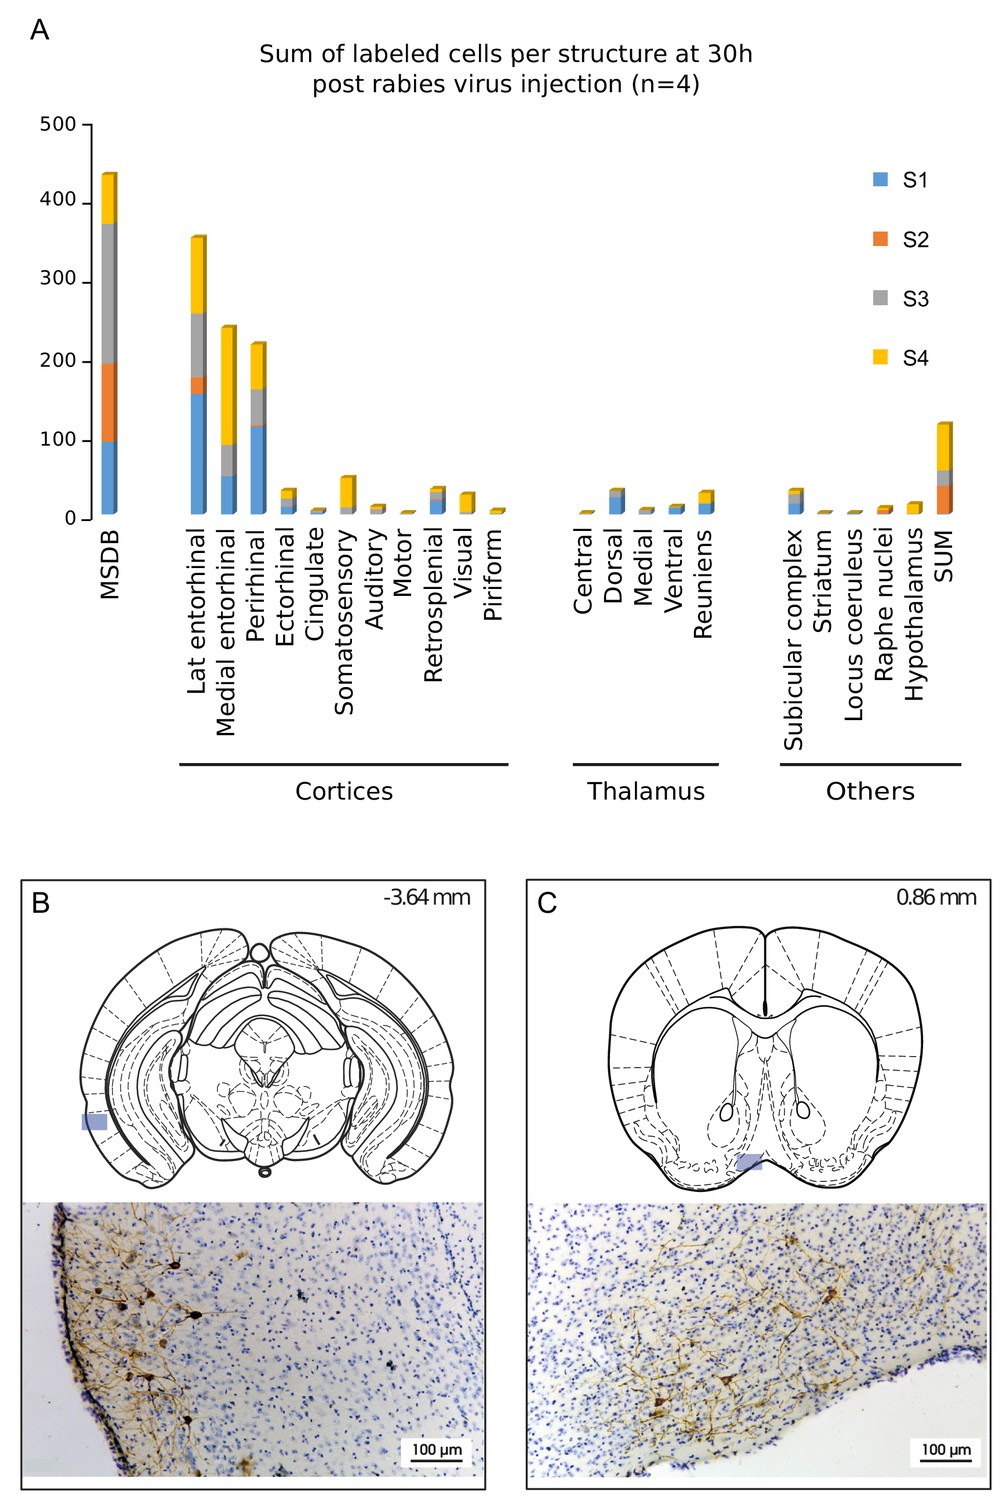
Structures labeled 30 hr after hippocampal rabies injection.
(A) Cumulative sum of labeled cells per structure 30 hr post-hippocampal rabies injection (color coded for each case, n = 4 mice). B-C, Localization and representative photomicrographs of RABV in the two main labeled regions at 30 hr, the lateral entorhinal cortex (B) and the MSDB (C). The position is indicated by a blue insert on a standard coronal outline of a brain section, and rostro-caudal position according to Bregma is indicated in the top-right corner. Abbreviations, Lat entorhinal cortex, lateral entorhinal cortex; MSDB, medial septum/diagonal band of Broca; SUM, supramammillary nucleus.
Figure 1—figure supplement 3

Analysis of CTB retrograde labeling indicates that rabies labeled structures at 30 hr post-infection are potential first relay regions.
(A-E) Localization and representative photomicrographs of CTB-positive cells (red) in the entorhinal cortex, MSDB, SUM, hypothalamus and Raphe Nucleus, confirming that these regions are putative first relays to the hippocampus. Coronal sections are counterstained with DAPI (blue). The localization of the CTB staining is indicated by a blue insert on a standard coronal outline of a brain section, and rostro-caudal position according to Bregma is indicated in the top-right corner. Abbreviations; MSDB, medial septum/diagonal band of Broca; SUM, supramammillary nucleus.
Figure 1—figure supplement 4
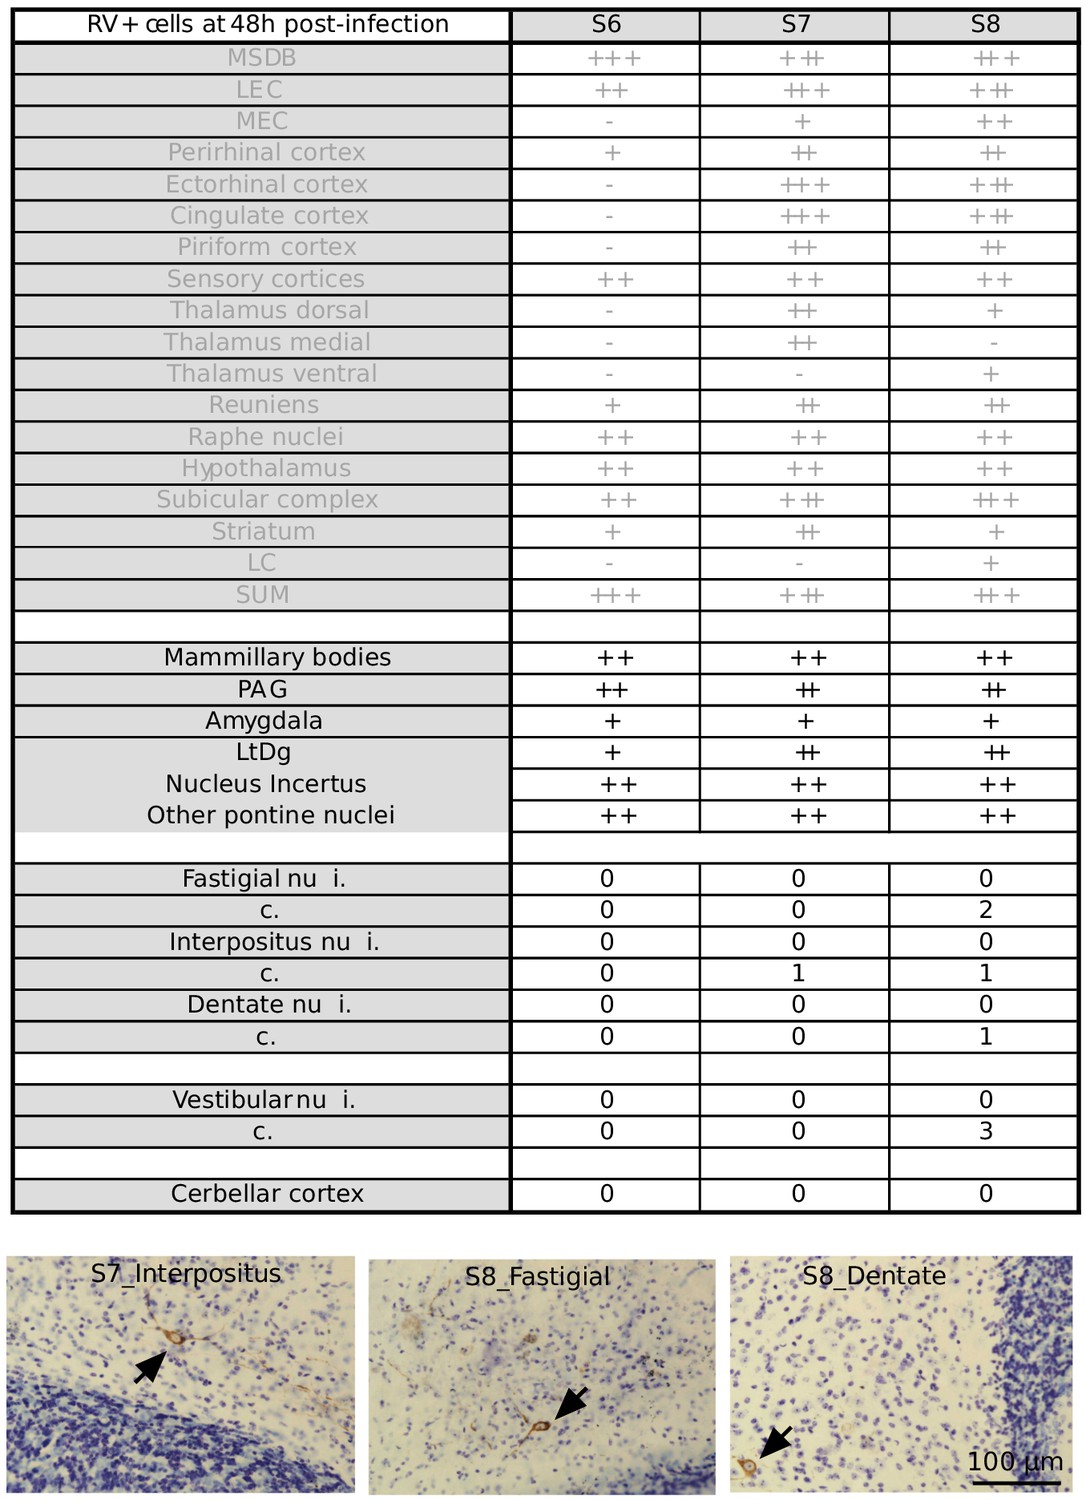
Summary table of RABV labeling across brain structures 48 hr after hippocampal rabies injection Overview of RABV labeling in different brain regions 48 hr post rabies injection in the hippocampus.
The regions that were already stained at 30H post-infection are represented in gray. In two mice, few rabies-positive cells were detected in the deep cerebellar and vestibular nuclei. (-) denotes no labeling, (+/-) few cells, (+) minor labeling, (++) fair labeling, (+++) strong labeling. For the deep cerebellar and vestibular nuclei, ipsi (i.) and contralateral (c.) sides are distinguished. Sensory cortices include somatosensory, auditory and visual cortices. MSDB, medial septum/diagonal band of Broca; LEC, lateral entorhinal cortex; MEC, medial entorhinal cortex; LC, locus coeruleus; SUM, supramammillary nucleus; PAG, periaqueductal gray; LtDg, laterodorsal tegmental nucleus.
Figure 1—figure supplement 5

The topographical distribution of DCN labeling at 66 hr.
(A-D) representative photomicrographs showing labeling in the ipsilateral cerebellar and vestibular nuclei 66 hr after hippocampal rabies injection. Left panels show low magnification view, right panels show high-magnification view of area indicated by dashed box. E, Pooled, normalized counts of rabies labeled cells in the ipsi- and contralateral cerebellar and vestibular nuclei (n = 5 mice). No significant differences were found between ipsi- and contralateral nuclei (nuclei x hemisphere two-way ANOVA, hemisphere effect F (1, 4)=1.14, p=0.35, interaction effect F (3, 12)=0.21, p=0.89, nuclei effect F (3, 12)=7.88, p=0.004). F, Normalized cell counts in the fastigial nucleus (left) and dentate nucleus (right) according to their rostro-caudal position relative to Bregma. Open circles, contralateral count; filled circles, ipsilateral count (n = 5 mice). Abbreviations: Dent., Dentate nucleus; Fast., fastigial nucleus; Fast. DL, dorsolateral fastigial nucleus; Interp., nucleus interpositus; IntA, nucleus interpositus anterior; IntDL, dorsolateral nucleus interpositus; IntP, nucleus interpositus posterior; Vestib., vestibular nuclei.
Figure 2
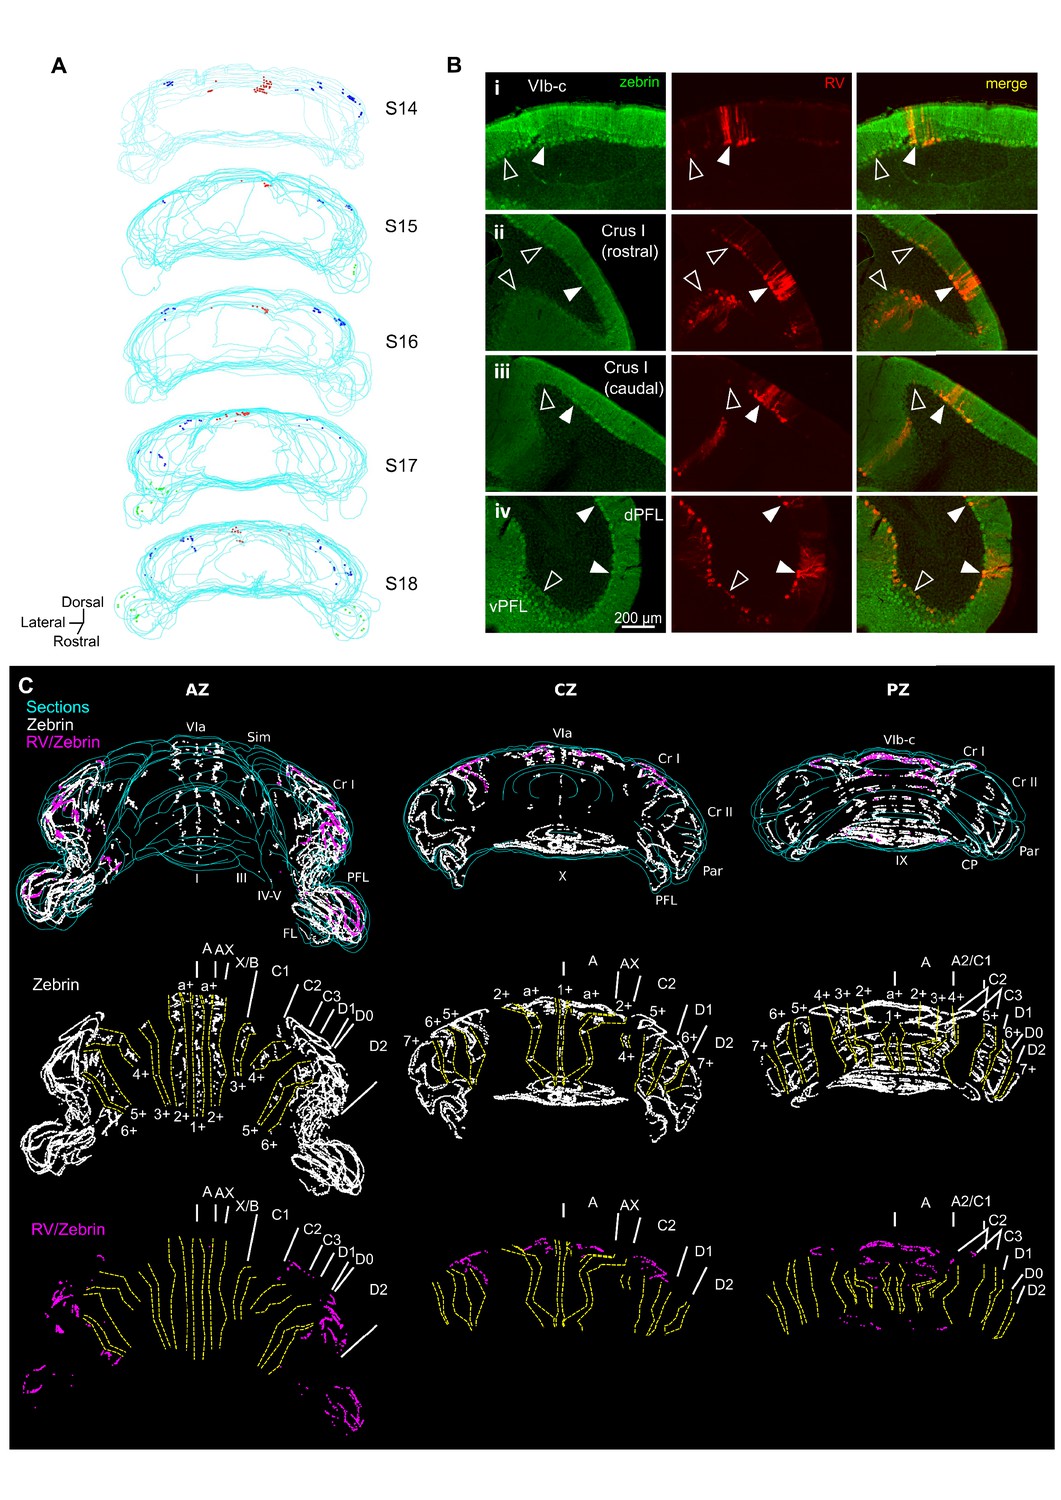
Different cerebellar modules project to the hippocampus.
(A) 3-D reconstruction showing the location of RABV+ Purkinje cells in the most labeled cerebellar lobules at 66 hr post-infection. Red, blue and green dots represent RABV+ Purkinje cells in lobule VI, Crus I and paraflocculus, respectively. (B) Photomicrographs from case S18 showing double staining against zebrin II (green, left column), RABV (red, central column) and merge (right column) in lobule VI (i), Crus I (ii and iii) and paraflocculus (iv). RABV+ Purkinje cells were also zebrin positive and were organized in clusters of strongly labeled RABV+ cells (filled arrow-heads) surrounded by weakly labeled RABV+ Purkinje cells (unfilled arrow-heads). (C) Assignment of the RABV+ clusters to specific cerebellar modules for case S18 in the anterior (AZ; left), central (CZ; central column) and posterior (PZ; right column) zones. First row shows stacked sections with zebrin-positive Purkinje cells (white dots) and RABV+ Purkinje cells, which were also zebrin positive (purple dots, strong and weakly labeled cells included); central row shows reconstructed principal zebrin bands (delineated by yellow dashed lines and named from 1+ to 7+; nomenclature from Sugihara and Quy, 2007) and cerebellar modules (capital letters; defined as in Sugihara and Quy, 2007); and bottom row shows the location of the RABV+/zebrin Purkinje cells (purple dots) in relation to reconstructed zebrin bands and modules. Abbreviations, I, lobule I; III, lobule III; IV/V, lobule IV/V; VIa and VI b-c, lobule VIa and VI b-c, respectively; IX, lobule IX; X, lobule X; Sim, lobule simplex; Cr I, Crus I; Cr II, Crus II; Par, paramedian lobule; CP, copula, PFL, paraflocculus, FL, flocculus.; dPFC and vPFC, dorsal and ventral paraflocculus, respectively.
Figure 3 with 4 supplements

Assessment of cerebello-hippocampal interactions during active movement in the homecage.
(A) Schematic representation of recording and stimulation electrode implant positions. (B) Representative simultaneous raw LFP recordings (colored lines) and LFP filtered in the theta frequency range (θ, 6–12 Hz, overlaid gray lines) recorded during active movement in the homecage condition as defined by instantaneous speed. Solid magenta line indicates data epochs in which speed was above the required threshold for inclusion in further analysis (3 cm/s, dashed line (20 mice). In one mouse in which speed data was not available we used neck electromyograph (EMG) data to define periods of active movement). (C) Averaged z-score of the power spectra from hippocampal LFP (n = 21, mean between left and right hemisphere LFPs when both recording electrodes were on target) and cerebellar cortical regions Crus I (n = 12), lobule II/III (n = 13) and lobule VI (n = 16) during homecage exploration (speed above 3 cm/s). (D) Probability distribution of the instantaneous z-scored theta power for each of the recorded regions. Hippocampal theta power followed a negatively skewed distribution while cerebellar theta power followed a positively skewed distribution. (E) Correlation between the instantaneous z-scored theta power for each of the cerebellar recorded regions and instantaneous speed. Horizontal line indicates mean. Gray-shaded bars represent the confidence levels obtained from bootstrapped data with α = 0.05. Theta power was not significantly correlated with speed in any of the cerebellar recordings (Crus I, n = 11; lobule II/III, n = 12; lobule VI, n = 15). (F) Averaged coherence between cerebellar cortical recordings (color coded) and hippocampus (when both hippocampal recording electrodes were on target we averaged the coherence obtained with left and right hemispheres; Crus I, n = 12; lobule II/III, n = 13; lobule VI, n = 16) during homecage exploration (speed above 3 cm/s). (G) Probability distribution of the instantaneous hippocampal-cerebellar theta coherence (color coded). All the recording combinations followed normal distributions. (H) Correlation between the instantaneous hippocampal-cerebellar theta coherence (color coded) and the instantaneous speed. Horizontal line indicates mean. Gray-shaded bars represent the confidence levels obtained from bootstrapped data with α = 0.05. HPC-cerebellar theta coherence was not significantly correlated with speed in any of the recording combinations. (I) Theta coherence between cerebellar recordings and hippocampus (average between coherence with left and right hemisphere LFPs when both recordings were on target; Crus I - HPC, n = 12; lobule II/III - HPC, n = 13; lobule VI - HPC, n = 16). Lobule VI-HPC coherence was significantly higher than that observed with lobule II/III (horizontal line indicates median coherence for each combination; *, Kruskal-Wallis with FDR correction, Kruskal-Wallis statistic = 6.75, p = 0.0342; lobule VI-HPC vs lobule II/III-HPC, p = 0.0246). J, Mean lobule VI-HPC theta coherence plotted against the estimated medio-lateral position of the recording electrode in lobule VI (red dots; n = 16, when both hippocampal recording electrodes were on target we averaged the coherence obtained with left and right hemispheres; Spearman rho = 0.5718, p = 0.0225). In gray, number of RABV+ cells counted across lobule VI 66 hr after injection in the left HPC as a function of medio-lateral position (0.2 mm bins; n = 5 mice). Shading indicates S.E.M. Abbreviations, LFP, local field potential; HPC, dorsal hippocampus; lob II/III, lobule II/III, lob VI, lobule VI, MFB stim, medial forebrain bundle stimulation.
-
Figure 3—source data 1
Assessment of cerebello-hippocampal interactions during active movement in the homecage.
- https://doi.org/10.7554/eLife.41896.015
Figure 3—figure supplement 1

Reconstructed location of the implanted electrodes.
The position of the implanted electrodes are represented by black dots on a standard sagittal outline of the cerebellum (A) or coronal outline of the hippocampus (B). The medio-lateral (in A) or rostro-caudal (in B) positions relative to midline or bregma, respectively, are indicated next to the outlines. Abbreviations, II, lobule II; III, lobule III; IV/V, lobule IV/V; VI, lobule VI; VII, lobule VII; VIII, lobule VIII; IX, lobule IX; X, lobule X; Sim, lobule simplex; PM, paramedian lobule.
Figure 3—figure supplement 2
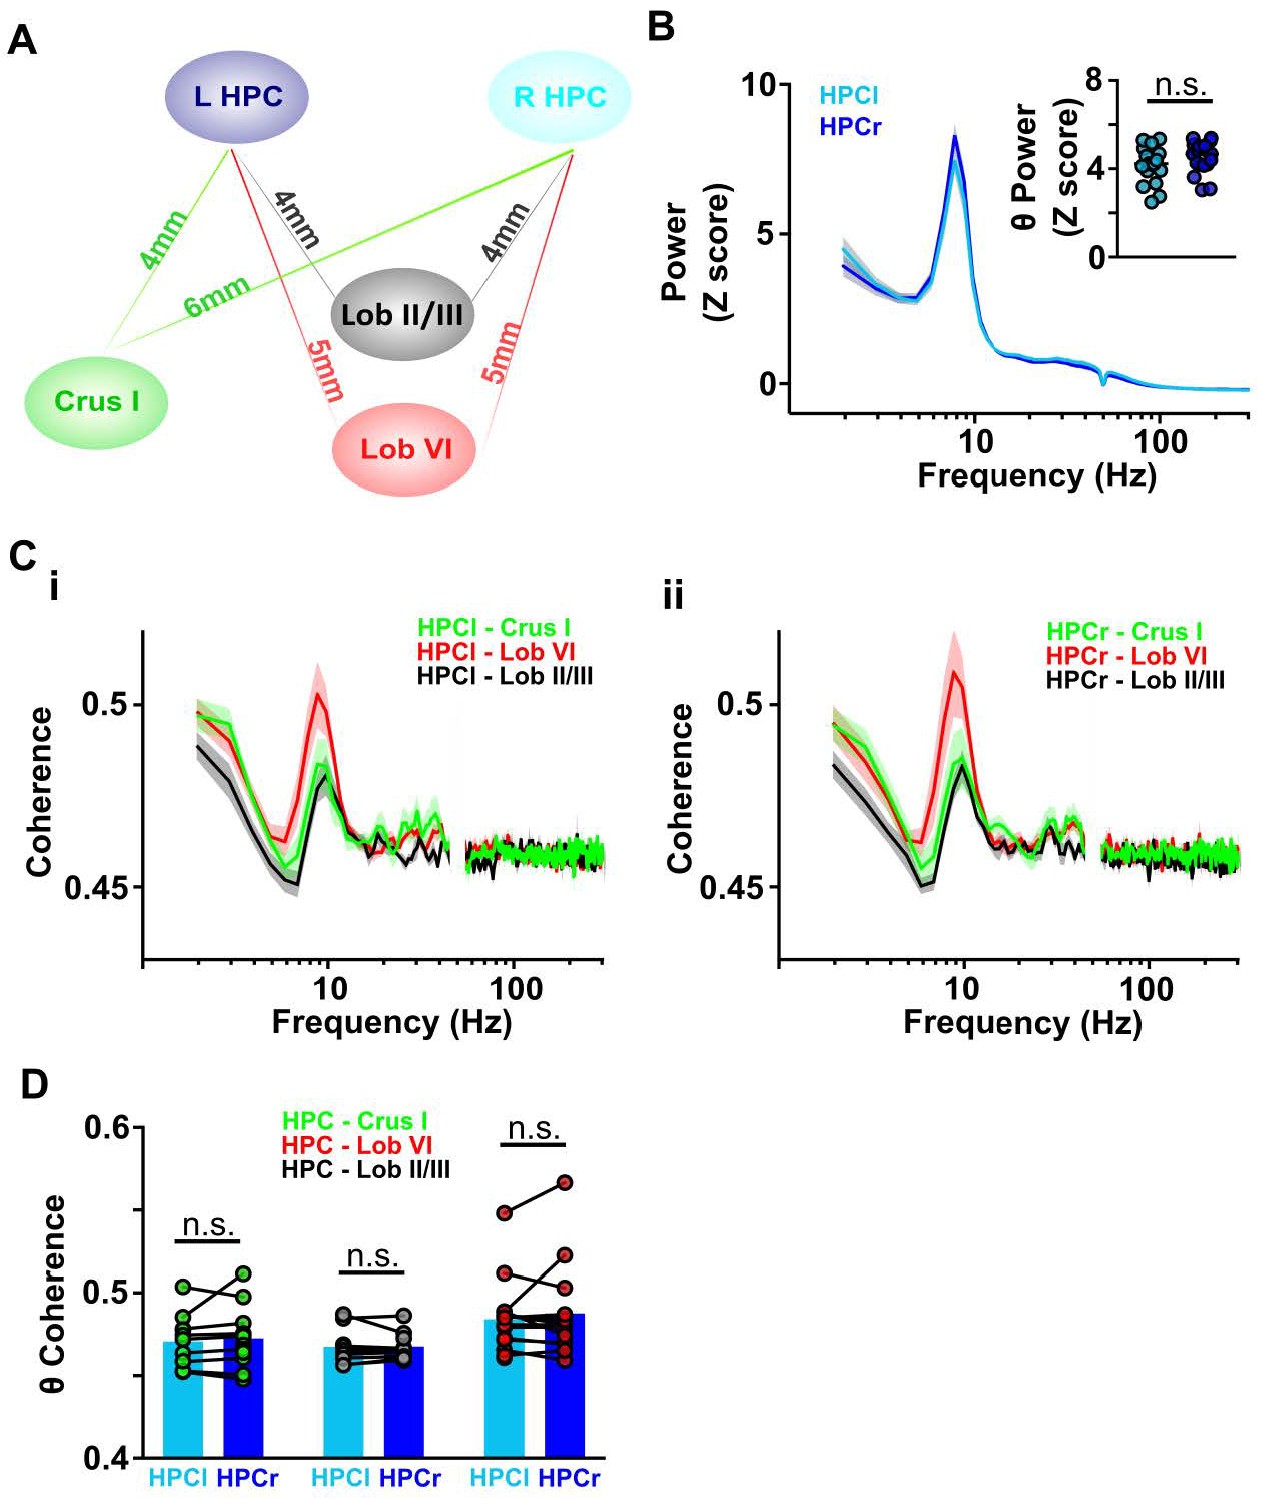
Cerebello-hippocampal coherence patterns are similar across hemispheres during active movement in homecage.
(A) Schematic indicating approximate distances between recording sites in the cerebellum and left/right dorsal hippocampus (HPC). (B) Averaged LFP power from HPC left (light blue, n = 17) and HPC right (dark blue, n = 19) from Figure 3C. Inset: No significant difference was observed in the mean theta power between hemispheres (Unpaired t test, t = 1.392, p = 0.1731). (C) Averaged coherence between HPC left and cerebellar regions (i, Crus I, n = 11; lobule II/III = 11; lobule VI, n = 15) and HPC right and cerebellar regions (ii, Crus I, n = 11; lobule II/III = 12; lobule VI, n = 14). (D) Comparisons between cerebello-HPC left (light blue) and cerebello-HPC right (dark blue) theta coherence from panel C. No significant differences were observed for any cerebello-hippocampal combination (Crus I, Mann-Whitney test, U = 59, p = 0.9487; lobule II/III, Mann-Whitney test, U = 63, p = 0.8801; lobule VI, Mann-Whitney test, U = 105, p > 0.99).
Figure 3—figure supplement 3
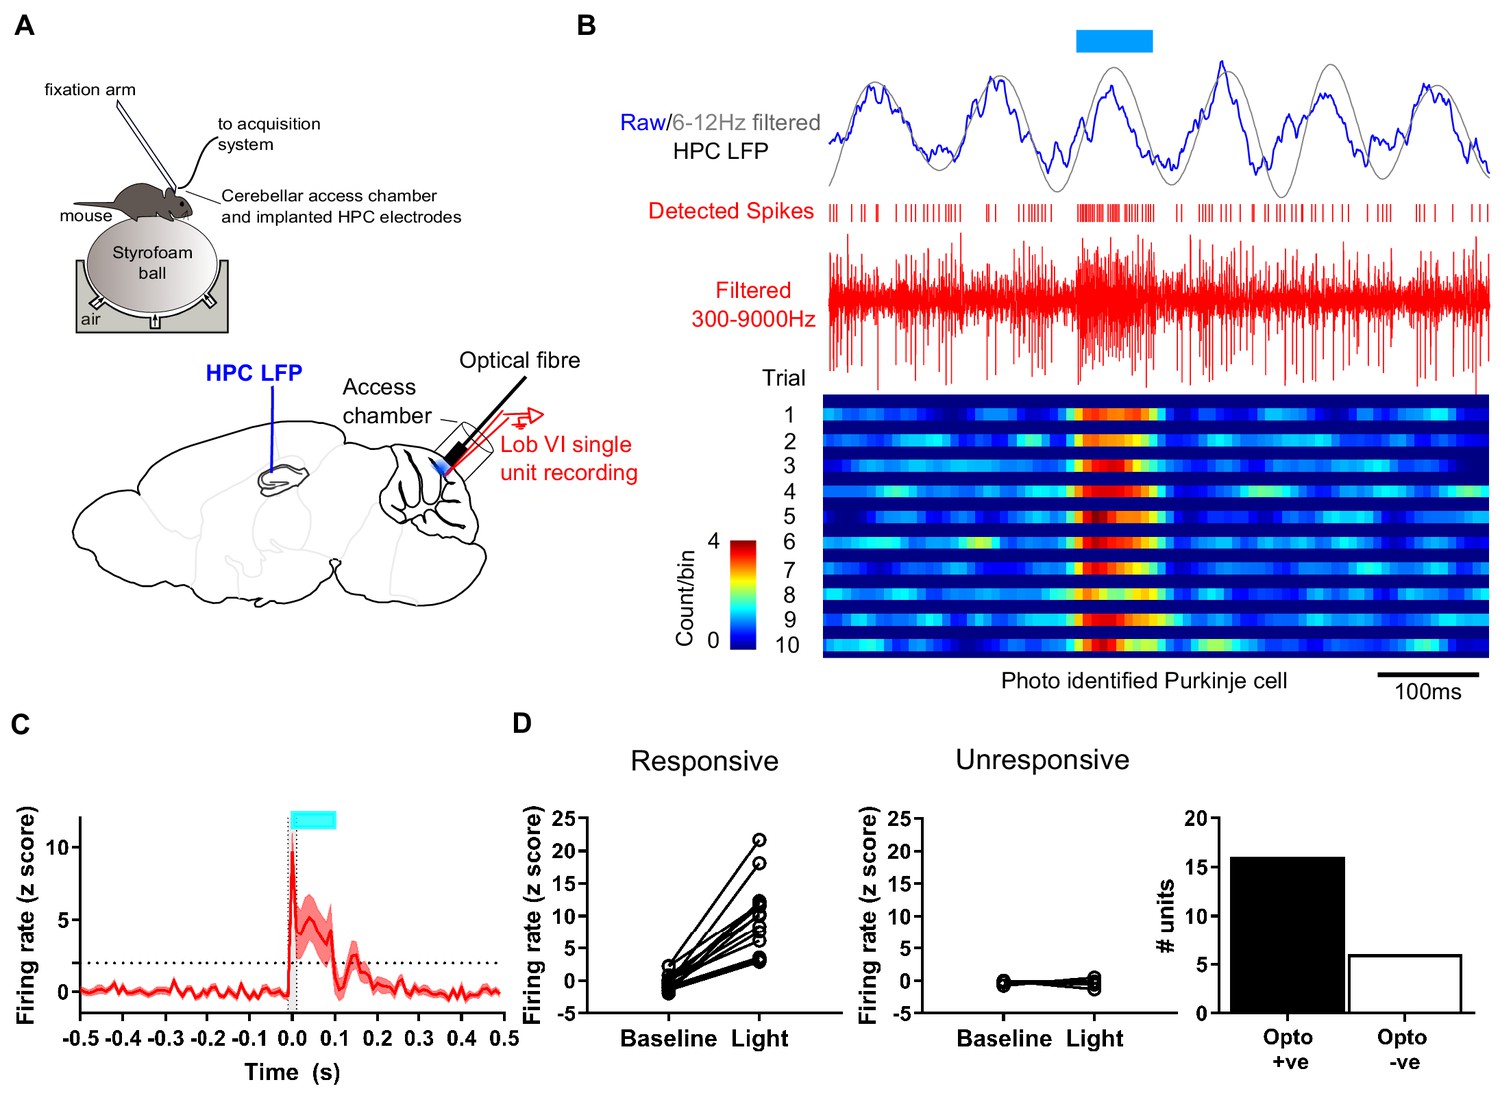
Experimental setup for simultaneous recording of photo-identified Purkinje cells and hippocampal local field potential.
(A) Head-fixed L7-ChR2 mice were allowed to run freely on an air cushioned Styrofoam ball. LFP was recorded from left hippocampus through chronically implanted bipolar electrodes. An access chamber was constructed over the cerebellar vermis, allowing recording access to lobule VI. In addition, an optical fiber was placed on the cerebellar surface near the recording site to allow photo-activation of ChR2 +ve Purkinje cells. (B) Example recording, showing raw and 6–12 Hz filtered hippocampal LFP. Blue horizontal line indicates time of blue light (~460 nm) illumination through the optical fiber. Extracellular unit recording shown in red with detected spikes marked above. Below, color-coded raster plot showing a recorded unit and its activation profile during the blue light illumination period. Bins 10 ms. (C) Mean rate plot of all significantly photo-responsive units recorded in the cerebellum (shaded area indicated s.e.m.). Blue horizontal line indicates timing of blue light illumination. A total of 22 units were recorded from six mice. (D) Of those, 16 units, recorded from four mice, showed a significant increase in firing during the first 10 ms of blue light illumination (Z > 1.96 increase from 10 ms pre-stimulation baseline level; dashed horizontal line) and six units, from four mice, were unresponsive (Z < 1.96 increase from 10 ms pre-stimulation baseline level.
Figure 3—figure supplement 4
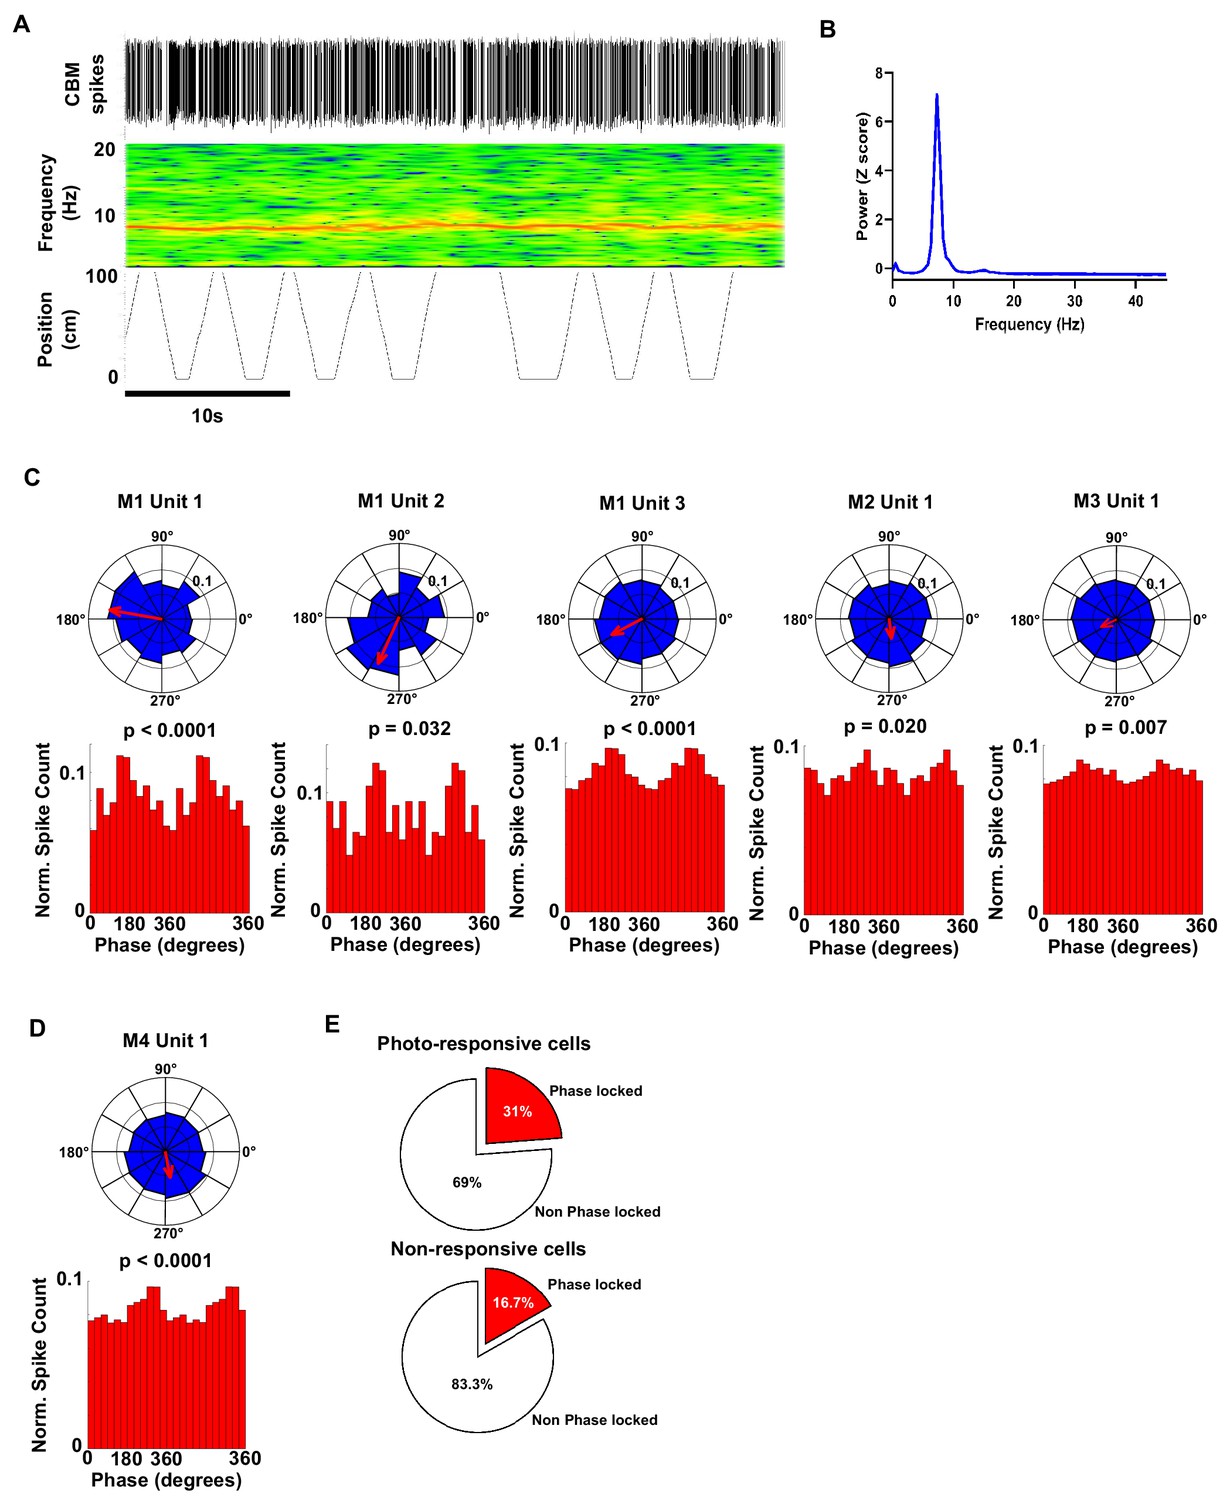
Polar plots and associated histograms of cerebellar units significantly phase locked to hippocampal 6–12 Hz oscillations.
(A) Example 40 s epoch used for analysis of phase locking. Top, detected cerebellar spikes. Middle, hippocampal spectrogram. Bottom, position tracking in virtual reality corridor. (B) Hippocampal power spectra calculated from the epoch shown in A. Note the prominent theta peak (~8 Hz). (C) Individual polar plots and phase distribution histograms for each photo responsive unit (five cells from three mice) that were significantly phase locked to the hippocampal 6–12 Hz oscillation. (D) Polar and phase distribution plots for the single non-responsive unit recorded that was significantly phase locked to hippocampal 6–12 Hz oscillation. P Rayleigh value for each cell plotted above histogram. (E) Pie charts showing the % of photo-responsive (upper) and photo non-responsive units (lower) that were phase locked to the hippocampal 6–12 Hz oscillation. From our sample, 31% (5 from 16 units) of photo-responsive units and 16% of non-responsive units were phase locked to the hippocampal 6–12 Hz oscillation, respectively.
Figure 4 with 4 supplements
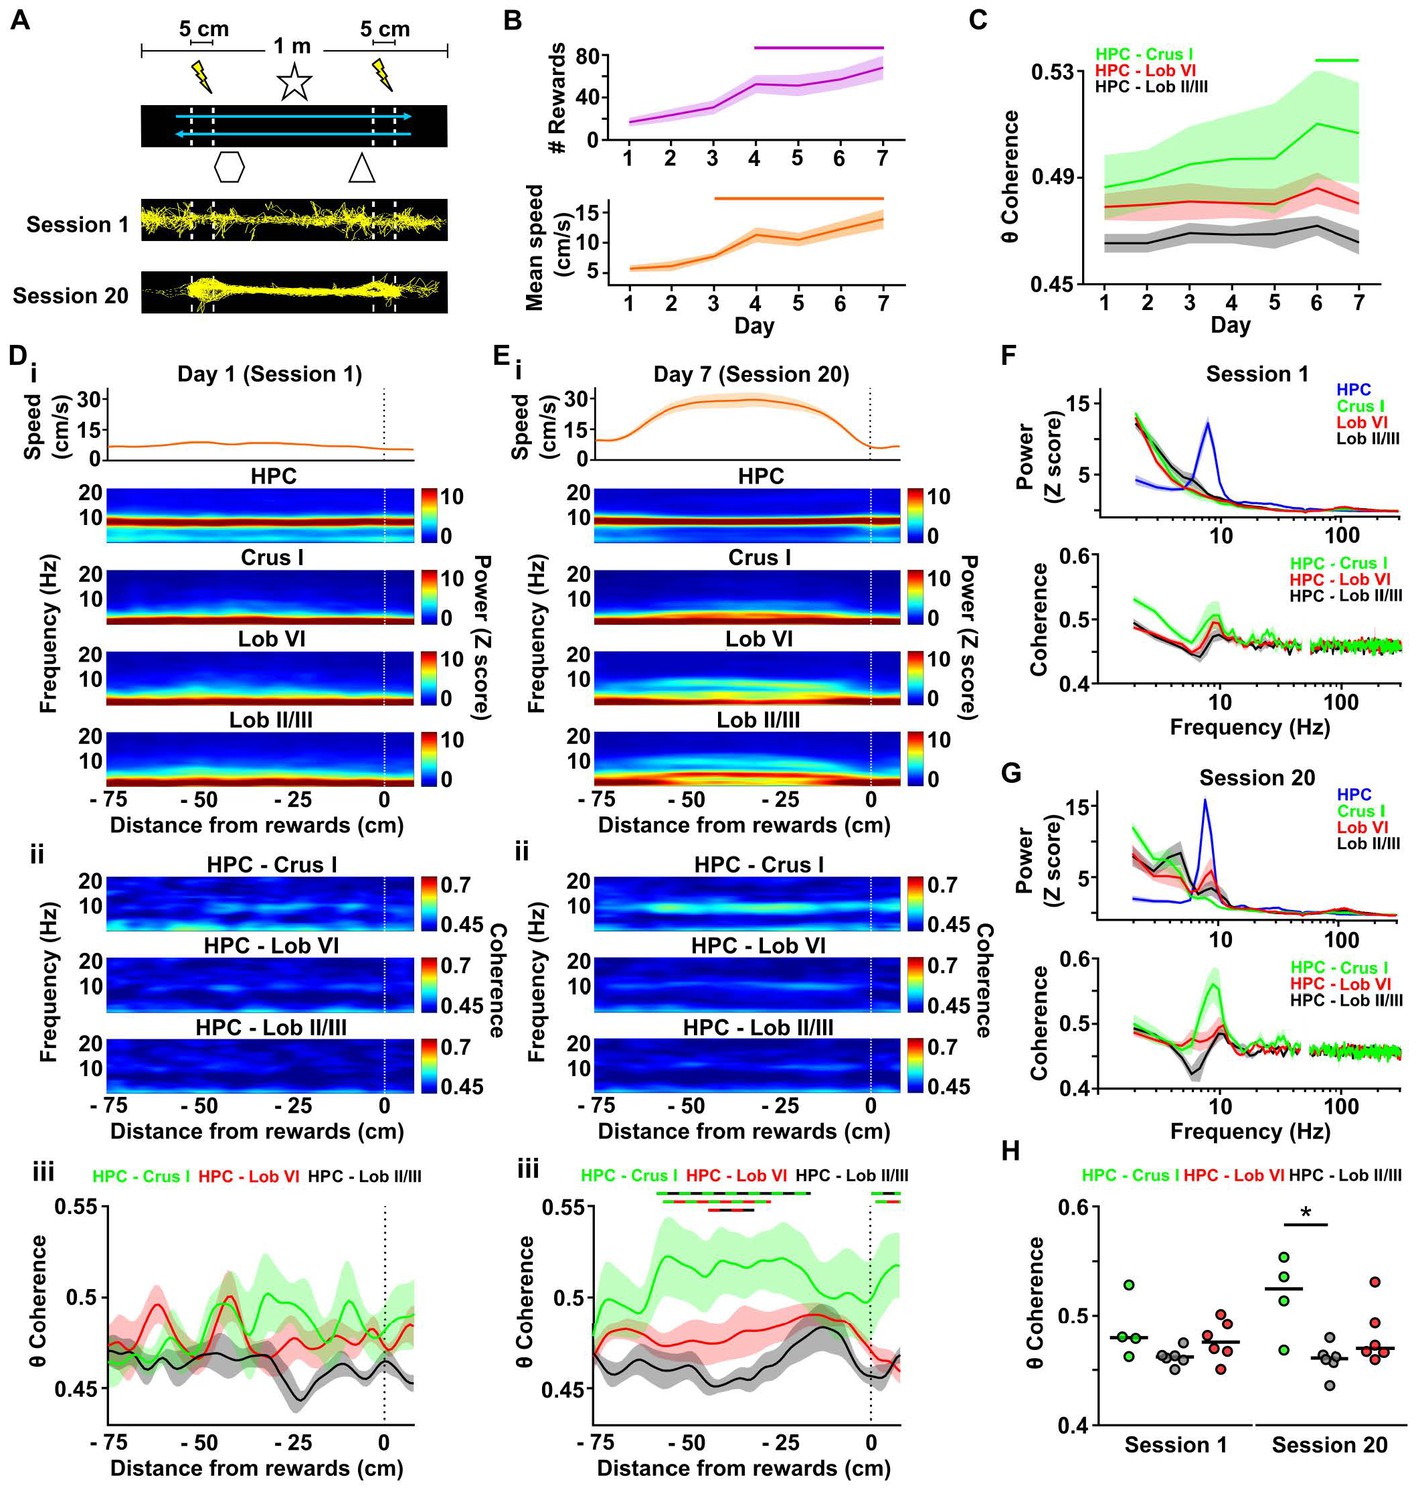
Cerebello-hippocampal interactions during goal-directed behavior.
(A) Mice learned to traverse a 1 m linear track to receive a medial forebrain bundle stimulation (lightening symbols) upon reaching invisible goal zones (n = 8 mice). Representative trajectories from early (session 1) and late (session 20) training show the transition from exploratory to goal-directed behavior. (B) Mice improved their performance in the task across days as shown by increases in the mean number of rewards obtained (average of the three sessions per day, repeated measures Friedman test with FDR correction, Friedman statistic = 37.91, p < 0.0001; solid line, day 1 vs days 4–7, p < 0.01) and mean speed (average of the three sessions per day, repeated measures Friedman test with FDR correction, Friedman statistic = 36.32, p < 0.0001; solid line, day 1 vs days 4–7, p < 0.05). (C) Overall cerebello-hippocampal theta coherence per day (average of the three sessions per day) during learning of the linear track task (when both hippocampal recording electrodes were on target we averaged the coherence obtained with left and right hemispheres; Crus I, n = 4; lobule II/III, n = 6; lobule VI, n = 6). Hippocampus-Crus I coherence increased significantly compared with first day (day of training x cerebello-hippocampal combination two-way ANOVA with FDR correction, day effect F6,84 = 3.873, p = 0.0018; solid line, day 1 vs days 6–7, p < 0.01). (D) i, Top: Mean speed aligned by distance from the reward location (position 0) averaged across runs during session 1. Bottom: Mean power spectrogram aligned by distance from reward and averaged across runs during session one for hippocampus LFP (n = 8, mean between left and right hemisphere LFPs when both hippocampal recordings were on target) and cerebellar cortical regions (Crus I, n = 4; lobule II/III, n = 6; lobule VI, n = 6). ii, Mean coherogram aligned by distance from reward location (position 0) averaged across runs during session one for each hippocampal-cerebellar combination (when both hippocampal recording electrodes were on target we averaged the coherence obtained with left and right; Crus I, n = 4; lobule II/III, n = 6; lobule VI, n = 6). iii, Mean theta coherence aligned by distance from reward and averaged across runs during session one for each hippocampal-cerebellar combination (mean between coherence with left and right hemisphere LFPs when both recordings were on target; Crus I, n = 4; lobule II/III, n = 6; lobule VI, n = 6). No significant differences between hippocampal-cerebellar combination or distances from reward were observed, but a significant interaction effect was obtained (distance x combination two-ways repeated measures ANOVA with FDR correction; combination effect, F2,13 = 2.33, p = 0.1365; distance effect, F84,1092 = 1.043, p = 0.3772; interaction effect, F168,1092 = 1.332, p = 0.0053). (E) Same as D for session 20. Significant differences were observed between hippocampal-cerebellar combinations (distance x combination two-ways repeated measures ANOVA with FDR correction; combination effect, F2,13 = 6.145, p = 0.0132; distance effect, F84,1092 = 1.682, p = 0.0002; interaction effect, F168,1092 = 1.271, p = 0.0163). Post-hoc analysis revealed sustained (at least for five consecutive cm) differences between Crus I-HPC and lobule II/III-HPC coherence at distances from −60 to −20 cm from reward (solid green/black line), between lobule VI-HPC and lobule II/III-HPC coherence between −44 and −31 cm from reward (solid red/black line) and also between Crus I-HPC and lobule VI-HPC coherence between −59 and −36 cm from reward (solid green/red line). (F) Top: Averaged LFP power between −60 and −20 cm from reward (session 1). Bottom: Averaged coherence between −60 and −20 cm from reward (session 1). The spurious peak in the 49–51 Hz band generated for the electrical noise has been removed. (G) Same as J for session 20. (H) Averaged theta coherence between −60 and −20 cm from reward between cerebellar recordings and hippocampus during session 1 (left) and session 20 (right, coherence averaged between left and right hemisphere LFPs when both hippocampal recording electrodes were on target; Crus I, n = 4; lobule II/III, n = 6; lobule VI, n = 6). Crus I-HPC coherence was significantly higher than that observed with lobule II/III in the session 20 (*, Kruskal-Wallis with FDR correction, Kruskal-Wallis statistic = 7.989, p = 0.0103; Crus I-HPC vs lobule II/III-HPC, p = 0.0110).
-
Figure 4—source data 1
Cerebello-hippocampal interactions during goal-directed behavior.
- https://doi.org/10.7554/eLife.41896.021
Figure 4—figure supplement 1
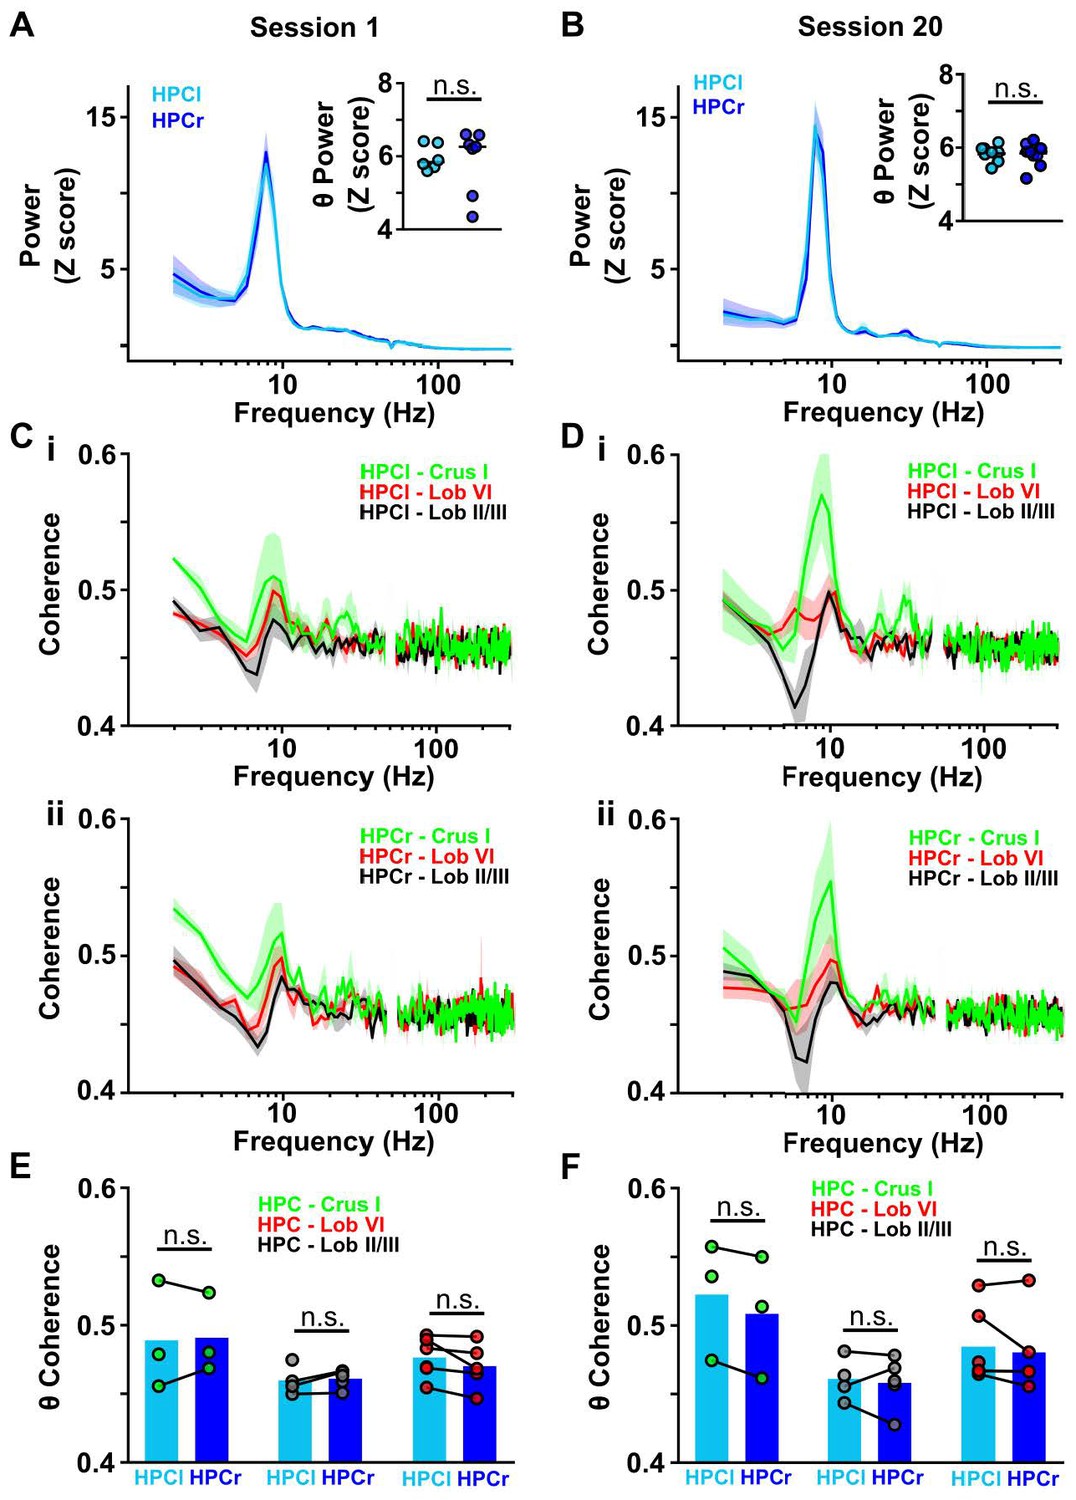
Cerebello-hippocampal coherence patterns are conserved across hemispheres during goal-directed behavior.
(A) Averaged z-score LFP power from HPC left (light blue, n = 6) and HPC right (dark blue, n = 7) from Figure 4J (session 1). Inset: No significant difference in the mean θ power was observed between both hemispheres (Mann-Whitney test, U = 18, p = 0.7308). (B) Same as A but for session 20 (related to Figure 4K). Inset: No significant difference in mean LFP theta power was observed between hemispheres (Mann-Whitney test, U = 20, p = 0.9452). (C) i: Averaged coherence between HPC left and cerebellar regions (color coded) from Figure 4J (Crus I, n = 3; lobule II/III = 4; lobule VI, n = 6). ii: Same for coherence with HPC right (Crus I, n = 3; lobule II/III = 5; lobule VI, n = 5). (D) Same as C for session 20 (related to Figure 4K). (E) Comparisons between cerebello-HPC left (light blue) and cerebello-HPC right (dark blue) theta coherence from panel C (Session 1). No significant differences were observed for any cerebello-hippocampal combination (Crus I, Mann-Whitney test, U = 4, p > 0.99; lobule II/III, Mann-Whitney test, U = 10, p = 0.7302; lobule VI, Mann-Whitney test, U = 10, p = 0.4286). (F) Same as E for session 20 (panel D). No significant differences were observed for any cerebello-hippocampal combination (Crus I, Mann-Whitney test, U = 3, p = 0.7; lobule II/III, Mann-Whitney test, U = 4, p > 0.99; lobule VI, Mann-Whitney test, U = 12, p = 0.6623).
Figure 4—figure supplement 2
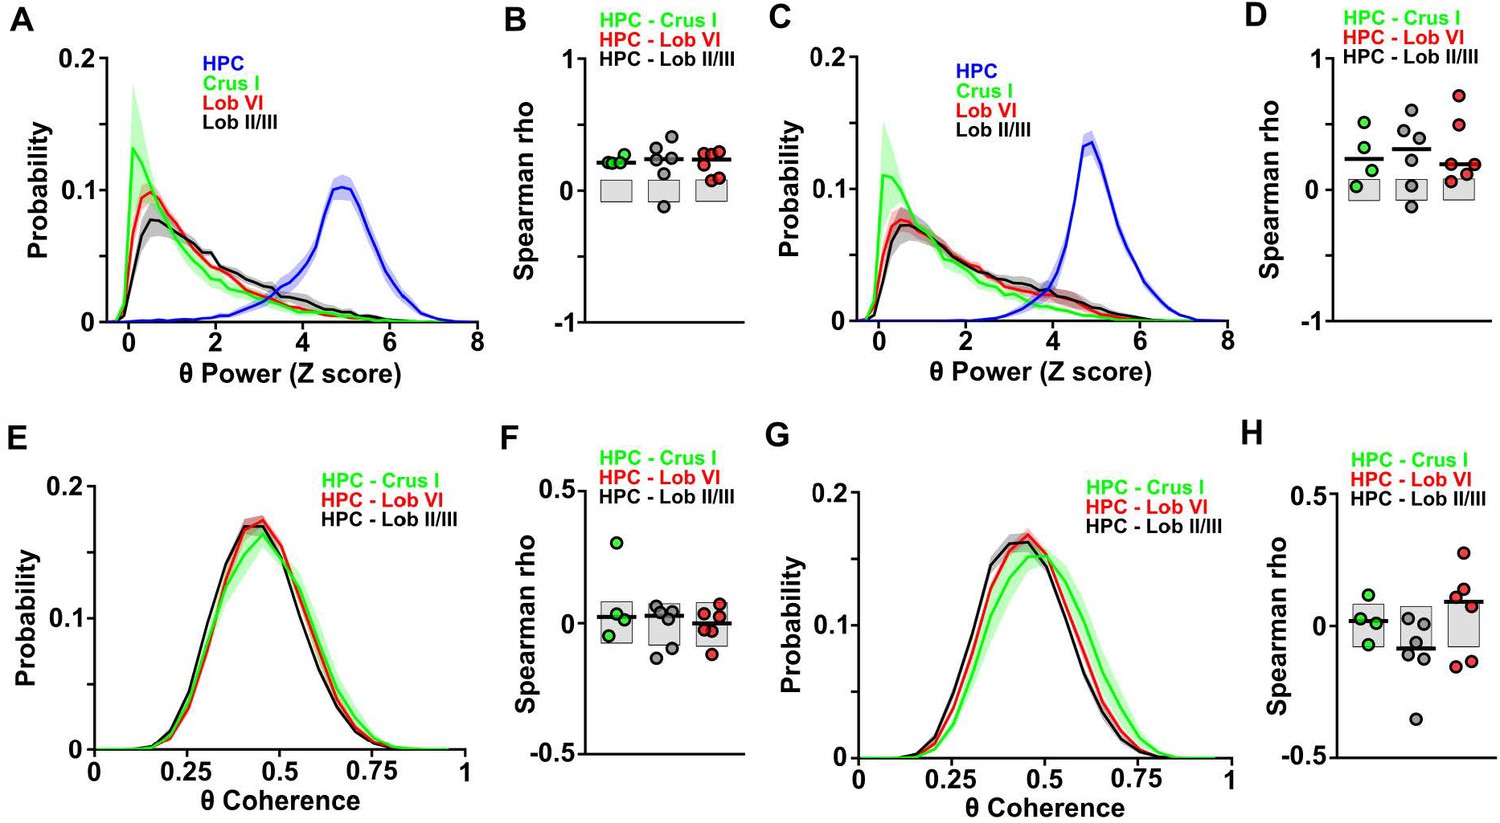
Distributions and correlations during goal-directed behavior.
(A) Probability distribution of the instantaneous LFP theta power for each of the recorded regions during session one in the linear track. Hippocampal theta power followed a negatively skewed distribution while all cerebellar LFP theta power followed a positively skewed distribution. (B) Correlation between the instantaneous LFP theta power for each of the cerebellar regions and instantaneous speed during session one in the linear track. Gray-shaded bars represent the confidence levels obtained from bootstrapped data with α = 0.05. Cerebellar theta power was significantly positively correlated with speed across all recorded regions (Crus I, n = 4, median rho Spearman = 0.2125; lobule II/III, n = 6, median rho Spearman = 0.2391; lobule VI, n = 6, median rho Spearman = 0.2353). (C) Same as A for session 20. (D) Same as B for session 20. Cerebellar theta power was significantly positively correlated with speed across all recorded regions (Crus I, n = 4, median rho Spearman = 0.2349; lobule II/III, n = 6, median rho Spearman = 0.3097; lobule VI, n = 6, median rho Spearman = 0.1941). (E) Probability distribution of instantaneous hippocampal-cerebellar theta coherence (color coded) and instantaneous speed during session one in the linear track. All combinations followed gaussian distributions. (F) Correlation between the instantaneous hippocampal-cerebellar theta coherence (color coded) and instantaneous speed during session one in the linear track. Gray-shaded bars represent the confidence levels obtained from bootstrapped data with α = 0.05. Hippocampal-cerebellar theta coherence was not significantly correlated with speed across any of the recorded combinations. (G) Same as E for session 20. (H) Same as F for session 20. Lobule II/III-HPC theta coherence was significantly negatively correlated with speed (n = 6, median rho Spearman = −0.0859) and lobule VI-HPC theta coherence was significantly positively correlated with speed (n = 6, median rho Spearman = 0.0911). Crus I-HPC theta coherence was not correlated with speed (Spearman rho = 0.024).
Figure 4—figure supplement 3
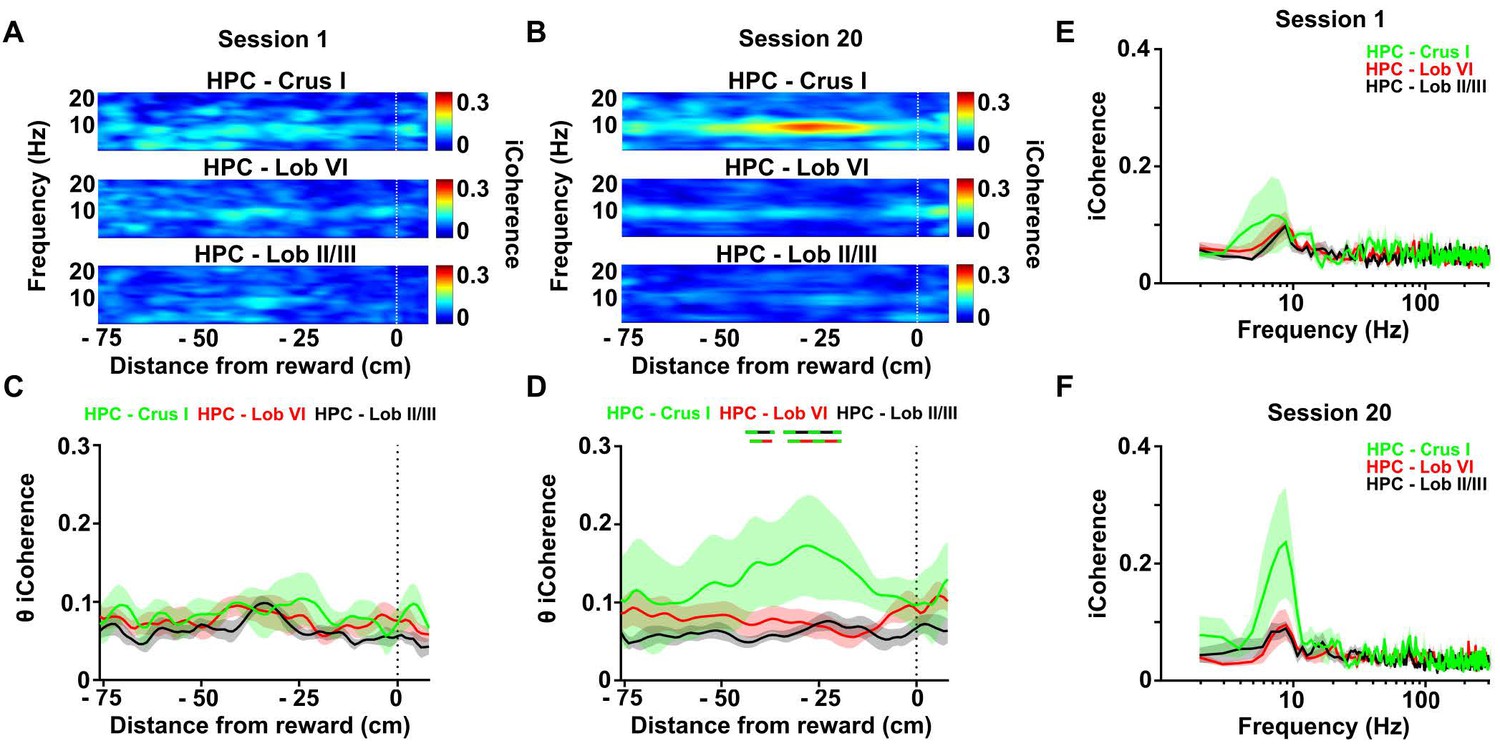
Calculation of the imaginary part of coherence during goal-directed behavior.
(A) Mean coherogram plotted using the imaginary part of coherence, aligned by distance from reward and averaged across runs during session one for each hippocampal-cerebellar combination (mean coherence between left and right hemisphere LFPs when both hippocampal recording electrodes were on target; Crus I, n = 4; lobule II/III, n = 6; lobule VI, n = 6; related to Figure 4E). (B) Same as A but for session 20 (related to Figure 4H). (C) Mean imaginary theta coherence aligned by distance from reward averaged across runs during session one for each hippocampal-cerebellar combination (mean coherence between left and right hemisphere LFPs when both recording electrodes were on target; Crus I-HPC, n = 4; lobule II/III-HPC, n = 6; lobule VI-HPC, n = 6). No significant differences between hippocampal-cerebellar combinations was observed (distance x combination two-ways repeated measures ANOVA with FDR correction; combination effect, F2,13 = 1.065, p = 0.3730; interaction effect, F168,1092 = 0.6713, p = 0.9993). (D) Same as C for session 20. A significant interaction between hippocampal-cerebellar combination and distance from reward was observed (distance x combination two-ways repeated measures ANOVA with FDR correction; interaction effect, F168,1092 = 1.588, p < 0.0001). Post-hoc analysis revealed sustained differences between Crus I-HPC and lobule II/III-HPC coherence at distances from −42 to −40 and from −34 to −23 cm from reward (solid green/black line) and between Crus I-HPC and lobule VI-HPC coherence from −33 to −23 cm (solid green/red line). (E) Imaginary coherence from C (session 1) averaged between −42 and −23 cm from reward. (F) Imaginary coherence from D (session 20) averaged between −42 and −23 cm from reward.
Figure 4—figure supplement 4
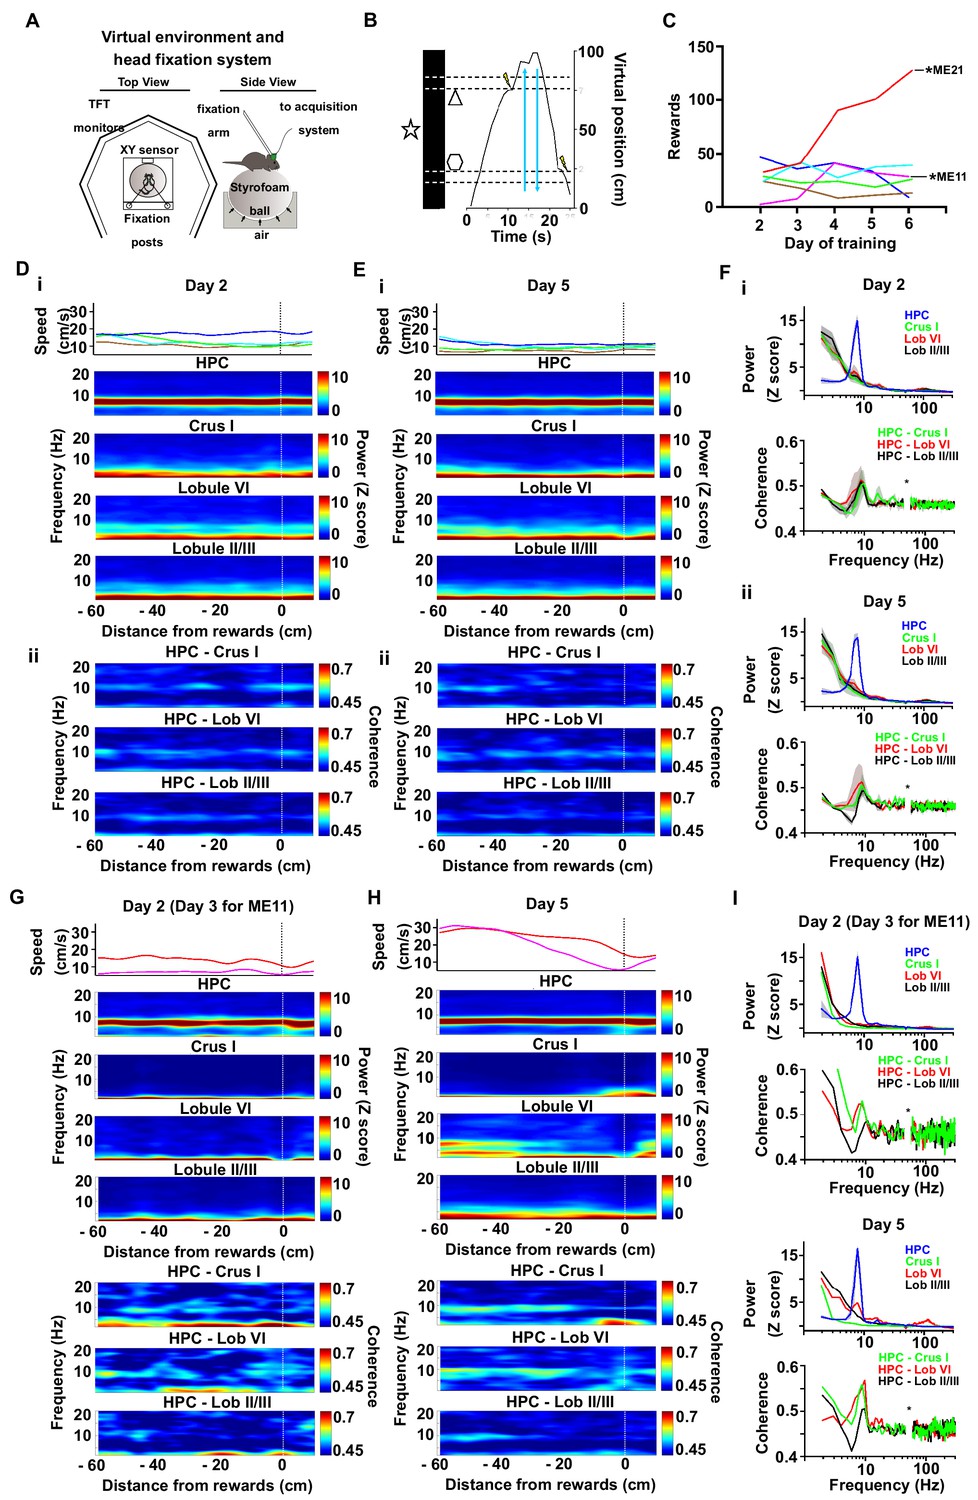
Cerebello-hippocampal coherence patterns during running or goal-directed movement in a virtual environment.
(A) Schematic of the virtual reality system and recording setup. Head-fixed mice were trained to move an air-cushioned Styrofoam ball in order to navigate through a virtual environment displayed on six TFT monitors surrounding the animal. (B) Example recording of the virtual position as a mouse traversed a virtual linear track to receive rewards (MFB stimulation indicated by a lightning symbol, n = 6). (C) Behavioral performance across training as illustrated by the mean number of rewards. Each mouse represented by a different line color. Two mice, ME21 and ME11, showed an increase in the number of rewards obtained over training days. (D) i, speed (top) and spectrograms (bottom; HPC, n = 6; Crus I, n = 2; lobule II/III, n = 5; lobule VI, n = 3) averaged by distance to reward from a session in early training day 2 (session 5); ii, coherograms for non learning mice averaged by distance to reward during early training day 2 (Crus I-HPC, n = 2; lobule II/III-HPC, n = 5; lobule VI-HPC, n = 3). (E) same as D for late training day 5 (session 14). (F) i, power spectra (upper) and coherence (lower) for non-learner mice during early training day 2 pooled from −60 to −20 cm from reward. ii, power spectra (upper) and coherence (lower) for non-learner mice during late training day 5 pooled from −60 to −20 cm from reward. (G-I). Same as E-F but for the two mice that showed an increase in the number of rewards obtained over training (ME21 and ME11, Crus I, n = 1; lobule II/III, n = 1; lobule VI, n = 1).
Figure 5
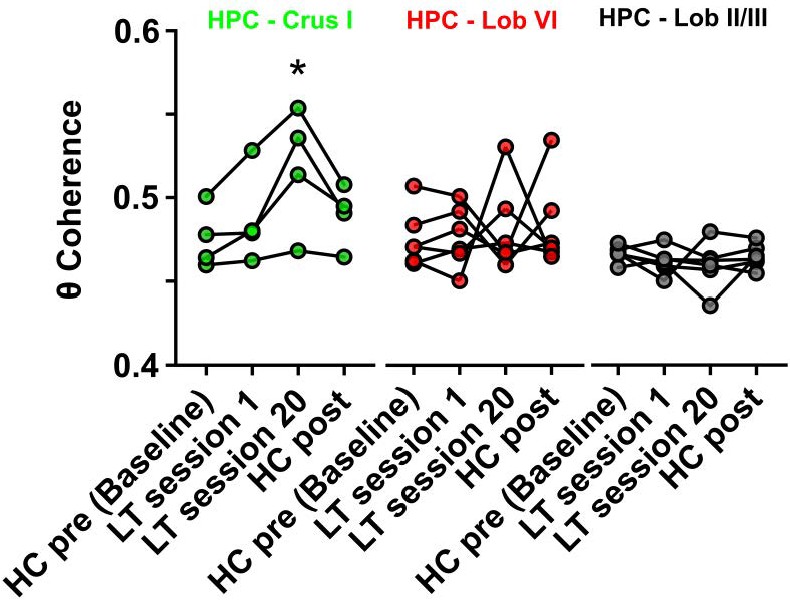
Hippocampal-Crus I theta coherence is dynamic.
Comparisons of hippocampal-cerebellar theta coherence before and after acquisition of a goal-directed behavior in the linear track task. Levels of coherence during homecage active exploration before first session in the linear track were taken as a baseline. HPC-Crus I theta coherence became significantly different from baseline by session 20 in the linear track task and returned to baseline levels during a second homecage recording immediately following linear track session 20 (n = 4, repeated measures Friedman test with FDR correction, Friedman statistic = 11.1, p = 0.0009; LT session 20 vs baseline, p = 0.0021). No significant differences across conditions were observed for the other hippocampal-cerebellar combinations.
-
Figure 5—source data 1
Hippocampal-Crus I theta coherence is dynamic.
- https://doi.org/10.7554/eLife.41896.023
Additional files
-
Transparent reporting form
- https://doi.org/10.7554/eLife.41896.024
Download links
A two-part list of links to download the article, or parts of the article, in various formats.
Downloads (link to download the article as PDF)
Open citations (links to open the citations from this article in various online reference manager services)
Cite this article (links to download the citations from this article in formats compatible with various reference manager tools)
Anatomical and physiological foundations of cerebello-hippocampal interaction
eLife 8:e41896.
https://doi.org/10.7554/eLife.41896


