Single cell RNA-seq identifies the origins of heterogeneity in efficient cell transdifferentiation and reprogramming
- Centre for Genomic Regulation (CRG), The Barcelona Institute of Science and Technology (BIST), Spain
- Harvard University, United States
- Institució Catalana de Recerca i Estudis Avançats (ICREA), Spain
- Universitat Pompeu Fabra (UPF), Spain
Figures
Figure 1 with 4 supplements
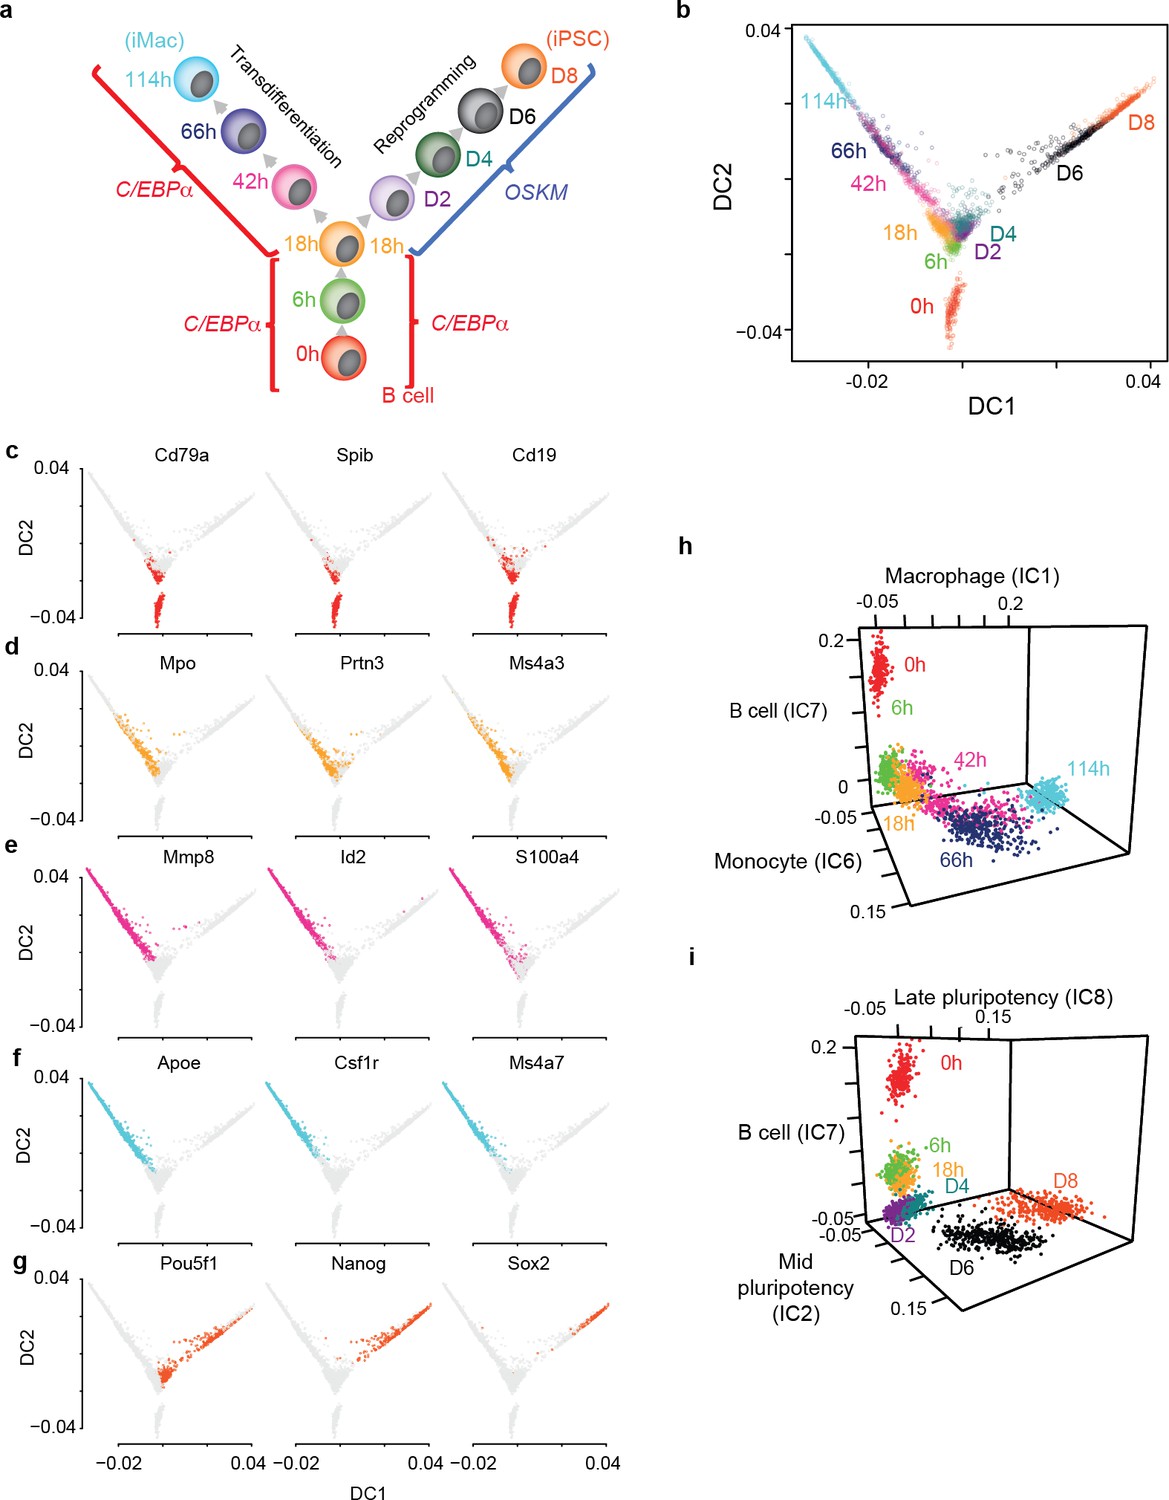
Single cell gene expression analysis of B cell to macrophage transdifferentiation and B cell to iPSC reprogramming.
(a) Overview of the experimental design, showing time points analysed. (b) Single cell projections onto the first two diffusion components (DC1 and DC2). c-f, as in b, with top 50% of cells expressing selected markers for B cells in red (c) GMP/granulocytes in orange (d) monocytes in purple (e) macrophages in light blue (f) and pluripotent cells in orange-red (g). (h-i) Projection of transdifferentiating cells onto B cell-, macrophage-, and monocyte-specific independent components (h) and reprogramming cells onto, B cell-, mid- and late- pluripotency specific independent components as defined in Figure 1—figure supplement 2a (i).
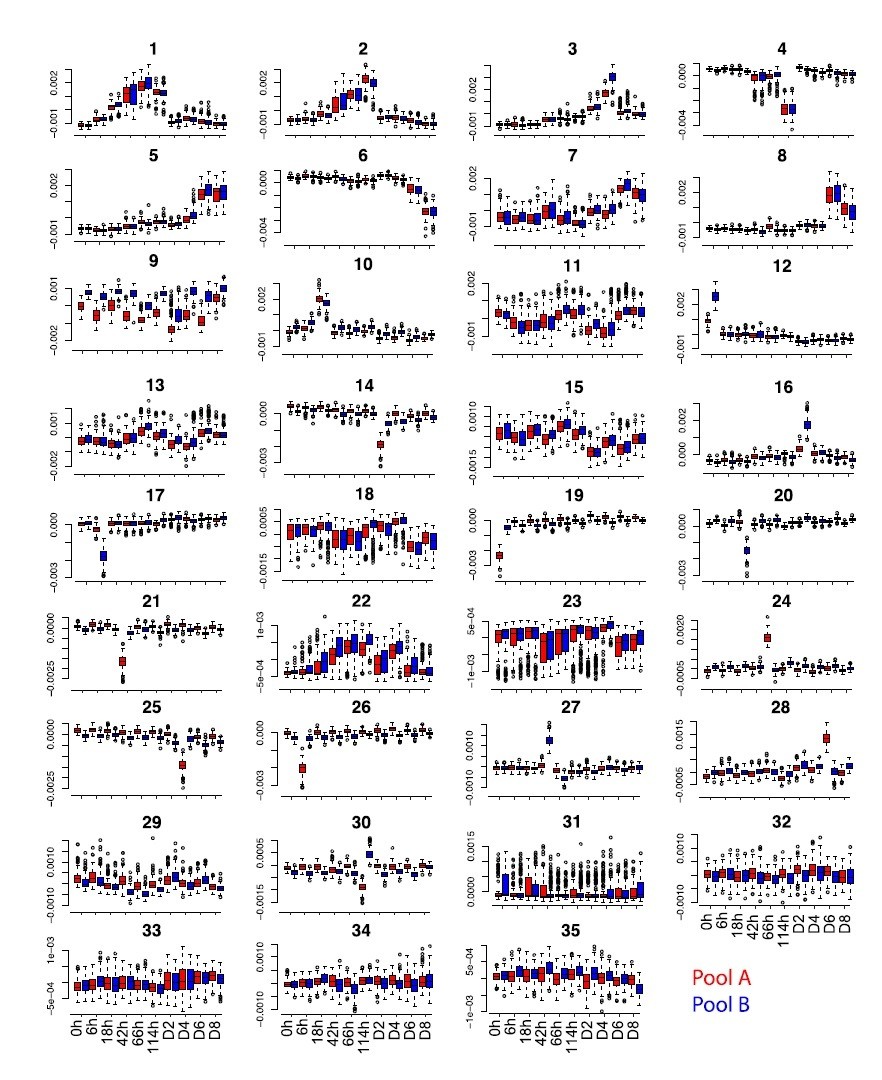
Figure 1—figure supplement 1
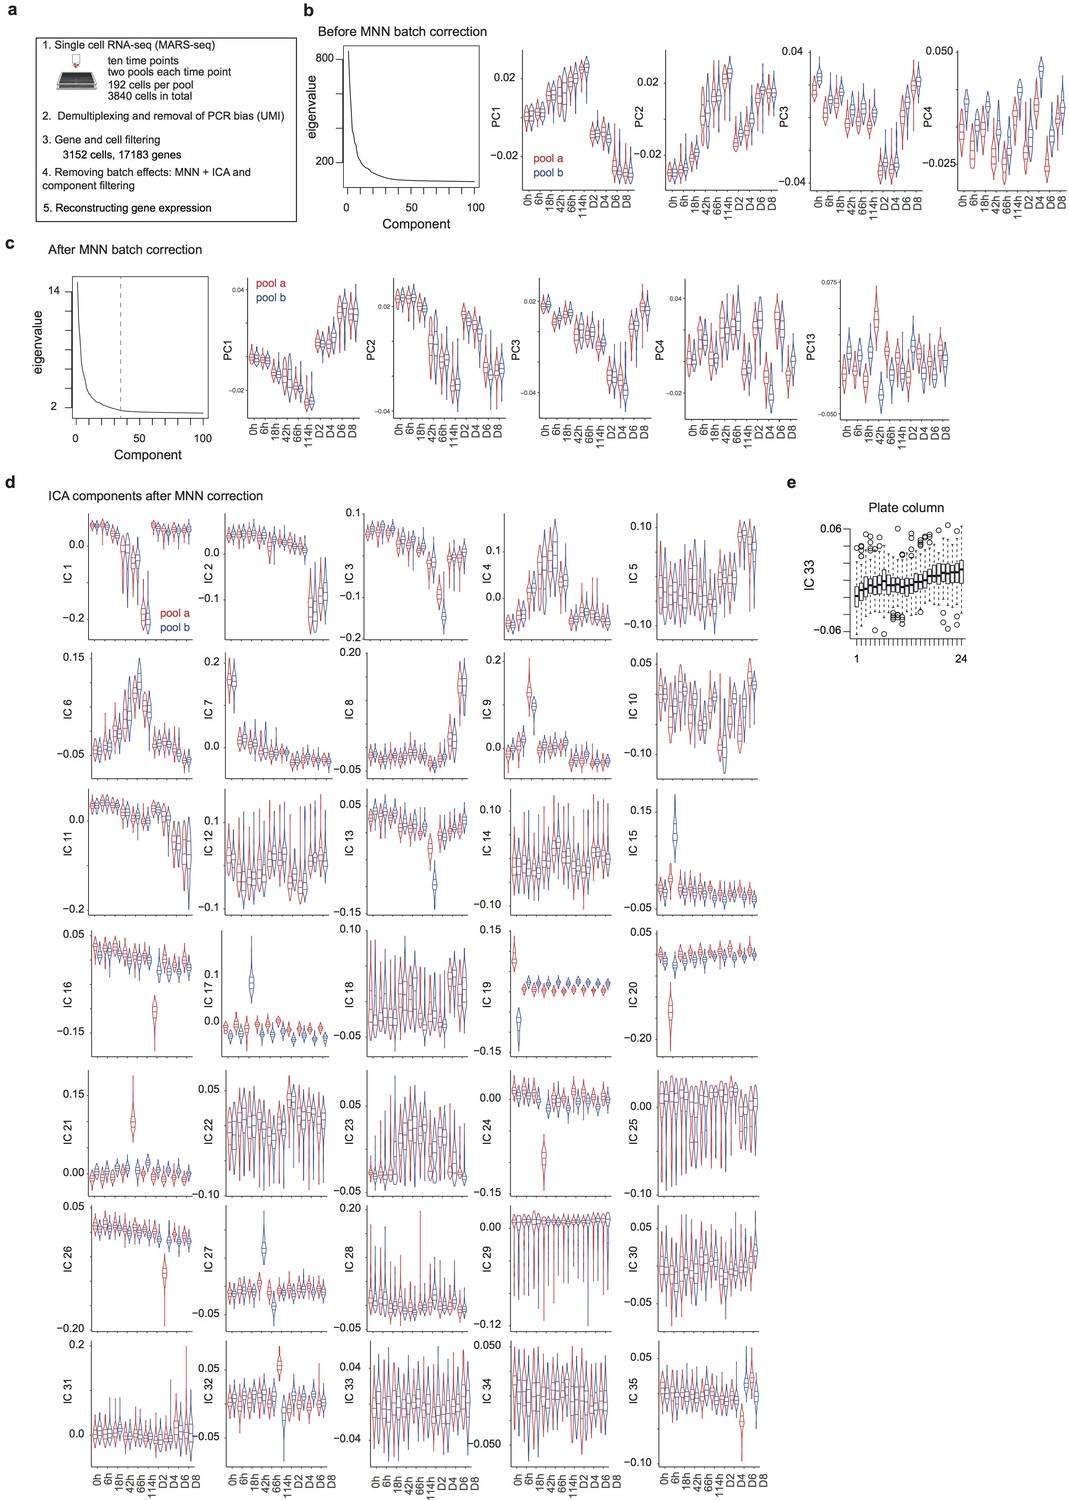
Data pre-processing, batch correction and independent component analysis.
(a) Overview of the data collection and pre-processing steps. (b) Distribution of the top 100 eigenvalues and of single cell projections onto the first four principal components across pools and time points from the gene expression PCA before batch correction. (c) Distribution of the top 100 eigenvalues and of single cell projections onto the first four principal components and component 13 across pools and time points from the PCA of gene expression after MNN batch correction. (d) Distribution of single cell projections onto the 35 independent components across pools and time points. (e), Distribution of the single cell projections onto independent component 33 across plate columns.
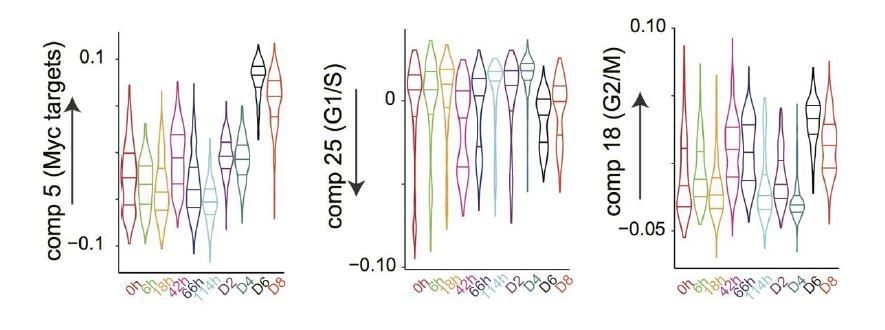
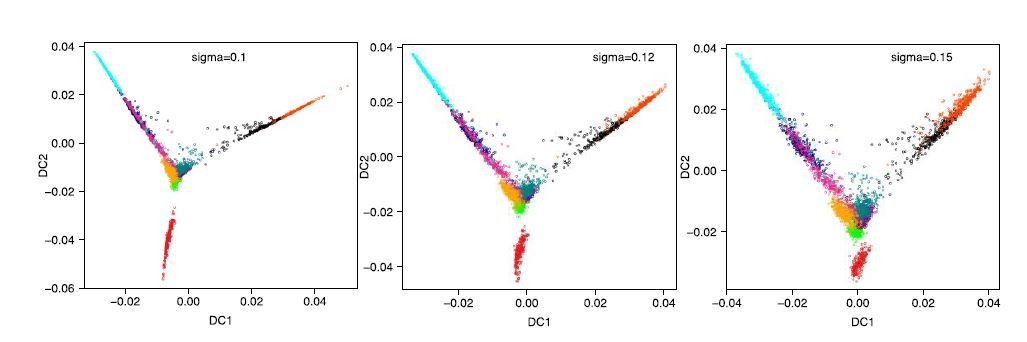
Figure 1—figure supplement 2
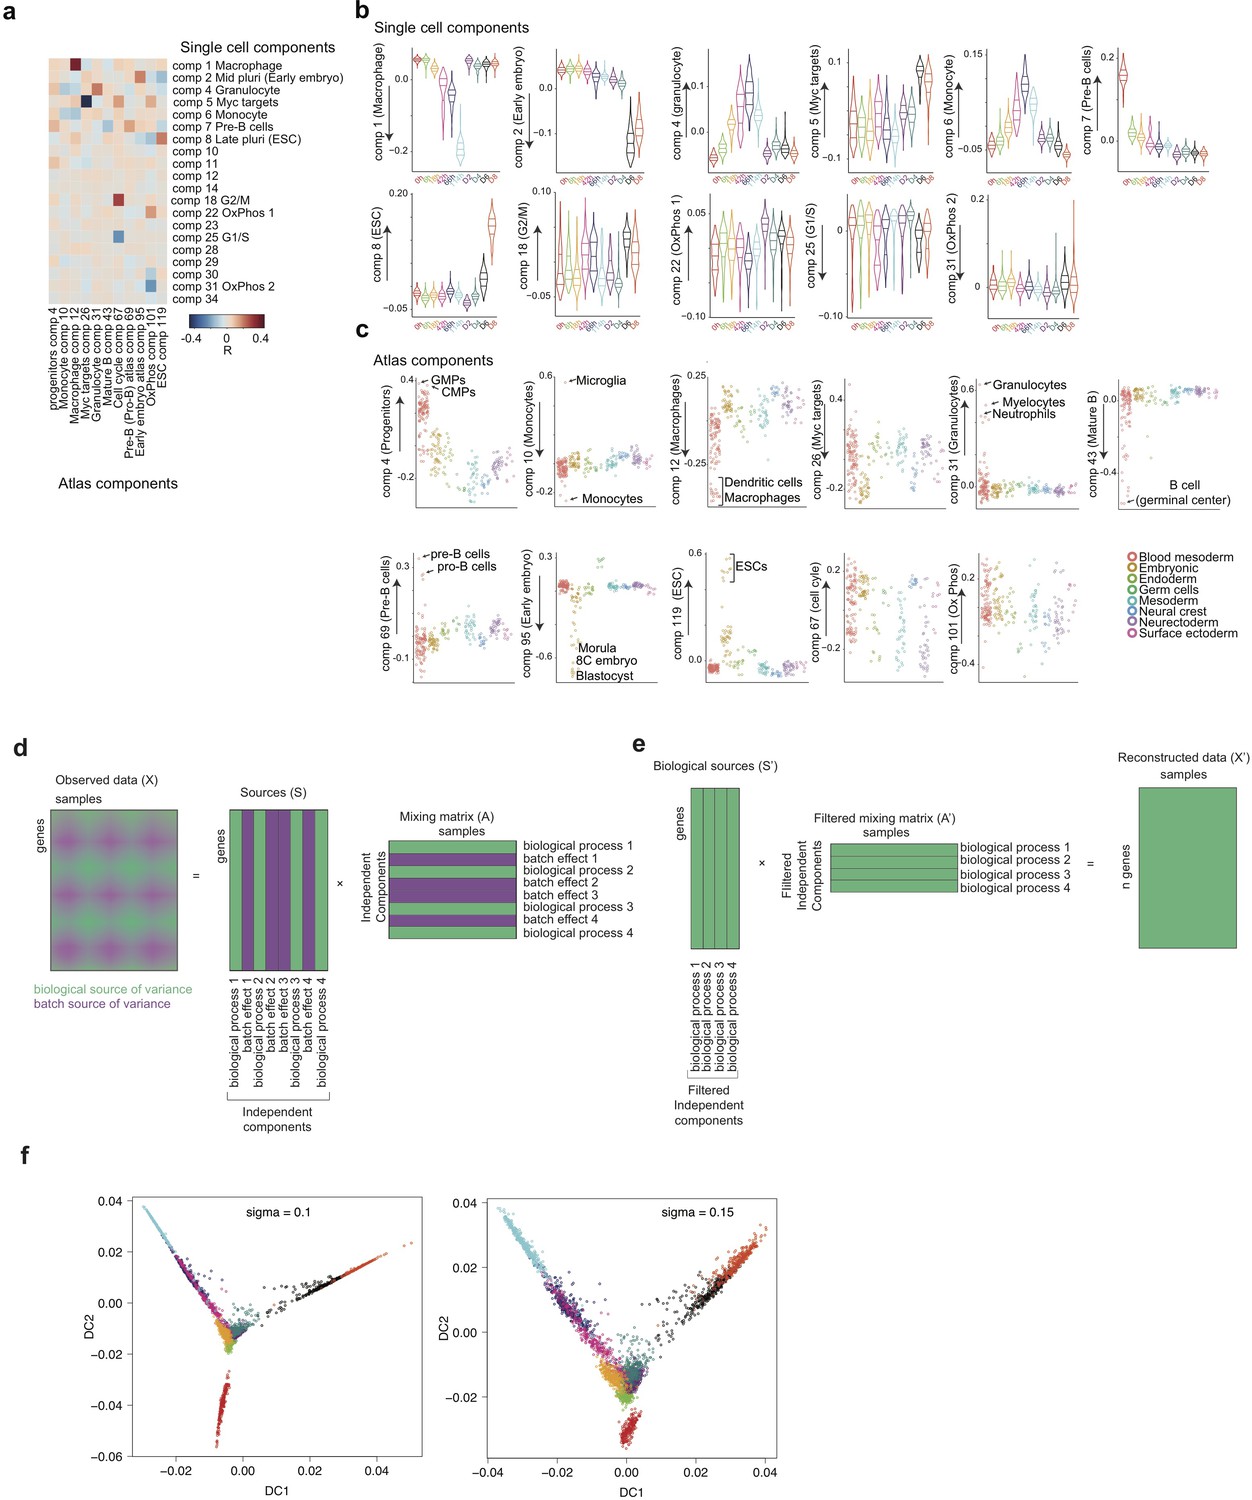
Characterisation of independent components, gene expression reconstruction and diffusion maps.
(a) Heatmap of the correlations between the gene loadings of selected single cell independent components and gene loadings of selected independent components from the reference mouse cell atlas (Hutchins et al., 2017) (see methods for the definition of cell type specific components). (b) Distribution of the single cell projections (scores) onto the macrophage, mid pluripotency, granulocyte, monocyte, pre-B, late pluripotency, G2/M, oxidative phosphorylation, G1/S and a second oxidative phosphorylation specific components across time points. (c) Cell type projections (scores) onto selected atlas components. (d) Scheme of ICA decomposition the expression data matrix into a matrix of independent sources and mixing matrix. (e) Scheme of reconstruction of gene expression after filtering out components capturing batch effects. (f) diffusion maps calculated with a smaller (left) or larger (right) gaussian kernel sigma than the one used for diffusion map shown in Figure 1b.
Figure 1—figure supplement 3
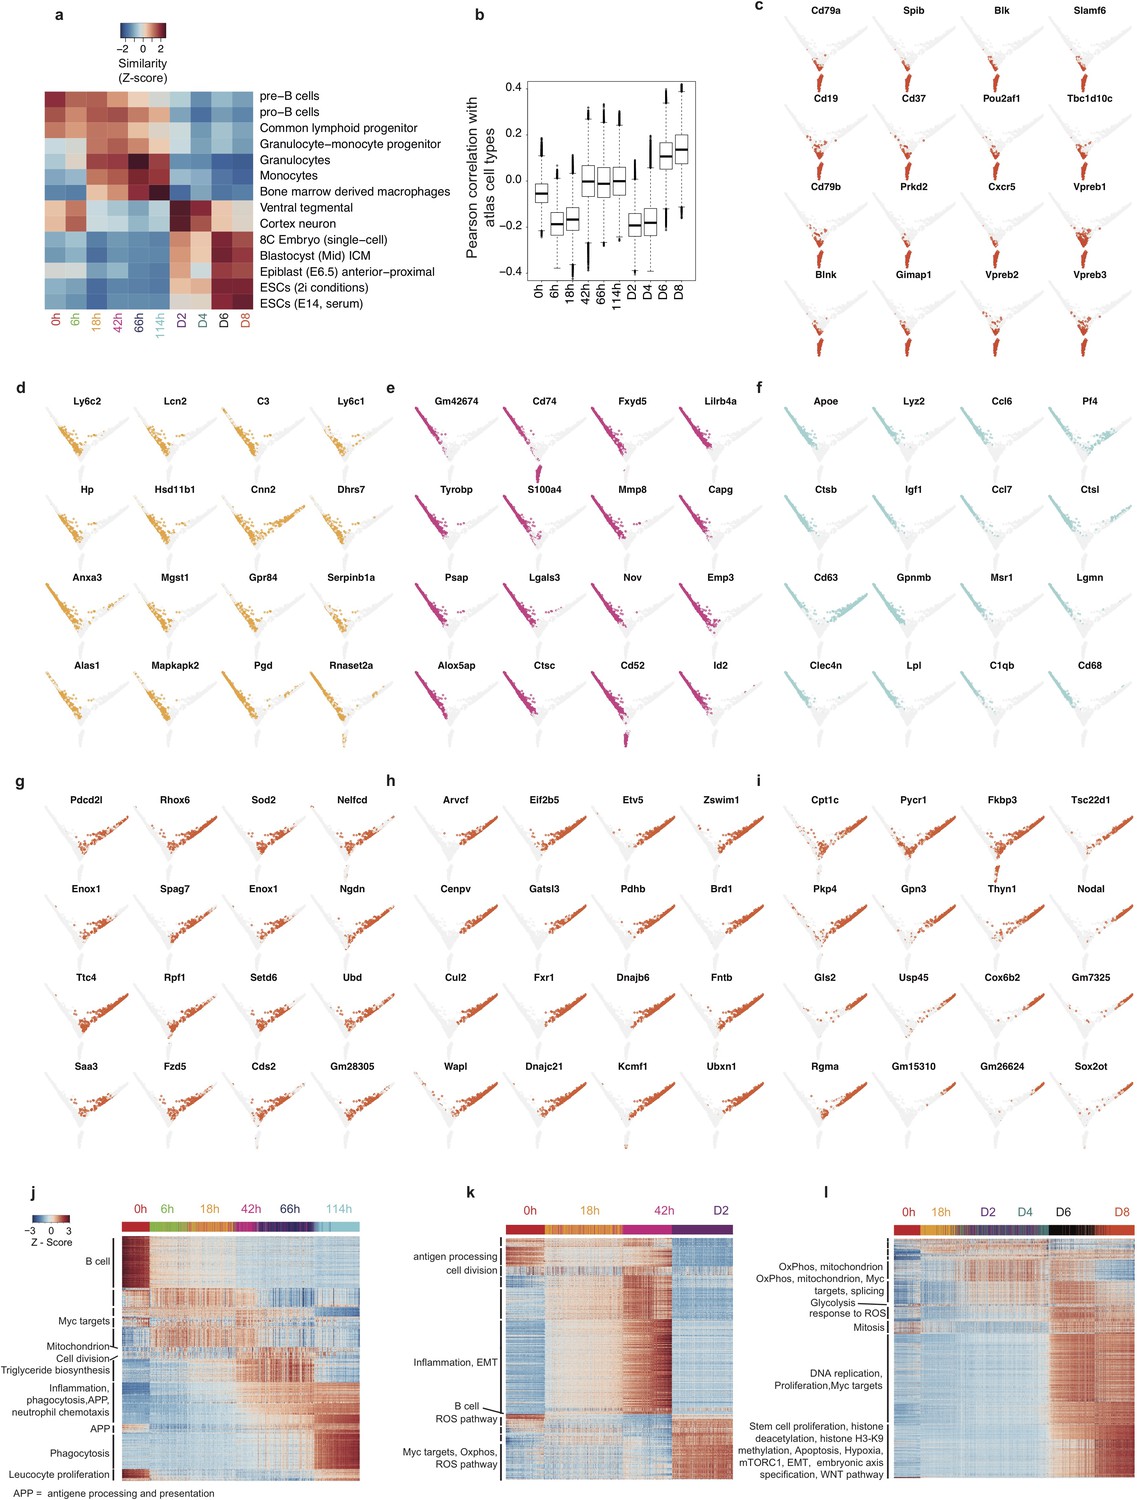
Single cell analysis of reprogramming and transdifferentiation.
(a) Heatmap of the mean similarity score (scaled correlation, z-score) of single cells to relevant cell types from the reference atlas at each time point during transdifferentiation and reprogramming. (b) Boxplot of Pearson’s correlation between each single cell and all 272 cell types from the atlas at each time point. (c–i) Single cell projections onto the first two diffusion components, with cells expressing top 50% of selected markers for B cells in red (c) GMPs/granulocytes in light orange (d), monocytes in purple (e) and macrophages in light blue (f) early (g), mid (h) and late (i) pluripotency markers in orange-red. (j) Heatmap of genes differentially expressed during transdifferentiation with fold change of at least 1.3 between adjacent time points, single cells are sorted according to diffusion pseudotime. (k) Heatmap of genes differentially expressed at 5% FDR and with fold change of at least 1.3 between 18 hr and the first time point after the branching between transdifferentiation and reprogramming (l) Heatmap of genes upregulated during reprogramming at 5% FDR and with fold change of at least 1.3 between adjacent time points, single cells are sorted according to diffusion pseudotime.
Figure 1—figure supplement 4

Gene expression distribution of markers during reprogramming and transdifferentiation.
(a-b) Dot plots showing the distribution of gene expression of markers of different cell types at each time point during trans-differentiation (a) and of key pluripotency markers during reprogramming (b).
Figure 2 with 3 supplements
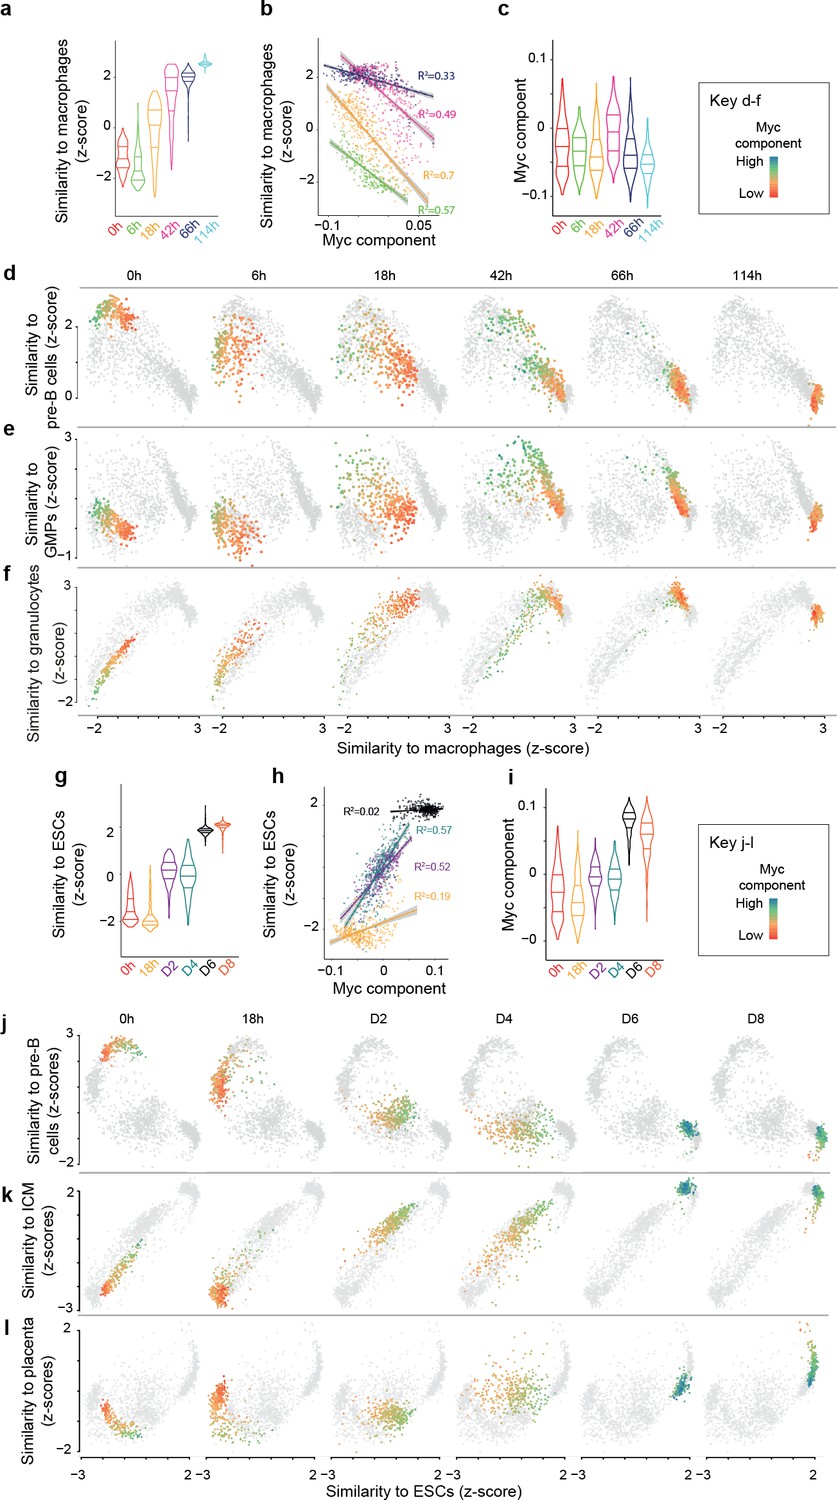
Myc activity correlates with differences in single cell transdifferentiation and reprogramming trajectories.
(a) Distribution of gene expression similarity between single cells and reference bone marrow derived macrophages (Hutchins et al., 2017) (acquisition of macrophage state) during transdifferentiation. (b) Correlation between the Myc component and acquisition of macrophage state from a; start and end time points were omitted to improve clarity (they are presented in Figure 2—figure supplement 1a). (c) Myc component at the various transdifferentiation time points. d-f, Single cell trajectories of the B cell state (d), the GMP state (e) and the granulocyte state (f) related to the acquisition of the macrophage state during transdifferentiation. The cells at the respective time points are coloured according to Myc component levels. (g) Distribution of expression similarity between single cells and reference embryonic stem cells (ESCs) during reprogramming. (h) Correlation between Myc component and acquisition of pluripotency from g. (i) Myc component at the various reprogramming time points. (j-l) Single cell trajectories of the B cell state (j), GMP state (k) and inner cell mass state (l) related to the acquisition of the pluripotent state (ESCs) (see also Figure 3—figure supplement 1).
Figure 2—figure supplement 1
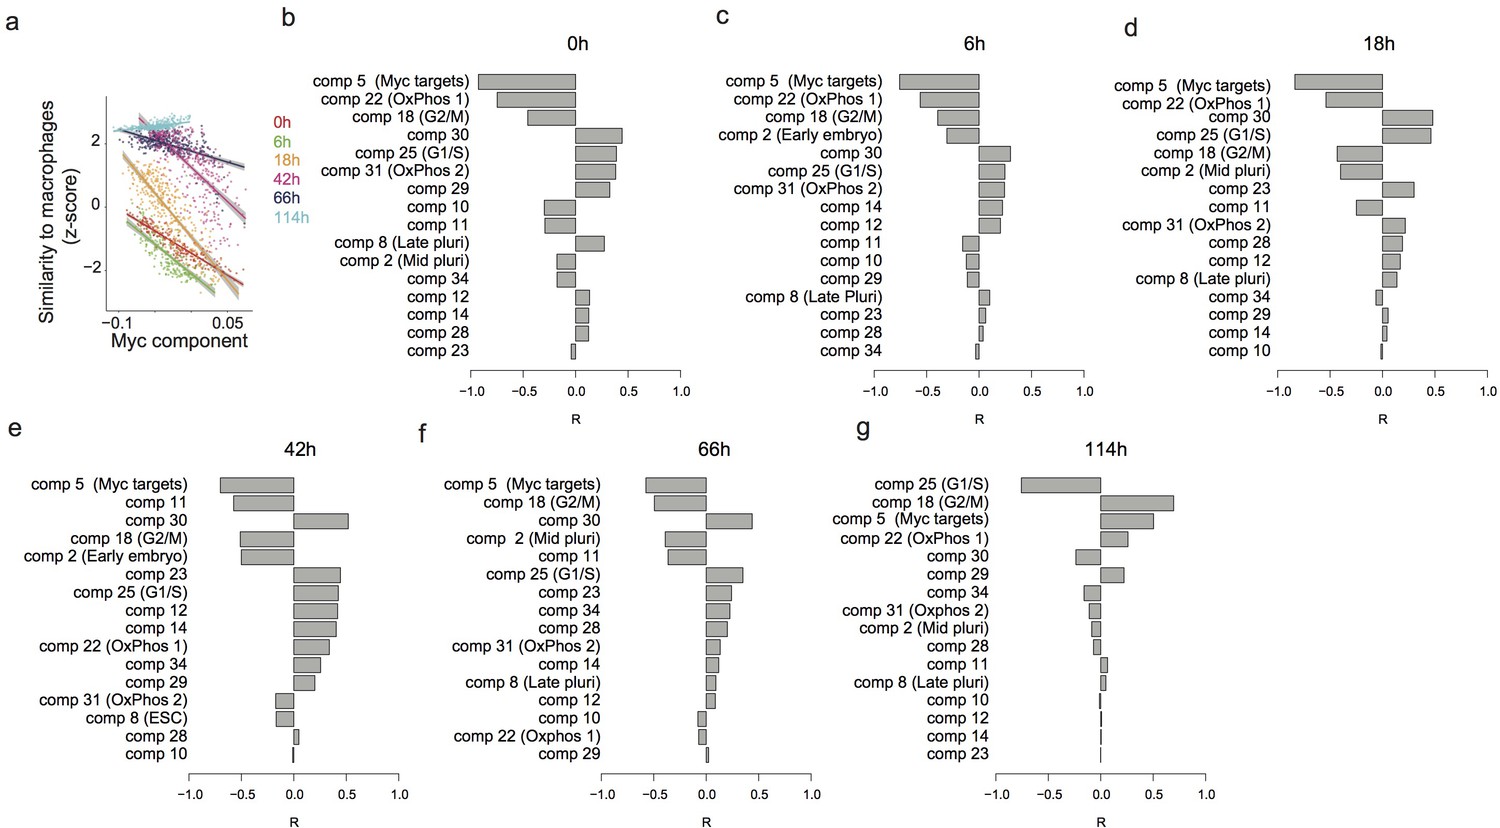
Predicting the speed of transdifferentiation.
(a) Expression similarity of single cells with reference bone marrow derived macrophages 0 hr, 6 hr, 18 hr, 42 hr, 66 hr and 114 hr after C/EBPα induction. (b–g) Correlation between each independent component and the expression similarity defined in (a) at 0 hr (b), 6 hr (c), 18 hr (d), 42 hr (e), 66 hr (f) and 114 hr (g) after C/EBPα induction.
Figure 2—figure supplement 2
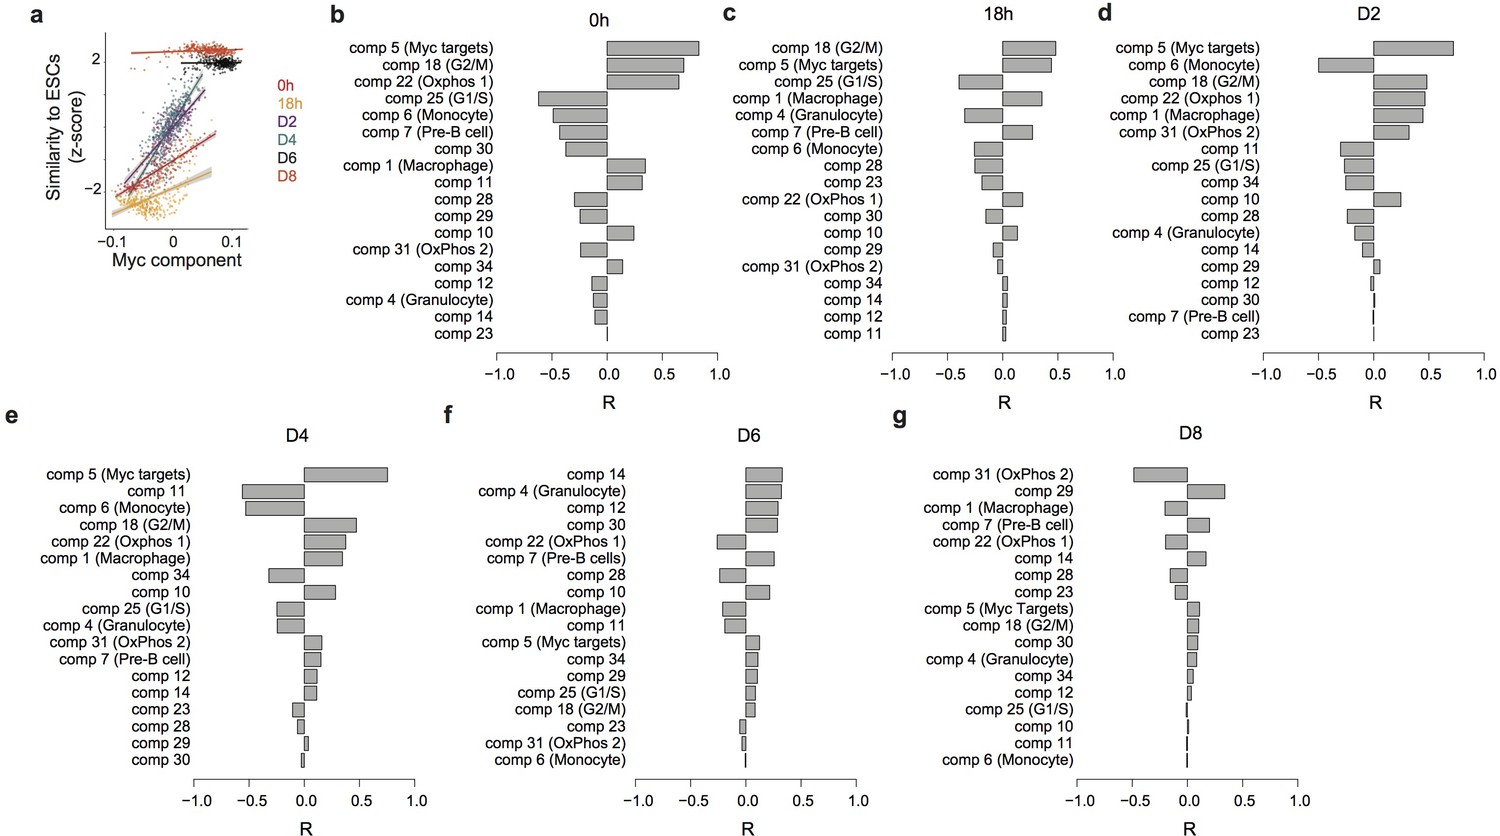
Predicting the speed of reprogramming.
(a) Correlation between the Myc component and expression similarity of single cells with ESC at 0 hr and 18 hr after C/EBPa induction and at D2, D4, D6, and D8 after OSKM induction. (b–g) Correlation between each independent component and the expression similarity defined in (a) at 0 hr (b) and 18 hr after C/EBPa induction (c), and at D2 (d), D4 (e), D6 (f) and D8 (g) after OSKM induction.
Figure 2—figure supplement 3
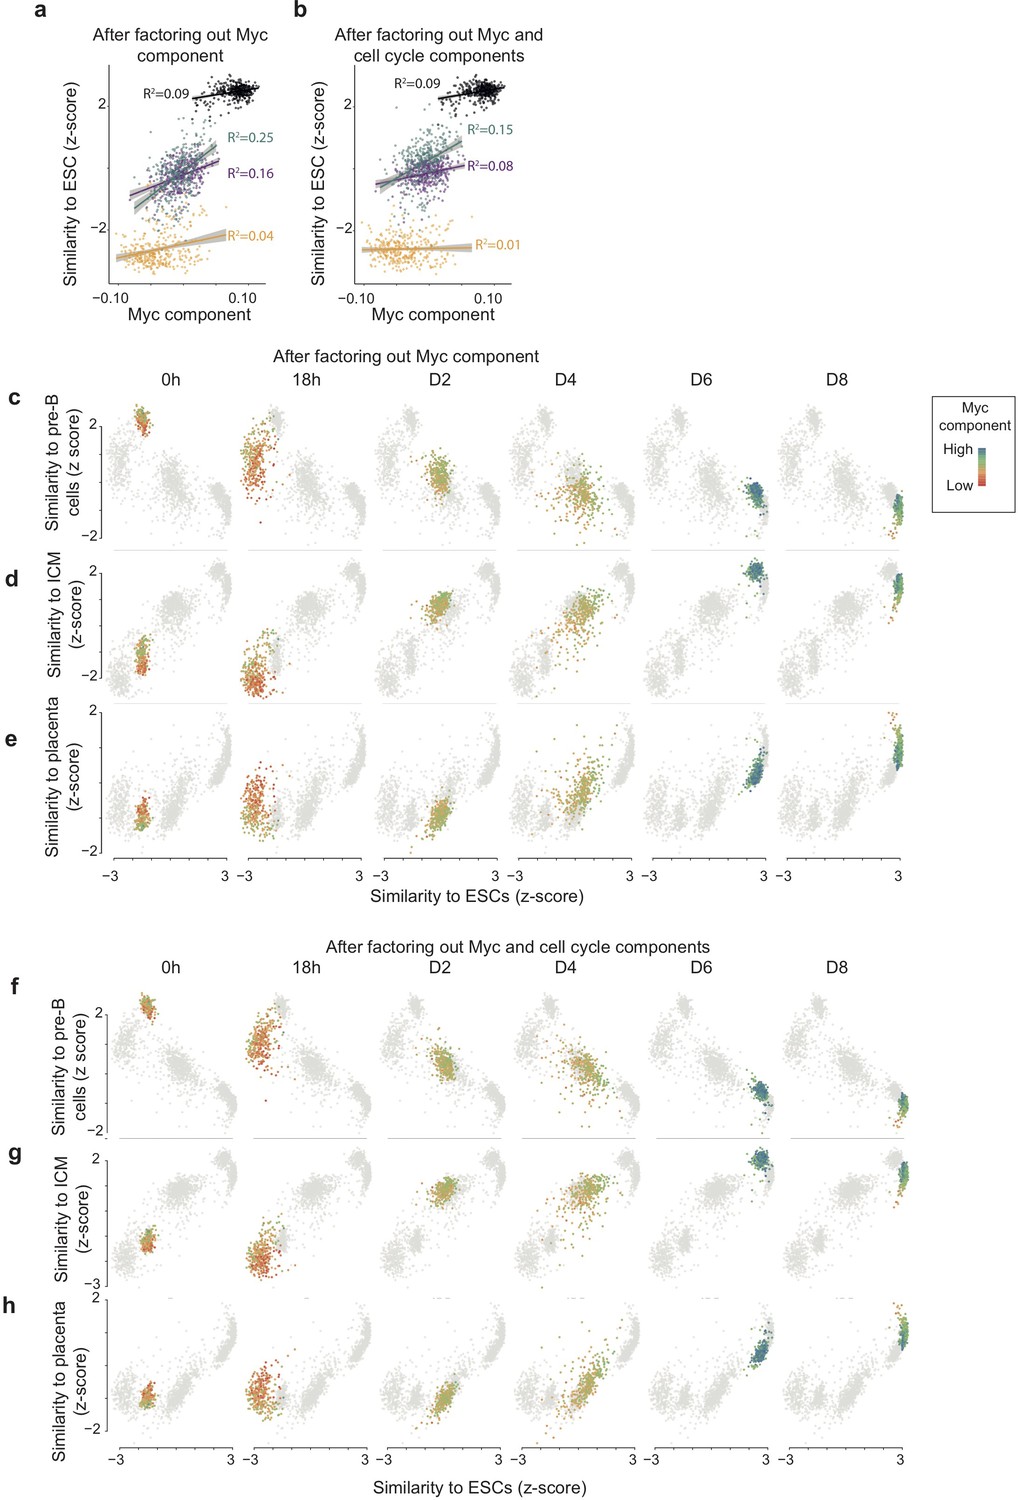
High Myc component correlates with faster route towards reprogramming also when factoring out Myc component and cell cycle components before the computation of the similarity score.
(ab) Correlation between Myc component and expression similarity of single cells to reference ESCs (acquisition of pluripotency) at each time point during reprogramming, calculated after factoring out Myc component (a) and both Myc and cell cycle components (b) from both single cell and cell atlas gene expression data (see Materials and Methods). (c–e) Loss of the B cell (c), GMP (d), and monocyte (e) state in relation to acquisition of pluripotency (calculated as in a) at each time point during reprogramming. (f–h) Loss of the B cell (f), (g), and gain of inner-cell-mass-like state (h) and of a placenta-like state in relation to acquisition of pluripotency (calculated as in b) at each time point during reprogramming. Colours indicate the levels of Myc component.
Figure 3 with 2 supplements
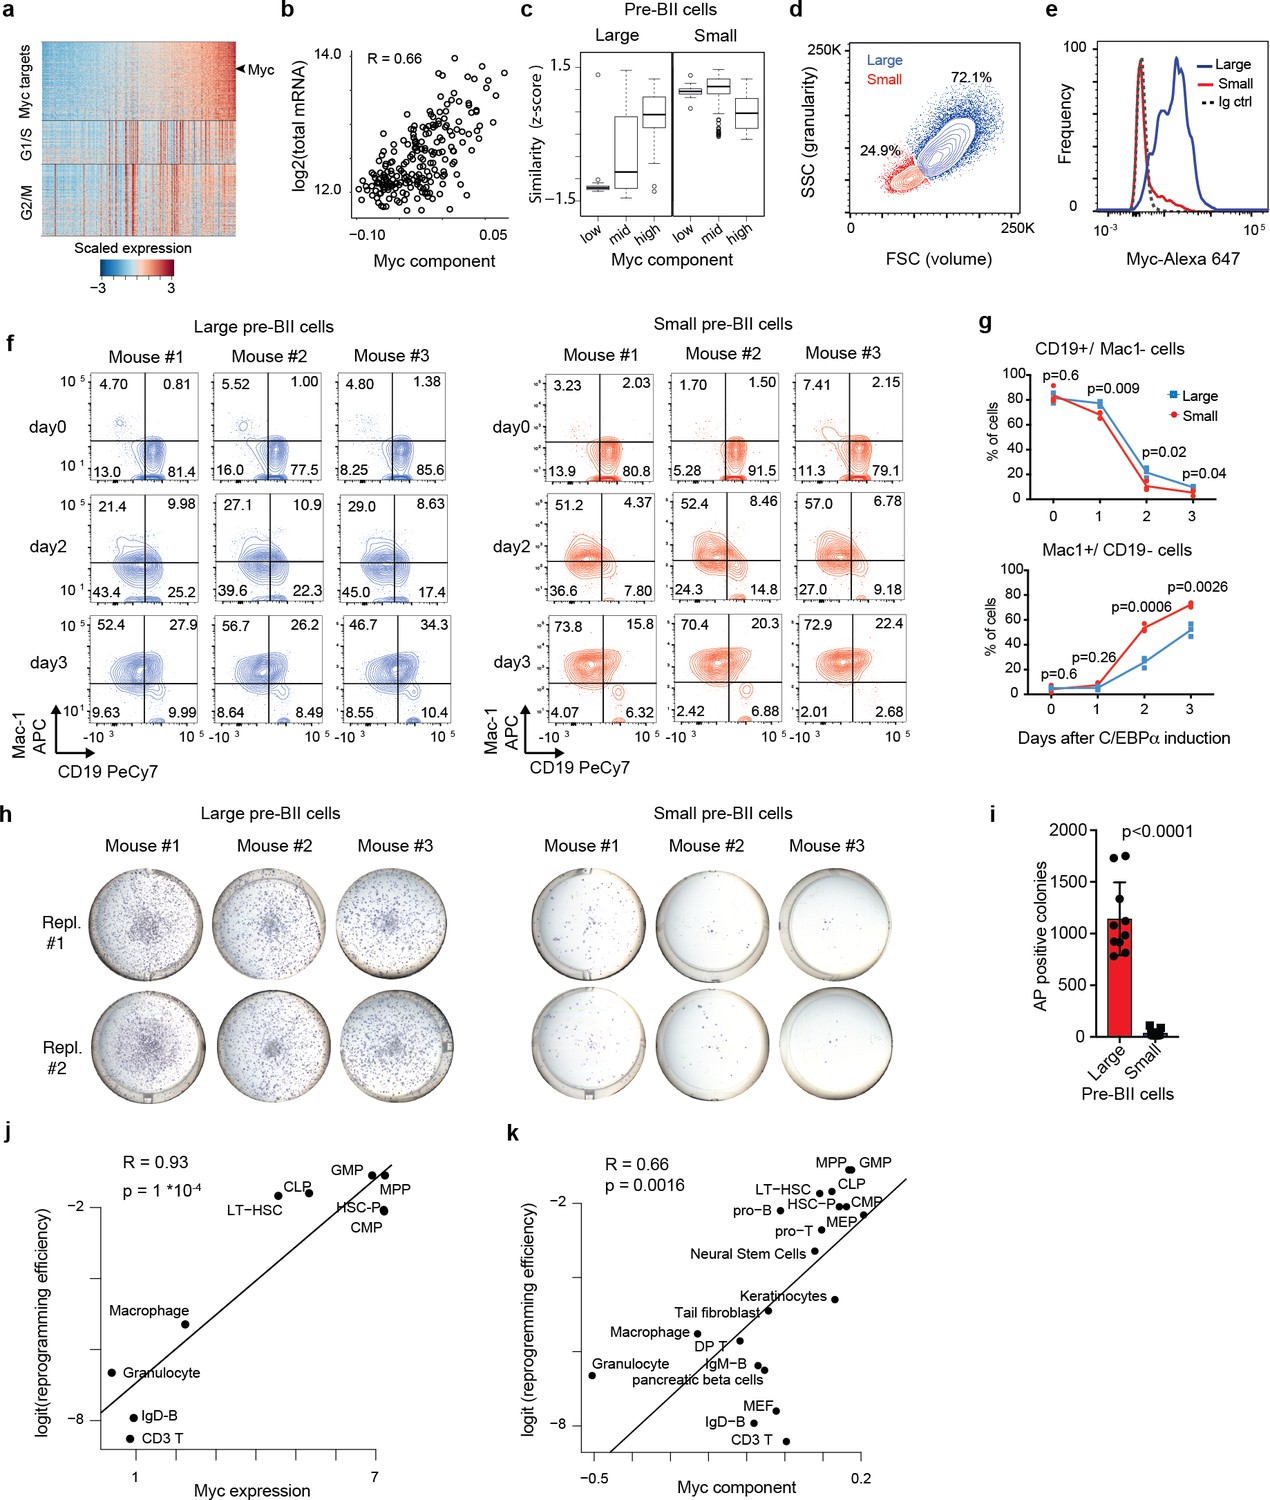
Two types of pre-B cells exhibit distinct cell conversion plasticities.
(a) Heatmap showing the expression of Myc target genes, G1/S and G2/M specific genes in the starting pre-B cells sorted by Myc component. (b) Pearson’s correlation between total mRNA molecules per cell and Myc component. (c) Similarity score of single cells binned by Myc component (bottom 20%, mid and top 20%) with reference large and small pre-BII cells. (d) Representative FACS plot of starting pre-B cells showing forward (FSC) and side scatter (SSC). (e) Representative FACS analysis of Myc levels detected in the 30% largest and the 30% smallest pre-B cell fractions. (f) FACS plots of myeloid marker (Mac-1) and B cell marker (CD19) expression during induced transdifferentiation of sorted large and small pre-BII cells. (g) Quantification of the results shown in f (n = 3 biological replicates, error bars indicate mean ± s.d. Statistical significance was determined using multiple t-test with 1% false discovery rate). (h) Visualisation of iPSC-like colonies (stained by alkaline phosphatase) 12 days after OSKM induction of sorted large and small pre-BII cells. (i) Quantification of the results shown in h (n = 10 biologically independent samples (cell cultures) for large and n = 9 biologically independent samples (cell cultures) for small cells, with error bars indicating mean ±s.d. Statistical significance was determined using a two-tailed unpaired Student’s t-test). (j) Scatterplot showing the correlation between Myc expression (Jaitin et al., 2014) in different starting hematopoietic cell types (x-axis) and their corresponding (logit transformed) reprogramming efficiency (y-axis). GMP: granulocyte monocyte progenitor, CMP: common myeloid progenitor, CLP: common lymphoid progenitor, LT-HSC: long term hematopoietic stem cells, HSC-P: short term hematopoietic stem cells. (k) Correlation between Myc component and reprogramming efficiency in various somatic cell types, including the hematopoietic cells shown in j.
Figure 3—figure supplement 1
Experimental data relevant for Figure 3.
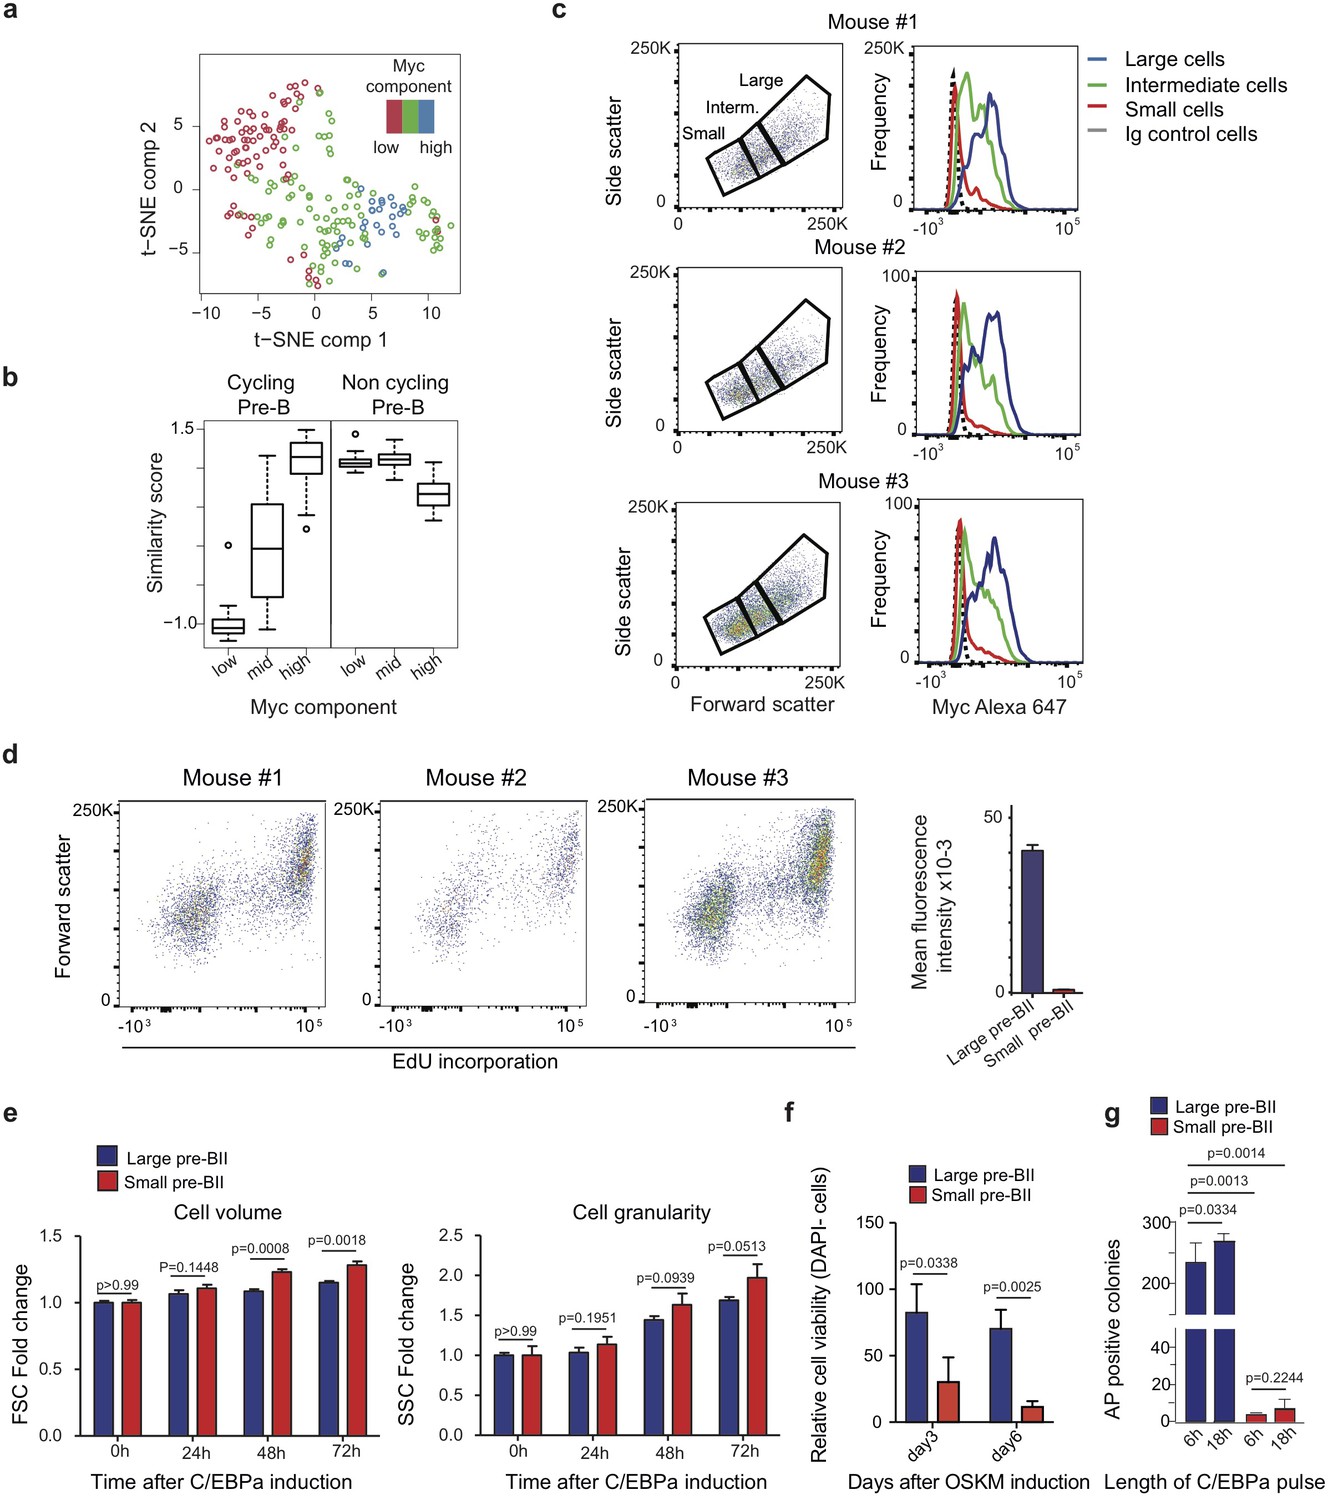
(a) Two-dimensional t-SNE dimensionality reduction of starting pre-B cells coloured by the level of Myc component. (b) Similarity score of single cells binned by Myc component (bottom 20%, mid and top 20%) with reference cycling and non-cycling pre-B cells (Painter et al., 2011). (c) Top: FACS plots from pre-B cells obtained from three separate mice, showing the distribution of cells by volume (FSC) and granularity (SSC). Bottom: Myc expression profiles obtained for large, intermediate and small cells (gated in the profiles on the top) after intracellular immunostaining and FACS analysis. (d) Cell proliferation analysis by FACS of uninduced pre-B cells by EdU incorporation for 2 hr. n = 3 biologically independent samples, error bars indicate mean ± s.d.. (e) Monitoring cell volume and granularity during induced transdifferentiation of large and small pre-BII cells by SSC and FSC. n = 3 biologically independent samples, error bars indicate mean ±s.d.. P-values are from T-test, and corrected for multiple testing using false discovery rate (FDR). (f) Cell viability analysis by DAPI incorporation in small and large pre-B cells undergoing reprogramming. Data are represented relative to large pre-BII cells at day 3 of reprogramming, n = 3 biologically independent samples, error bars indicate mean ±s.d.. P-values are from T-test, and corrected for multiple testing using false discovery rate (FDR). (g) Number of AP+ iPSC colonies at day 12 of reprogramming, obtained from large and small pre-BII cells pre-treated for either 6 hr or 18 hr of C/EBPa induction. n = 3 biologically independent samples (cell cultures), error bars indicate mean ± s.d.. P-values are from unpaired two tailed T-test.
Figure 3—figure supplement 2
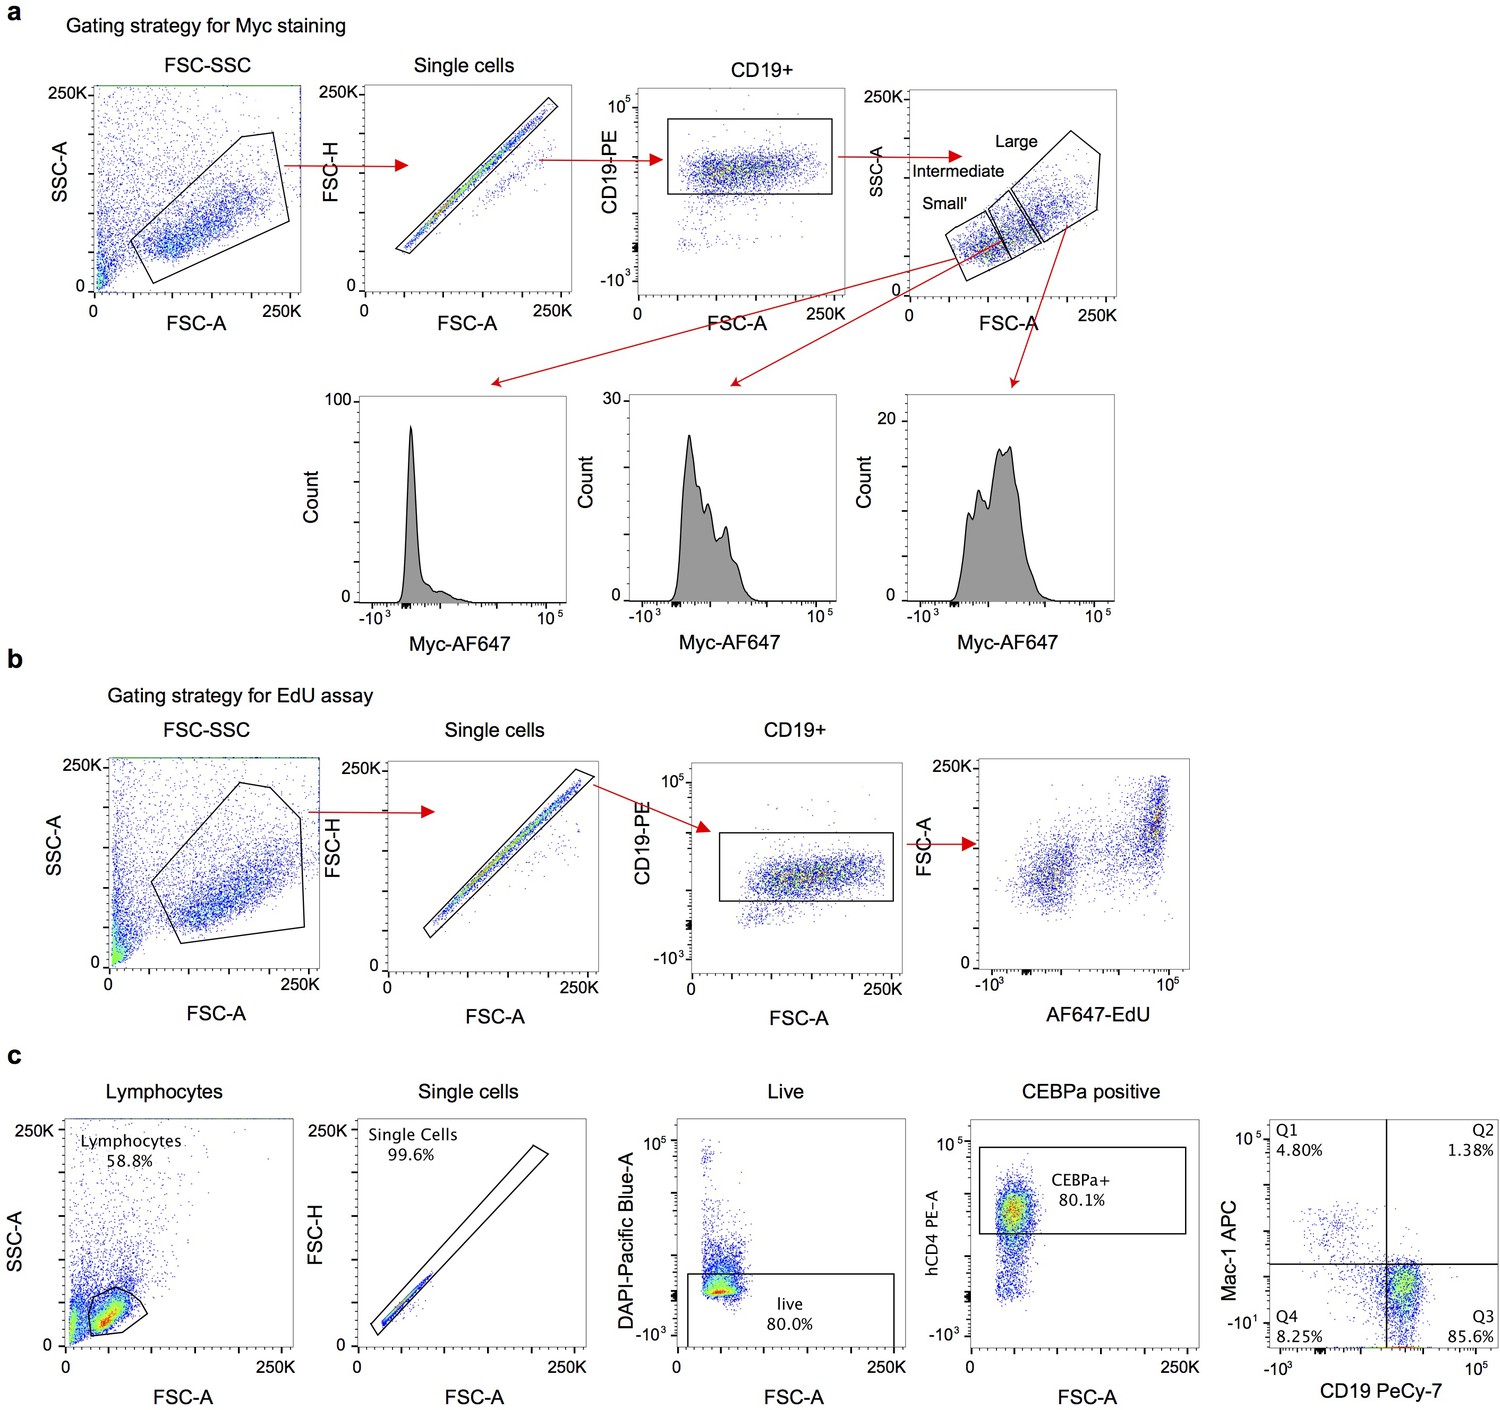
Gating strategies for FACS analyses.
(a) Gating strategy for Myc staining, corresponding to Figure 3e and Figure 3—figure supplement 1b. (b) Gating strategy for EdU incorporation, corresponding to Figure 3—figure supplement 1b. (b) Gating strategy for transdifferentiation, corresponding to Figure 3f.
Figure 4
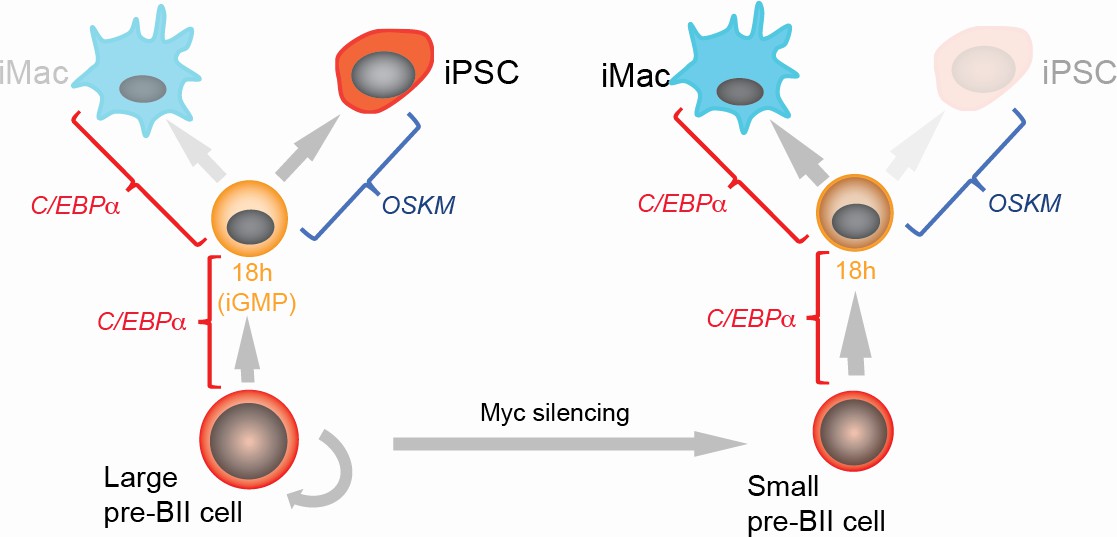
Summary of the main findings.
https://doi.org/10.7554/eLife.41627.014
Author response image 1
Author response image 2
Author response image 3
Tables
Key resources table
| Reagent type (species) or resource | Designation | Source or reference | Identifiers | Additional information |
|---|---|---|---|---|
| Gene (Mus musculus) | cebpa | NA | Ensembl: ENSG00000245848 | |
| Strain, strain background (Mus musculus) | Pou5f1GFP transgenic mouse | Boiani et al., 2002 | NA | Strain: C57Bl /6 × DBA/2 |
| Strain, strain background (Mus musculus) | Gt(ROSA)26Sortm1 (rtTA*M2)Jae Col1a1tm3 (tetO-Pou5f1,-Sox2,- Klf4,-Myc)Jae/J | The Jackson Laboratory | Cat# 011004; RRID:IMSR_JAX:011004 | Strain: (C57BL/6 × 129S4/ SvJae)F1 |
| Strain, strain background (Mus musculus) | Pou5f1-GFP OSKM-reprogrammable | Jaitin et al. (2014), Di Stefano et al. (2016) | NA | Strain: C57BL /6 × 129 |
| Cell line (Homo sapiens) | PlatE retroviral packaging cell line | Cell Biolabs | Cat# RV-101; RRID: CVCL_B488 | |
| Cell line (Mus musculus) | S17 stromal cell line | From Dr. Dorshkind, UCLA. (Collins and Dorshkind, 1987) | RRID: CVCL_E226 | |
| Cell line (Mus musculus) | Mouse Embryonic Fibroblasts, Irradiated | GIBCO | Cat# A34180 | |
| Recombinant DNA reagent | pMSCV-Cebpa-IRES-hCD4 | Produced in-house, (Bussmann et al., 2009) | NA | |
| Antibody | Mouse monoclonal APC Anti-human CD4 (RPA-T4) | BD Biosciences | Cat# 555349; RRID: AB_398593 | Dilution used = 1:400 |
| Antibody | Mouse monoclonal biotin anti-human CD4 (RPA-T4) | eBioscience | Cat# 13–0049; RRID:AB_466337 | Dilution used = 1:400 |
| Antibody | Rat monoclonal Anti-Mouse CD16/CD32 (Mouse BD Fc Block) | BD Biosciences | Cat# 553142; RRID: AB_394654 | Dilution used = 1:400 |
| Antibody | Rat monoclonal Pe-cy7 Anti-mouse CD19 (1D3) | BD Biosciences | Cat# 552854; RRID:AB_394495 | Dilution used = 1:400 |
| Antibody | Mouse monoclonal APC Anti-mouse CD11b (44) | BD Biosciences | Cat# 561015; RRID:AB_10561676 | Dilution used = 1:400 |
| Antibody | Rat monoclonal biotin Anti-mouse CD19 (1D3) | BD Biosciences | Cat# 553784; RRID: AB_395048 | Dilution used = 1:400 |
| Antibody | Rabbit monoclonal [Y69] to c-Myc | Abcam | Cat# ab32072; RRID:AB_731658 | Dilution used = 1:76 |
| Antibody | Goat Polyclonal Anti-Rabbit IgG H and L Alexa Fluor 647 | Life technologies | Cat# A32733; RRID:AB_2633282 | Dilution used = 1:2000 |
| Strain, strain background (Escherichia coli) | E. coli: BL21(DE3) Competent | New England Biolabs | Cat# C2527I | |
| Peptide, recombinant protein | Recombinant murine IL-7 | Peprotech | Cat# 217–17 | |
| Peptide, recombinant protein | Recombinant murine IL-4 | Peprotech | Cat# 214–14 | |
| Peptide, recombinant protein | Recombinant murine IL-15 | Peprotech | Cat# 210–15 | |
| Peptide, recombinant protein | ESGRO Recombinant mouse LIF protein | Merk Millipore | Cat# ESG1106 | |
| Commercial assay or kit | Click-IT EdU Cytometry assay kit | Invitrogen | Cat# C10425 | |
| Commercial assay or kit | miRNeasy mini kit | Qiagen | Cat# 217004 | |
| Commercial assay or kit | SYBR Green QPCR Master Mix | Applied Biosystems | Cat# 4309155 | |
| Commercial assay or kit | Alkaline Phosphatase Staining Kit II | Stemgent | Cat# 00–0055 | |
| Commercial assay or kit | High Capacity RNA-to-cDNA kit | Applied Biosystems | Cat# 4387406 | |
| Chemical compound, drug | 17β-estradiol | Merck Millipore | Cat# 3301 | |
| Chemical compound, drug | MEK inhibitor (PD0325901) | Selleckchem | Cat# S1036 | |
| Chemical compound, drug | Doxycycline hyclate | Sigma-Aldrich | Cat# D9891 | |
| Chemical compound, drug | L-Ascorbic Acid | Sigma-Aldrich | Cat# A92902 | |
| Chemical compound, drug | GSK3b inhibitor (CHIR-99021) | Selleckchem | Cat# S1263 | |
| Other | DMEM Medium | Gibco | Cat# 12491015 | |
| Other | RPMI 1640 Medium | Gibco | Cat# 12633012 | |
| Other | Knockout-DMEM | Gibco | Cat# 10829018 | |
| Other | Neurobasal Medium | Gibco | Cat# 21103049 | |
| Other | DMEM-F12 Medium | Gibco | Cat# 12634010 | |
| Other | Fetal Bovine Serum, E.U.-approved, South America origin | Gibco | Cat# 10270–106 | |
| Other | Embryonic stem-cell FBS, qualified, US origin | Gibco | Cat# 10270–106 | |
| Other | KnockOut Serum Replacement | Gibco | Cat# A3181502 | |
| Other | Pen Strep | Gibco | Cat# 15140122 | |
| Other | L-Glutamine (200 mM) | Gibco | Cat# 25030081 | |
| Other | Sodium Pyruvate (100 mM) | Gibco | Cat# 11360070 | |
| Other | MEM Non-Essential Amino Acids Solution (100X) | Gibco | Cat# 11140068 | |
| Other | 2-Mercaptoethanol | Invitrogen | Cat# 31350010 | |
| Other | N-2 Supplement (100X) | Gibco | Cat# 17502048 | |
| Other | B-27 Serum-Free Supplement (50X) | Gibco | Cat# 17504044 | |
| Other | TrypLE Express Enzyme (1X) | Gibco | Cat# 12605010 | |
| Other | Trypsin-EDTA (0.05%) | Gibco | Cat# 25300054 | |
| Other | MACS Streptavidin MicroBeads | Miltenyi Biotec | Cat# 130-048-101 | |
| Other | MACS LS magnetic columns | Miltenyi Biotec | Cat# 130-042-401 | |
| Software, algorithm | R | R Project for Statistical Computing http://www.r-project.org/ | RRID:SCR_001905 |
Additional files
-
Supplementary file 1
Gene cluster membership and gene loadings on each independent component for each detected gene.
The sign of cluster membership is positive if the gene has the highest absolute loading on the positive side of the component and negative if the highest absolute loading is on the negative side of the component.
- https://doi.org/10.7554/eLife.41627.015
-
Supplementary file 2
Total mRNA count, number of detected genes, and projection onto each independent component, for each single cell.
- https://doi.org/10.7554/eLife.41627.016
-
Supplementary file 3
Fisher’s test based gene set enrichment analysis on Gene Ontology categories (biological process) for each gene cluster derived from ICA.
Includes odds ratios, p-values and FDR, number of genes associated with each category, number and names of genes included both in the cluster and in the category.
- https://doi.org/10.7554/eLife.41627.017
-
Supplementary file 4
Fisher’s test based gene set enrichment analysis on hallmark genesets for each gene cluster derived from ICA.
It includes odds ratio, p-value and FDR, number of genes included in each category, number and names of genes included both in the cluster and in the category.
- https://doi.org/10.7554/eLife.41627.018
-
Supplementary file 5
Reprogramming efficiencies for different cell types and expression of Myc from Jaitin et al. (2014) and Myc component from the mouse cell type atlas.
- https://doi.org/10.7554/eLife.41627.019
-
Supplementary file 6
Fisher’s test based gene set enrichment analysis on both GO and hallmark gene sets for genes differentially expressed with a fold change of at least 1.3 between adjacent time points during reprogramming and transdifferentiation.
Includes odds ratio, p-value and FDR, number of genes included in each category, number and names of genes both included both in the cluster and in the category.
- https://doi.org/10.7554/eLife.41627.020
-
Supplementary file 7
Fisher’s test based gene set enrichment analysis on both GO and hallmark gene sets for genes in the clusters shown in the heatmaps of supplementary Figure 3j-l.
- https://doi.org/10.7554/eLife.41627.021
-
Transparent reporting form
- https://doi.org/10.7554/eLife.41627.022
Download links
A two-part list of links to download the article, or parts of the article, in various formats.
Downloads (link to download the article as PDF)
Open citations (links to open the citations from this article in various online reference manager services)
Cite this article (links to download the citations from this article in formats compatible with various reference manager tools)
Single cell RNA-seq identifies the origins of heterogeneity in efficient cell transdifferentiation and reprogramming
eLife 8:e41627.
https://doi.org/10.7554/eLife.41627


