Combined transcriptome and proteome profiling reveals specific molecular brain signatures for sex, maturation and circalunar clock phase
- University of Vienna, Vienna BioCenter, Austria
- University of Vienna, Medical University of Vienna, Vienna BioCenter, Austria
- Max F Perutz Laboratories, Austria
- University of Vienna, Austria
Figures
Figure 1 with 2 supplements

Strategy to capture the impact of maturation, sex and circalunar phase on the head transcriptome and proteome of Platynereis dumerilii.
(a) Light regime of the Platynereis culture and its correlation with maturation; daily and nocturnal light conditions are schematised. Eight consecutive nights with nocturnal light per month provide a simplified ‘full moon’ (FM) stimulus, alternating with dark nights (‘new moon’/NM) (intensity and spectra see Figure 1—figure supplement 2a–d). (b) Representative images of the different animal stages relevant for the study: IM - immature; PM - premature; M - mature. Top row: overview of heads at the respective stage; dotted line: cut site for head sampling. scale bars: 1 mm. Lower rows: representative microscopic images of coelomic cells used to diagnose each stage. Whereas immature animals display essentially only eleocytes (left), premature animals (middle) show eleocytes as well as germ cells (oocytes and spermatogonia, respectively). In mature animals (right), oocytes have reached their full size of ~180 µm in females, and male spermatogonia have differentiated into spermatozoa. Scale bars: 50 µm. (c) Scheme illustrating the two distinct circalunar phases used for sampling; NM = New Moon; FRFM = Free Running Full Moon (Zantke et al., 2014; Zantke et al., 2013). (d) Schematic flow chart of the newly developed protocol, allowing to profile the proteome and corresponding transcriptome of each sample.
-
Figure 1—source data 1
Sample IDs.
Table depicting maturation satge, sex and lunar phase of the samples included in this study.
- https://doi.org/10.7554/eLife.41556.006
-
Figure 1—source data 2
Differential expression comparisons.
Table showing the different comparions made for DET/DEP predictions.
- https://doi.org/10.7554/eLife.41556.007
Figure 1—figure supplement 1
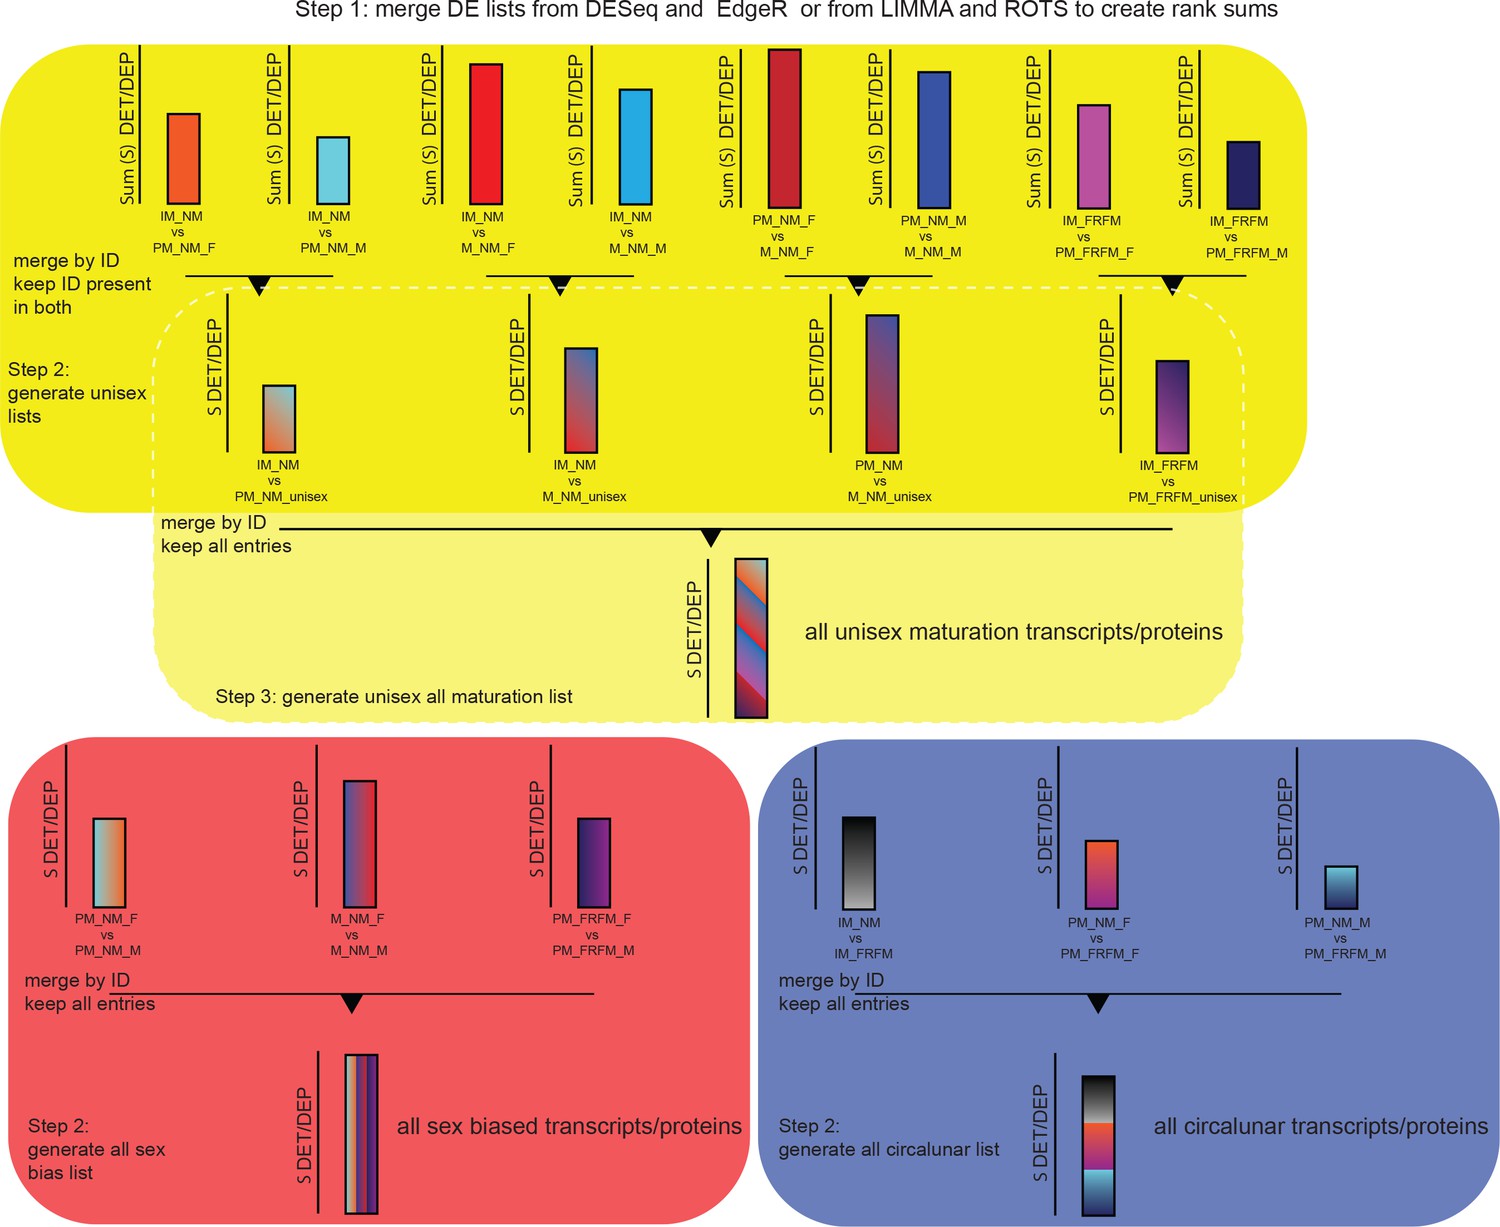
Schematic of representation of the strategy for the generation of the maturation, sex and lunar transcript/proteome regulated lists.
Step1 involves the generation of DESeq-EdgeR or ROTS-LIMMA rank sum lists for each of the 14 comparisons as outlined in the Materials and methods section. Step two is different for sex biased and circalunar transcripts/proteins on the one hand and for maturation on the other hand. For sex and lunar transcripts/proteins this step consists of subsequently merging the three individual comparisons - PM_NM_F vs. PM_NM_M, M_NM_F vs. M_NM_M and PM_FRFM_F vs. PM_FRFM_M for sex biased transcripts/proteins; and IM_NM vs. IM_FRFM, PM_NM_F vs. PM_FRFM_F and PM_NM_M vs. PM_FRFM_M for the lunar comparison - and keeping all entries in the final lists resulting in the final sex biased and circalunar transcript/proteome lists. For the maturation comparison step two is the generation of ‘unisex’ lists for the different developmental comparisons, for example out of the two IM_NM vs. PM_NM comparisons, IM_NM vs. PM_NM_F and IM_NM vs. PM_NM_M a single IM_NM vs. PM_NM list is build. To achieve this, the respective lists are merged by ID as above, but only IDs present in both initial lists are kept. This eliminates transcripts/proteins called DE in only one sex, however, entries regulated differently between sexes and called DE between two developmental stages are retained (see overlap between maturation and sex bias in Figures 3a and 5a, respectively). Step three only applies to the maturation comparison: In this step the four ‘unisex’ lists, IM_NM vs. PM_NM, IM_NM vs. M_NM, PM_NM vs. M_NM and IM_FRFM vs. PM_FRFM, are merged by ID and all entries are kept in the final list, as described for step two for the sex and lunar list. The resulting list contains all maturation transcripts/proteins.
Figure 1—figure supplement 2
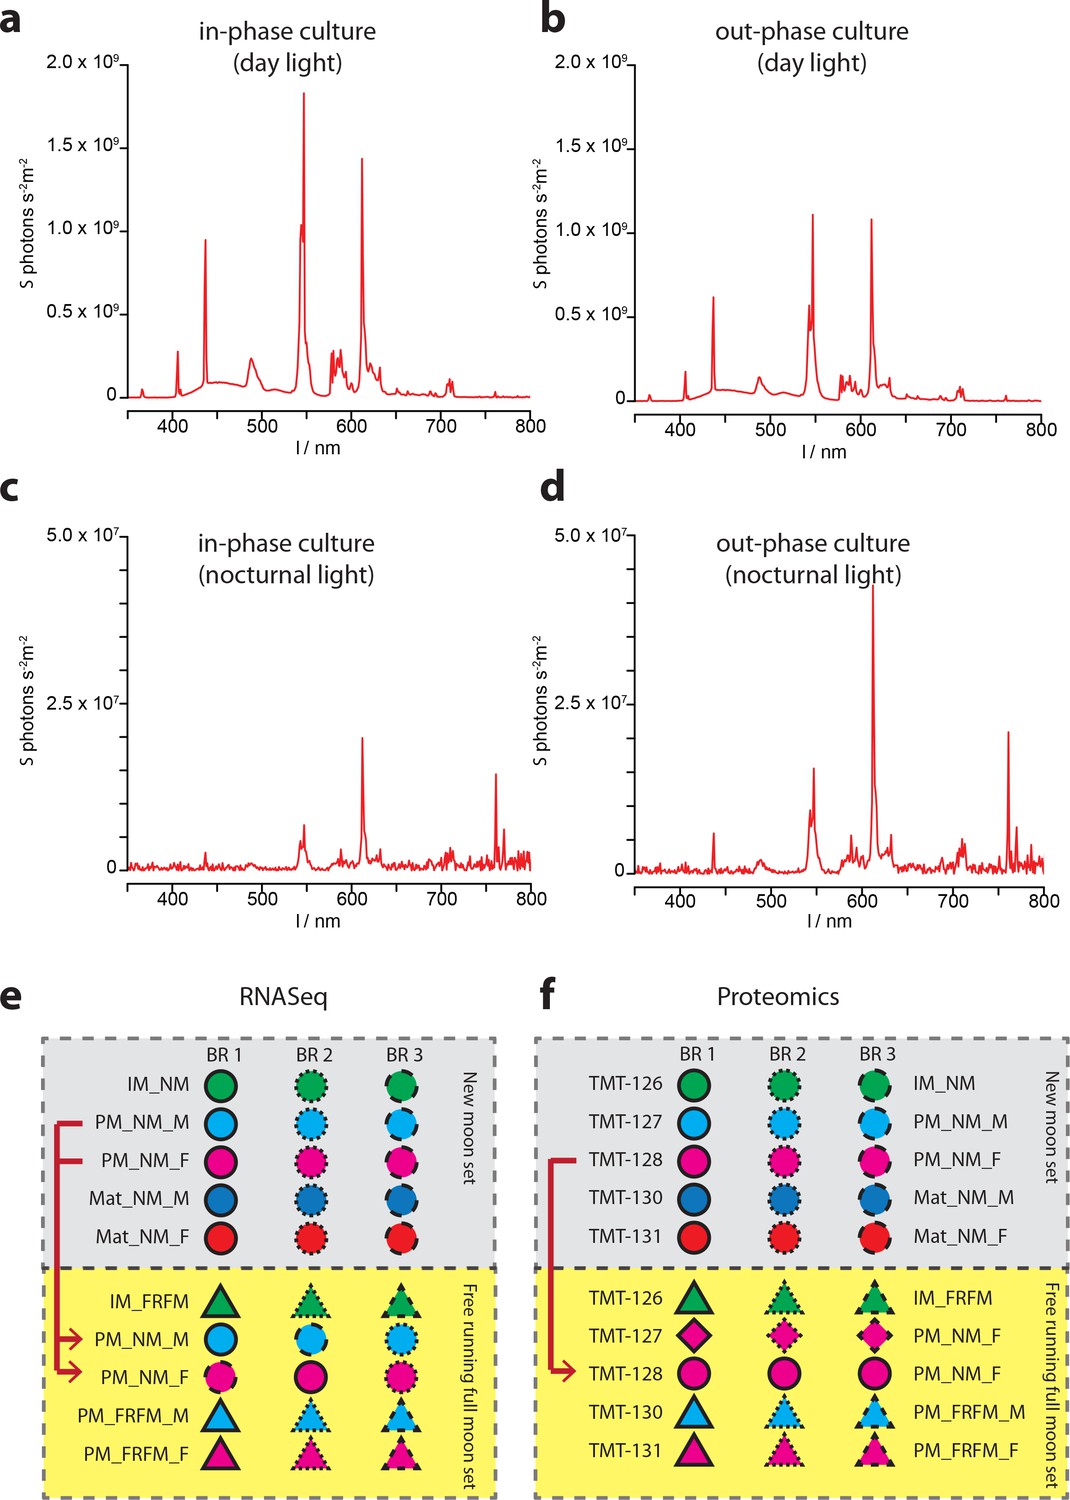
Ambient light conditions and overview over the multiplexing strategies employed for transcriptomic and proteomic analyses.
(a–d) Representative illumination profiles of the worm culture rooms at different lunar phases. (a) Light spectrum of the ‘inphase culture room’ during day. (b) Light spectrum of the ‘outphase culture room’ during day. (c) Nocturnal light spectrum ‘inphase room’ under Full-moon conditions (FM). (d) Nocturnal light spectrum ‘outphase room’ under FM conditions. (e) Schematic overview of the multiplexing strategy applied for RNA-Seq; (f) respective overview of the multiplexing strategy for proteomics. In (e,f), red arrows denote NM samples run as technical replicates in the FRFM transcriptome sequencing and proteome measurements.
Figure 2
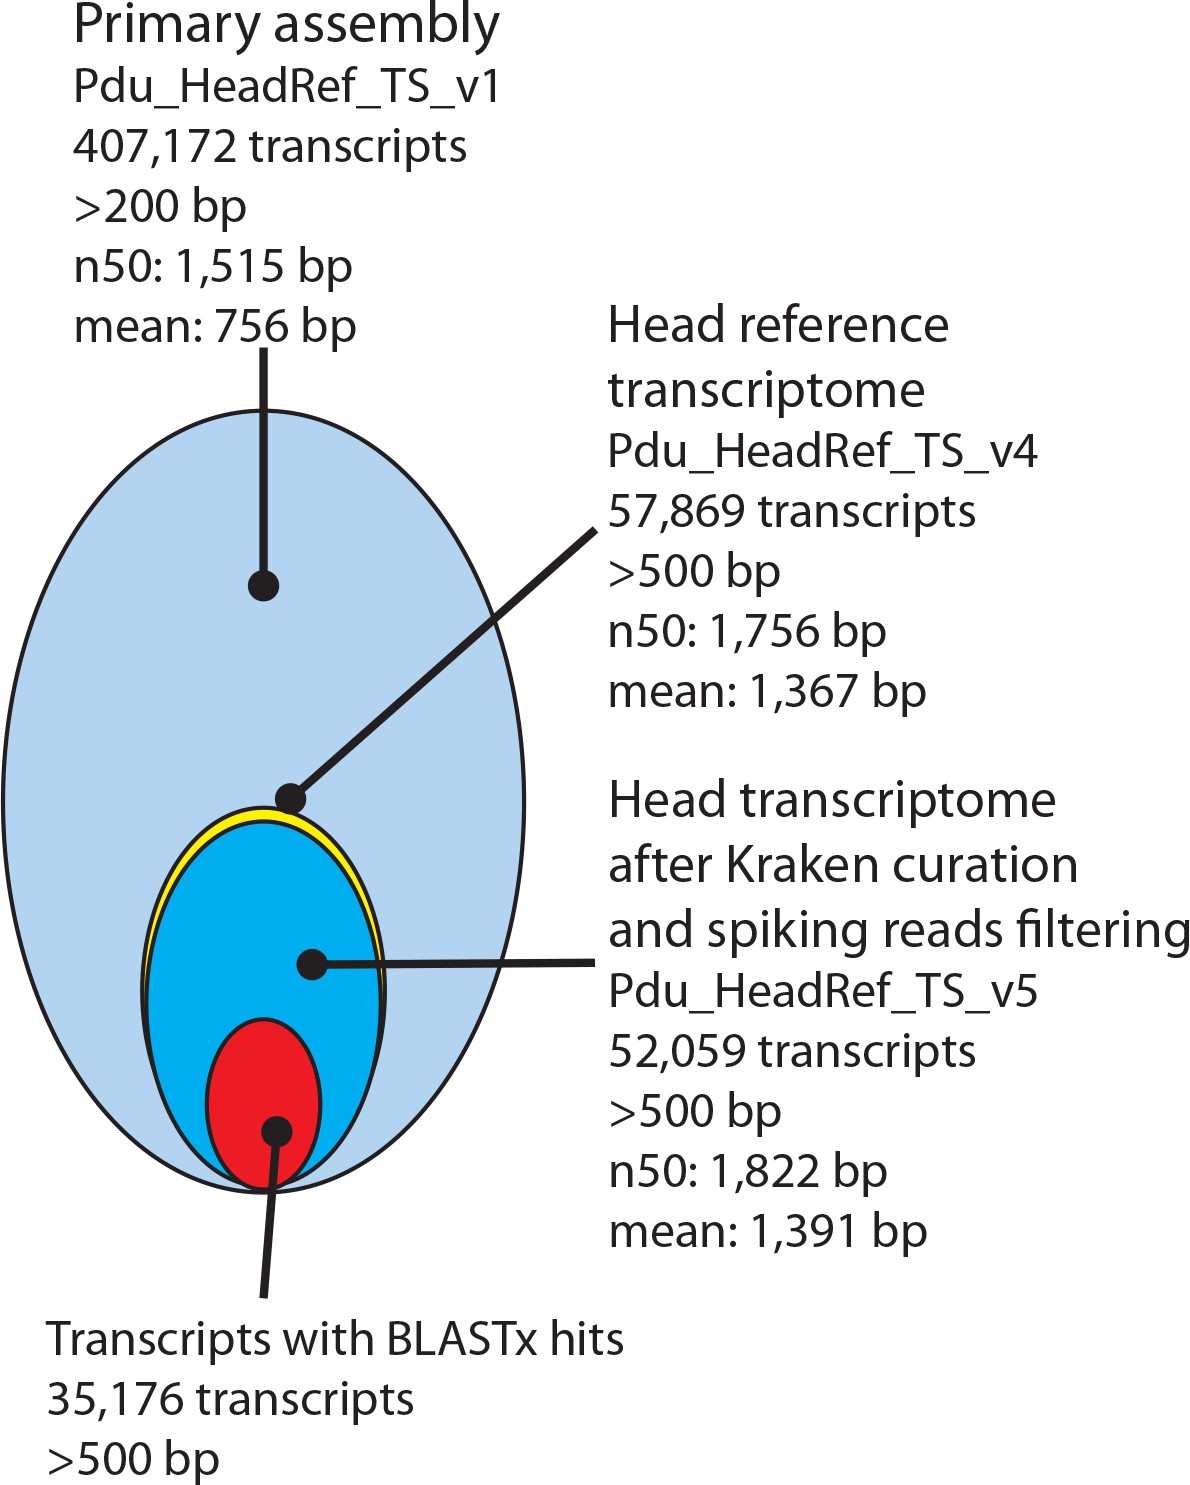
Processing and basic features of the Platynereis head transcriptome.
The primary assembly consisting of 407,172 transcripts with >200 bp was successively processed by: i) collapsing multi-copy transcripts to the longest transcripts of each cluster, ii) removing transcripts shorter than 500 bp, ii) removing transcripts arising from common model organisms or potential food sources, iv) substituting less complete transcripts with previously published sequences from NCBI and the transcriptome published by Conzelmann et al. (2013), and v) adding missing sequences from NCBI. In total 35,176 Pdu_HeadRef_TS_v5 sequences have BLASTx hits against the NCBI nr- database.
-
Figure 2—source data 1
Excluded transcripts.
Table containing the IDs of the 5,727 prokaryotic contaminats present in the TS_v4 as identified by Kraken; which were excluded from TS_v5 prior to differential expression analysis.
- https://doi.org/10.7554/eLife.41556.009
-
Figure 2—source data 2
Platynereis head reference transcriptome v1 base annotation.
Annotation of TS_v1, including blastn, blastx, GO-term and THMM predictions.
- https://doi.org/10.7554/eLife.41556.010
-
Figure 2—source data 3
Platynereis head reference transcriptome v4 interpro annotation.
Interpro annotation of TS_v4, including blastx-hist, GO-terms, and KEGG-terms.
- https://doi.org/10.7554/eLife.41556.011
-
Figure 2—source data 4
Transcriptome ENA accession numbers.
Full list of European Nucleotide Archive accession numbers for all sequencing raw data and transcriptome assemblies from this study.
- https://doi.org/10.7554/eLife.41556.012
Figure 3 with 10 supplements
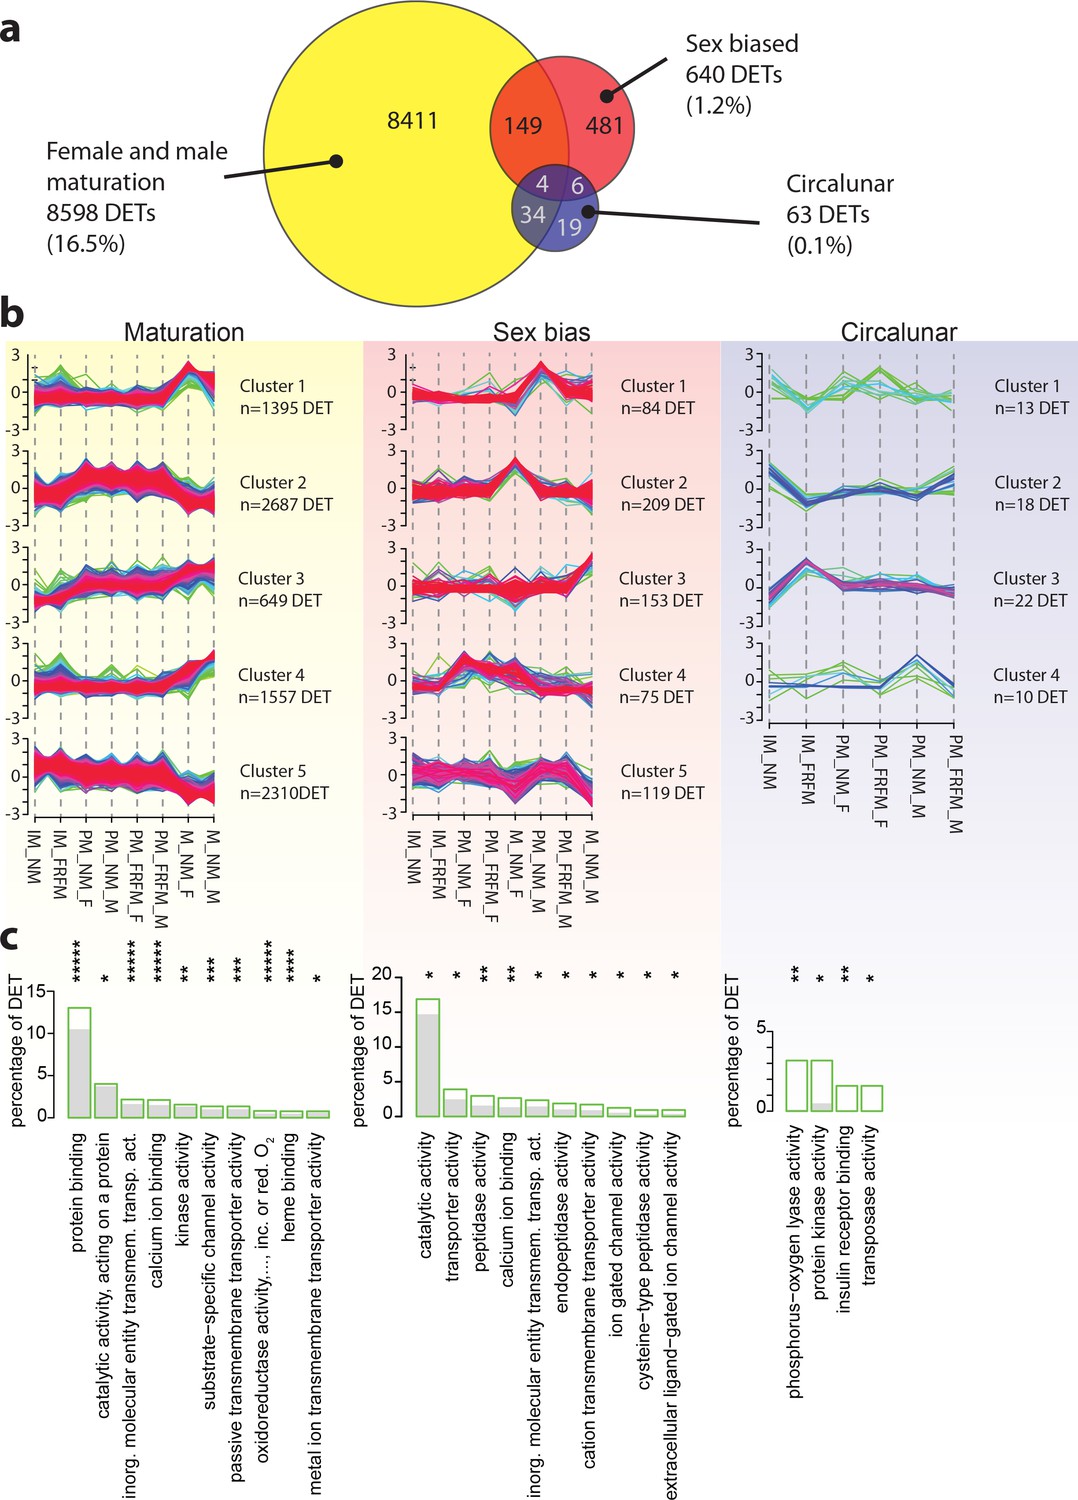
Maturation, sex and circalunar phase have distinct transcriptomic signatures in Platynereis heads.
(a) Venn diagram showing the overall numbers of genes identified as significantly regulated within and across the three different biological processes. Percent in brackets indicate the respective fraction compared to total number of analyzed IDs. (b) Soft clustering of differentially expressed genes using the Mfuzz algorithm. Maturation (yellow) and sexual differences (light red) yielded five clusters; circalunar phase-regulated (light blue) expression was best represented by four clusters. Compare to Figure 5b for similarity to regulated protein clusters. (c) Results from the GO-term enrichment analysis using the GOStats package on the differentially expressed genes in each comparison; the ten most abundant terms in the Molecular Function category are displayed (for more GO-results see Figure 3—figure supplement 1–9). Green boxes: actual percentage of differentially expressed transcripts for each term; grey bars: expected number of transcripts per category. Maturation: protein binding: GO:0005515, catalytic activity, acting on a protein: GO:0140096, inorganic molecular entity transmembrane transporter activity: GO:0015318, calcium ion binding: GO:0005509, kinase activity: GO:0016301, substrate-specific channel activity: GO:0022838, passive transmembrane transporter activity: GO:0022803, oxidoreductase activity, acting on paired donors, with incorporation or reduction of molecular oxygen: GO:0016705, heme binding: GO:0020037, metal ion transmembrane transporter activity: GO:0046873. Sex bias: catalytic activity: GO:0003824, transporter activity: GO:0005215, peptidase activity: GO:0008233, calcium ion binding: GO:0005509, inorganic molecular entity transmembrane transporter activity: GO:0015318, endopeptidase activity: GO:0004175, cation transmembrane transporter activity: GO:0008324, ion gated channel activity: GO:0022839, cysteine-type peptidase activity: GO:0008234. Circalunar phase: phosphorus-oxygen lyase activity: GO:0016849, protein kinase activity: GO:0004672, insulin receptor binding: GO:0005158, transposase activity: GO:0004803. Statistical significance was tested with a hypergeometric G-test implemented in the GOStats package. *p < 0.05, **p < 0.01, ***p < 0.001, ****p < 0.0001, *****p < 0.00001.
-
Figure 3—source data 1
Platynereis head reference transcriptome v5 read counts.
Table containing the raw read count data for TS_v5. This table is used as input for differential expression analysis.
- https://doi.org/10.7554/eLife.41556.024
-
Figure 3—source data 2
Transcriptome: DESeq normalised read counts.
Normalised read counts of TS_v5 as calculated by the DESeq2 algorithm; used to build DET expression graphs.
- https://doi.org/10.7554/eLife.41556.025
-
Figure 3—source data 3
Platynereis head reference transcriptome v5 gene universe.
Table containing the "gene universe" for the TS_v5 used as background for GO-term enrichment analysis in Figs. 3 and S3a-k.
- https://doi.org/10.7554/eLife.41556.026
-
Figure 3—source data 4
Transcriptome: DESeq output tables.
File containing DESeq predicted DETs for all 14 comparision made. Each comparison is contained within a separate tab.
- https://doi.org/10.7554/eLife.41556.027
-
Figure 3—source data 5
Transcriptome: EdgeR output tables.
File containing EdgeR predicted DETs for all 14 comparision made. Each comparison is contained within a separate tab.
- https://doi.org/10.7554/eLife.41556.028
-
Figure 3—source data 6
Transcriptome: DESeq2-EdgeR rank sum files.
This file contains DESeq2-EdgeR rank sums for predicted DETs for all 14 comparision made plus the all maturation rank sum predictions. Each comparison is contained within a separate tab. Note that while DESeq2 calculates the log2 fold change as A/B; EdgeR calculates the log2 fold change as B/A. log2FoldChange: DESeq2; log2FC: EdgeR; padj: BH-adjusted p-value DESeq2; FDR: BH-adjusted p-value EdgeR.
- https://doi.org/10.7554/eLife.41556.029
-
Figure 3—source data 7
Transcriptome: Mfuzz cluster gene IDs with cluster membership values.
This file contains the soft clustering output of RNA expression values with Mfuzz. Each comparison, maturation, sex, and lunar contains the individual transcript ID and the membership values for each cluster ranging from 0 to 1.
- https://doi.org/10.7554/eLife.41556.030
-
Figure 3—source data 8
Transcriptome: all over- and under-represented GO-Terms from all comparisions.
Table containing the results of the GO-term analysis on transcript level. Individual GO-terms are shown with their respective p-values in each of the three comparisons made (maturation, sex, and lunar), as well as their ontolgy, i.e. Molecular Function, Biological Process, or Cellular Compartment.
- https://doi.org/10.7554/eLife.41556.031
-
Figure 3—source data 9
Transcriptome: over- and under-represented GO-Terms maturation comparison.
This file contains the over- and under-representet GO-terms for the maturation comparison on transcript level. Tabs for each of the three ontologies, i.e. Molecular Function, Biological Process, and Cellular Compartment.
- https://doi.org/10.7554/eLife.41556.032
-
Figure 3—source data 10
Transcriptome: over- and under-represented GO-Terms sex bias comparison.
This file contains the over- and under-representet GO-terms for the sex comparison on transcript level. Tabs for each of the three ontologies, i.e. Molecular Function, Biological Process, and Cellular Compartment.
- https://doi.org/10.7554/eLife.41556.033
-
Figure 3—source data 11
Transcriptome: over- and under-represented GO-Terms circalunar comparison.
This file contains the over- and under-representet GO-terms for the lunar comparison on transcript level. Tabs for each of the three ontologies, i.e. Molecular Function, Biological Process, and Cellular Compartment.
- https://doi.org/10.7554/eLife.41556.034
-
Figure 3—source data 12
Transcriptome: over-represented GO-Term unique for any of the three comparisons.
This file contains those over-represented GO-terms which are unique to a given comparison on transcript level, i.e. maturation, sex, or lunar, with p-values for each of the three comparision.
- https://doi.org/10.7554/eLife.41556.035
-
Figure 3—source data 13
All transcripts significantly regulated during maturation (maturation DETs).
This file contains the IDs, mean expression values, top hit by blastX with e-value cut-off 10-4, e-value corresponding to blast hit, number of identical/ similar AA or gaps in blast alignment ("identity", "positives", "gaps") for all transcripts significantly regulated during maturation.
- https://doi.org/10.7554/eLife.41556.036
-
Figure 3—source data 14
All transcripts significantly regulated during sexual differentiation (sex DETs).
This file contains the IDs, mean expression values, top hit by blastX with e-value cut-off 10-4, e-value corresponding to blast hit, number of identical/ similar AA or gaps in blast alignment ("identity", "positives", "gaps") for all transcripts significantly regulated between males and females.
- https://doi.org/10.7554/eLife.41556.037
-
Figure 3—source data 15
All transcripts significantly regulated between circalunar phases (lunar DETs).
This file contains the IDs, mean expression values, top hit by blastX with e-value cut-off 10-4, e-value corresponding to blast hit, number of identical/ similar AA or gaps in blast alignment ("identity", "positives", "gaps") for all transcripts significantly regulated between circalunar phases.
- https://doi.org/10.7554/eLife.41556.038
Figure 3—figure supplement 1
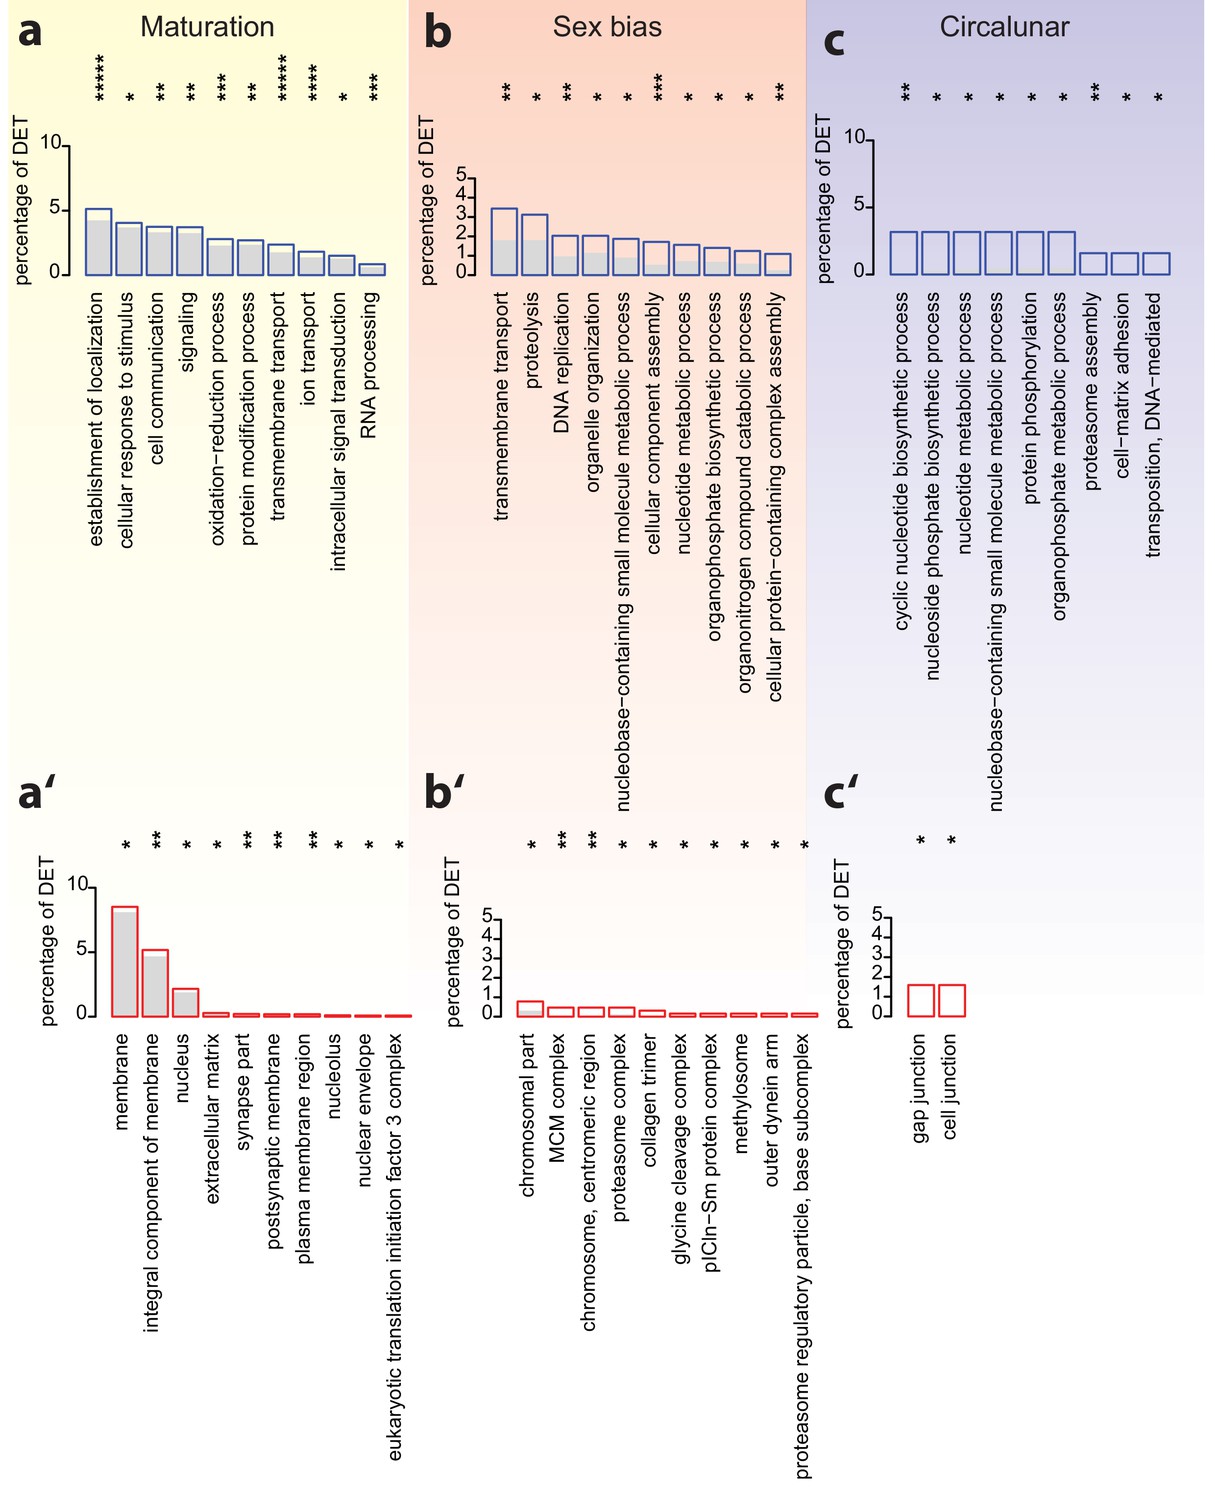
Analyses of over-represented GO-terms support the existence of distinct molecular signatures for maturation, sex and circalunar clock phase.
(a–c) top 10 enriched terms in the Biological Process category; blue boxes: percentage of differentially expressed transcripts for each term; the grey bars: expected numbers of transcripts per category. Maturation: establishment of localization: GO:0051234, cellular response to stimulus: GO:0051716, cell communication: GO:0007154, signaling: GO:0023052, oxidation-reduction process: GO:0055114, protein modification process: GO:0036211, transmembrane transport: GO:0055085, ion transport: GO:0006811, intracellular signal transduction: GO:0035556, RNA processing: GO:0006396. Sex bias: transmembrane transport: GO:0055085, proteolysis: GO:0006508, DNA replication: GO:0006260, organelle organization: GO:0006996, nucleobase-containing small molecule metabolic process: GO:0055086, cellular component assembly: GO:0022607, nucleotide metabolic process: GO:0009117, organophosphate biosynthetic process: GO:0090407, organonitrogen compound catabolic process: GO:1901565, cellular protein-containing complex assembly: GO:0034622. Circalunar phase: cyclic nucleotide biosynthetic process: GO:0009190, nucleoside phosphate biosynthetic process: GO:1901293, nucleotide metabolic process, GO:0009117, nucleobase-containing small molecule metabolic process, GO:0055086, protein phosphorylation, GO:0006468, organophosphate metabolic process, GO:0019637, proteasome assembly, GO:0043248, cell-matrix adhesion, GO:0007160, transposition, DNA-mediated: GO:0006313. (a’–c’) In analogy to (a–c), these panels list the top 10 enriched terms in the Cellular Compartment category. Red boxes: percentage of differentially expressed transcripts for each term; the grey bars: expected values of transcripts per category. Maturation: membrane: GO:0016020, integral component of membrane: GO:0016021, nucleus: GO:0005634, extracellular matrix: GO:0031012, synapse part: GO:0044456, postsynaptic membrane: GO:0045211, plasma membrane region: GO:0098590, nucleolus: GO:0005730, nuclear envelope: GO:0005635, eukaryotic translation initiation factor three complex: GO:0005852. Sex bias: chromosomal part: GO:0044427, MCM complex: GO:0042555, chromosome, centromeric region: GO:0000775, proteasome complex: GO:0000502, collagen trimer: GO:0005581, glycine cleavage complex: GO:0005960, pICln-Sm protein complex: GO:0034715, methylosome: GO:0034709, outer dynein arm: GO:0036157, proteasome regulatory particle, base subcomplex: GO:0008540. Circalunar phase: gap junction: GO:0005921, cell junction: GO:0030054. For all analyses, statistical significance was tested with a hypergeometric test implemented in the GOStats package. *p < 0.05, **p < 0.01, ***p < 0.001, ****p < 0.0001, *****p < 0.00001.
Figure 3—figure supplement 2
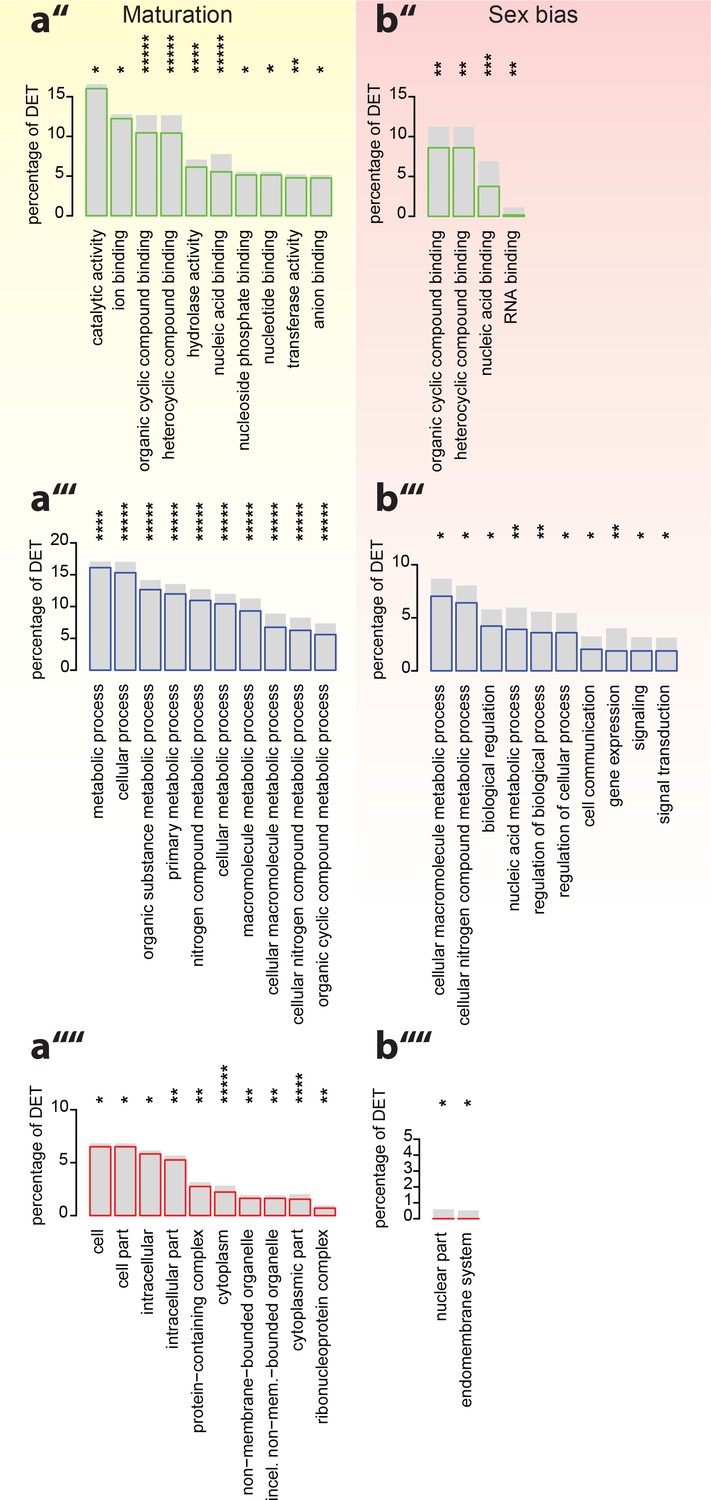
Analyses of under-represented GO-terms support the existence of distinct molecular signatures for maturation, sex and circalunar clock phase.
(a’’–b’’’’) corresponding analyses focusing on top under-represented GO-terms; (a’’,b’’) top under-represented GO-terms in the Molecular Function category; Maturation: catalytic activity: GO:0003824, ion binding: GO:0043167, organic cyclic compound binding: GO:0097159, heterocyclic compound binding, GO:1901363, hydrolase activity, GO:0016787, nucleic acid binding, GO:0003676, nucleoside phosphate binding, GO:1901265, nucleotide binding, GO:0000166, transferase activity, GO:0016740, anion binding, GO:0043168. Sex bias: organic cyclic compound binding: GO:0097159, heterocyclic compound binding: GO:1901363, nucleic acid binding: GO:0003676, RNA binding: GO:0003723. Circalunar phase: no signifcantly under-respresented GO-terms at α ≤0.05. (a’’’,b’’’) Top underrepresented terms in the Biological Process category. Maturation: metabolic process: GO:0008152, cellular process: GO:0009987, organic substance metabolic process: GO:0071704, primary metabolic process: GO:0044238, nitrogen compound metabolic process: GO:0006807, cellular metabolic process: GO:0044237, macromolecule metabolic process: GO:0043170, cellular macromolecule metabolic process: GO:0044260, cellular nitrogen compound metabolic process: GO:0034641, organic cyclic compound metabolic process: GO:1901360. Sex bias: cellular macromolecule metabolic process: GO:0044260, cellular nitrogen compound metabolic process: GO:0034641, biological regulation: GO:0065007, nucleic acid metabolic process: GO:0090304, regulation of biological process: GO:0050789, regulation of cellular process: GO:0050794, cell communication: GO:0007154, gene expression: GO:0010467, signaling: GO:0023052, signal transduction: GO:0007165. Circalunar phase: no signifcantly underrepresented GO-terms at α ≤0.05. (a’’’’,b’’’’) Top under-represented terms in the Cellular Compartment category. Maturation: cell: GO:0005623, cell part: GO:0044464, intracellular: GO:0005622, intracellular part: GO:0044424, protein-containing complex: GO:0032991, cytoplasm: GO:0005737, non-membrane-bounded organelle: GO:0043228, intracellular non-membrane-bounded organelle (incel. non-mem.-bounded organelle): GO:0043232, cytoplasmic part: GO:0044444, ribonucleoprotein complex: GO:1990904. Sex bias: nuclear part: GO:0044428, endomembrane system: GO:0012505. Circalunar phase: no signifcantly underrespresented GO-terms at α ≤0.05. For all analyses, statistical significance was tested with a hypergeometric test implemented in the GOStats package. *p < 0.05, **p < 0.01, ***p < 0.001, ****p < 0.0001, *****p < 0.00001.
Figure 3—figure supplement 3
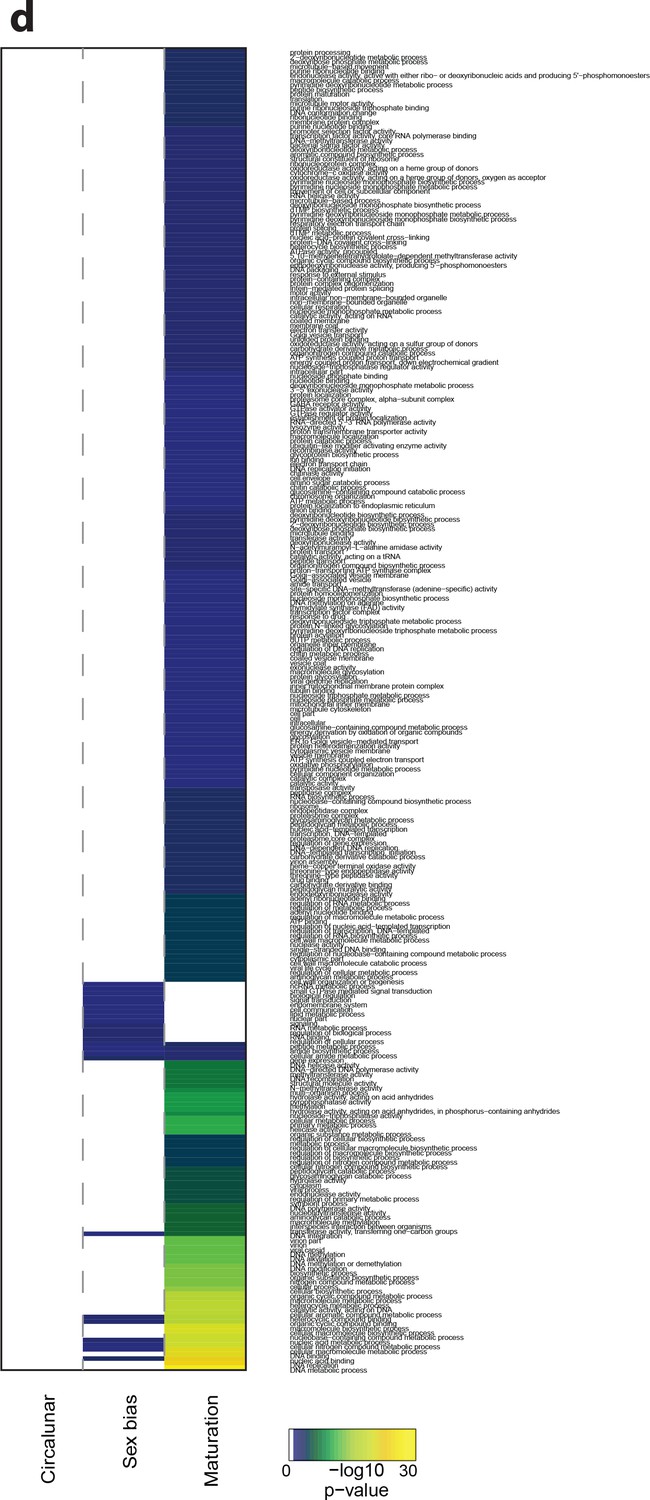
Heat map displaying under-represented GO-terms in all categories.
The heat map is subdivided (columns) by the regulation of each GO-term by circalunar clock phase (left), sex (middle) and/or maturation (right); colours are indicative of the enrichment p-value as calculated by a hypergeometric test implemented in the GOStats package.
Figure 3—figure supplement 4

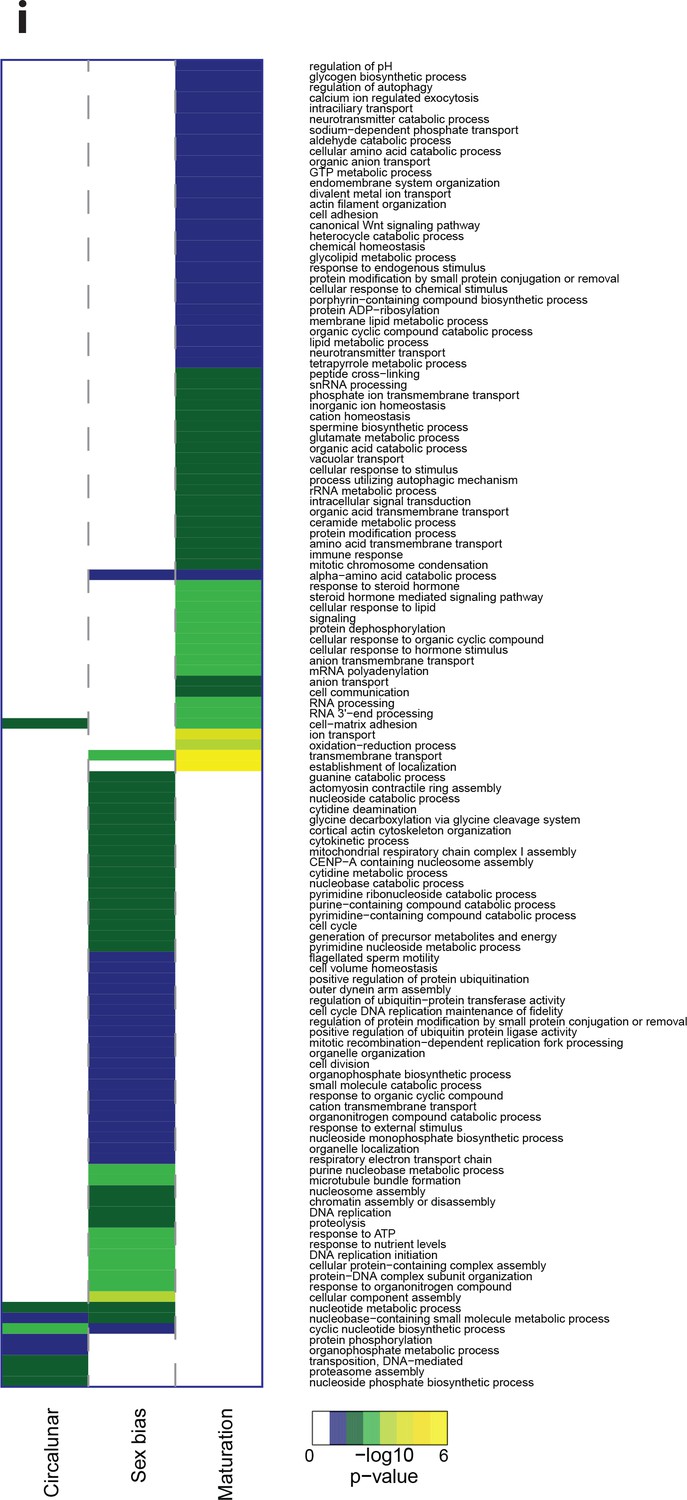
Heat map displaying under-represented GO-terms in the Biological Process category.
The heat map is subdivided (columns) by the regulation of each GO-term by circalunar clock phase (left), sex (middle) and/or maturation (right); colours are indicative of the enrichment p-value as calculated by a hypergeometric test implemented in the GOStats package.
Figure 3—figure supplement 5
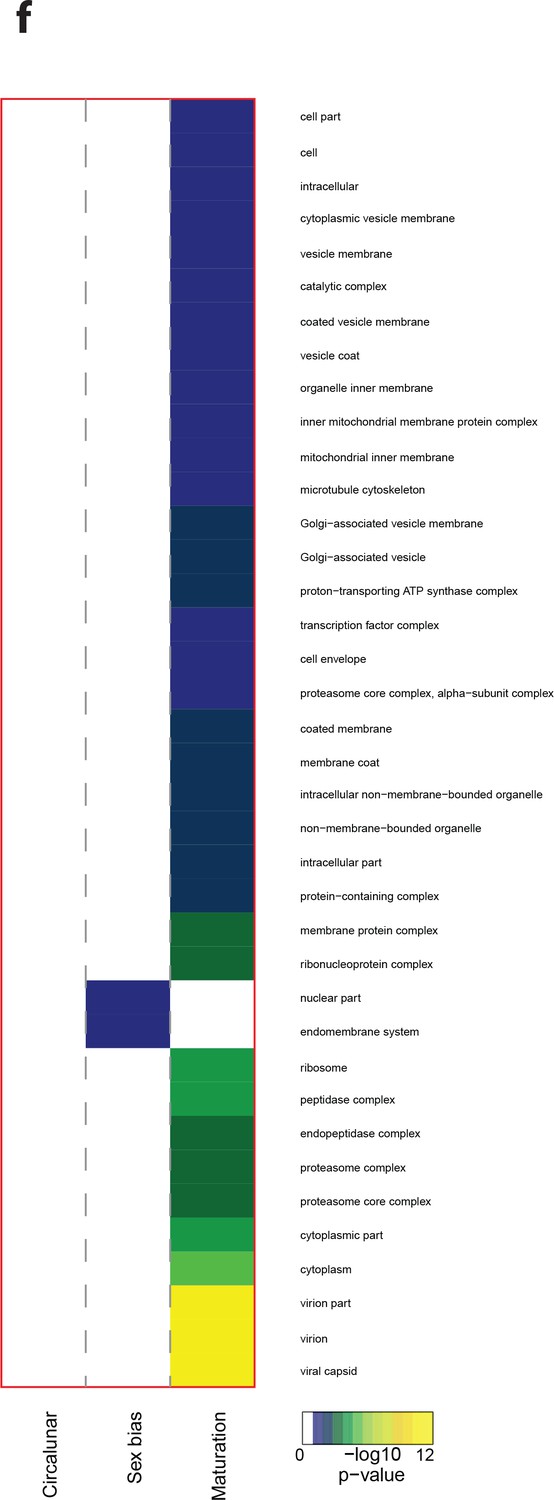
Heat map displaying under—represented GO-terms in the Cellular Compartment category.
The heat map is subdivided (columns) by the regulation of each GO-term by circalunar clock phase (left), sex (middle) and/or maturation (right); colours are indicative of the enrichment p-value as calculated by a hypergeometric test implemented in the GOStats package.
Figure 3—figure supplement 6
Heat map displaying under-represented GO-terms in the Molecular Function category.
The heat map is subdivided (columns) by the regulation of each GO-term by circalunar clock phase (left), sex (middle) and/or maturation (right); colours are indicative of the enrichment p-value as calculated by a hypergeometric test implemented in the GOStats package.
Figure 3—figure supplement 7
Heat map displaying over-represented GO-terms in all categories.
The heat map is subdivided (columns) by the regulation of each GO-term by circalunar clock phase (left), sex (middle) and/or maturation (right); colours are indicative of the enrichment p-value as calculated by a hypergeometric test implemented in the GOStats package.
Figure 3—figure supplement 8
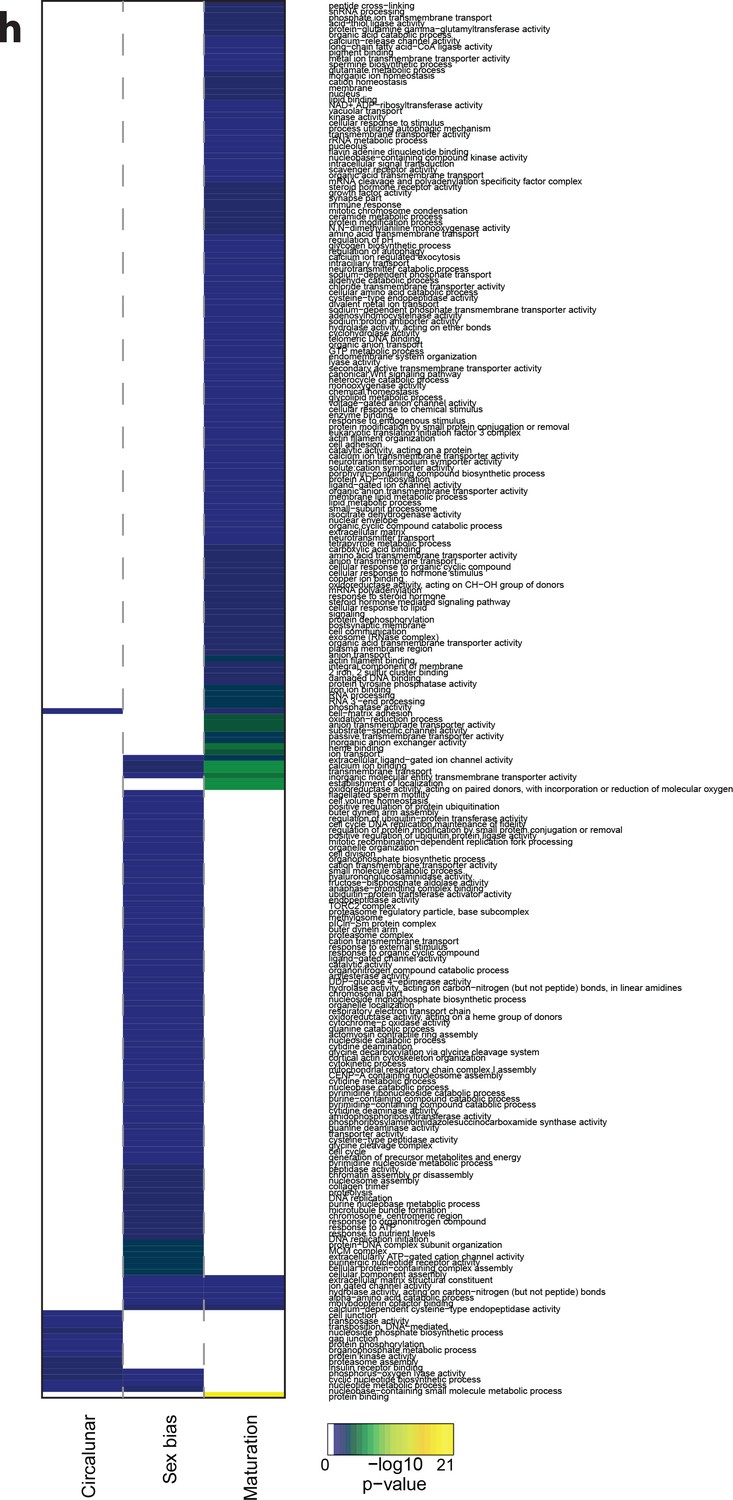
Heat map displaying over-represented GO-terms in the Biologcal Process categogy.
The heat map is subdivided (columns) by the regulation of each GO-term by circalunar clock phase (left), sex (middle) and/or maturation (right); colours are indicative of the enrichment p-value as calculated by a hypergeometric test implemented in the GOStats package.
Figure 3—figure supplement 9
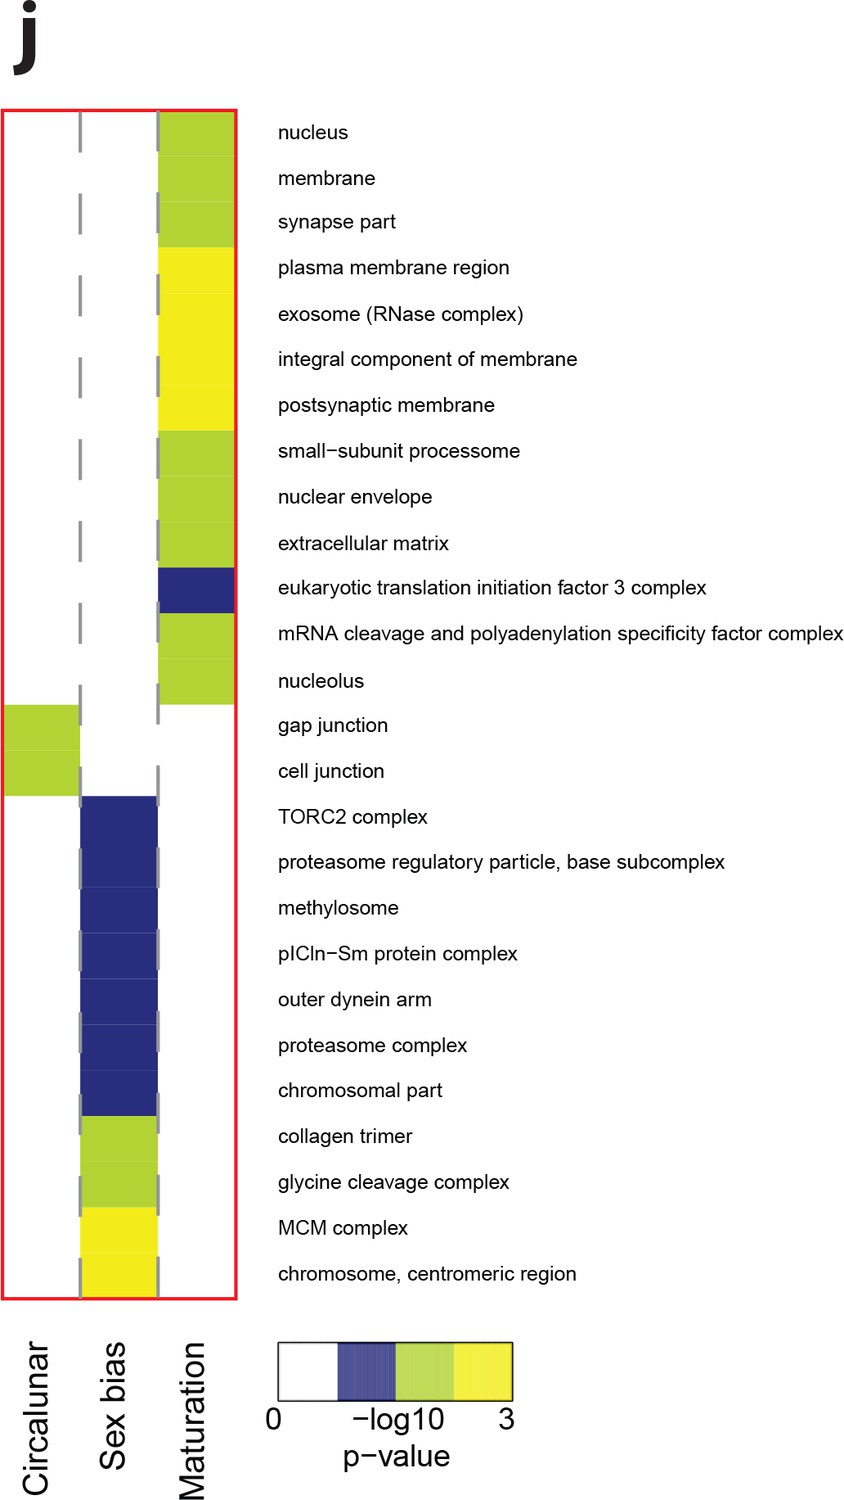
Heat map displaying over-represented GO-terms in the Cellular Compartment category.
The heat map is subdivided (columns) by the regulation of each GO-term by circalunar clock phase (left), sex (middle) and/or maturation (right); colours are indicative of the enrichment p-value as calculated by a hypergeometric test implemented in the GOStats package.
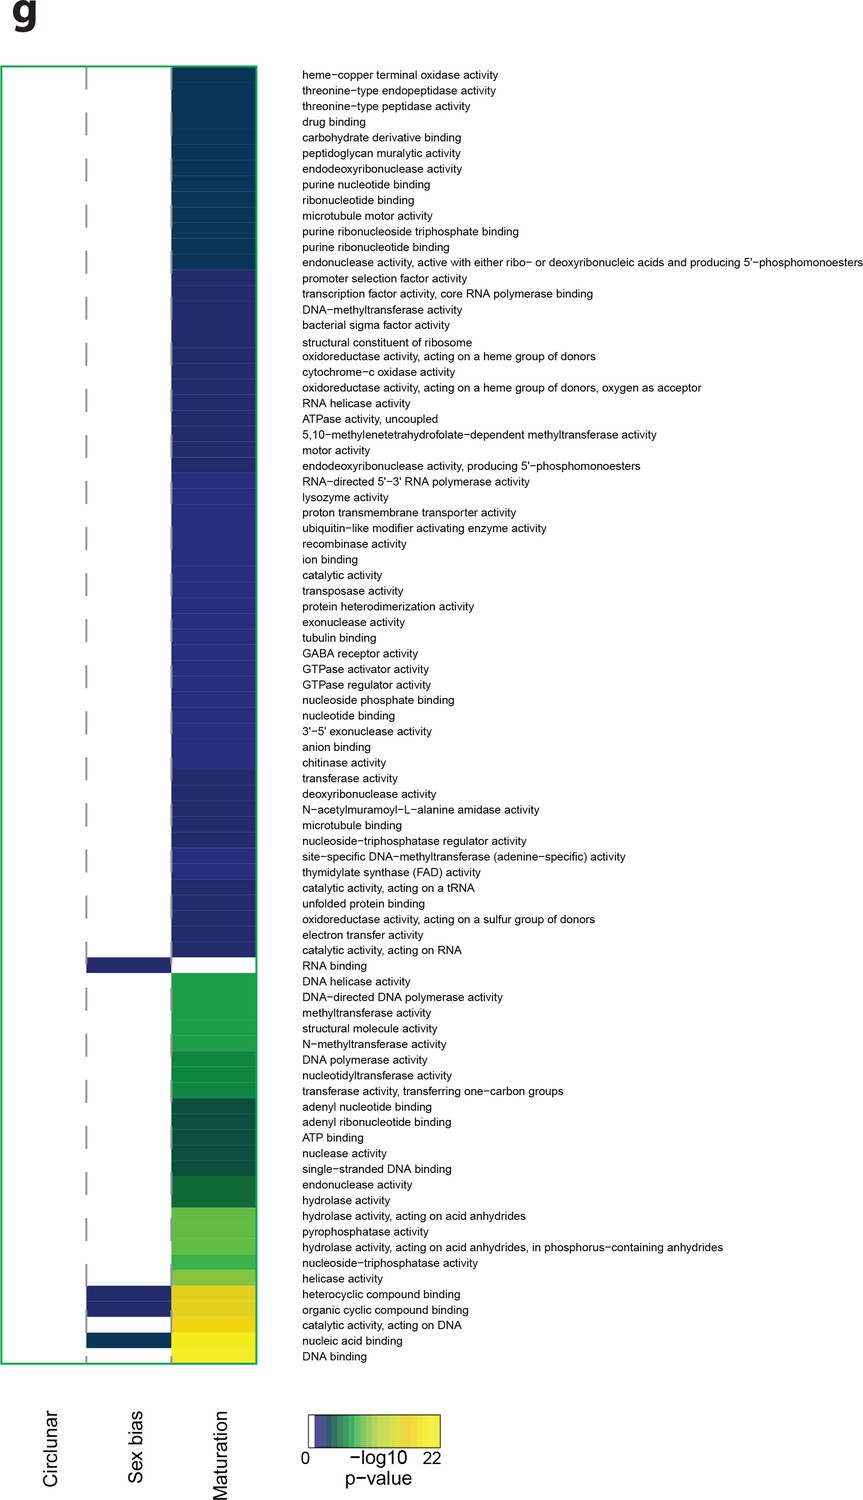
Figure 3—figure supplement 10
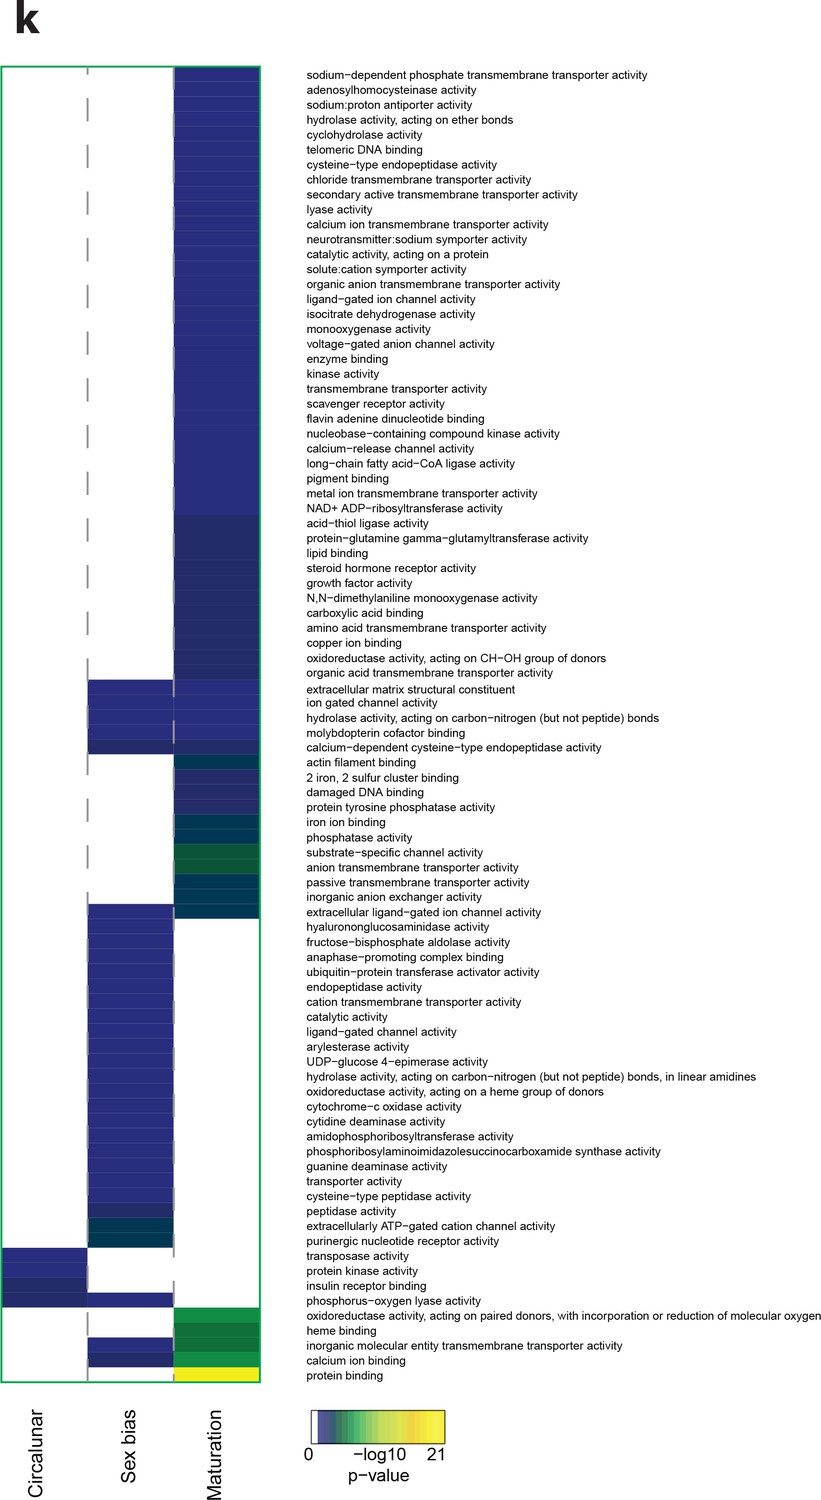
Heat map displaying over-represented GO-terms in the Molecular Function category.
The heat map is subdivided (columns) by the regulation of each GO-term by circalunar clock phase (left), sex (middle) and/or maturation (right); colours are indicative of the enrichment p-value as calculated by a hypergeometric test implemented in the GOStats package.
Figure 4 with 1 supplement
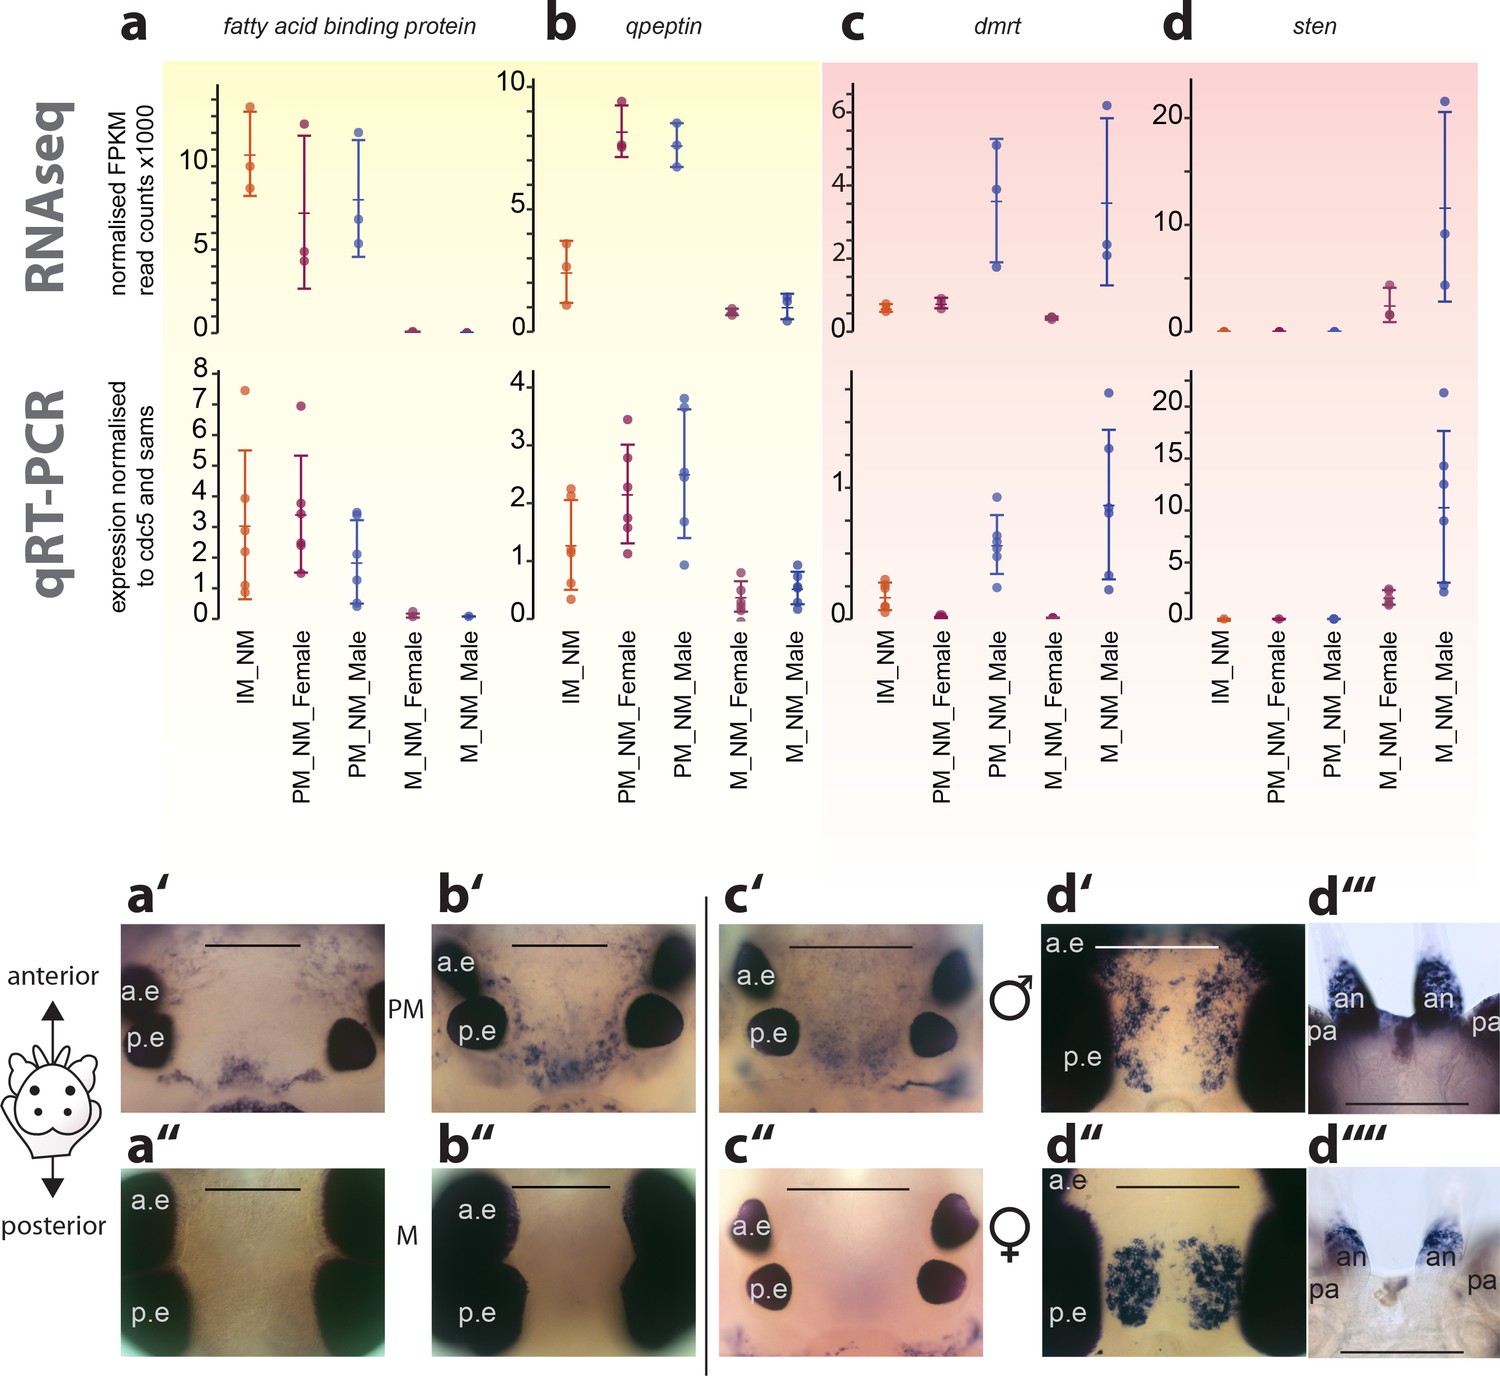
Exemplary validation of candidate genes by qRT-PCR and expression domains in the head.
(a–a’’,b–b’’) Maturation markers fatty acid binding protein and qpeptin. (c–c’’,d–d’’) Sexual differentiation markers dmrt and sten. (a–d): qRT-PCR validation of the candidates relative to the arithmetic mean of the reference genes cdc5 and sams. All graphs show the arithmetic mean with standard deviation, and the individual data points. (a’–d’’) Whole mount in situ hybridisations of the respective genes, comparing premature animals (PM, (a’,b’) with mature animals (M, a’’,b’’), and males (c’,d’,d’’’) with females (c’’,d’’, d’’’), respectively. All images except d’’’and d’’’’: dorsal views, anterior to the top, scale bar: 250 µm. d’’’ and d’’’’: ventral views, anterior top, scale bar: 200 µm. Also see Figure 4—figure supplement 1 for further validations. a.e.: anterior eye; p.e.: posterior eye, an: antenna, pa: palpa.
-
Figure 4—source data 1
Expression values relative to sams and cdc5 as obtained by qRT-PCR.
This file contains the qRT-PCR expression values of the candidate genes relative to the expression of the arithmetic mean of the reference genes sams and cdc5. Each gene is contained in a separate tab.
- https://doi.org/10.7554/eLife.41556.041
Figure 4—figure supplement 1
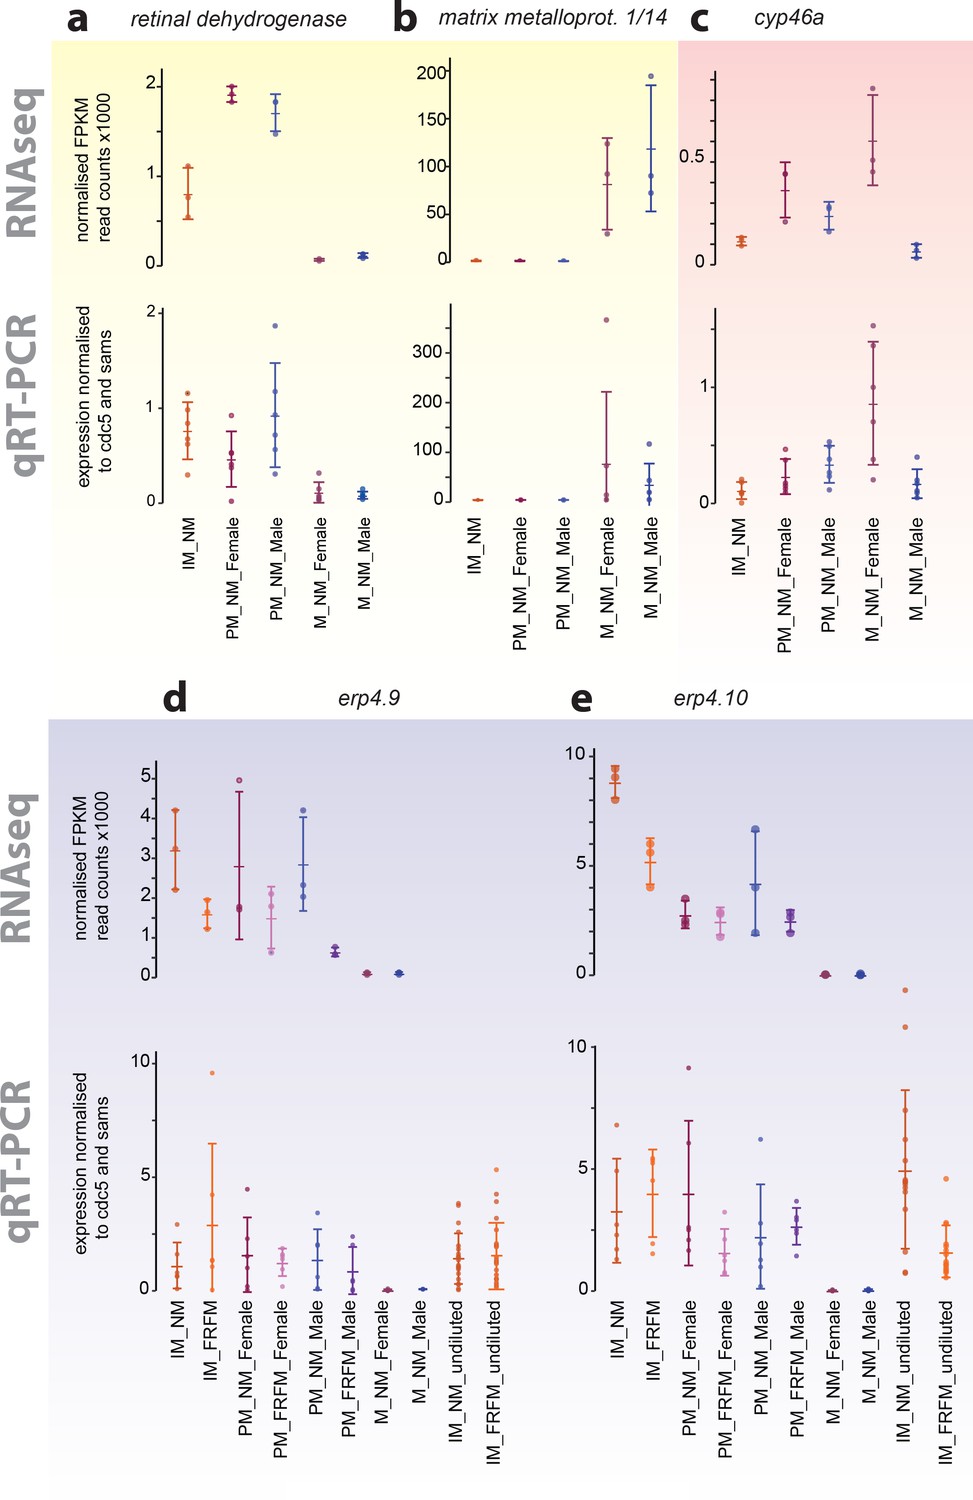
Exemplary validation of additional transcripts differentially expressed during maturation, between sexes or between circalunar clock phases:
(a,b) yellow- identified as maturation regulated; (c) light red- identified as sex-biased regulated; (d,e) light blue- identified as circalunar phase regulated. Note that for circalunar phase regulated transcripts verification by qPCR needs a higher cDNA amount input than for the tested maturation and sex-specific regulated transcripts. The graphs show the arithmetic mean with standard deviation, together with individual data points. Further details see Figure 4 (legend) and Materials and methods.
Figure 5 with 7 supplements
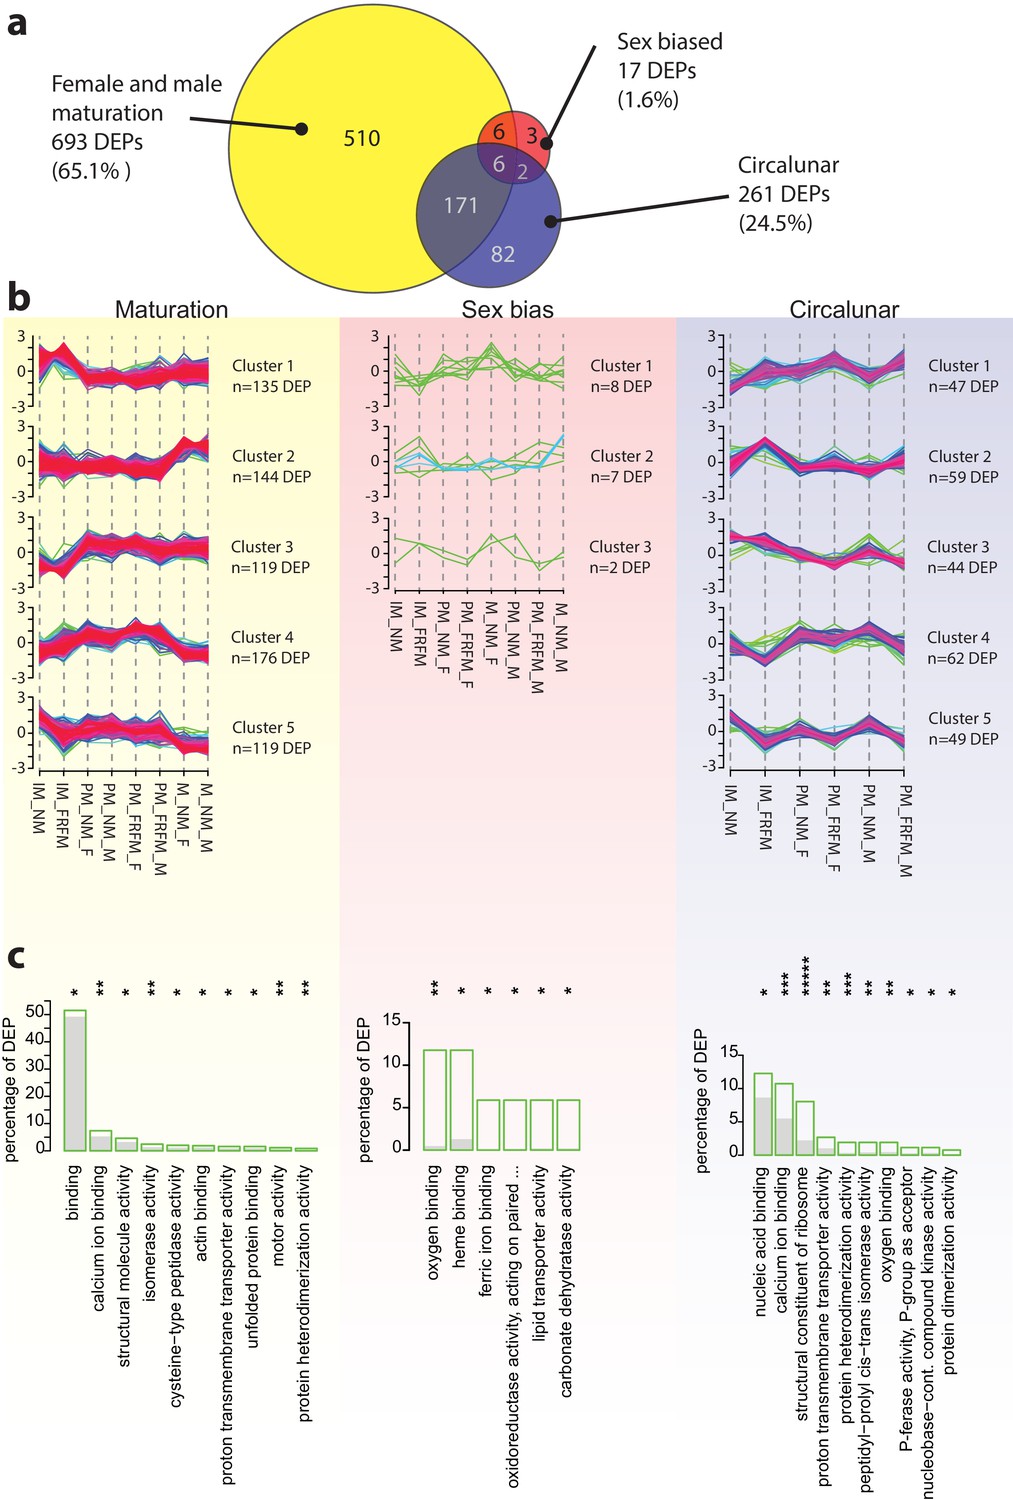
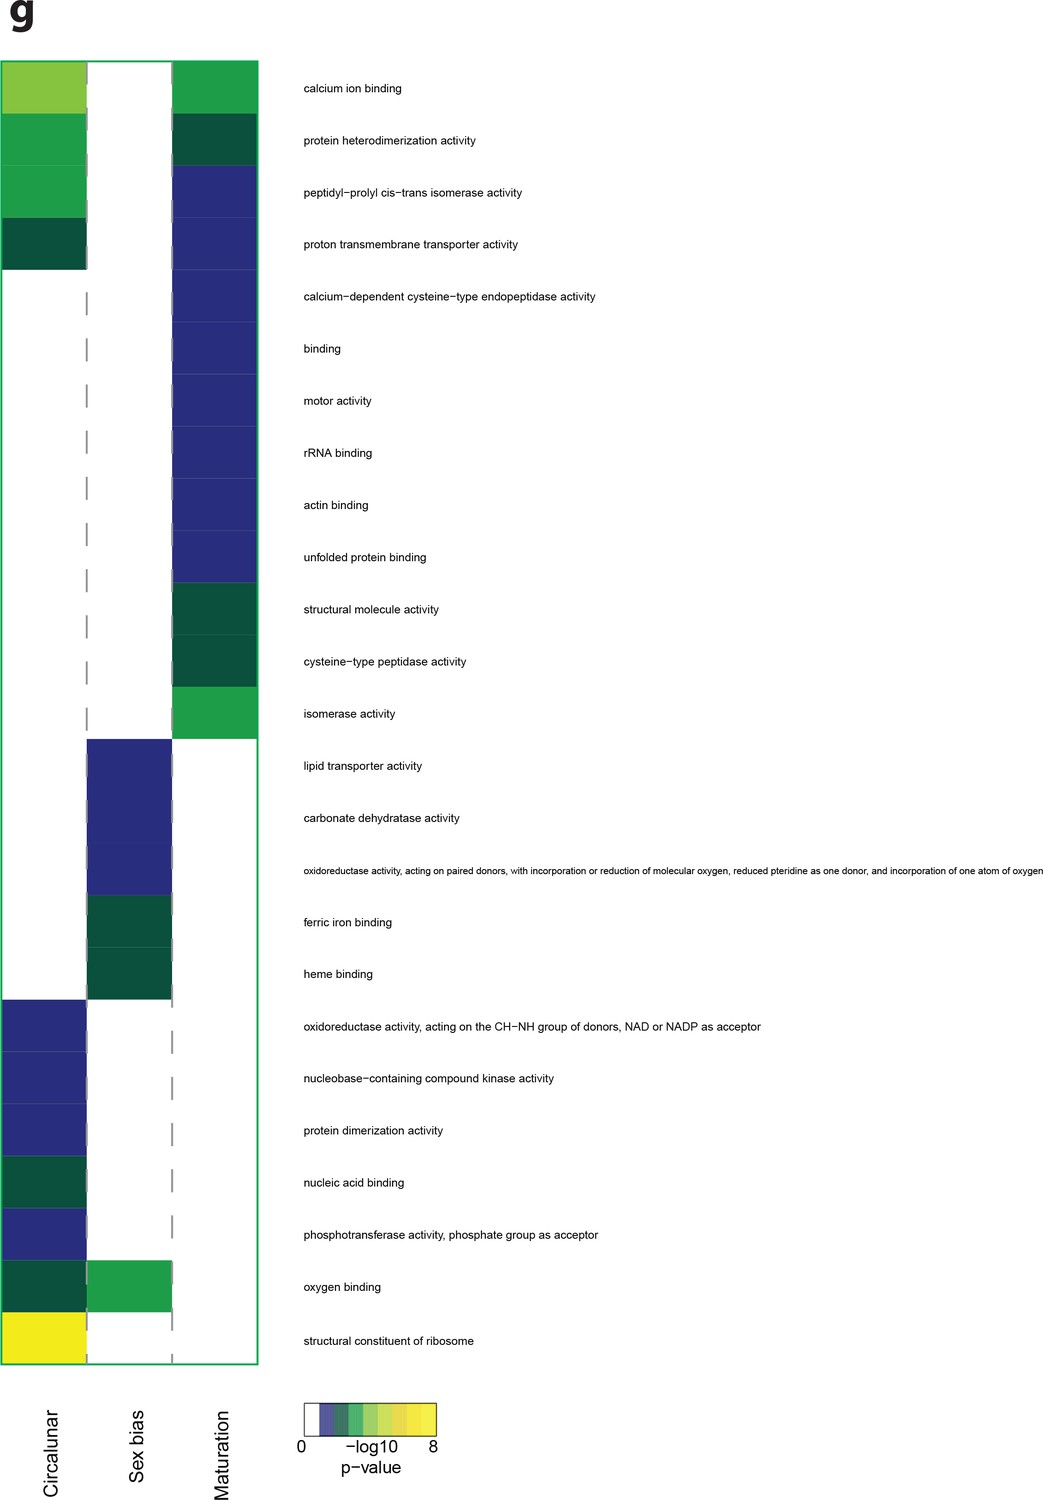
The Platynereis head proteome is differentially affected by maturation, sex and circalunar phase.
(a) Venn diagram showing the proteins significantly regulated within and across the three different biological processes in the three major comparisons made (brackets indicate respective fraction of total comparable proteins) (b) Soft clustering of differentially expressed proteins using the Mfuzz algorithm. The expression data for maturation and circalunar phase are best represented by five and for sexually dimorphic protein expression by three clusters. Compare to Figure 3b for similar dynamics in the regulated transcript clusters. (c) GO-term enrichment analysis using the GOStats package on the differentially expressed proteins in each comparison showing the ten most abundant terms in the Molecular Function category (further GO-term analyses: see Figure 5—figure supplement 2–6). Green boxes show the percentage of differentially expressed proteins for each term; the grey bars depict the expected amount of proteins per category. Maturation: binding: GO:0005488, calcium ion binding: GO:0005509, structural molecule activity: GO:0005198, isomerase activity: GO:0016853, cysteine-type peptidase activity: GO:0008234, actin binding: GO:0003779, proton transmembrane transporter activity: GO:0015078, unfolded protein binding: GO:0051082, motor activity, GO:0003774, protein heterodimerization activity, GO:0046982. Sex bias: oxygen binding: GO:0019825, heme binding: GO:0020037, ferric iron binding: GO:0008199, oxidoreductase activity, acting on paired donors, with incorporation or reduction of molecular oxygen, reduced pteridine as one donor, and incorporation of one atom of oxygen (oxidoreductase activity, acting on paired...): GO:0016714, lipid transporter activity: GO:0005319, carbonate dehydratase activity: GO:0004089. Circalunar phase: nucleic acid binding: GO:0003676, calcium ion binding: GO:0005509, structural constituent of ribosome: GO:0003735, proton transmembrane transporter activity: GO:0015078, protein heterodimerization activity: GO:0046982, peptidyl-prolyl cis-trans isomerase activity: GO:0003755, oxygen binding: GO:0019825, phosphotransferase activity, phosphate group as acceptor: GO:0016776, nucleobase-containing compound kinase activity: GO:0019205, protein dimerization activity: GO:0046983. Statistical significance was tested with a hypergeometric test implemented in the GOStats package. *p < 0.05, **p < 0.01, ***p < 0.001, *****p < 0.00001.
-
Figure 5—source data 1
Labelled proteomics: detected proteins and intensities, filtered and unfiltered.
Table contataining protein intensities and calculation of the normalised intensities for both, all 2,290 detected proteins and the BR and TR filtered final list containing 1,064 proteins used for DEP prediction. Used for DEP graphs.
- https://doi.org/10.7554/eLife.41556.050
-
Figure 5—source data 2
Platynereis head reference proteome v4 gene universe.
Table containing the "gene universe" for the Prot_v4 used as background for GO-term enrichment analysis in Figs. 5 and S6a-g.
- https://doi.org/10.7554/eLife.41556.051
-
Figure 5—source data 3
Proteome comparison: all over- and under-represented GO-Terms labelled proteomics.
Table containing the over-and under-represented GO-terms using all 2,290 proteins deteced in the labelled proteome dataset. GO-terms are shown with their respective p-values, ontology (Molecular Function, Biological Process, Cellular Compartment), and test direction, i.e. over- or under-represented.
- https://doi.org/10.7554/eLife.41556.052
-
Figure 5—source data 4
Proteome comparison: all over- and under-represented GO-Terms unlabelled proteomics.
Table containing the over-and under-represented GO-terms using all 3,847 proteins deteced in the unlabelled proteome dataset. GO-terms are shown with their respective p-values, ontology (Molecular Function, Biological Process, Cellular Compartment), and test direction, i.e. over- or under-represented.
- https://doi.org/10.7554/eLife.41556.053
-
Figure 5—source data 5
Proteome comparision: over- and under-represented GO-Terms shared between labelled and unlabelled proteomics.
Table containing the over-and under-represented GO-terms shared between the labelled 2,290 proteins and the unlabelled 3,847 proteins sets. GO-terms are shown with p-values, actual counts, expected counts, number of IDs per category for both set, respectively; as well as ontology (Molecular Function, Biological Process, Cellular Compartment).
- https://doi.org/10.7554/eLife.41556.054
-
Figure 5—source data 6
Proteome: ROTS results.
This file contains the ROTS predicted DEPs for all 14 comparision made. Each comparison is contained within a separate tab.
- https://doi.org/10.7554/eLife.41556.055
-
Figure 5—source data 7
Proteome: LIMMA results.
This file contains the LIMMA predicted DEPs for all 14 comparision made. Each comparison is contained within a separate tab.
- https://doi.org/10.7554/eLife.41556.056
-
Figure 5—source data 8
Proteome: ROTS-LIMMA rank sum files.
This file contains the ROTS-LIMMA rank sums for predicted DEPs for all 14 comparision made plus the all maturation rank sum predictions. Each comparison is contained within a separate tab.
- https://doi.org/10.7554/eLife.41556.057
-
Figure 5—source data 9
Proteome: Mfuzz cluster protein IDs with cluster membership values.
This file contains the soft clustering output of protein expression values with Mfuzz. Each comparison, maturation, sex, and lunar contains the individual transcript ID and the membership values for each cluster ranging from 0 to 1.
- https://doi.org/10.7554/eLife.41556.058
-
Figure 5—source data 10
Proteome: all over- and under-represented GO-Terms from all comparisions.
Table containing the results of the GO-term analysis on transcript level. Individual GO-terms are shown with their respective p-values in each of the three comparisons (maturation, sex, and lunar), as well as their ontolgy, i.e. Molecular Function, Biological Process, or Cellular Compartment.
- https://doi.org/10.7554/eLife.41556.059
-
Figure 5—source data 11
Proteome: over- and under-represented GO-Terms maturation comparison.
This file contains the over- and under-representet GO-terms for the maturation comparison on protein level. Tabs for each of the three ontologies, i.e. Molecular Function, Biological Process, and Cellular Compartment.
- https://doi.org/10.7554/eLife.41556.060
-
Figure 5—source data 12
Proteome: over- and under-represented GO-Terms sex bias comparison.
This file contains the over- and under-representet GO-terms for the sex comparison on protein level. Tabs for each of the three ontologies, i.e. Molecular Function, Biological Process, and Cellular Compartment.
- https://doi.org/10.7554/eLife.41556.061
-
Figure 5—source data 13
Proteome: over- and under-represented GO-Terms circalunar comparison.
This file contains the over- and under-representet GO-terms for the lunar comparison on protein level. Tabs for each of the three ontologies, i.e. Molecular Function, Biological Process, and Cellular Compartment.
- https://doi.org/10.7554/eLife.41556.062
-
Figure 5—source data 14
Lunar proteome repetion: detected proteins and intensities, filtered and unfiltered.
Table contataining protein intensities and calculation of the normalised intensities for both, all 2,092 detected proteins and the BR and TR filtered final list containing 1,671 proteins used for DEP prediction from the lunar proteome repetion experiment.
- https://doi.org/10.7554/eLife.41556.063
-
Figure 5—source data 15
Lunar proteome repetion: ROTS-LIMMA significant proteins.
This file contains the ROTS-LIMMA rank sums for predicted DEPs for the repeat lunar proteome experiment using only IM sample, containg the 1,671 filtered and analysed proteins.
- https://doi.org/10.7554/eLife.41556.064
-
Figure 5—source data 16
Lunar proteome set1-set2 ovelapping IDs ROTS-LIMMA significant proteins in set1.
This file contains the ROTS-LIMMA rank sums of DEPs predicted as significant in the first proteomics experiment (set1); using only the 1,017 proteins detected in both, the first (set1) and the second experiment (set2) as input data.
- https://doi.org/10.7554/eLife.41556.065
-
Figure 5—source data 17
Lunar proteome set1-set2 ovelapping IDs ROTS-LIMMA significant proteins in set2.
This file contains the ROTS-LIMMA rank sums of DEPs predicted as significant in the second proteomics experiment (set2); using only the 1,017 proteins detected in both, the first (set1) and the second experiment (set2) as input data.
- https://doi.org/10.7554/eLife.41556.066
-
Figure 5—source data 18
Lunar proteome: all ROTS-LIMMA significant proteins with BLASTx annotation.
This file contains all DEPs predicted as significantly circalunar different by either the first, the second, or both proteome experiments. All proteins have also a BLASTx annotions where possible. Positive identification is marked by '+' in the respective column.
- https://doi.org/10.7554/eLife.41556.067
-
Figure 5—source data 19
All proteins significantly regulated during maturation (maturation DEPs).
This file contains the IDs, mean expression values, top hit by blastX with e-value cut-off 10-4, e-value corresponding to blast hit, number of identical/ similar AA or gaps in blast alignment ("identity", "positives", "gaps") for all proteins significantly regulated during maturation.
- https://doi.org/10.7554/eLife.41556.068
-
Figure 5—source data 20
All proteins significantly regulated during sexual differentiation (sex DEPs).
This file contains the IDs, mean expression values, top hit by blastX with e-value cut-off 10-4, e-value corresponding to blast hit, number of identical/ similar AA or gaps in blast alignment ("identity", "positives", "gaps") for all proteins significantly regulated between males and females.
- https://doi.org/10.7554/eLife.41556.069
-
Figure 5—source data 21
All proteins significantly regulated between circalunar phases (lunar DEPs).
This file contains the IDs, mean expression values, top hit by blastX with e-value cut-off 10-4, e-value corresponding to blast hit, number of identical/ similar AA or gaps in blast alignment ("identity", "positives", "gaps") for all proteins significantly regulated between circalunar phases.
- https://doi.org/10.7554/eLife.41556.070
Figure 5—figure supplement 1
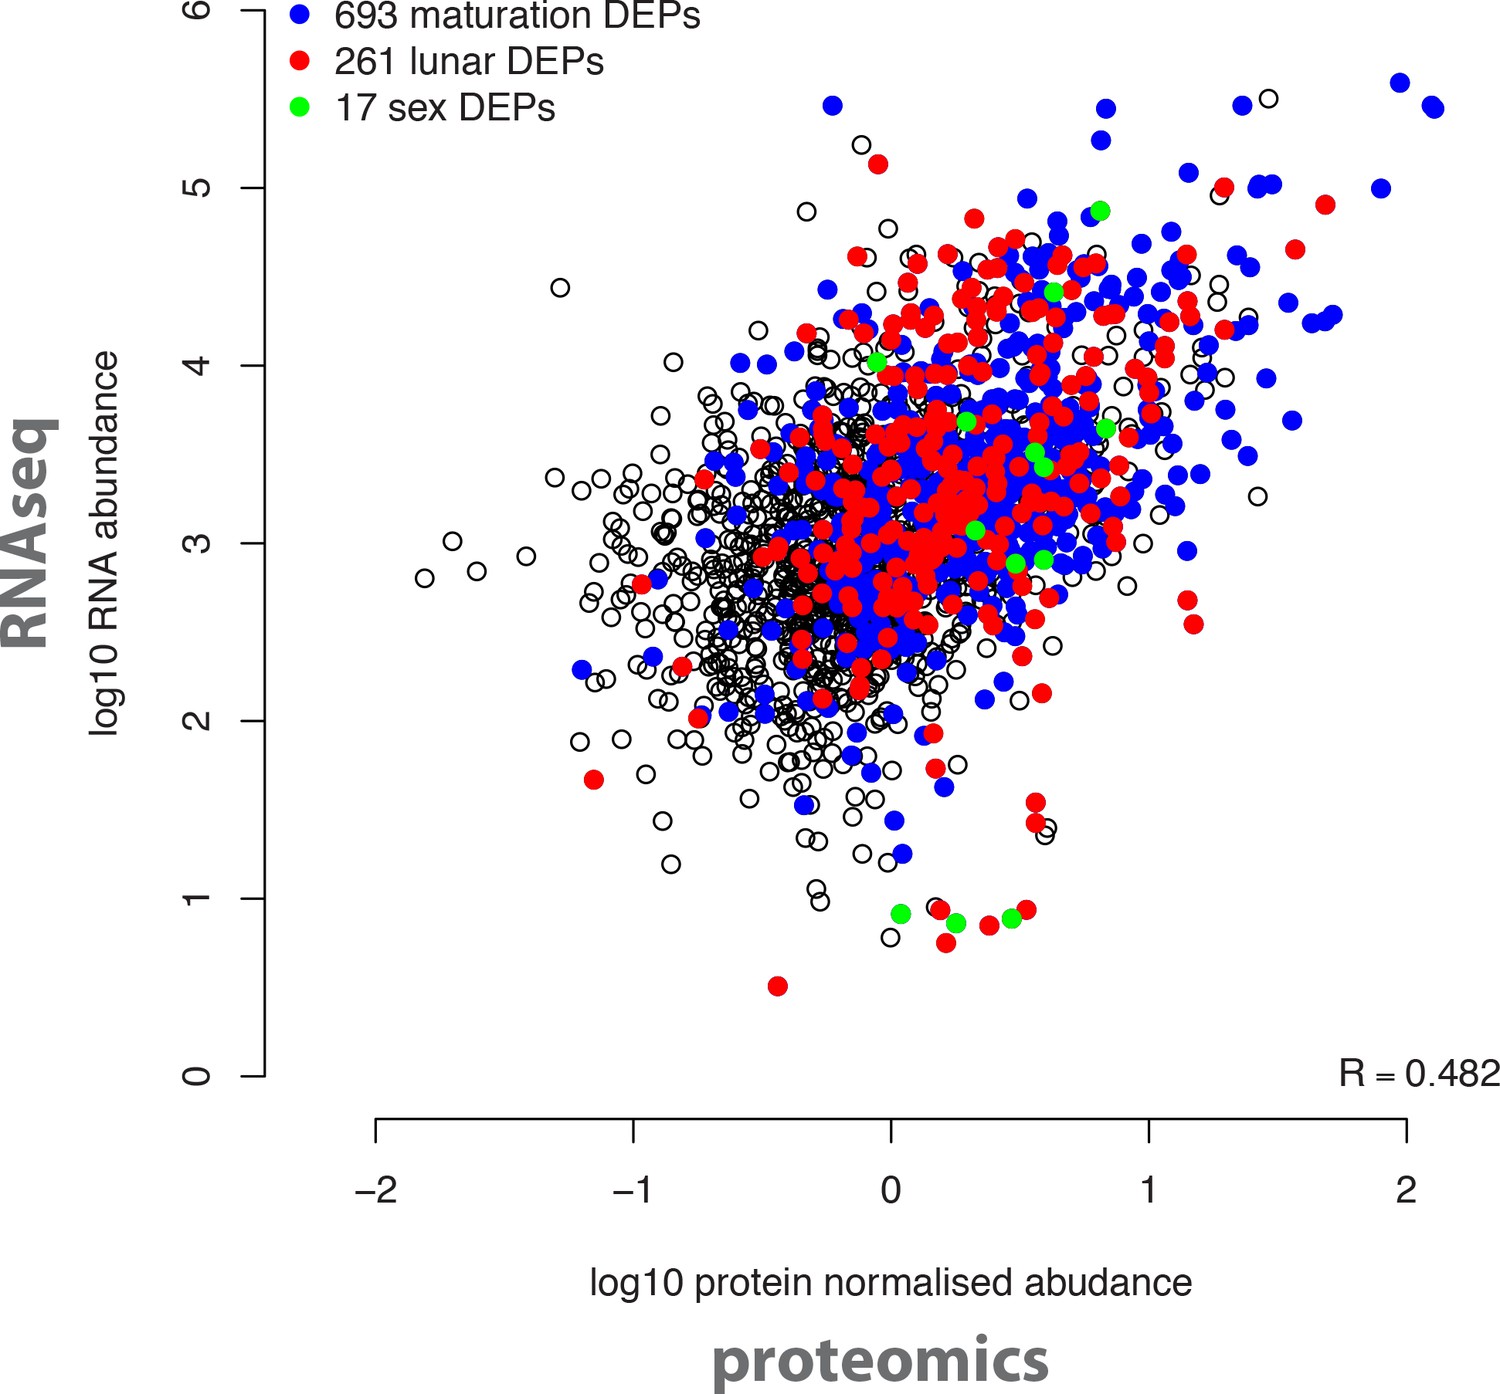
Overall correlation of protein and transcript abundances detected in the same biological samples.
The log10 transformed normalised mean protein abundances of all 2,290 detected proteins (x axis) were correlated with the log10 transformed DESeq-normalised RNA transcript abundances (y axis). Coloured dots correspond to proteins significantly regulated in the indicated analyses (maturation, sex, circalunar).
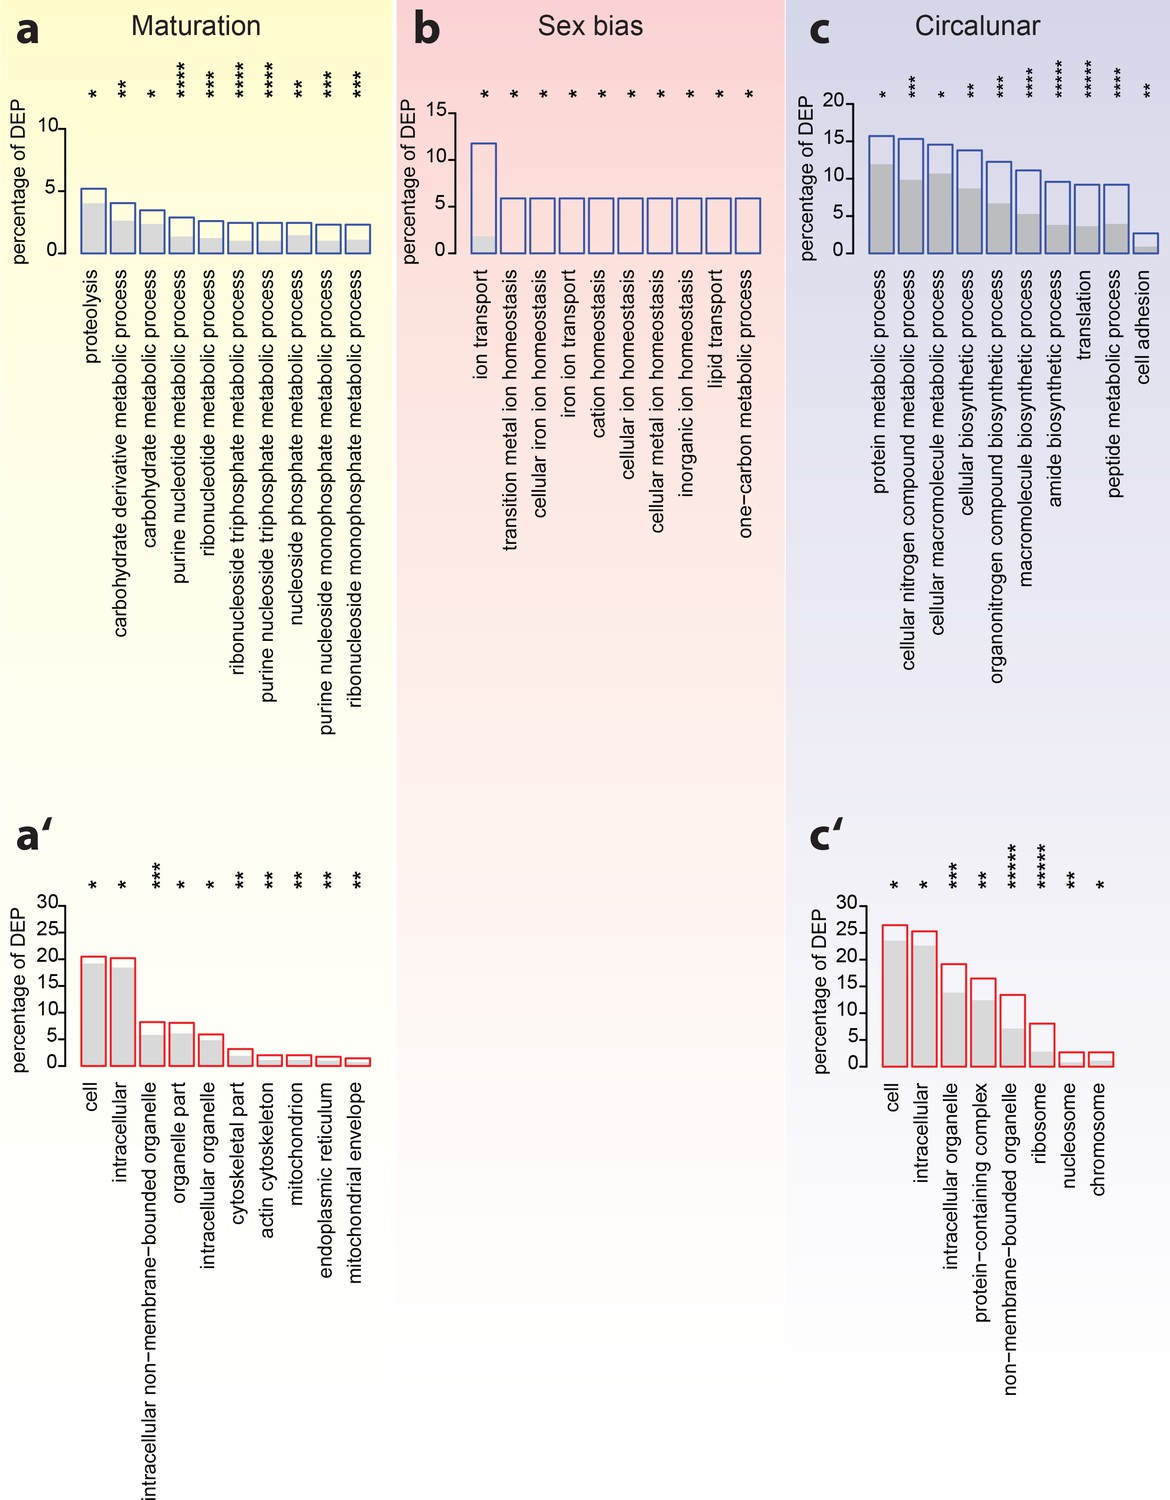
Figure 5—figure supplement 2
Analyses of over-represented GO-terms support the existence of distinct molecular signatures for maturation, sex and circalunar clock phase
GO-term enrichment analyses confirm the distinct regulation of the head proteome during the different tested biological processes. (a–c) The top ten most abundant terms in Biological Process (a,b,c) and Cellular Compartment (a’,c’) categories for DEPs identified by comparison between maturation stages (a,a’), sexes (b) and circalunar phase (c,c’). Blue (a,b,c) or red boxes (a’,c’) show the percentage of differentially expressed proteins for each term; the grey bars depict the expected amount of proteins per category. (a–c) top 10 enriched terms in the Biological Process category; blue boxes: percentage of differentially expressed transcripts for each term; the grey bars: expected numbers of transcripts per category Maturation: proteolysis, GO:0006508, carbohydrate derivative metabolic process: GO:1901135, carbohydrate metabolic process: GO:0005975, purine nucleotide metabolic process: GO:0006163, ribonucleotide metabolic process: GO:0009259, ribonucleoside triphosphate metabolic process: GO:0009199, purine nucleoside triphosphate metabolic process: GO:0009144, nucleoside phosphate metabolic process: GO:0006753, purine nucleoside monophosphate metabolic process: GO:0009126, ribonucleoside monophosphate metabolic process: GO:0009161. Sex bias: ion transport: GO:0006811, transition metal ion homeostasis: GO:0055076, cellular iron ion homeostasis: GO:0006879, iron ion transport, GO:0006826, cation homeostasis: GO:0055080, cellular ion homeostasis: GO:0006873, cellular metal ion homeostasis: GO:0006875, inorganic ion homeostasis: GO:0098771, lipid transport: GO:0006869, one-carbon metabolic process: GO:0006730. Circalunar phase: protein metabolic process: GO:0019538, cellular nitrogen compound metabolic process: GO:0034641, cellular macromolecule metabolic process: GO:0044260, cellular biosynthetic process: GO:0044249, organonitrogen compound biosynthetic process: GO:1901566, macromolecule biosynthetic process: GO:0009059, amide biosynthetic process: GO:0043604, translation: GO:0006412, peptide metabolic process: GO:0006518, cell adhesion: GO:0007155. (a’–c’) In analogy to (a–c), these panels list the top 10 enriched terms in the Cellular Compartment category. Red boxes: percentage of differentially expressed transcripts for each term; the grey bars: expected values of transcripts per category:Maturation: cell: GO:0005623, intracellular: GO:0005622, intracellular non-membrane-bounded organelle: GO:0043232, organelle part: GO:0044422, intracellular organelle: GO:0043229, cytoskeletal part: GO:0044430, actin cytoskeleton: GO:0015629, mitochondrion: GO:0005739, endoplasmic reticulum: GO:0005783, mitochondrial envelope: GO:0005740. Sex bias: no signifcantly enrichted GO-terms at α ≤0.05. Circalunar phase: cell: GO:0005623, intracellular: GO:0005622, intracellular organelle: GO:0043229, protein-containing complex: GO:0032991, non-membrane-bounded organelle: GO:0043228, ribosome: GO:0005840, nucleosome: GO:0000786, chromosome: GO:0005694. Statistical significance was tested with a hypergeometric test implemented in the GOStats package. *p < 0.05, **p < 0.01, ***p < 0.001, ****p < 0.0001, *****p < 0.00001.
Figure 5—figure supplement 3
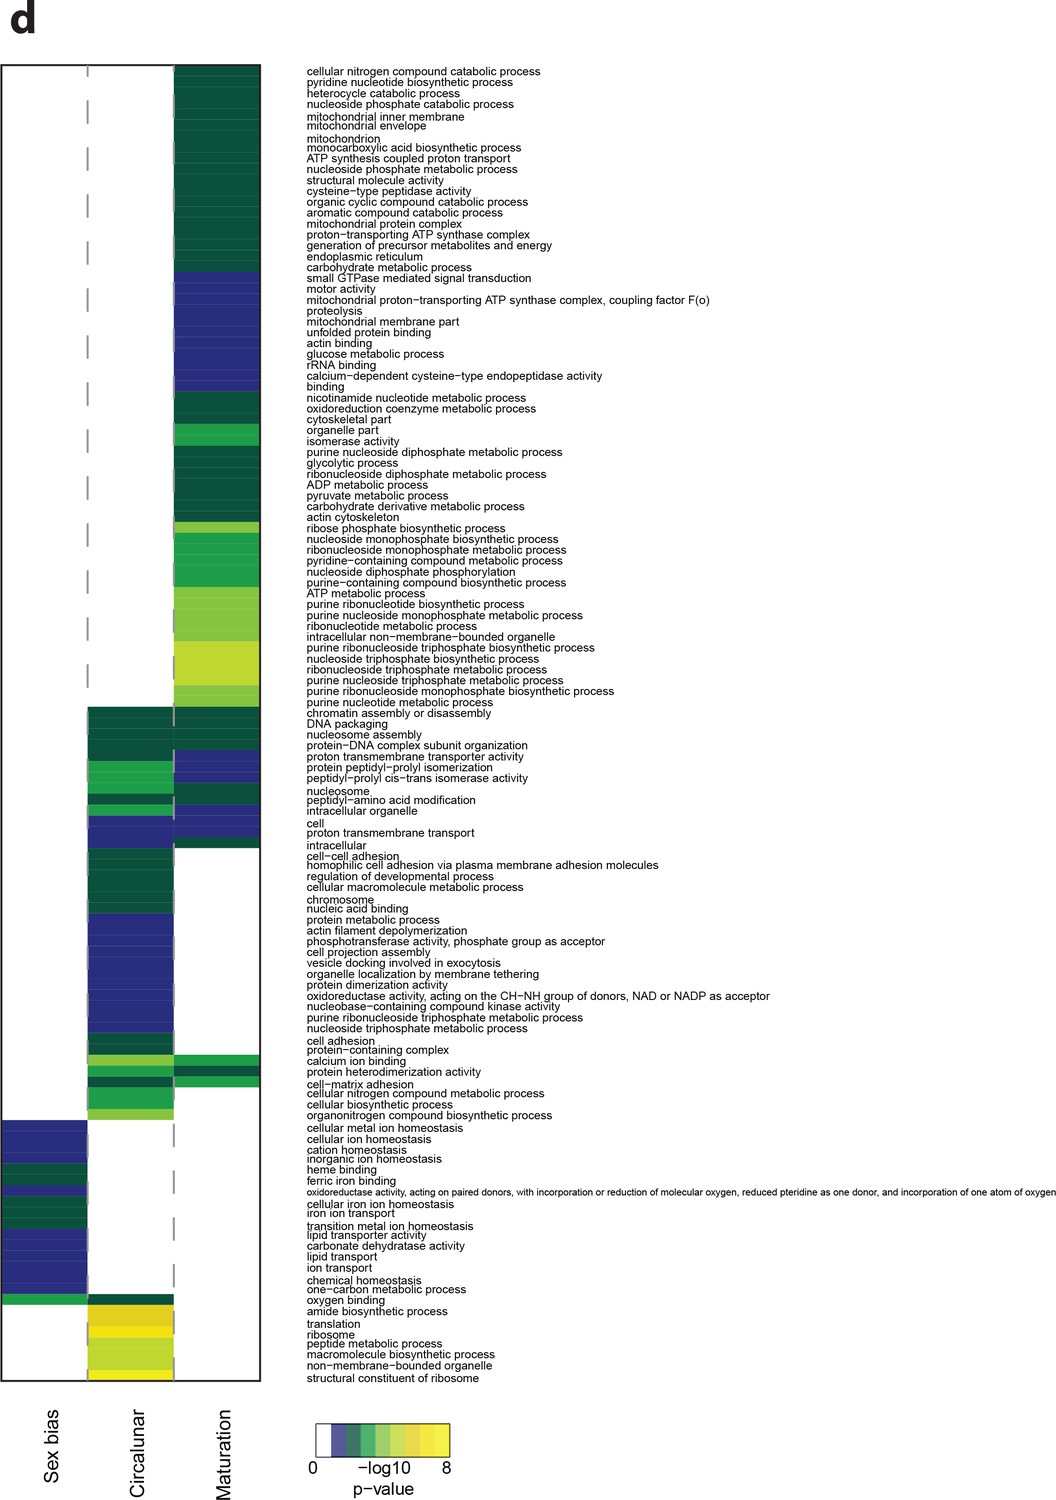
Heat map displaying over-represented GO-terms in all categories.
The heat map is subdivided (columns) by the regulation of each GO-term by circalunar clock phase (left), sex (middle) and/or maturation (right); colours are indicative of the enrichment p-value as calculated by a hypergeometric G test implemented in the GOStats package.
Figure 5—figure supplement 4
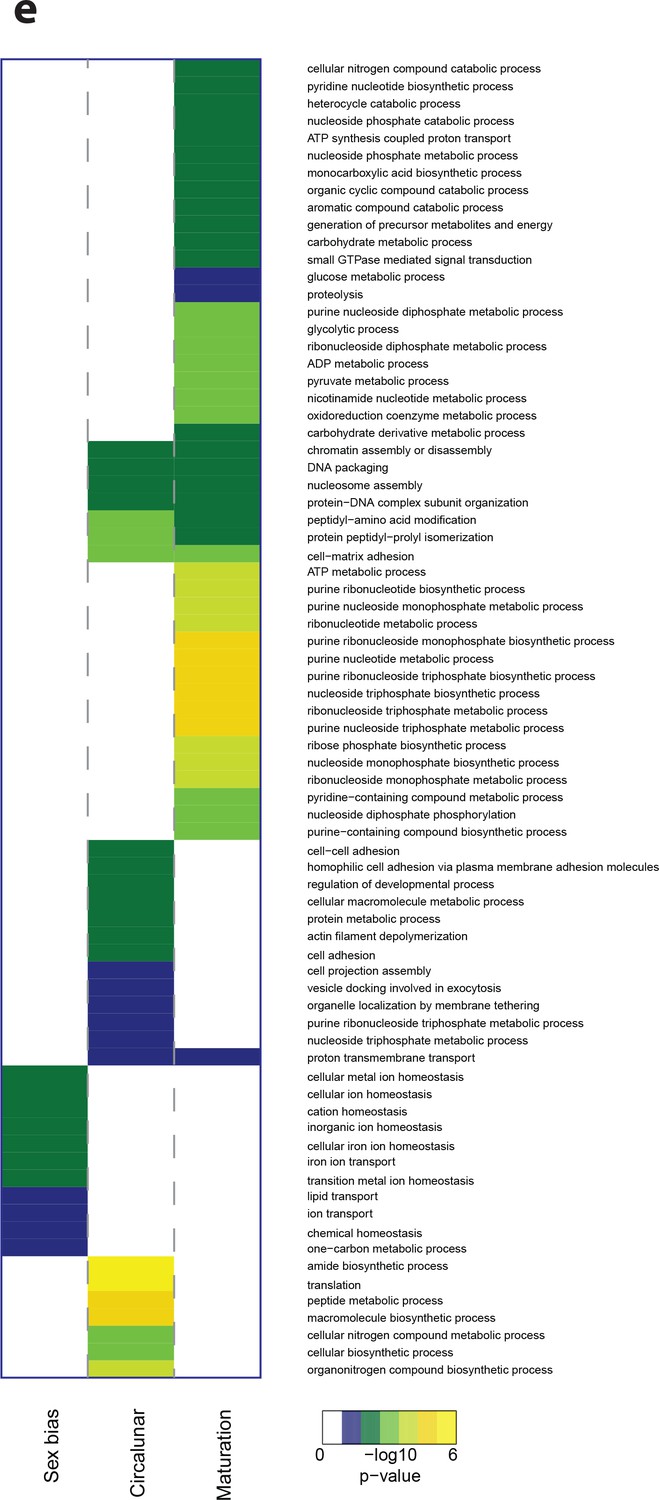
Heat map displaying over-represented GO-terms in the Biological Process Category.
The heat map is subdivided (columns) by the regulation of each GO-term by circalunar clock phase (left), sex (middle) and/or maturation (right); colours are indicative of the enrichment p-value as calculated by a hypergeometric test implemented in the GOStats package.
Figure 5—figure supplement 5
Heat map displaying over-represented GO-terms in the Cellular Compartment Category.
The heat map is subdivided (columns) by the regulation of each GO-term by circalunar clock phase (left), sex (middle) and/or maturation (right); colours are indicative of the enrichment p-value as calculated by a hypergeometric test implemented in the GOStats package.
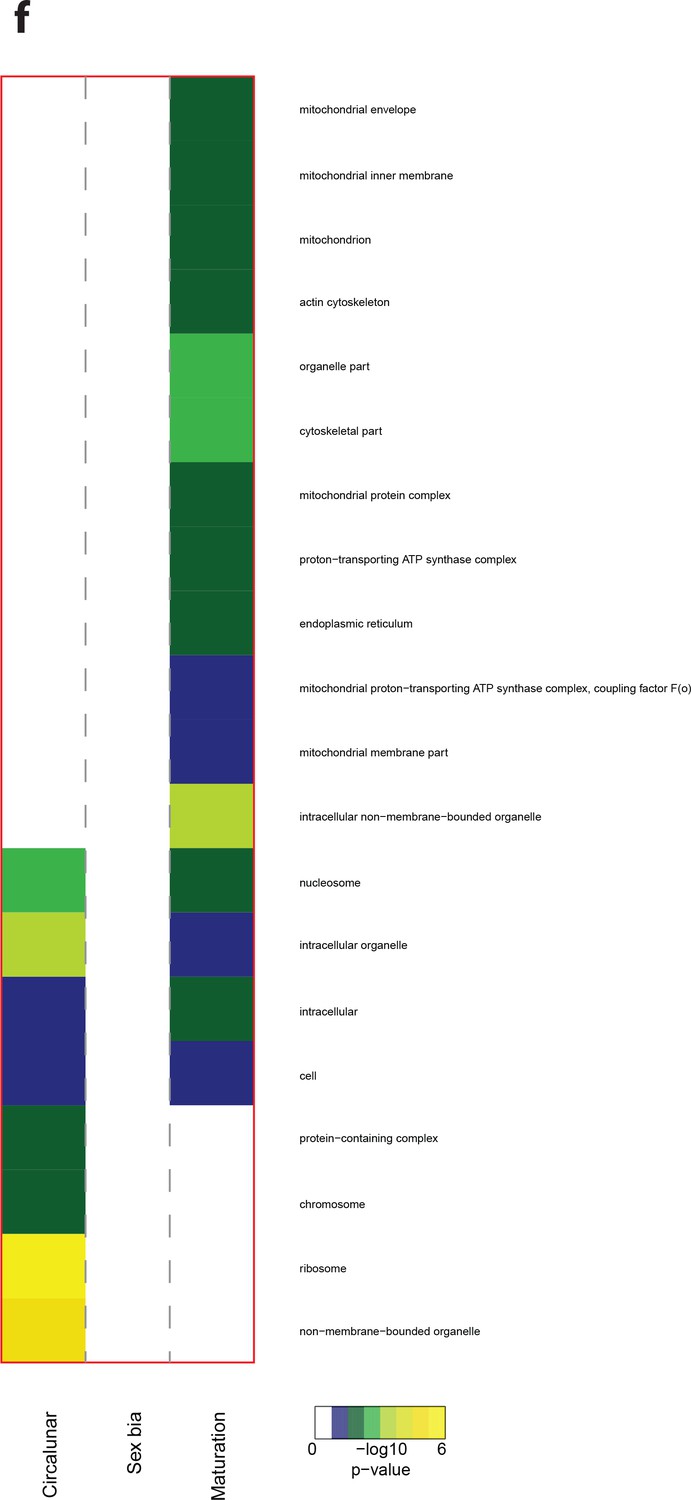
Figure 5—figure supplement 6
Heat map displaying over-represented GO-terms in the Cellular Compartment Category.
The heat map is subdivided (columns) by the regulation of each GO-term by circalunar clock phase (left), sex (middle) and/or maturation (right); colours are indicative of the enrichment p-value as calculated by a hypergeometric test implemented in the GOStats package.
Figure 5—figure supplement 7

The normalisation procedure applied to the raw protein abundance values leads to evenly spread and centred abundance profiles.
(a) Raw intensity values for each of the proteome measurements, excluding missing data. (b) corresponding abundance values after normalisation. Annotations on the x axis in (b) also correspond to the respective columns in (a). Yellow: NM samples BR1, orange: NM samples BR2, red: NM samples BR3, dark blue: FRFM samples BR1, blue: FRFM samples BR2, light blue: FRFM samples BR3. Suffices TMT_XYZ denote the label, used for labelling the respective sample, that is TMT126 is labelled with a tandem mass tag with the reporter mass of 126 Da.
Figure 6 with 2 supplements
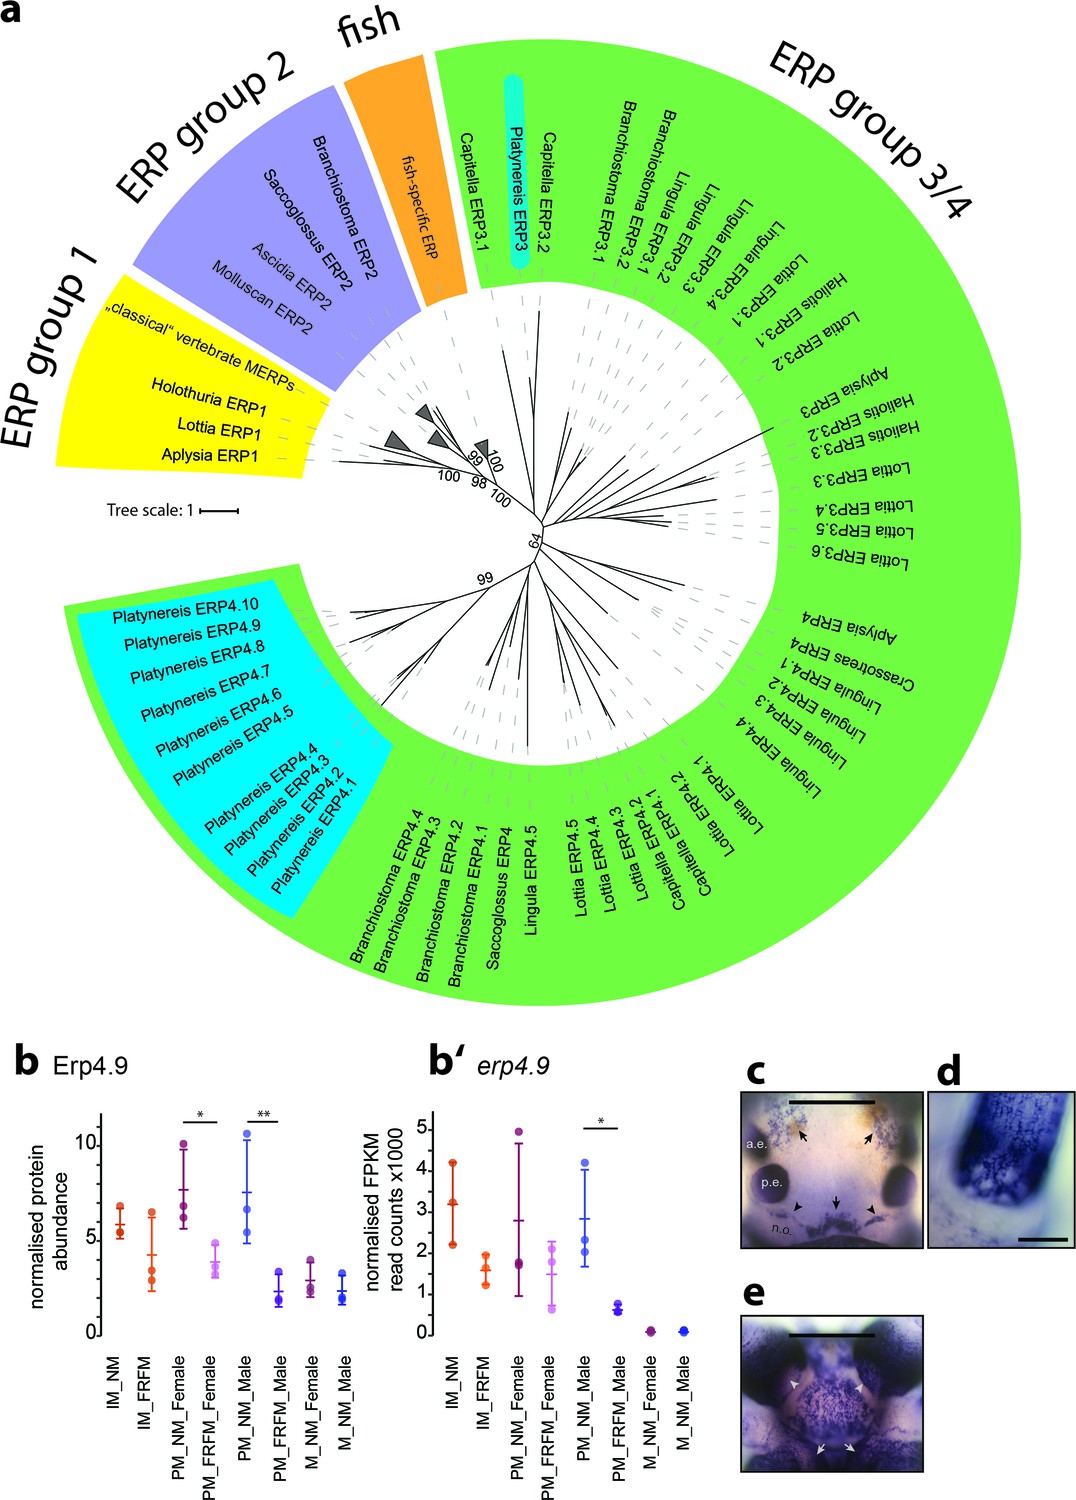
Members of a lineage-specific expansion of Ependymin-related proteins are subject to circalunar regulation on RNA and protein level.
(a) Unrooted maximum likelihood phyolgenetic tree of Ependymin-related proteins based on the analysis published by Suárez-Castillo and García-Arrarás, 2007 including eleven of 15 Platynereis Ependymin-related proteins (ERP4.1–4.10; ERP3; blue boxes) and various additional invertebrate Ependymin sequences. The phylogeny reveals four distinct groups of Ependymin-related proteins (ERP) that are termed ERP1, ERP2, ERP3/4 and fish-specific ERPs; group-specific expansions of ERPs is observed at several places in the phylogeny. All identified Platynereis Ependymins (blue) fall into the ERP3/4 clade. A full tree with un-collapsed nodes, the alignment, NCBI accession numbers and the Platynereis sequence identifiers are provided in Figure 6—figure supplement 1 and Figure 6—source datas 1 and 2. (b,b’) Protein and RNA-Seq expression profiles validate Platynereis ERP4.9 as a new target of circalunar phase on RNA and protein level. (b) Normalised protein expression profile; (b’) DESeq2 normalised RNA expression profile. The graphs show the arithmetic mean with standard deviation, together with individual data points. (c–e) RNA expression pattern of erp4.9 in immature adult Platynereis heads. a.e.: anterior eye; p.e.: posterior eye; n.o.: nuchal organ. (c) Dorsal view, anterior to the top. Characteristic expression is observed around the dorsal blood vessel (central arrow), anterior of the nuchal organ (arrowheads) and next to the anterior eyes (arrows). Scale bar: 250 µm. (d) Dorsal view of the base of a prostomial cirrus, scale bar: 50 µm. (e) Ventral view, anterior to the top. Expression is observed in a plate-like structure at the bottom of the head, as well as around the mouth opening (arrows) and the palps (arrow heads). Scale bar: 250 µm. For additional circalunar-regulated ERPs see Figure 6—figure supplement 2 and Figure 5—source datas 16 and 17.
-
Figure 6—source data 1
Ependymins alignment.
Fasta-file containing the ependymin protein alignement; used for the ERP trees in Figs. 6 and Figure 6-figure supplement 1.
- https://doi.org/10.7554/eLife.41556.074
-
Figure 6—source data 2
Ependymins alignment sequence IDs/accession numbers.
Table containing the TS_v5 IDs for the Platynereis Ependymins as well as the NCBI IDs for the other ERPs.
- https://doi.org/10.7554/eLife.41556.075
Figure 6—figure supplement 1

Maximum likelihood phylogeny of Ependymin-related proteins using the same alignment and settings as in Figure 6a.
For better visibility, the tree is shown as rooted at the split between ERP group one and ERP group 2. Platynereis sequences are labelled with a systematic nomenclature following the apparent phylogeny, all other entries are labelled with genus_and Accession-Number. For cases in which translated (tr) genomic regions were initially used, two accession numbers are given.
Figure 6—figure supplement 2
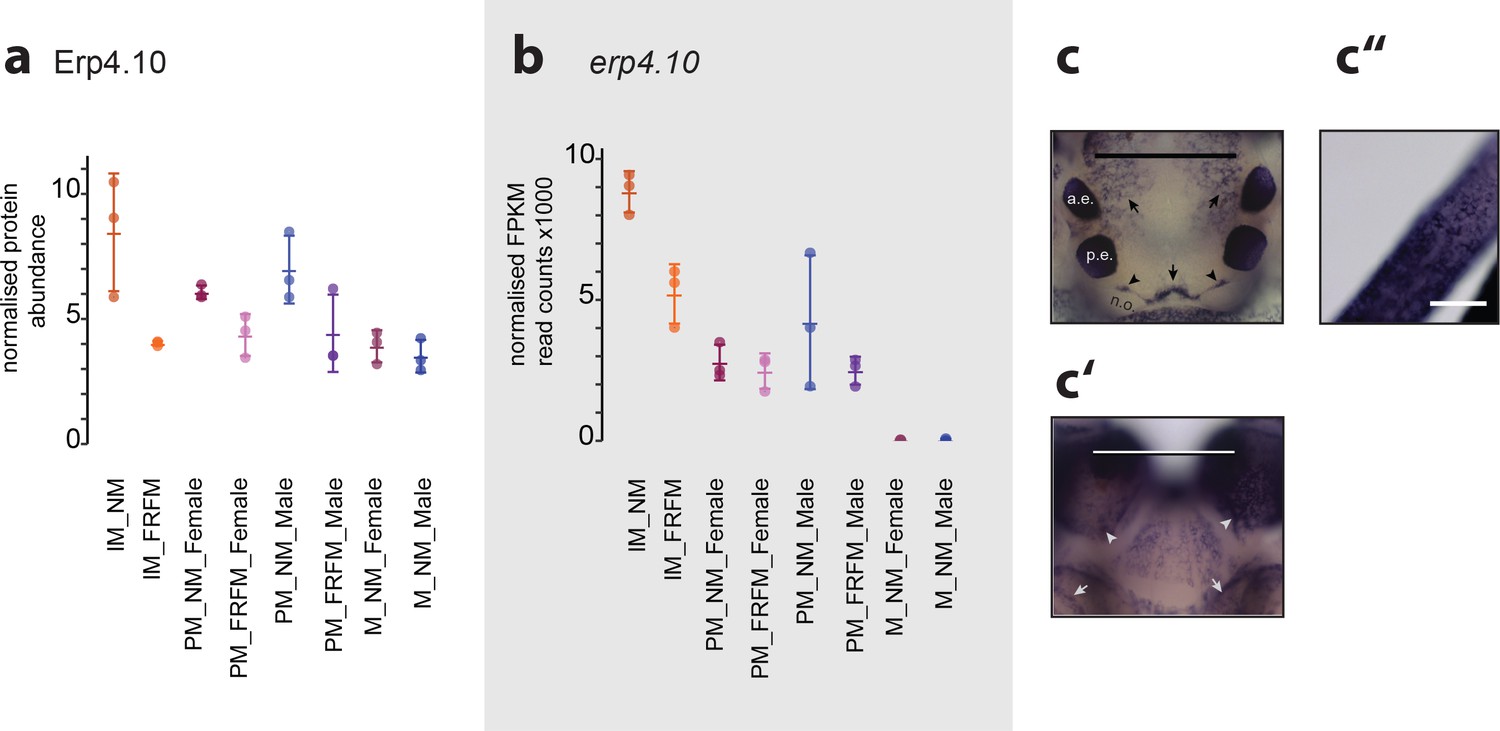
ERP4.10 is regulated in both protein and RNA expression by circalunar phase.
(a,b) Normalised values for abundance of ERP4.10 on protein (a) and RNASeq (b) level. (c–c’’) Results of a whole mount in-situ hybridisation on immature Platynereis heads. a.e.: anterior adult eye; p.e.: posterior adult eye; n.o.: nuchal organ. (c) Dorsal view, anterior to the top. Characteristic expression is observed around the dorsal blood vessel (central arrow), anterior of the nuchal organ (arrow heads) and next to the anterior adult eyes (arrows). Scale bar: 250 µm. (c’) Ventral view, anterior to the top. Expression is observed in a plate-like structure at the bottom of the head. Scale bar: 250 µm. (c’’) Dorsal view of cirrus; Scale bar: 50 µm.
Figure 7 with 1 supplement
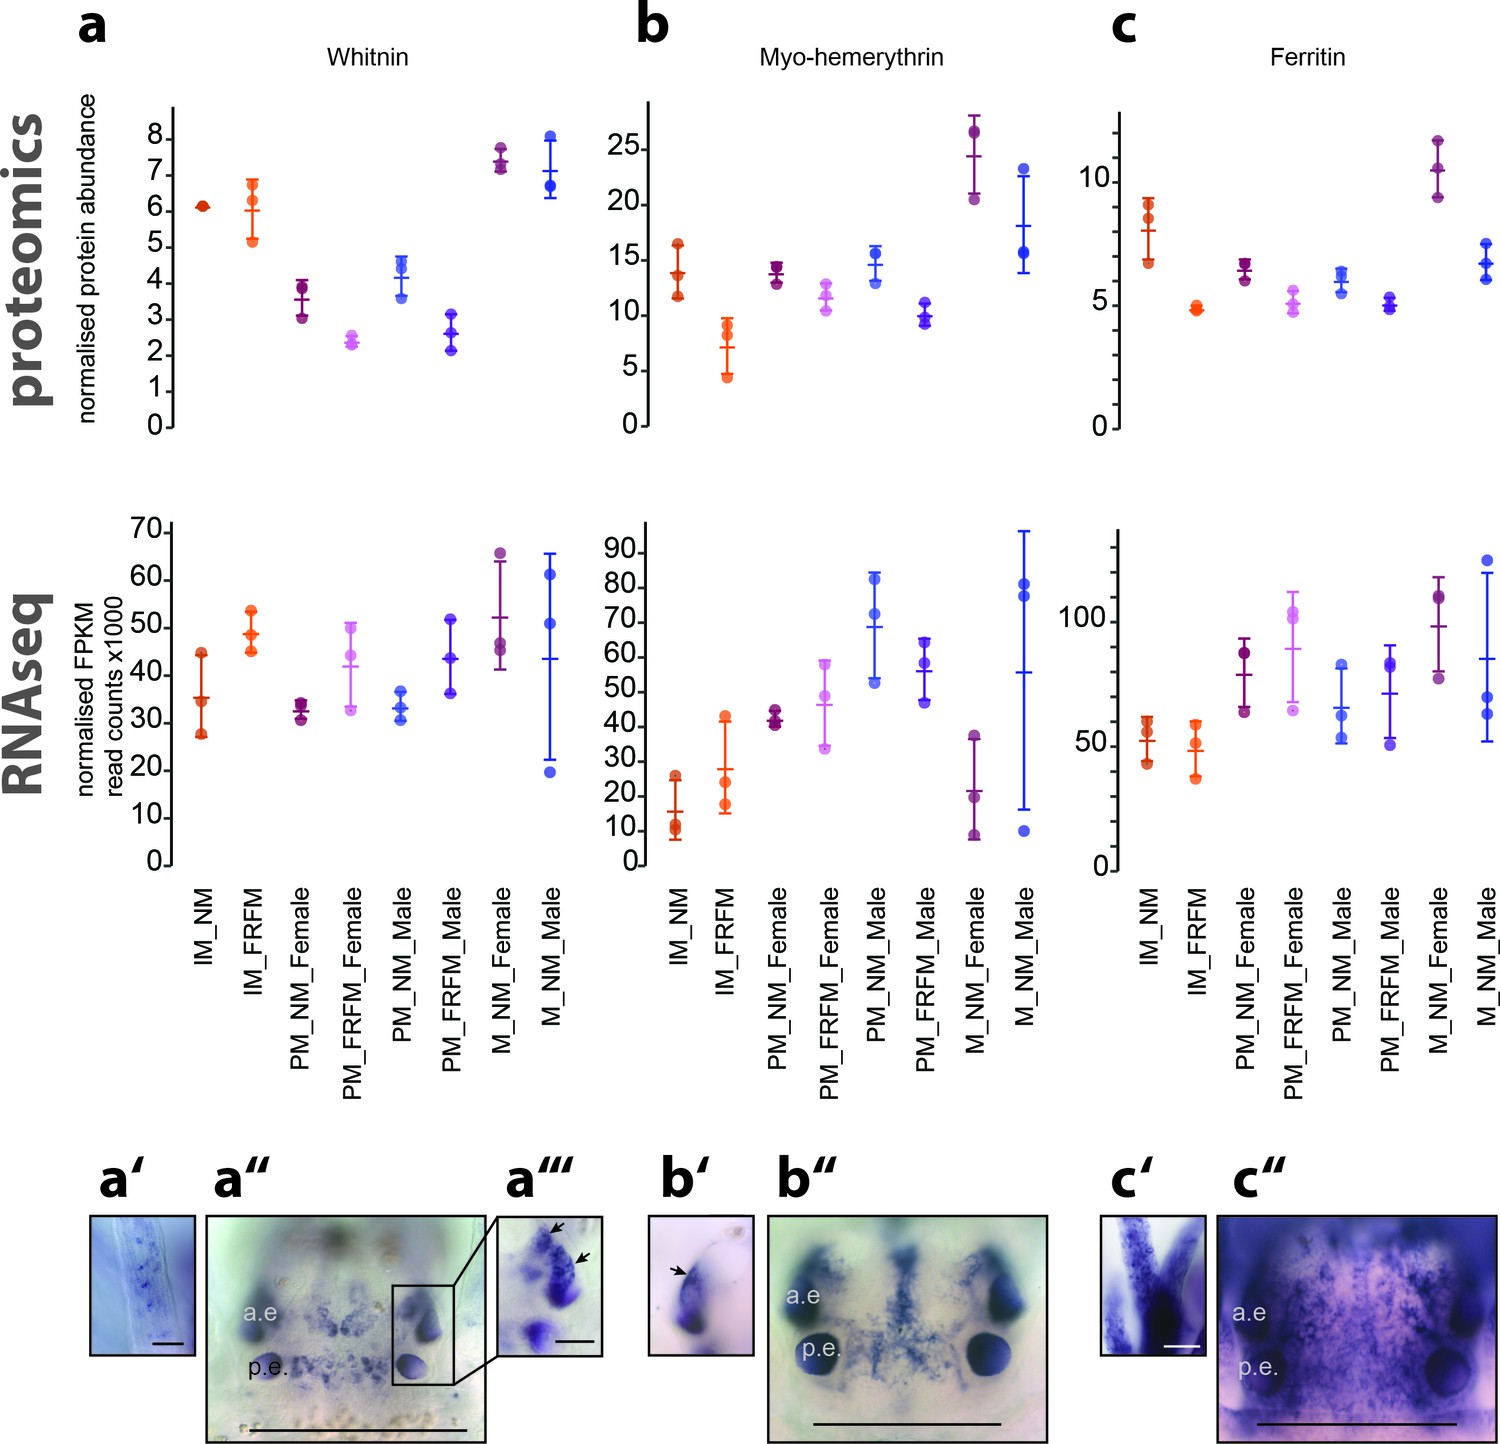
Proteome analyses reveal additional molecular markers for circalunar phase with distinct expression profiles and proposed functions.
(a–a’’’) The neuropeptide Whitnin, a’- peristomeal cirrus, a’’- head, a’’’- indicted head expression in a’’ with different focus. (b–b’’) The oxygen storage protein Haemerythrin, b’’- head, b’- lateral head aspects below the focal plane of b’’. (c–c’’) The iron storage protein Ferritin. c’- peristomeal cirrus (a–c) compares the normalised protein expression profiles (top, ‘proteomics’) with the corresponding DESeq2 normalised mRNA expression profile (bottom, ‘RNA-Seq’). All graphs show the arithmetic mean with standard deviation, and the individual data points. (a’–c’’) Expression domains as characterised by whole-mount in situ hybridisation; (a’’,b’’,c’’) dorsal views of immature Platynereis heads stained with riboprobes of the corresponding transcript; All images are oriented with the anterior side to the top; scale bar: 250 µm. a.e.: anterior eye, p.e.: posterior eye.
-
Figure 7—source data 1
Whinin-Proctolin alignment.
Fasta-file containing the Whitnin-Proctolin protein alignement; used for the tree in Figure 7-figure supplement 1.
- https://doi.org/10.7554/eLife.41556.078
-
Figure 7—source data 2
Whitnin-Proctolin alignment sequence IDs/accession numbers.
Table containing the TS_v5 IDs for the Platynereis Whitnin as well as the NCBI IDs for the Whitnin/Protolins used in file Figure 7-figure supplement 1.
- https://doi.org/10.7554/eLife.41556.079
Figure 7—figure supplement 1
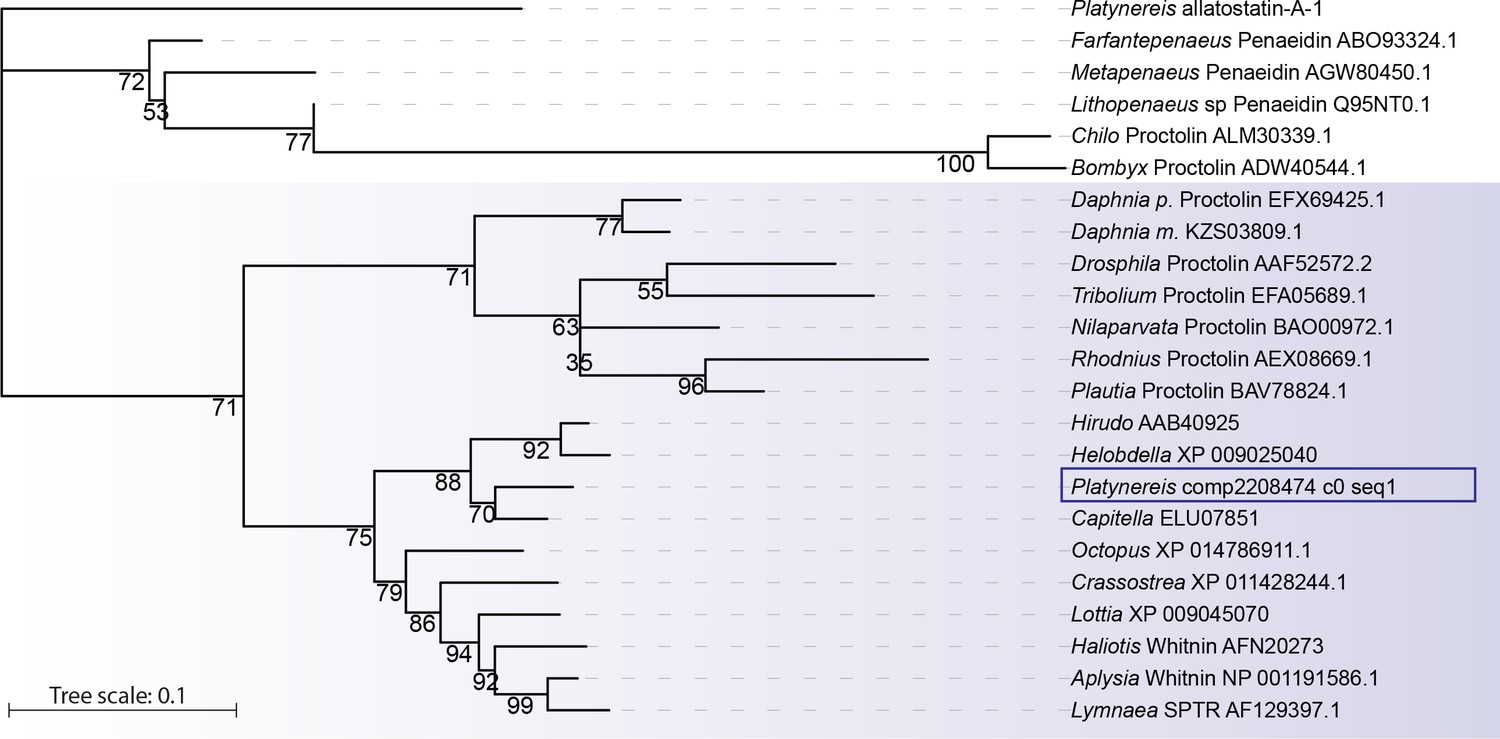
Platynereis Whitnin is part of a Proctolin/Whitnin family of neuropeptides.
Maximum likelihood phylogeny of Proctolin/Whitnin family, see Figure 7—source datas 1 and 2 for alignment and Accession numbers.
Tables
Key resources table
| Reagent type (species) or resource | Designation | Source or reference | Identifiers | Additional information |
|---|---|---|---|---|
| Strain, strain background (Platynereis dumerilii, immature) | IM_NM; IM_FRFM | MFPL Fish and Marine Facility | NA | NA |
| Strain, strain background (Platynereis dumerilii, Female) | PM_NM_F; PM_FRFM_F; M_NM_F | MFPL Fish and Marine Facility | NA | NA |
| Strain, strain background (Platynereis dumerilii, Male) | PM_NM_M; PM_FRFM_M; M_NM_M | MFPL Fish and Marine Facility | NA | NA |
| Recombinant DNA reagent | pJet1.2 (plasmid) | Thermo Scientific | Thermo Scientific: K1232 | |
| Sequence-based reagent | primers see Supplementary file 2 | this study | qPCR primers were designed exon-intron spanning using the Roche Universal probe library homepage (see Materials and methods section for details). Primers for cloning were designed based on sequences derived from the transcriptome assembly, the amplicon was aimed to be in the coding region of the transcript where possible, amplicons generally had a length between 500 bp and 2,000 bp. | |
| Commercial assay or kit | RNeasy kit | Qiagen | Qiagen: 74106 | |
| Commercial assay or kit | RNase-free DNase | Qiagen | Qiagen: 79254 | |
| Commercial assay or kit | Dynabeads mRNA-purification kit | Invitrogen | Invitrogen: 61006 | |
| Commercial assay or kit | RNA fragmentation kit | Ambion | Ambion: AM8740 | |
| Commercial assay or kit | SuperScript VILO Kit | Invitrogen | Invitrogen: 11754050 | |
| Commercial assay or kit | Mini Quick Spin DNA Columns | Roche | Roche: 11814419001 | |
| Commercial assay or kit | E. coli DNA Polymerase I | Invitrogen | Invitrogen: 18010–025 | |
| Commercial assay or kit | E. coli DNA ligase | Invitrogen | Invitrogen: 18052–019 | |
| Commercial assay or kit | RNase H | Promega | Promega: M4281 | |
| Commercial assay or kit | 5X second strand buffer | Invitrogen | Invitrogen: 10812–014 | |
| Commercial assay or kit | MiniElute Reaction clean-up kit | Qiagen | Qiagen: 28004 | |
| Software, algorithm | Fastqc | https://www.bioinformatics.babraham.ac.uk/projects/fastqc/ | NA | NA |
| Software, algorithm | Cutadapt | https://doi.org/10.14806/ej.17.1.200 | NA | NA |
| Software, algorithm | NextGenMap | http://cibiv.github.io/NextGenMap/ | NA | NA |
| Software, algorithm | Trinity | https://github.com/trinityrnaseq/trinityrnaseq/wiki | NA | NA |
| Software, algorithm | Cegma | https://doi.org/10.1093/bioinformatics/btm071 | NA | NA |
| Software, algorithm | MUMmer | https://doi.org/10.1002/0471250953.bi1003s00 | NA | NA |
| Software, algorithm | Kraken | https://doi.org/10.1186/gb-2014-15-3-r46 | NA | NA |
| Software, algorithm | bedtools | https://bedtools.readthedocs.io/en/latest/ | NA | NA |
| Software, algorithm | HTSeq | https://doi.org/10.1093/bioinformatics/btu638 | NA | NA |
| Software, algorithm | R | https://www.r-project.org/ | NA | NA |
| Software, algorithm | DESeq2 | Bioconductor | NA | NA |
| Software, algorithm | EdgeR | Bioconductor | NA | NA |
| Software, algorithm | LIMMA | Bioconductor | NA | NA |
| Software, algorithm | ROTS | Bioconductor | NA | NA |
| Software, algorithm | Mfuzz | Bioconductor | NA | NA |
| Software, algorithm | GOstats | Bioconductor | NA | NA |
| Software, algorithm | IQ-TREE | http://www.iqtree.org | NA | NA |
Additional files
-
Supplementary file 1
Table containing the IDs of the 3,847 identified proteins using an unlabelled proteomics approach.
- https://doi.org/10.7554/eLife.41556.080
-
Supplementary file 2
Table showing sequences and melting temperatures for the primers used for qPCR and cloning in ths study, as well as information on the plasmids generated.
- https://doi.org/10.7554/eLife.41556.081
-
Source data 1
Short description of all source files and supplementary files.
- https://doi.org/10.7554/eLife.41556.082
-
Transparent reporting form
- https://doi.org/10.7554/eLife.41556.083
Download links
A two-part list of links to download the article, or parts of the article, in various formats.
Downloads (link to download the article as PDF)
Open citations (links to open the citations from this article in various online reference manager services)
Cite this article (links to download the citations from this article in formats compatible with various reference manager tools)
Combined transcriptome and proteome profiling reveals specific molecular brain signatures for sex, maturation and circalunar clock phase
eLife 8:e41556.
https://doi.org/10.7554/eLife.41556


