Targeted degradation of BRD9 reverses oncogenic gene expression in synovial sarcoma
- Boston Children’s Hospital and Harvard Medical School, United States
- Trinity College Dublin, Ireland
- University of Pennsylvania, United States
- University College Dublin, Ireland
- Radboud University Nijmegen, The Netherlands
- German Cancer Consortium, Germany
- Heidelberg University Hospital, Germany
- National Center for Tumor Diseases Heidelberg and German Cancer Research Center, Germany
- Cold Spring Harbor Laboratory, United States
Figures
Figure 1 with 1 supplement
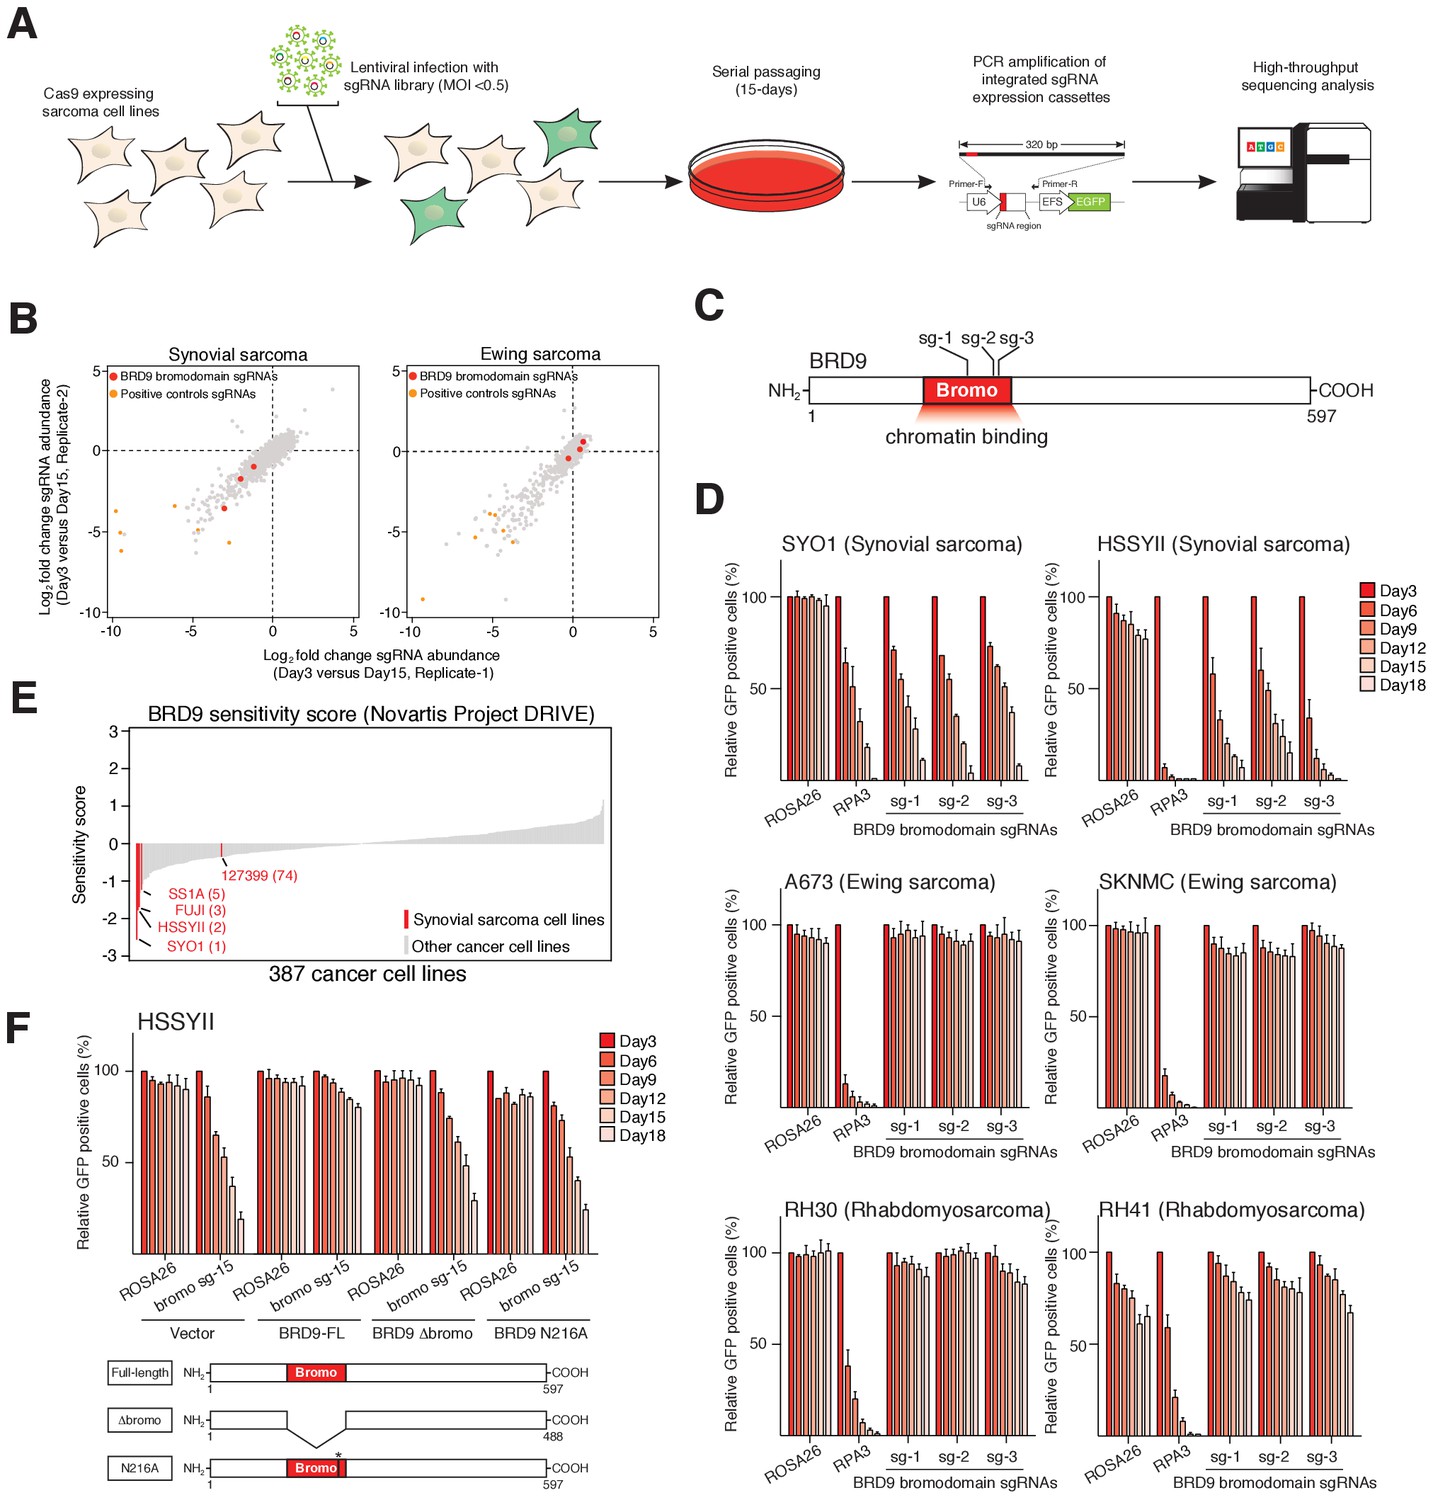
The BRD9 bromodomain is a functional dependency in synovial sarcoma.
(A) Schematic representation of CRISPR/Cas9 based genomic screening approach. (B) Scatter plot representation of biological duplicate sgRNA screening data in synovial and Ewing’s sarcoma cell lines. Each dot denotes an individual sgRNA and axes represent log2 fold-change in sgRNA abundance between day-3 and day-15. BRD9 bromodomain and control sgRNAs are highlighted. (C) Schematic representation of the BRD9 protein structure with sgRNA target sites indicated. (D) Negative selection based CRISPR-Cas9 mutagenesis assays. The relative GFP+ (sgRNA+) subpopulation percentage is depicted at the indicated time-points after lentiviral infection. Mean ± s.d., n = 3. (E Waterfall plot representing ‘BRD9 sensitivity’ score in a panel of cancer cell lines taken from the Project DRIVE database (ref. Lim et al., 1998) (https://oncologynibr.shinyapps.io/drive/). (F) Negative selection based CRISPR-Cas9 mutagenesis assays in bromodomain functional rescue experiments. The relative GFP+ (sgRNA+) subpopulation percentage is depicted at the indicated time-points after lentiviral infection. Mean ± s.d., n = 3.
-
Figure 1—source data 1
Sequencing read counts and fold-change values for individual sgRNAs in library experiments in HSSYII synovial sarcoma cells.
- https://doi.org/10.7554/eLife.41305.004
-
Figure 1—source data 2
Sequencing read counts and fold-change values for individual sgRNAs in library experiments in A673 Ewing sarcoma cells.
- https://doi.org/10.7554/eLife.41305.005
-
Figure 1—source data 3
Relative GFP positive percentages in negative selection sgRNA assays in six independent pediatric sarcoma cell lines.
- https://doi.org/10.7554/eLife.41305.006
-
Figure 1—source data 4
Relative GFP positive percentages in negative selection sgRNA assays in BRD9-FL, BRD9-Dbromo or BRD9-N216A rescue experiments performed in HSSYII cells.
- https://doi.org/10.7554/eLife.41305.007
Figure 1—figure supplement 1
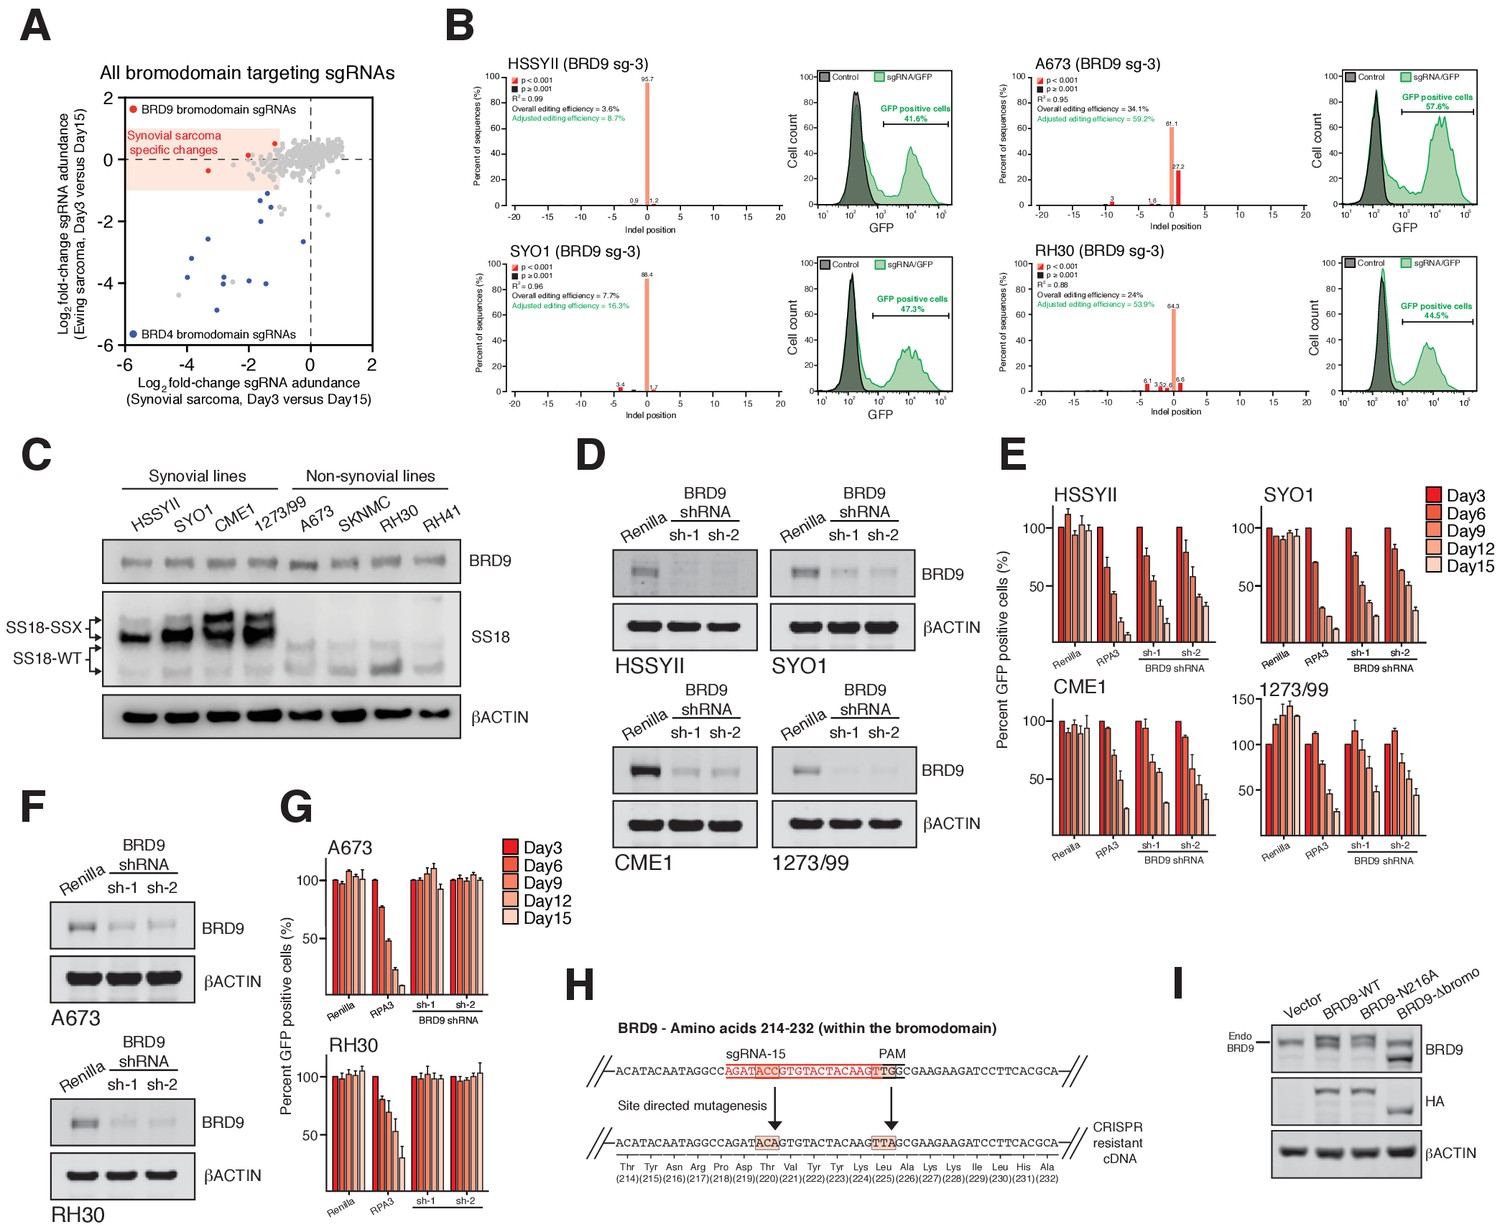
BRD9 is a specific functional dependency in synovial sarcoma.
(A) Scatter plot representation of sgRNA screening data in synovial and Ewing’s sarcoma cell lines. Each dot denotes and individual bromodomain targeting sgRNA and axes represent log2 fold-change in sgRNA abundance between day-3 and day-15. BRD4 and BRD9 bromodomain targeted sgRNAs are indicated. Highlighted region denotes sgRNAs depleted >2 fold in SS cells and unchanged in Ewing sarcoma cells. (B) Indel quantification by TIDE (Tracking of Indels by sequence trace Decomposition) analysis 4 days after transduction with the indicated sgRNA in the indicated cell lines. Also presented are GFP FACs plots collected at time of harvesting, demonstrating the proportion of GFP+ (sgRNA+) cells in each instance. (C) Western blot analysis of the indicated proteins in a cohort of synovial, and non-synovial sarcoma cell lines. (D) Western blot analysis of the indicated proteins in four independent SS cell lines expressing a control shRNA (Renilla) or one of two independent BRD9 targeting shRNAs. (E) Negative selection-based shRNA functional assays in four independent SS cell lines. The relative GFP+ (sgRNA+) subpopulation percentage is depicted at the indicated time points after lentiviral infection. Mean ± s.d., n = 3. (F) Western blots (as in Panel c) in Ewing sarcoma (A673) and rhabdomyosarcoma (RH30) cells lines. (G) Negative selection-based shRNA assays (as in Panel e) in Ewing sarcoma (A673) and rhabdomyosarcoma (RH30) cell lines. (H) Schematic representation of the BRD9 coding region targeted by sgRNA-15. The sgRNA target sequence is highlighted in red and PAM sequence is indicated (top). The silent mutations added to render the allele insensitive to CRISPR/Cas9 targeting are indicated, and sequence of the CRISPR-resistant allele shown (bottom). (I) Western blot analysis of the indicated proteins in HSSYII cells used in function rescue experiments.
Figure 2 with 1 supplement
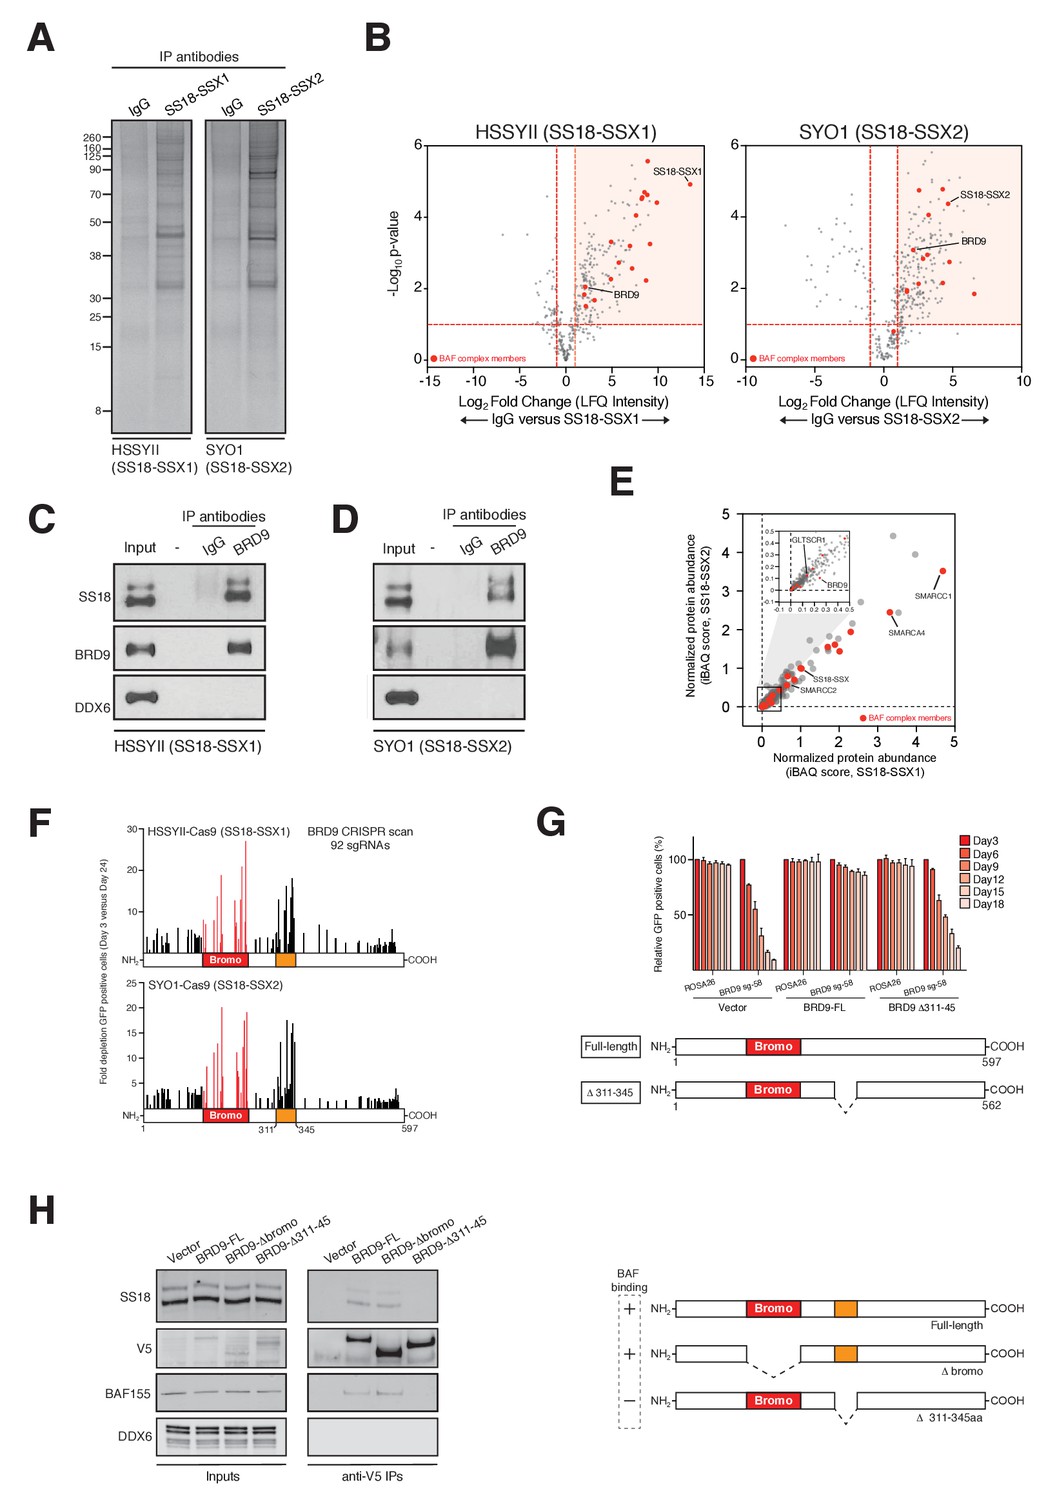
BRD9 functions as part of SS18-SSX containing SWI/SNF complexes.
(A) Silver stains of endogenous SS18-SSX fusion protein immunoprecipitations performed on nuclear protein lysates prepared two independent synovial sarcoma cell lines. (B) Volcano plots representing fold enrichment (LFQ intensity) of proteins identified by mass spec in SS18-SSX1 or SS18-SSX2 purifications relative to IgG control purifications. Known BAF members are indicated in red. (C) Western blots analyses of the indicated proteins performed on endogenous BRD9 or IgG purifications in HSSYII cells (Input = 10% total IP material). (D) Western blots analyses of the indicated proteins performed on endogenous BRD9 or IgG purifications in SYO1 cells (Input = 10% total IP material). (E) Scatter plot representing the normalized protein abundance (IBAQ score) of proteins identified in SS18-SSX1 and SS18-SSX2 purifications. Known BAF members are indicated in red (F) High density sgRNA tiling of BRD9 in two independent SScell lines. Each bar represents the fold-change of an individual sgRNA and its target site along the BRD9 protein. (G) Negative selection based CRISPR-Cas9 mutagenesis assays in amino acid 311–345 region functional rescue experiments. The relative GFP+ (sgRNA+) subpopulation percentage is depicted at the indicated time-points after lentiviral infection. Mean ± s.d., n = 3. (H) Western blot analyses of the indicated proteins in anti-V5 purifications performed in control HSSYII cells, or HSSYII cells expressing a full-length, bromodomain deleted or amino acid 311–345 deleted BRD9.
-
Figure 2—source data 1
Mass spectrometry data from endogenous SS18-SSX1 purifications in HSSYII cells.
- https://doi.org/10.7554/eLife.41305.014
-
Figure 2—source data 2
Mass spectrometry data from endogenous SS18-SSX2 purifications in SYO1 cells.
- https://doi.org/10.7554/eLife.41305.015
-
Figure 2—source data 3
Fold depletion of GFP positive cells in negative selections sgRNA assays in HSSYII and SYO1 cells in BRD9 sgRNA tiling experiments.
- https://doi.org/10.7554/eLife.41305.016
-
Figure 2—source data 4
Relative GFP positive percentages in negative selection sgRNA assays in BRD9-FL, BRD9-D311-345 rescue experiments performed in HSSYII cells.
- https://doi.org/10.7554/eLife.41305.017
Figure 2—figure supplement 1
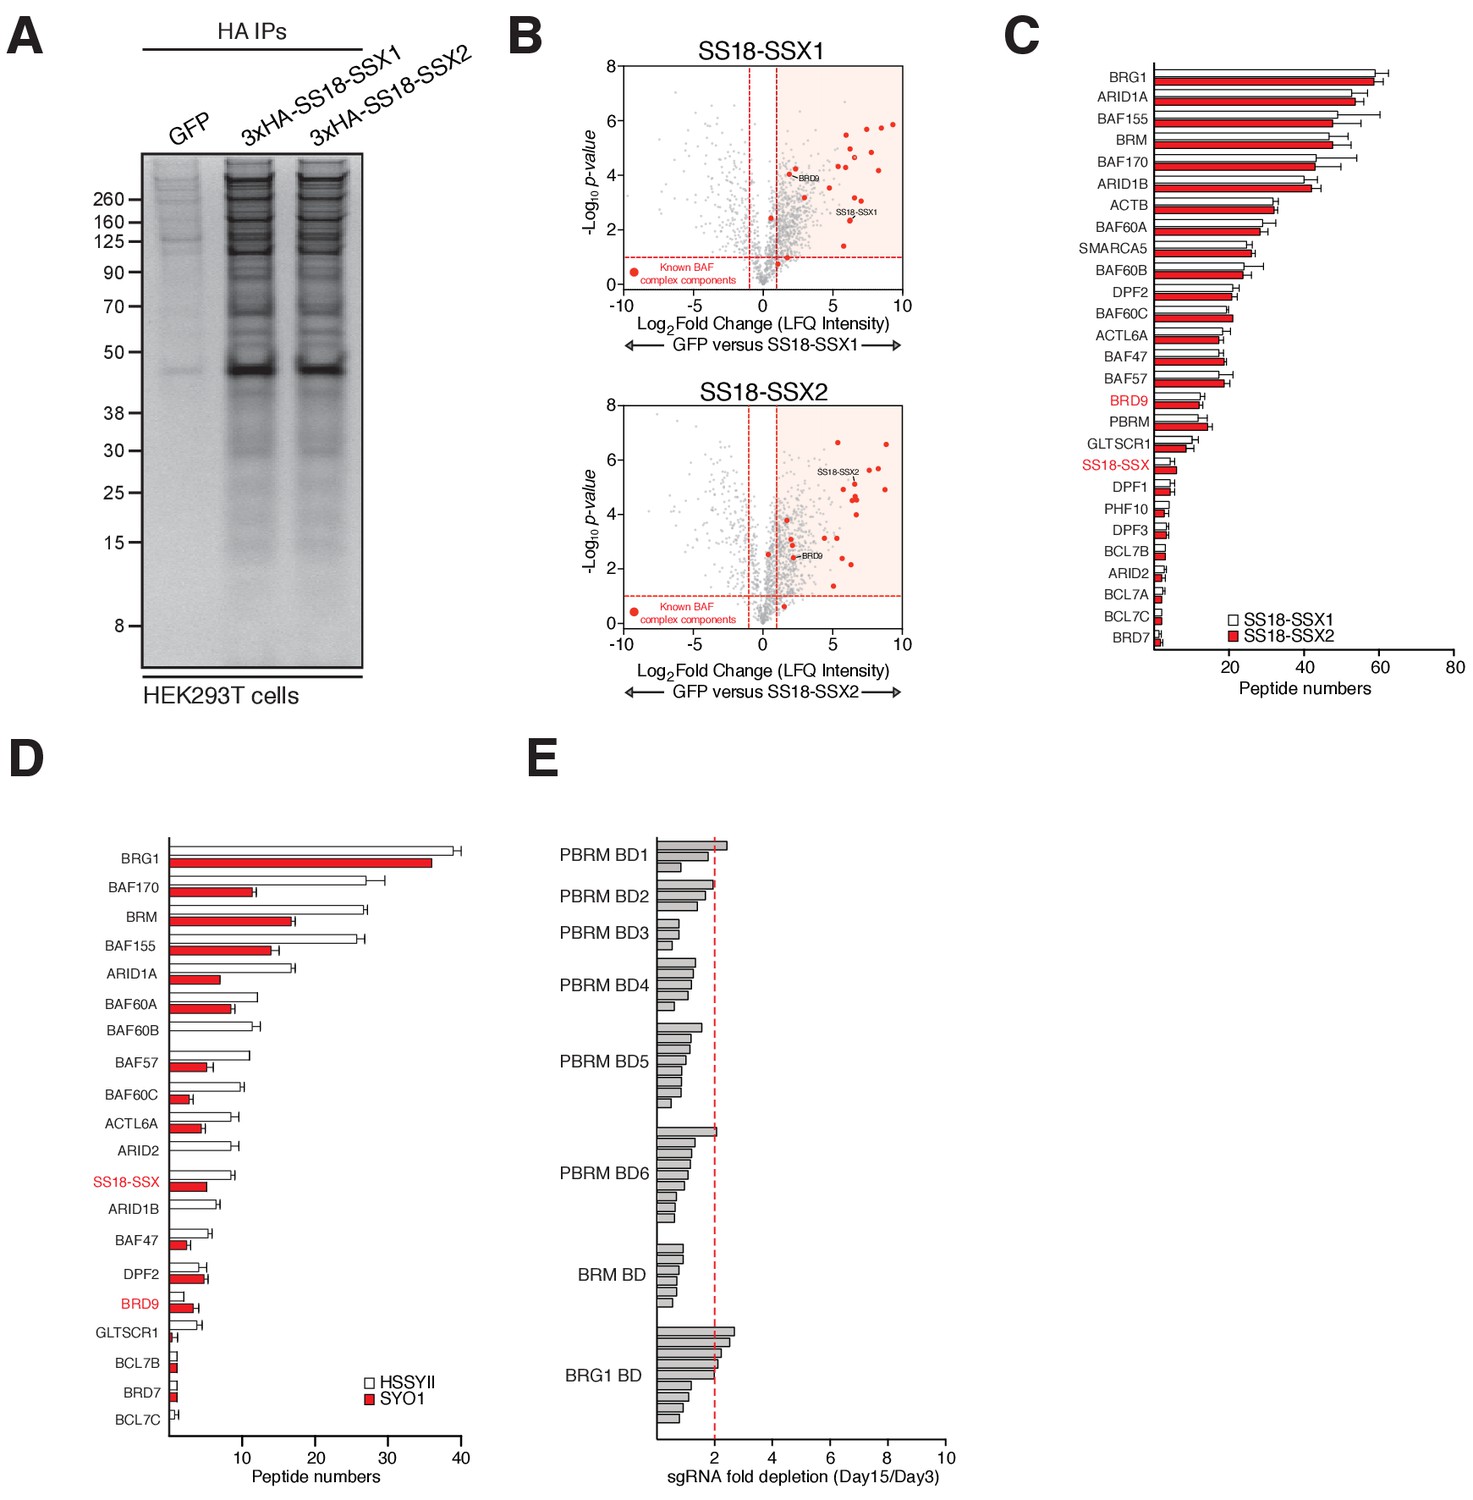
BRD9 is a component of SS18-SSX containing BAF complexes.
(A) Silver stains of anti-HA immunoprecipitations performed on nuclear protein lysates prepared from HEK293T cell lines expression GFP (control) or an SS18-SSX1 or SS18-SSX2 fusion protein. (B) Volcano plots representing fold enrichment (LFQ intensity) of proteins identified by mass spec in anti-HA-SS18-SSX1/2 purifications relative to GFP control purifications. Known BAF members are indicated in red. (C) Bar chart representing total peptide numbers identified for each of the indicated BAF complex members in mass spec analysis of ant-HA-SS18-SSX1/2 purifications. (D) Bar chart representing total peptide numbers identified for each of the indicated BAF complex members in mass spec analysis of endogenous SS18-SSX1/2 purifications. (E) Bar chart representing the fold-change in abundance of individual sgRNAs targeting the bromodomains of the indicated BAF members between day-15 and day-3 of our functional genomics screening experiments.
-
Figure 2—figure supplement 1—source data 1
Mass spectrometry data from SS18-SSX1 purifications in HEK293T cells.
- https://doi.org/10.7554/eLife.41305.010
-
Figure 2—figure supplement 1—source data 2
Mass spectrometry data from SS18-SSX2 purifications in HEK293T cells.
- https://doi.org/10.7554/eLife.41305.011
-
Figure 2—figure supplement 1—source data 3
Presented is the number of peptides mapping to each of the indicated BAF complex members in purifications of HA-tagged SS18-SSX1 and SS18-SSX2 expressed in HEK293T cells.
- https://doi.org/10.7554/eLife.41305.012
-
Figure 2—figure supplement 1—source data 4
Presented is the number of peptides mapping to each of the indicated BAF complex members in purifications of endogenous SS18-SSX1 and SS18-SSX2 expressed in HSSYII and SYO1 cells.
- https://doi.org/10.7554/eLife.41305.013
Figure 3 with 1 supplement
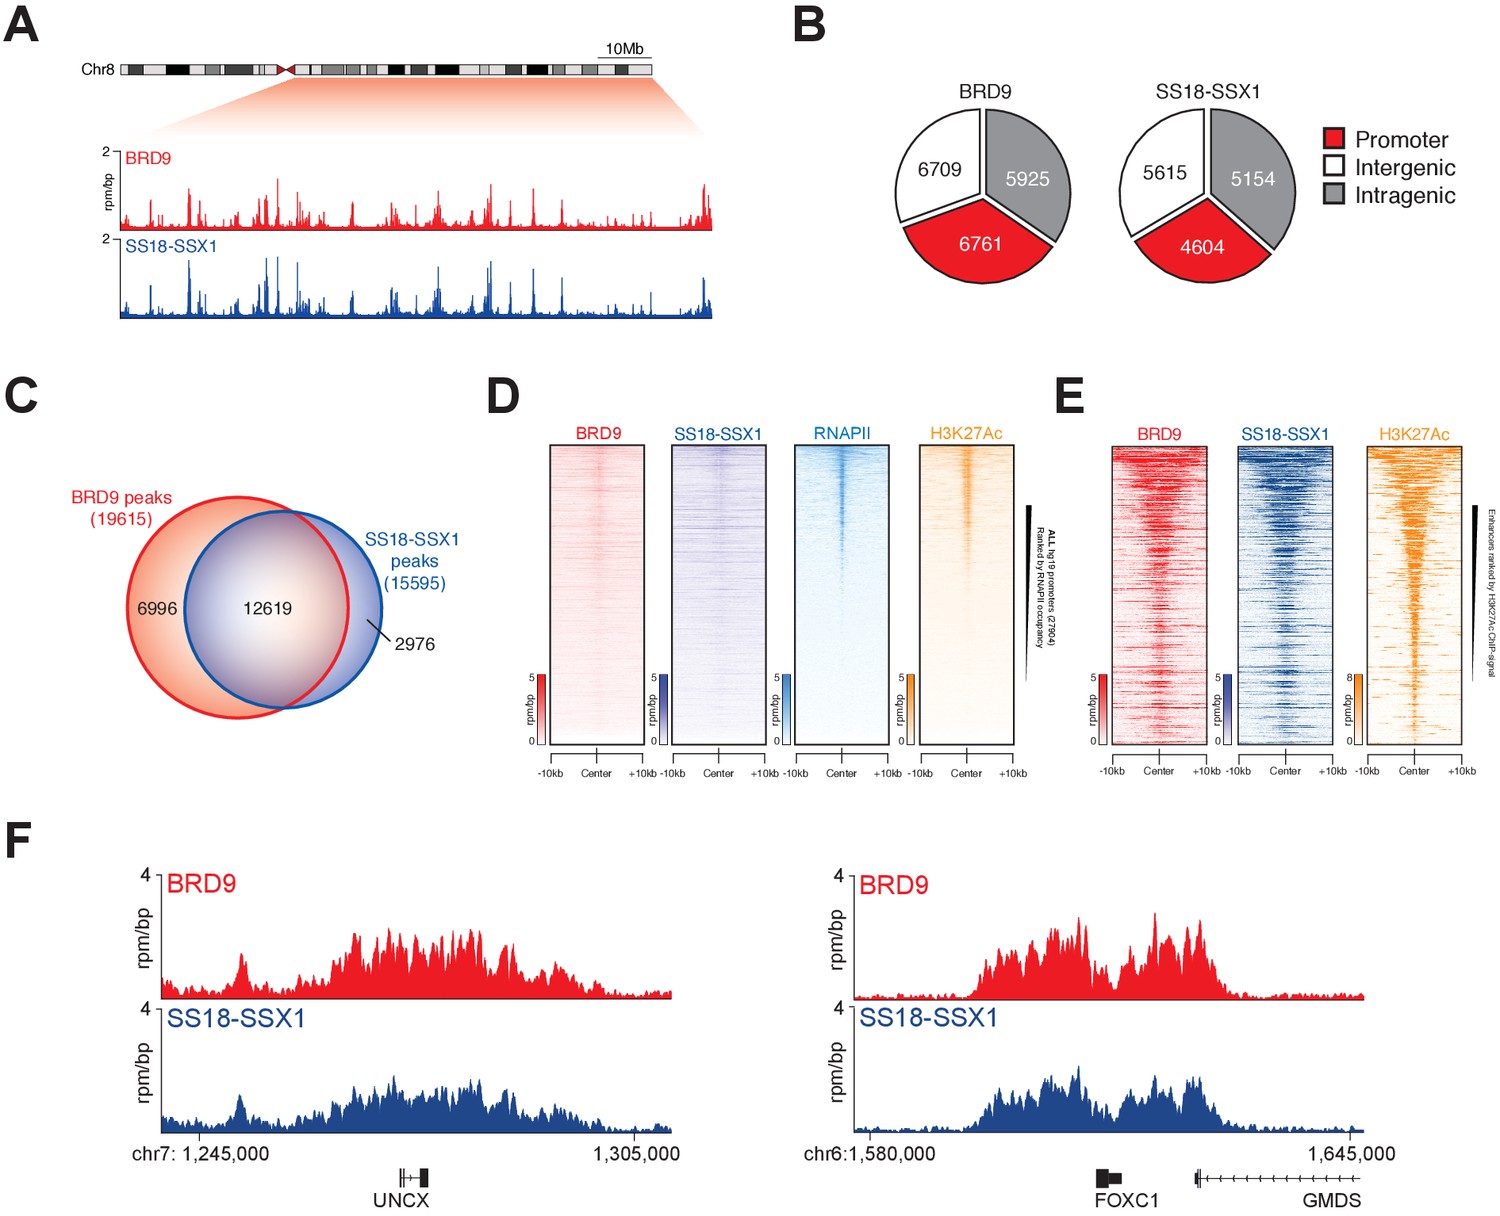
SS18-SSX1 and BRD9 co-bind the synovial sarcoma genome.
(A) Genomic tracks showing BRD9 and SS18-SSX1 ChIP-seq signal on the 98 Mb right arm of chromosome eight in HSSYII cells. The chromosome eight ideogram is displayed above the gene tracks with the relevant region highlighted in red. (B) Pie charts representing the distribution of BRD9 and SS18-SSX1 binding sites on the synovial sarcoma genome. (C) Venn diagram overlaps of all identified BRD9 and SS18-SSX1 ChIP-seq peaks in HSSYII cells. (D) Tornado plots showing BRD9, SS18-SSX1, RNAPII and H3K27Ac ChIP-signal ±10 kb of all hg19 gene promoters in HSSYII cells. Promoters are ranked by RNAPII ChIP signal. (E) Tornado plots showing BRD9, SS18-SSX1 and H3K27Ac ChIP-signal ±10 kb of all active enhancers (defined by H327Ac) in HSSYII cells. (F) Tracks showing BRD9 and SS18-SSX1 ChIP-seq occupancy at the indicated genomic loci in HSSYII cells.
Figure 3—figure supplement 1
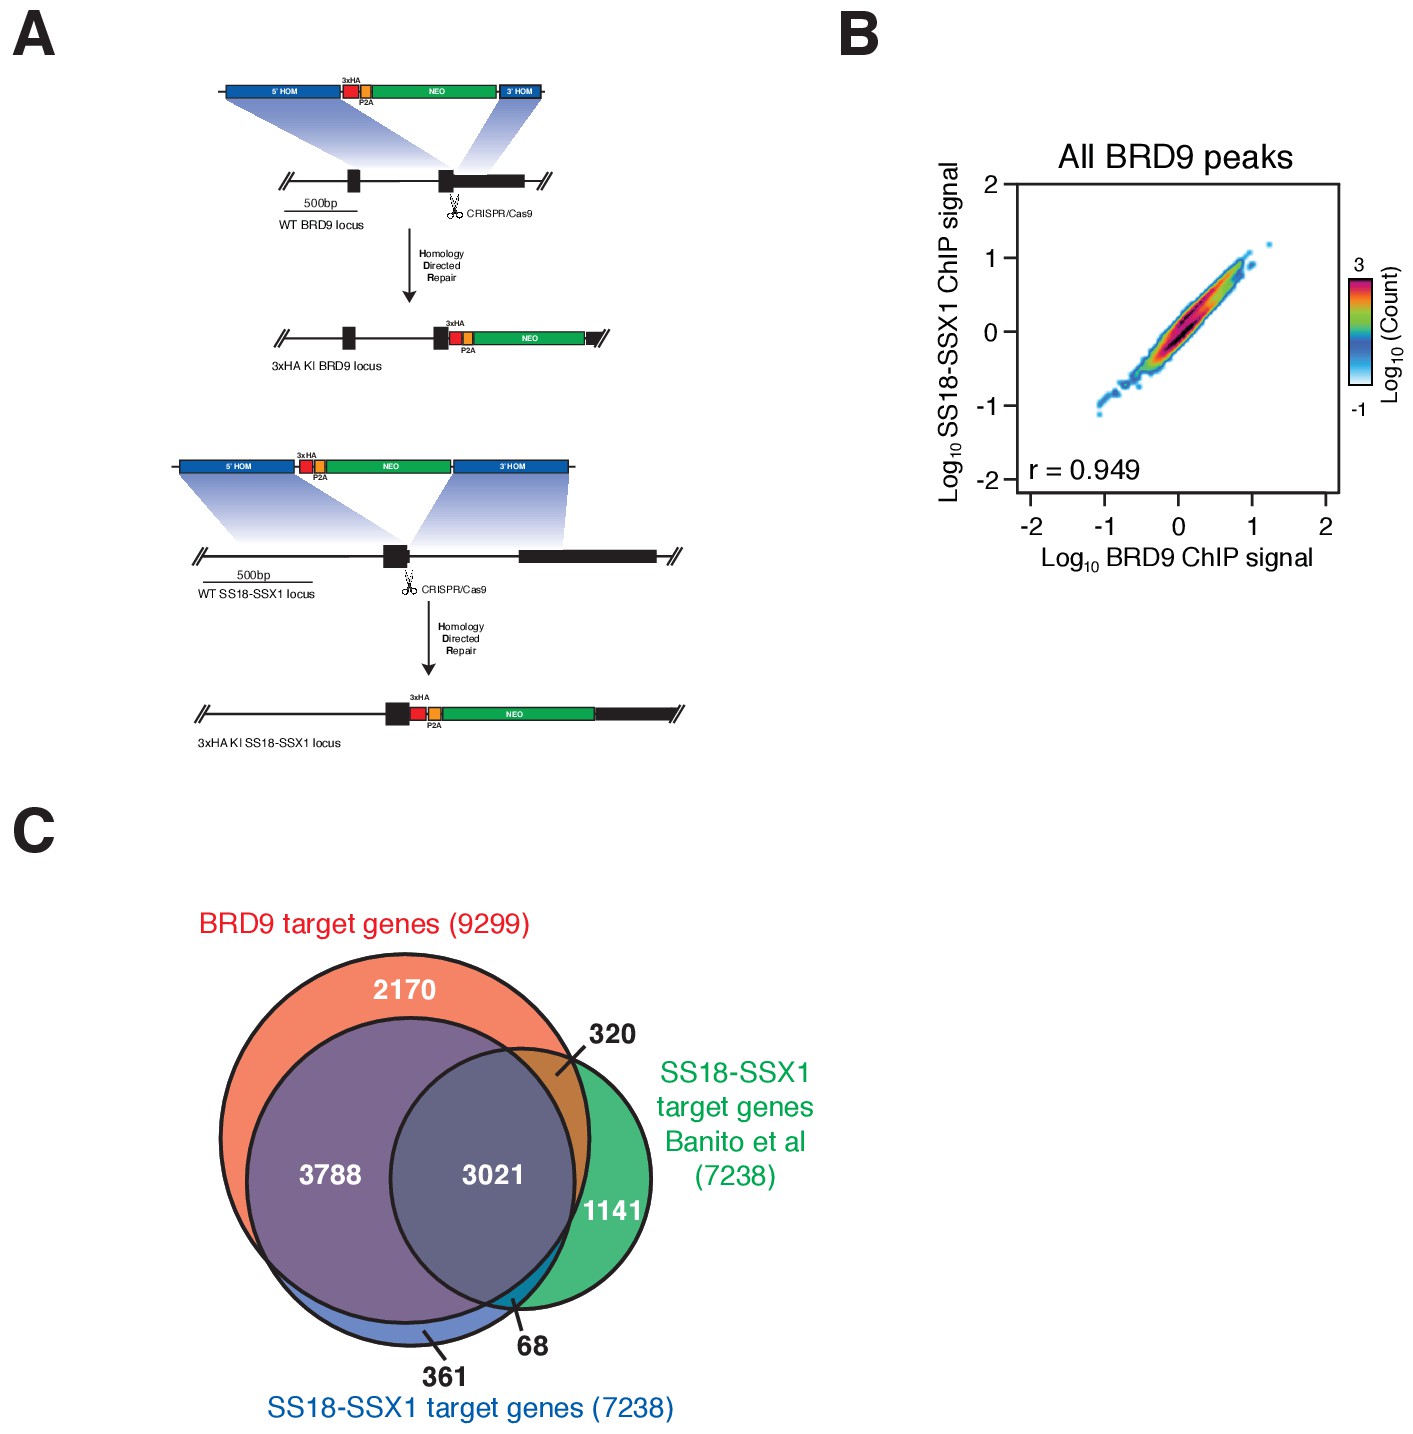
BRD9 and SS18-SSX1 co-localise genome-wide.
(A) Schematic representation of the CRISPR/Cas9 mediated targeting of a 3xHA epitope tag to the C-termini of the BRD9 and SS18-SSX1 loci. (B) Pie charts representing the proportion and total number of BRD9 and SS18-SSX1 ChIP-seq peaks occurring in each of the three indicated genomic regions. (C) Scatter plot representing the correlation of BRD9 and SS18-SSX1 ChIP-seq signal within all identified BRD9 binding peaks. (D) Venn diagram overlap of all BRD9 and SS18-SSX1 target genes identified in this study, with SS18-SSX1 targets identified in the work of Banito et al. (Banito et al., 2018).
Figure 4 with 1 supplement
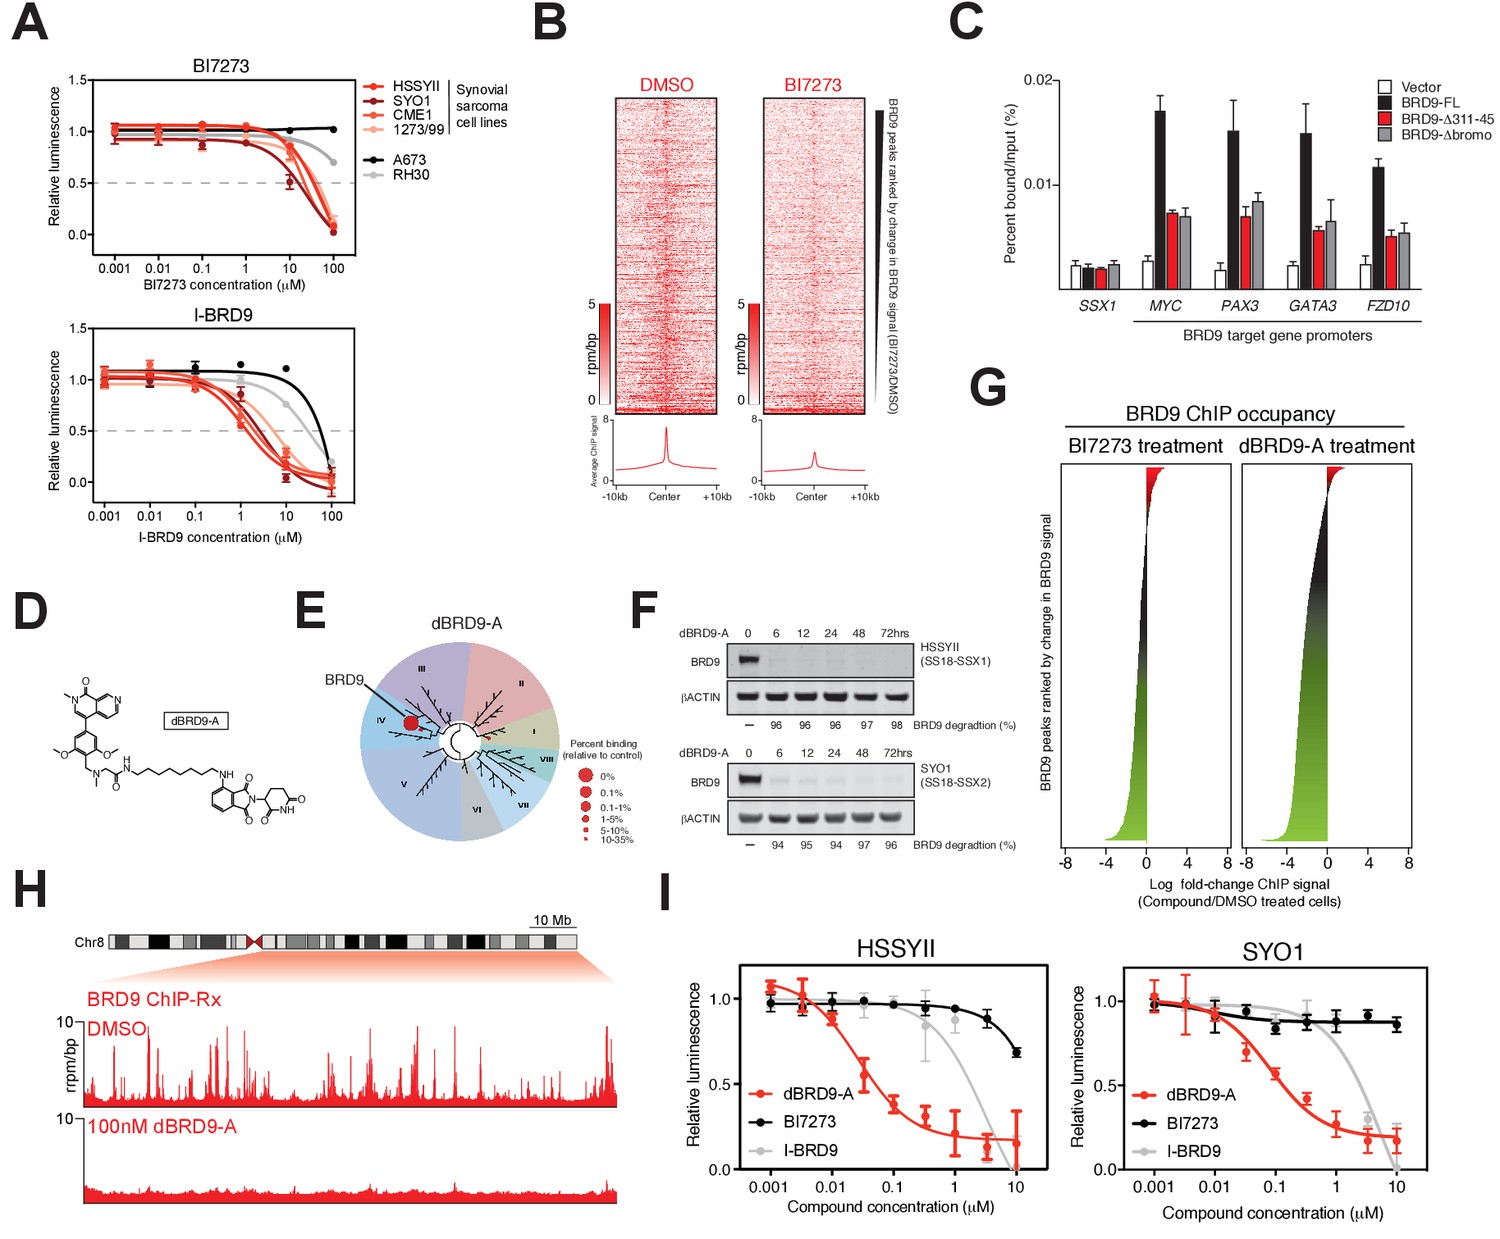
Complete ablation of BRD9 function by targeted protein degradation.
(A) Cellular viability dose-response data in the indicated panel of cell lines treated with the BRD9 bromodomain inhibitors BI7273 (top) or I-BRD9 (bottom). Mean ± s.d., n = 3. (B) Tornado plots and meta-tracks representing BRD9 ChIP-Rx signal in control (DMSO) and BI7273 treated (24 hr) HSSYII cells. (C) ChIP-qPCR analysis of 3xHA epitope tagged full-length BRD9, Δ311–345 BRD9 or Δ bromodomain BRD9 at the indicated gene promoters in HSSYII cells. Mean ± s.d., n = 3. (D) Chemical structure of our BRD9 degrader compound dBRD9-A. (E) Selectivity of phage-displayed bromodomain displacement by dBRD9-A (Bromoscan). (F) Western blot analysis of the indicated proteins, in two independent synovial sarcoma cell lines following treatment with dBRD9-A at 100 nM for 6–72 hr. (G) Waterfall plot representing changes in BRD9 occupancy at BRD9 peak regions in ChIP-Rx experiments of BI7273 (10 μM) (left panel) or dBRD9-A (100 nM) (right panel) treated HSSYII cells following 24 hr treatment. (H) Tracks showing BRD9 ChIP-seq occupancy on the 98 Mb right arm of chromosome eight after DMSO or 100 nM dBRD9-A treatment. The chromosome eight ideogram is displayed above the gene tracks with the relevant region highlighted in red. (I) Cellular viability dose-response data in HSSYII and SYO1 cells treated with dBRD9-A or the BRD9 bromodomain inhibitors BI7273 or I-BRD9. Mean ± s.d., n = 3.
-
Figure 4—source data 1
ChIP-qPCR data of HA-tagged BRD9 proteins - BRD9-FL, BRD9 Δbromo and BRD9 Δ311–345 - expressed in HSSYII cells.
- https://doi.org/10.7554/eLife.41305.023
Figure 4—figure supplement 1
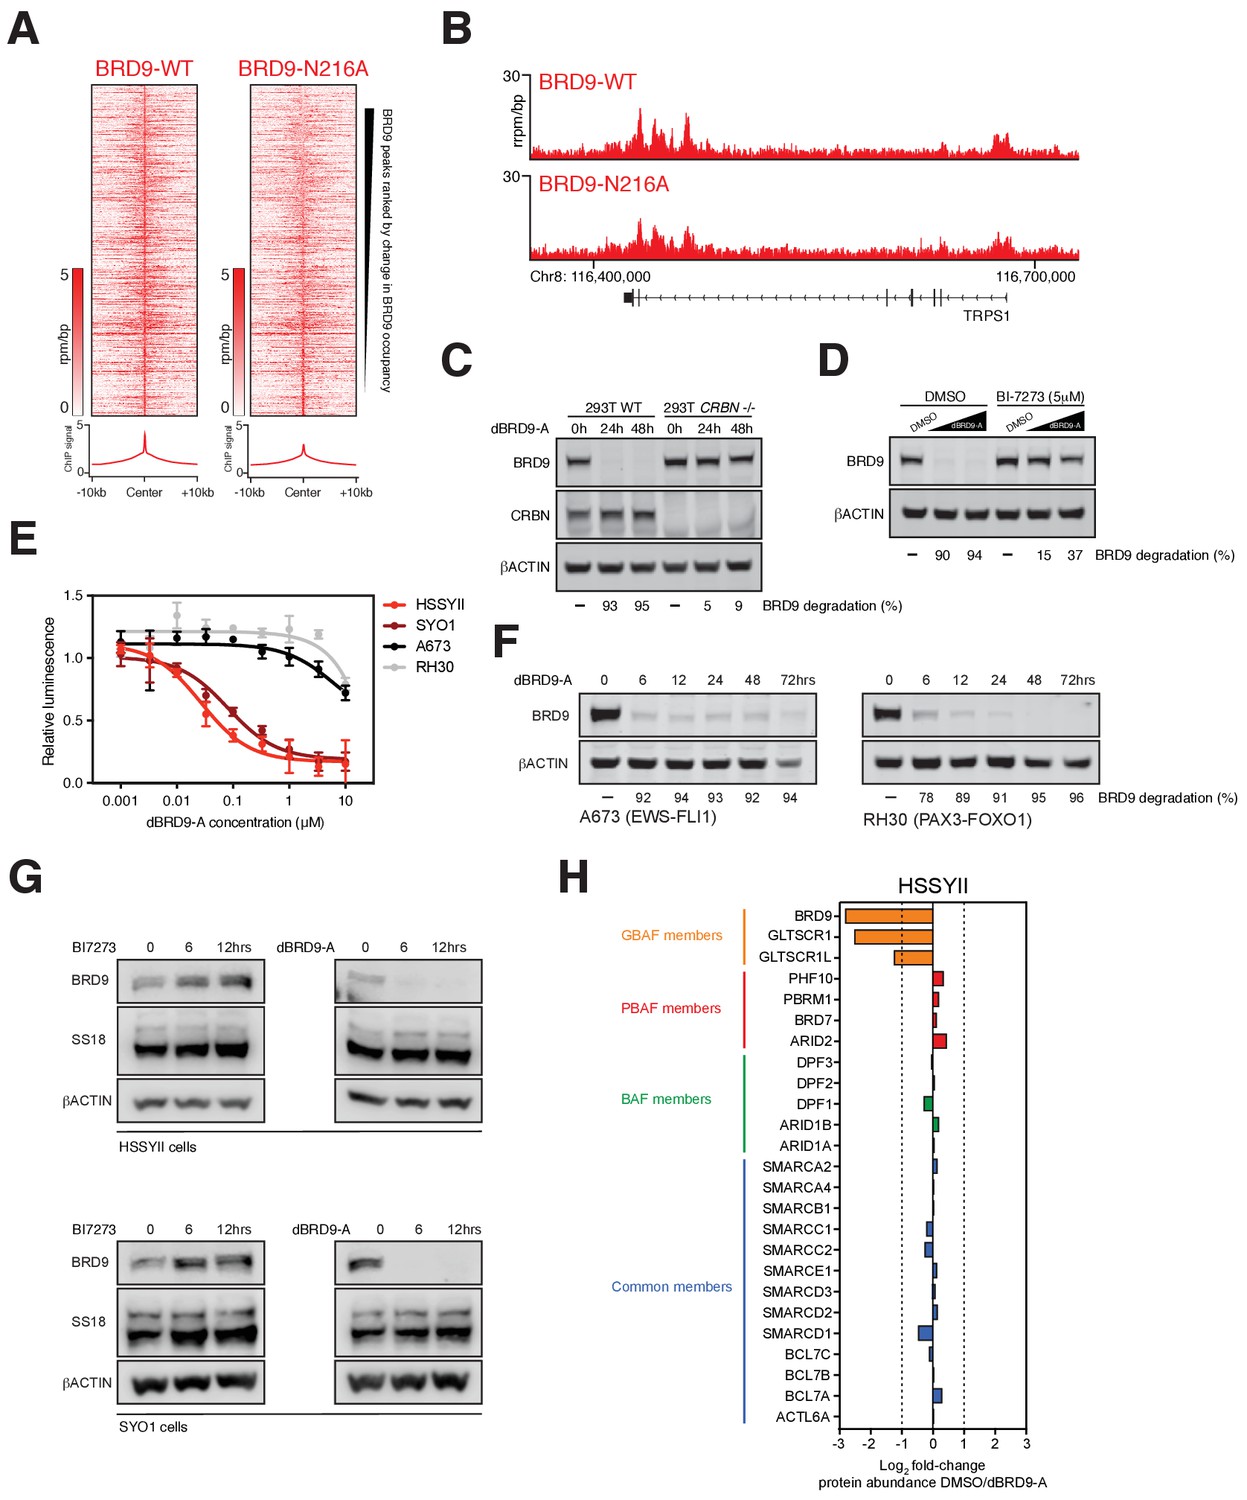
Transcriptional regulation by BRD9 in SS cells.
(A) Tornado plots showing BRD9-WT and BRD9-N216A ChIP-signal signal within all BRD9 peaks regions. Regions are ranked by change in ChIP-signal (BRD9-N216A/BRD9-WT). (B) Genomic tracks showing BRD9-WT and BRD9-N216A ChIP-seq signal at the indicated locus in HSSYII cells. (C) Western blot analysis of the indicated proteins in wildtype or CRBN -/- HEK293T cells treated with 100 nM DBRD9-A for 0, 24 or 48 hr. (D) Western blot analysis of the indicated proteins in HSSYII cells treated with increasing doses of dBRD9-A (100 nM, 500 nM) for 6 hr following pre-treatment of cells for 12 hr with DMSO or BI7273 (5 μM). (E) Cellular viability dose-response data in SS (HSSYII and SYO1), Ewing sarcoma (A673) and rhabdomyosarcoma (RH30) cell lines treated with dBRD9-A. Mean ± s.d. n = 3. (F) Western blot analysis of the indicated proteins in Ewing (A673) and rhabdomyosarcoma (RH30) cell lines treated with dBRD9-A at 100 nM for 6 to 72 hr. (G) Western blot analyses of the indicated proteins in two independent synovial sarcoma cell lines treated for the specified time course with BI7273 (left panels) at 5 μM or dBRD9-A (right panels) at 100 nM. (H) Fold-change of all known BAF members identified by mass spectrometry in SS18-SSX1 purifications performed in HSSYII cells treated with DMSO or dBRD9-A for 24 hr.
-
Figure 4—figure supplement 1—source data 1
Fold-change of individual BAF complex members identified in SS18-SSX1 purifications from HSSYII cells treated with DMSO or dBRD9-A at 100 nM for 24 hr.
- https://doi.org/10.7554/eLife.41305.022
Figure 5 with 1 supplement
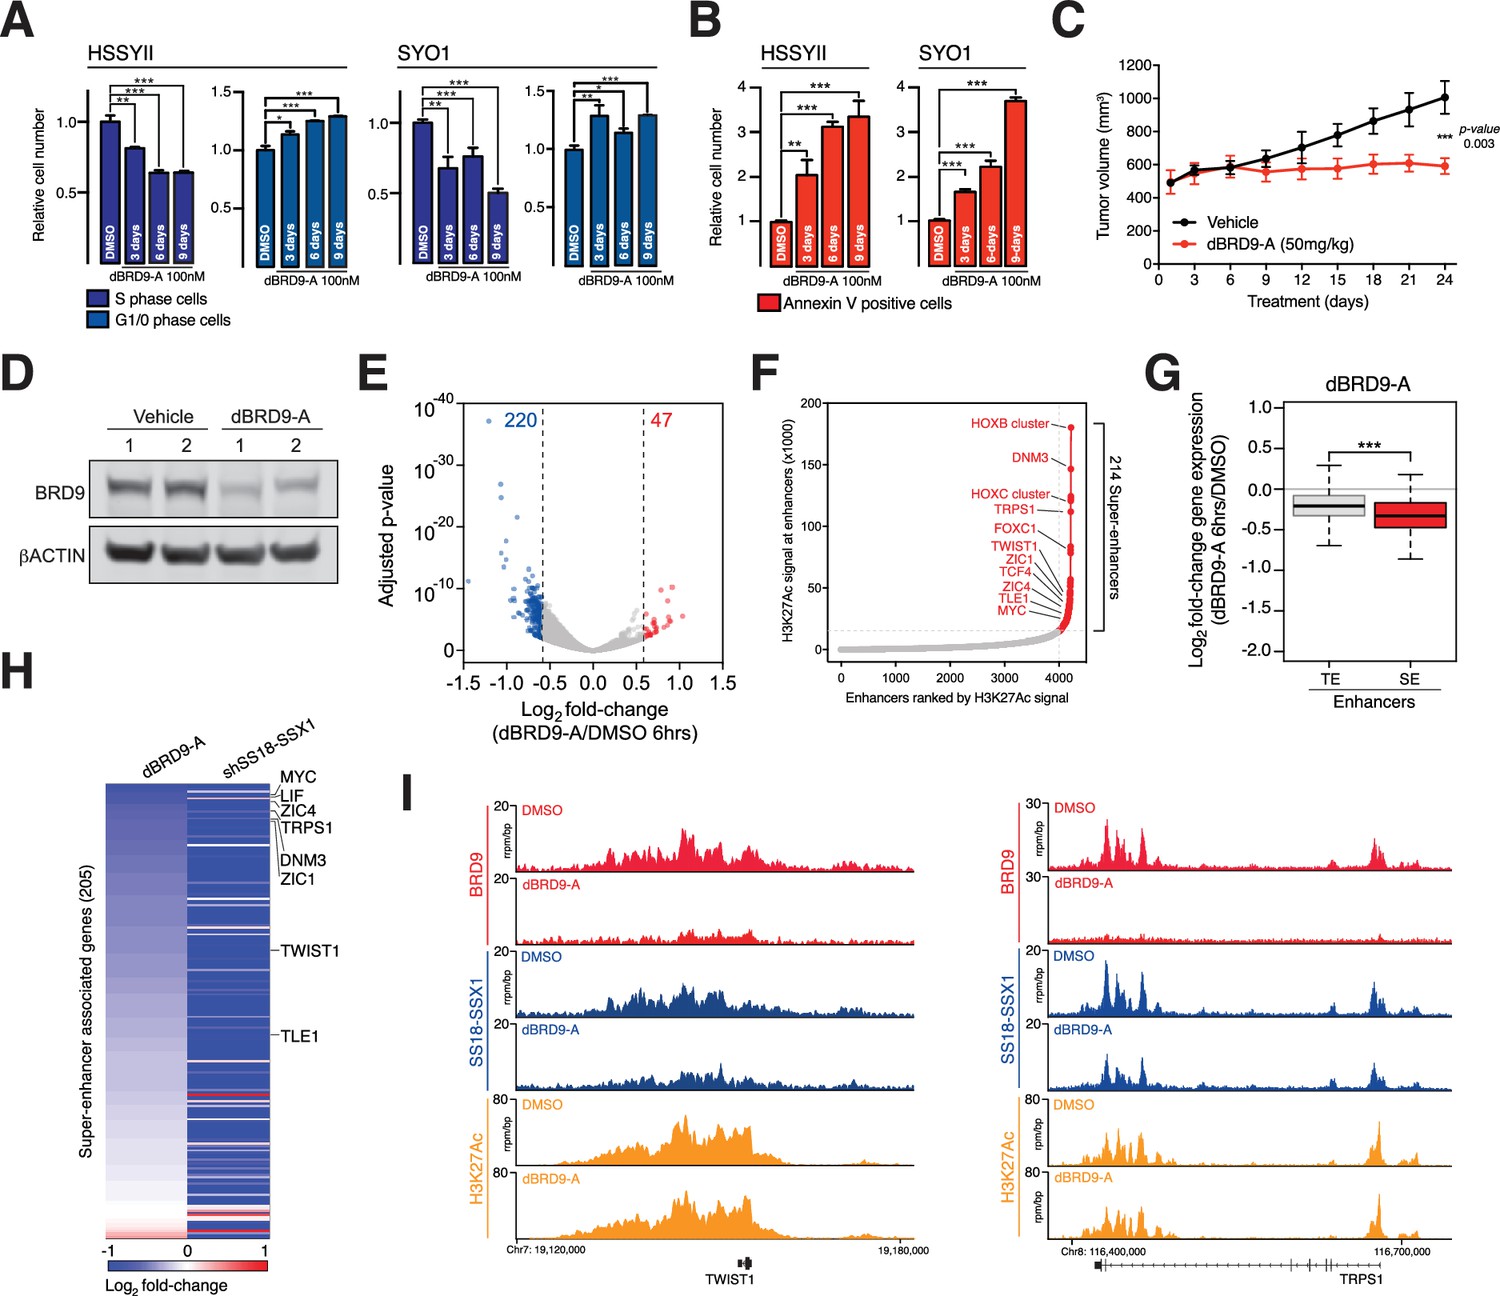
BRD9 degradation blocks synovial sarcoma tumour progression and oncogenic transcription.
(A) Relative changes in cell cycle dynamics in two independent SS cell lines treated with dBRD9-A for 3/6/9 days at 100 nM. Mean ±s.d., n = 3 (B) Relative changes in Annexin-V positive cells in two independent SS cell lines treated with dBRD9-A for 3/6/9 days at 100 nM. Mean ± s.d., n = 3 (C) Tumour progression in a subcutaneous xenograft model of SS in control vehicle treated mice, and mice treated at 50 mg/kg dBRD9-A once daily for 24 days. Mean ± SEM, five mice per treatment group. P value is from 2way ANOVA (D) Western blot analysis of the indicated proteins in protein lysates derived from tumour tissue from two independent mice per treatment group as in panel c. (E) Volcano plot representing gene expression changes in HSSYII cells treated with dBRD9-A at 100 nM for 6 hr. The number of genes, the expression of which changes >1.5 fold up or down are indicated. (F) H3K27Ac ChIP-seq signal (rpm/bp) at all enhancer regions in HSSYII cell. Enhancers are ranked by increasing H3K27Ac signal. (G) Box plot representations of changes in gene expression amongst genes associated with typical enhancers and genes associated with super enhancers. P values are from Welch’s two-tailed t-tests. ***p≤0.001. (H) Heat map representing changes in gene expression amongst all super enhancer associated genes in HSSYII cells following 6 hr dBRD9-A treatment at 100 nM, or HSSYII cells following infection with two independent SS18-SSX1 shRNAs for 96 hr. (I) Tracks showing BRD9 and SS18-SSX1 ChIP-seq occupancy at the indicated genomic loci in DMSO and dBRD9-A treated cells. Also shown is H3K27Ac ChIP-seq signal in untreated cells.
-
Figure 5—source data 1
Induction of apoptosis in HSSYII and SYO1 cells treated with dBRD9-A at 100 nM over 9 days.
- https://doi.org/10.7554/eLife.41305.029
-
Figure 5—source data 2
Cell cycle dynamics of HSSYII and SYO1 cells treated with dBRD9-A at 100 nM over 9 days.
- https://doi.org/10.7554/eLife.41305.030
-
Figure 5—source data 3
Gene expression changes in HSSYII cells treated with dBRD9-A at 100 nM for 6 hr.
- https://doi.org/10.7554/eLife.41305.031
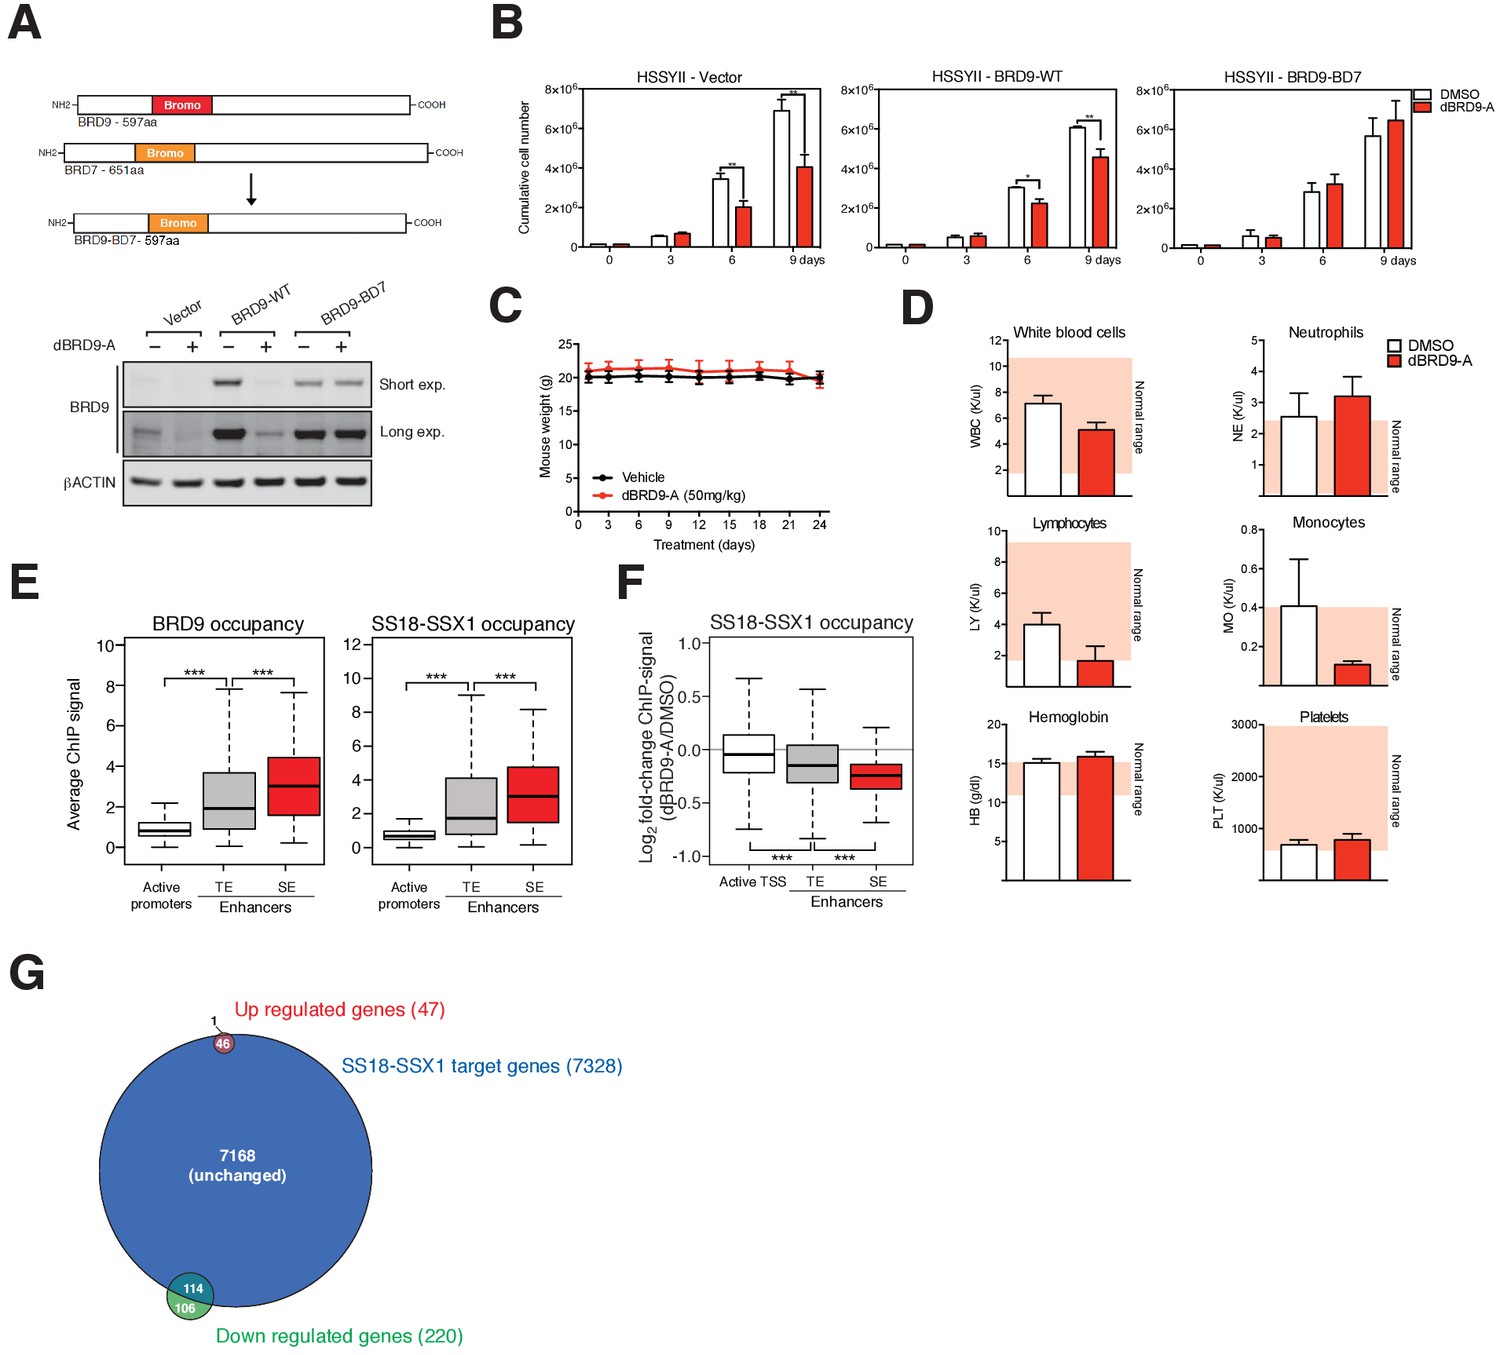
Figure 5—figure supplement 1
Targeted degradation of BRD9.
(A) Schematic representation of wildtype BRD9 and BRD7, and the chimeric BRD9 bromodomain swap containing the BRD7 bromodomain (top panel). Western blot analysis of the indicated proteins in HSSYII cells expressing vector (control), BRD9-WT or BRD9 containing the bromodomain of BRD7 (BRD9-BD7) treated with dBRD9-A at 100 nM for 6 hr (bottom panel). (B) Growth assays of HSSYII cells (as in panel a) cultured in the presence of dBRD9-A at 100 nM for a total of 9 days. (C) Mouse weight measurements in vehicle control and dBRD9-A treated mice. Mean ±s.d., n = 5. (D) Complete blood counts (CBCs) performed on vehicle control and dBRD9-A treated mice. Measurements were taken on day-23 of the 24 day treatment experiment. Mean ±s.d., n = 5. (E) Box plot representation of the relative abundance of BRD9 and SS18-SSX1 ChIP-seq signal at promoter, typical enhancer and super enhancer elements. P values are from Welch’s two-tailed t-tests. ***p≤0.001. (F) Box plot representations of changes in SS18-SSX1 occupancy at active promoters, typical enhancers and super enhancers comparing DMSO and dBRD9-A treated HSSYII cells. P values are from Welch’s two-tailed t-tests. *p≤0.05, ***p≤0.001. (G) Venn diagram representing the proportion of overlap between all up/down-regulated genes (±1.5 fold) in dBRD9-A treated cells at 6 hr post-treatment with all direct SS18-SSX target genes.
-
Figure 5—figure supplement 1—source data 1
Cell counts in dBRD9-A treatment experiments in HSSYII cells infected with an empty vector, a WT BRD9 expressing vector or a BRD9 bromodomain swap (BRD7 bromodomain) vector.
- https://doi.org/10.7554/eLife.41305.026
-
Figure 5—figure supplement 1—source data 2
Mouse weight measurement derived from mice treated with control (vehicle) of dBRD9-A at 50 mg/kg.
- https://doi.org/10.7554/eLife.41305.027
-
Figure 5—figure supplement 1—source data 3
Presented are blood counts derived from DMSO and dBRD9-A treated mice 1 day prior to cessation of treatment.
- https://doi.org/10.7554/eLife.41305.028
Chemical structure 1
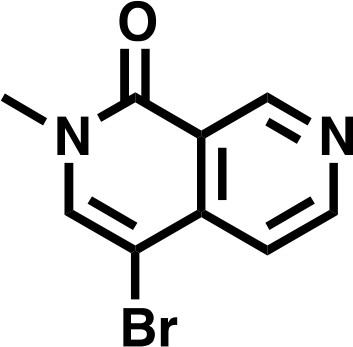
4-bromo-2-methyl-2,7-naphthyridin-1(2H)-one.
https://doi.org/10.7554/eLife.41305.032
Chemical structure 2
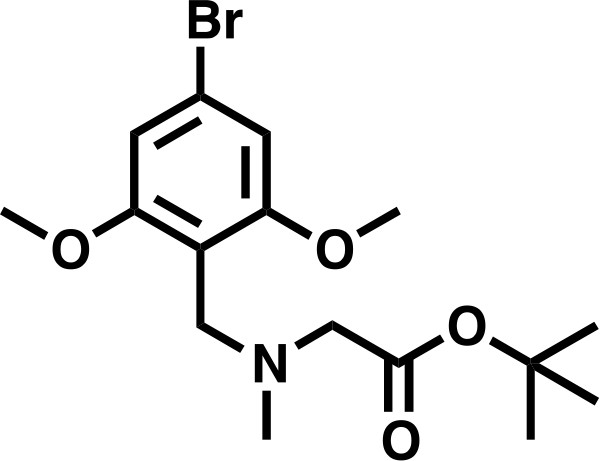
tert-butyl 2-((4-bromo-2,6-dimethoxybenzyl)(methyl)amino)acetate.
https://doi.org/10.7554/eLife.41305.033
Chemical structure 3
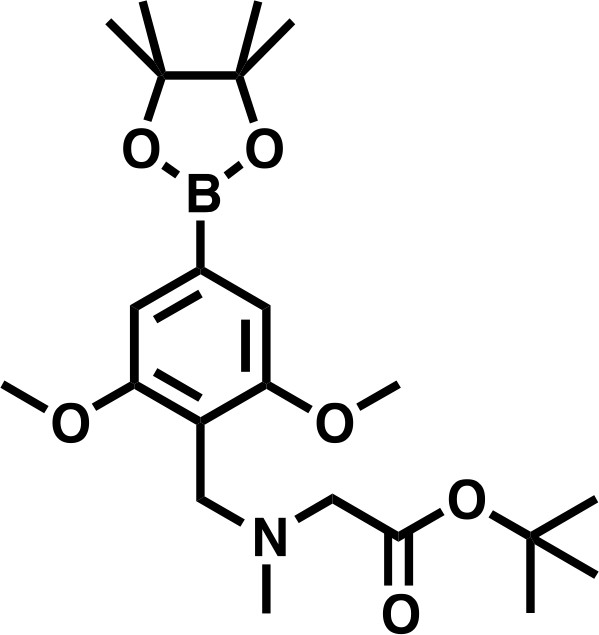
tert-butyl 2-((2,6-dimethoxy-4-(4,4,5,5-tetramethyl-1,3,2-dioxaborolan-2-yl)benzyl)(methyl)amino)acetate.
https://doi.org/10.7554/eLife.41305.034
Chemical structure 4
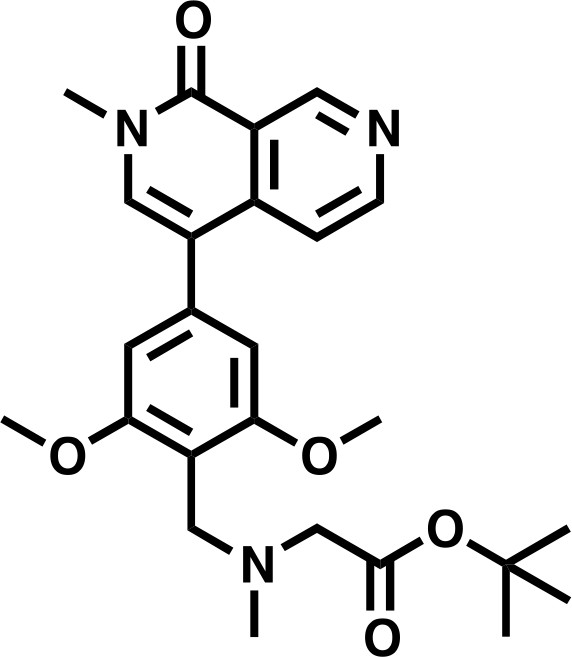
tert-butyl 2-((2,6-dimethoxy-4-(2-methyl-1-oxo-1,2-dihydro-2,7-naphthyridin-4-yl)benzyl)(methyl)amino)acetate.
https://doi.org/10.7554/eLife.41305.035
Chemical structure 5

2-((2,6-dimethoxy-4-(2-methyl-1-oxo-1,2-dihydro-2,7-naphthyridin-4-yl)benzyl)(methyl)amino)acetic acid.
https://doi.org/10.7554/eLife.41305.036
Chemical structure 6
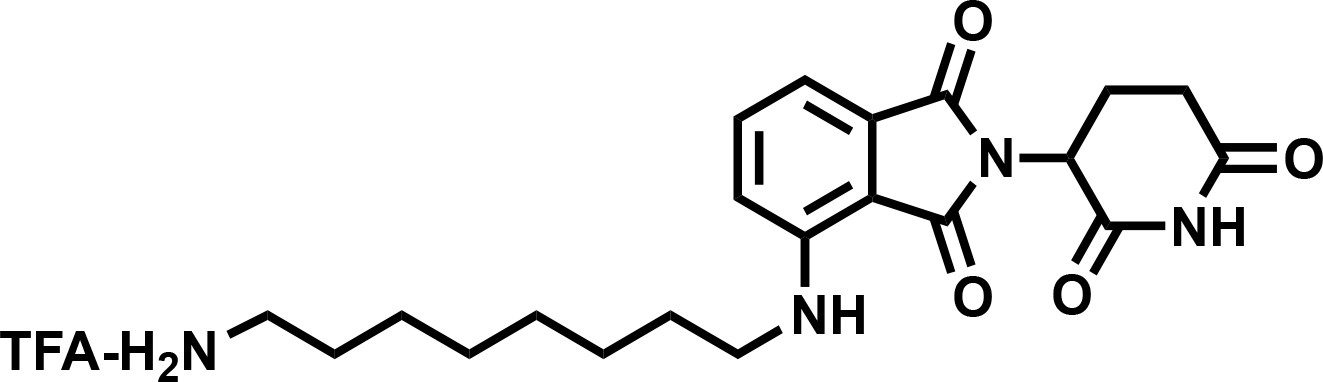
4-((8-aminooctyl)amino)-2-(2,6-dioxopiperidin-3-yl)isoindoline-1,3-dione (4).
https://doi.org/10.7554/eLife.41305.037
Chemical structure 7

dBRD9-A.
https://doi.org/10.7554/eLife.41305.038Tables
Key resources table
| Reagent type (species) or resource | Designation | Source or reference | Identifiers | Additional information |
|---|---|---|---|---|
| Cell line (Homo sapiens) | HEK293T | ATCC | RRID:CVCL_0063 | |
| Cell line (Homo sapiens) | HSSYII | Provided from the laboratory of Stefan Frohling | ||
| Cell line (Homo sapiens) | SYO1 | Provided from the laboratory of Stefan Frohling | ||
| Cell line (Homo sapiens) | 1273/99 | Provided from the laboratory of Stefan Frohling | ||
| Cell line (Homo sapiens) | A673 | ATCC | RRID:CVCL_0080 | |
| Cell line (Homo sapiens) | CME1 | Provided from the laboratory of Stefan Frohling | ||
| Cell line (Homo sapiens) | SKNMC | ATCC | RRID:CVCL_0530 | |
| Cell line (Homo sapiens) | RH30 | ATCC | RRID:CVCL_0041 | |
| Cell line (Homo sapiens) | RH41 | DSMZ | RRID:CVCL_2176 | |
| Antibody | BRD9, rabbit polyclonal | Bethyl Laboratories | RRID:AB_11218396 | Western blotting (1:2500) and IP (5μgs) |
| Antibody | HA, rabbit monoclonal | Cell Signalling Technologies | RRID:AB_1549585 | Western blotting (1:1000) and ChIP (5-10μgs) |
| Antibody | ACTIN, mouse monoclonal | Cell Signalling Technologies | RRID:AB_2750839 | Western blotting (1:5000) |
| Antibody | CRBN, rabbit polyclonal | Proteintech | RRID:AB_2085739 | Western blotting (1:1000) |
| Antibody | V5, rabbit polyclonal | Bethyl Laboratories | RRID:AB_67586 | Western blotting (1:1000) |
| Antibody | SSX1, rabbit polyclonal | MyBioscience | RRID:AB_2750841 | IP (10μgs) |
| Antibody | SSX2, rabbit polyclonla | MyBioscience | RRID:AB_2750840 | IP (10μgs) |
| Antibody | SS18, rabbit polyclonal | Santa Cruz Biotechnology | RRID:AB_2195154 | Western blotting (1:500) |
| Antibody | H3K27Ac, rabbit polyclonal | Abcam | RRID:AB_2118291 | ChIP (5μgs) |
| Antibody | RNAPII, mouse monoclonal | Diagenode | RRID:AB_2750842 | ChIP (10μs) |
| Other | HA | Pierce | RRID:AB_2749815 | IP affinity resin |
| Other | V5 | Sigma Aldrich | RRID:AB_10062721 | IP affinity resin |
| Chemical compound, drug | dBRD9-A | This study | ||
| Chemical compound, drug | BI7273 | Cayman Chemical | 20311 | |
| Chemical compound, drug | I-BRD9 | Cayman Chemical | 17749 | |
| Chemical compound, drug | X-termeGENE 9 | Sigma Aldrich | 6365809001 | |
| Chemical compound, drug | Formaldehyde | Fisher Scientific | BP531-500 | |
| Chemical compound, drug | DSG | Pierce | 20593 | |
| Chemical compound, drug | ATPLite 1-Step | Perkin Elmer | 6016731 | |
| Recombinant DNA reagent | pPAX2 | Addgene | 12260 | |
| Recombinant DNA reagent | pCMV-VSV-G | Addgene | 8454 | |
| Recombinant DNA reagent | pLEX305 | Addgene | 41390 | |
| Recombinant DNA reagent | pLEX305-3xHA | This study | ||
| Recombinant DNA reagent | LRG2.0T | This study | Provided form the laboratory of Chris Vakoc | |
| Recombinant DNA reagent | SGEN | MSKCC RNAi core facility | ||
| Recombinant DNA reagent | pCR8 | Invitrogen | K250020 | |
| Recombinant DNA reagent | pCR8-BRD9 (and derivatives) | This study | ||
| Commercial assay or kit | 4–12% Bis-Tris gels | Invitrogen | NW04127BOX | |
| Commercial assay or kit | Q5 Site-Directed mutagenesis kit | NEB | E0554S | |
| Commercial assay or kit | ThruPlex DNA-seq kit | Rubicon Genomics | R400427 | |
| Commercial assay or kit | Tapestation D1000 screentape | Agilent | 5067–5584 | |
| Commercial assay or kit | NextSeq 500 High Output v2 | Illumina | FC-404–2005 | |
| Commercial assay or kit | RNeasy mini-kit | Qiagen | 74106 | |
| Commercial assay or kit | ERCC spike-in controls | Ambion | 4456740 | |
| Commercial assay or kit | NEBNext Ultra RNA library prep kit | NEB | E7530L | |
| Commercial assay or kit | BD Pharmingen BrdU Flow kit | BD | 559619 | |
| Commercial assay or kit | BD Annexin V Apoptosis detection kit | BD | 556547 | |
| Software, algorithm | ChIP and RNA-seq analysis | Basepair | www.basepair.io | |
| Software, algorithm | ChIP-seq data visualisation | EaSeq | https://easeq.net | |
| Strain, strain background (Mus musculus) | BALB/c (Foxn1nu) | Charles River Laboratory | CAnN. Cg-Foxn1nu/Crl |
Additional files
-
Transparent reporting form
- https://doi.org/10.7554/eLife.41305.039
Download links
A two-part list of links to download the article, or parts of the article, in various formats.
Downloads (link to download the article as PDF)
Open citations (links to open the citations from this article in various online reference manager services)
Cite this article (links to download the citations from this article in formats compatible with various reference manager tools)
Targeted degradation of BRD9 reverses oncogenic gene expression in synovial sarcoma
eLife 7:e41305.
https://doi.org/10.7554/eLife.41305


