MicroRNA-122 supports robust innate immunity in hepatocytes by targeting the RTKs/STAT3 signaling pathway
- Sun Yat-sen University, China
Figures
Figure 1 with 1 supplement

miR-122 enhances IFN responses to various viral nucleic acids.
(A) qRT-PCR analysis of type III (IL-29 and IL-28) and type I (IFN-β) IFN mRNAs in HepG2 cells transfected with the indicated nucleic acids for 24 hr. Except for HSV-60 and ssRNA40, which were transfected at 5 μg/ml, all other RNAs were transfected at 1 μg/ml. The expression of IFNs was normalized to GAPDH and then compared with the levels in cells without stimulation (mock). (B) qRT-PCR analysis of miR-122 expression in hepatoma cell lines and in normal liver tissue, as well as of HepG2 cells transfected with miR-122 or negative control (miR-NC) mimics. miR-122 expression was normalized to U6 and then compared with the levels in HepG2 cells. (C, D) qRT-PCR analysis of IFN mRNAs in HepG2 cells first treated with miR-122 or control mimics for 2 days, and then transfected with the indicated nucleic acids for 24 hr. Opti-MEM (medium) was used as the negative control. (E, F) ELISA analysis of IL-29/IL-28B and IFN-β proteins in HepG2 cells treated as in panel C. IL-29 and IL-28B were detected by the same set of antibodies. N.D., lower than the minimum concentration (3.9 pg/ml) that can be accurately detected. qRT-PCR data are from one experiment that was representative of three independent experiments (mean ±SEM of technical triplicates). ELISA data are from two experiments (mean +SD). *p<0.05, **p<0.01 and ***p<0.001.
-
Figure 1—source data 1
qRT-PCR analysis of IFN expression in HepG2 and Huh7 cells transfected with JFH1 RNA.
- https://doi.org/10.7554/eLife.41159.004
-
Figure 1—source data 2
qRT-PCR analysis of HBV pgRNA levels in indicated samples.
- https://doi.org/10.7554/eLife.41159.005
-
Figure 1—source data 3
qRT-PCR analysis of IFN mRNAs in HepG2 cells transfected with different nucleic acids.
- https://doi.org/10.7554/eLife.41159.006
-
Figure 1—source data 4
qRT-PCR analysis of miR-122 expression in the indicated samples.
- https://doi.org/10.7554/eLife.41159.007
-
Figure 1—source data 5
qRT-PCR analysis of IFN mRNAs in HepG2 cells transfected with miR-122 and then treated with different nucleic acids.
- https://doi.org/10.7554/eLife.41159.008
-
Figure 1—source data 6
ELISA analysis of IFNs in HepG2 cells transfected with miR-122 and then treated with different nucleic acids.
- https://doi.org/10.7554/eLife.41159.009
-
Figure 1—source data 7
qRT-PCR analysis of ISGs in HepG2 cells transfected with miR-122 and then treated with JFH1.
- https://doi.org/10.7554/eLife.41159.010
-
Figure 1—source data 8
Analysis of the IFN mRNAs in Huh7 cells transfected with miR-122 and then treated with JFH1.
- https://doi.org/10.7554/eLife.41159.011
Figure 1—figure supplement 1
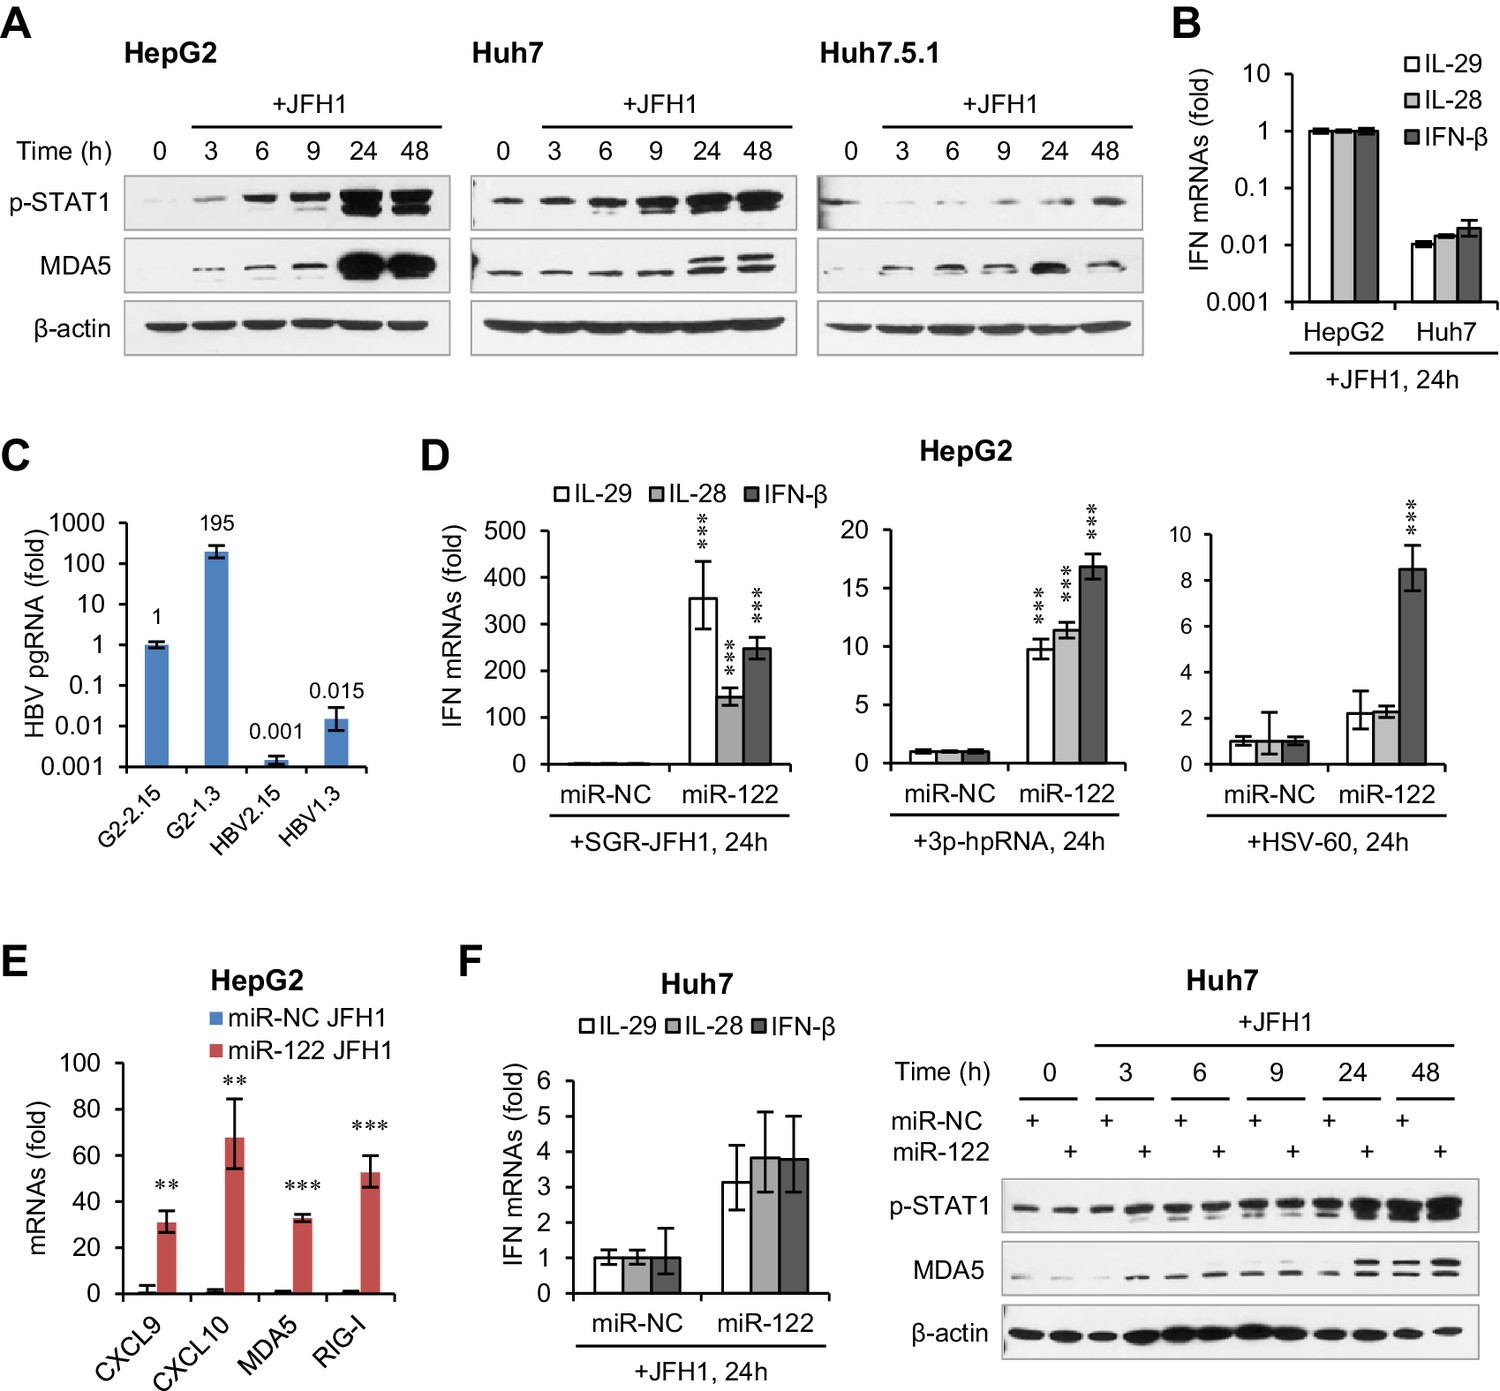
miR-122 promotes antiviral IFN response.
(A) Western blot analysis of p-STAT1 and MDA5 in three hepatoma-derived cell lines transfected with JFH1 RNA. (B) Comparison of IFN expression in HepG2 and Huh7 cells transfected with JFH1 RNA. (C) qRT-PCR analysis of HBV pgRNA levels in HepG2-2.15 (G2-2.15), HepG2 cells transfected with HBV 1.3-mer vector (G2-1.3), HepG2 cells transfected with total RNAs isolated from HepG2-2.15 (HBV2.15) or G2-1.3 (HBV1.3). (D) qRT-PCR analysis of IFNs in HepG2 cells first transfected with miR-NC or miR-122 for 2 days, and then treated with the indicated nucleic acids for 24 hr. (E) qRT-PCR analysis of the indicated genes in HepG2 cells treated with mimics and then JFH1, as in panel D. (F) Analysis of the IFN mRNAs and p-STAT1 in Huh7 cells first transfected with miR-NC or miR-122 mimics and then treated with JFH1. qRT-PCR data are one experiment representative of two (B and C) or three (D–F) independent experiments (mean ±SEM). *p<0.05, **p<0.01 and ***p<0.001.
Figure 2 with 1 supplement
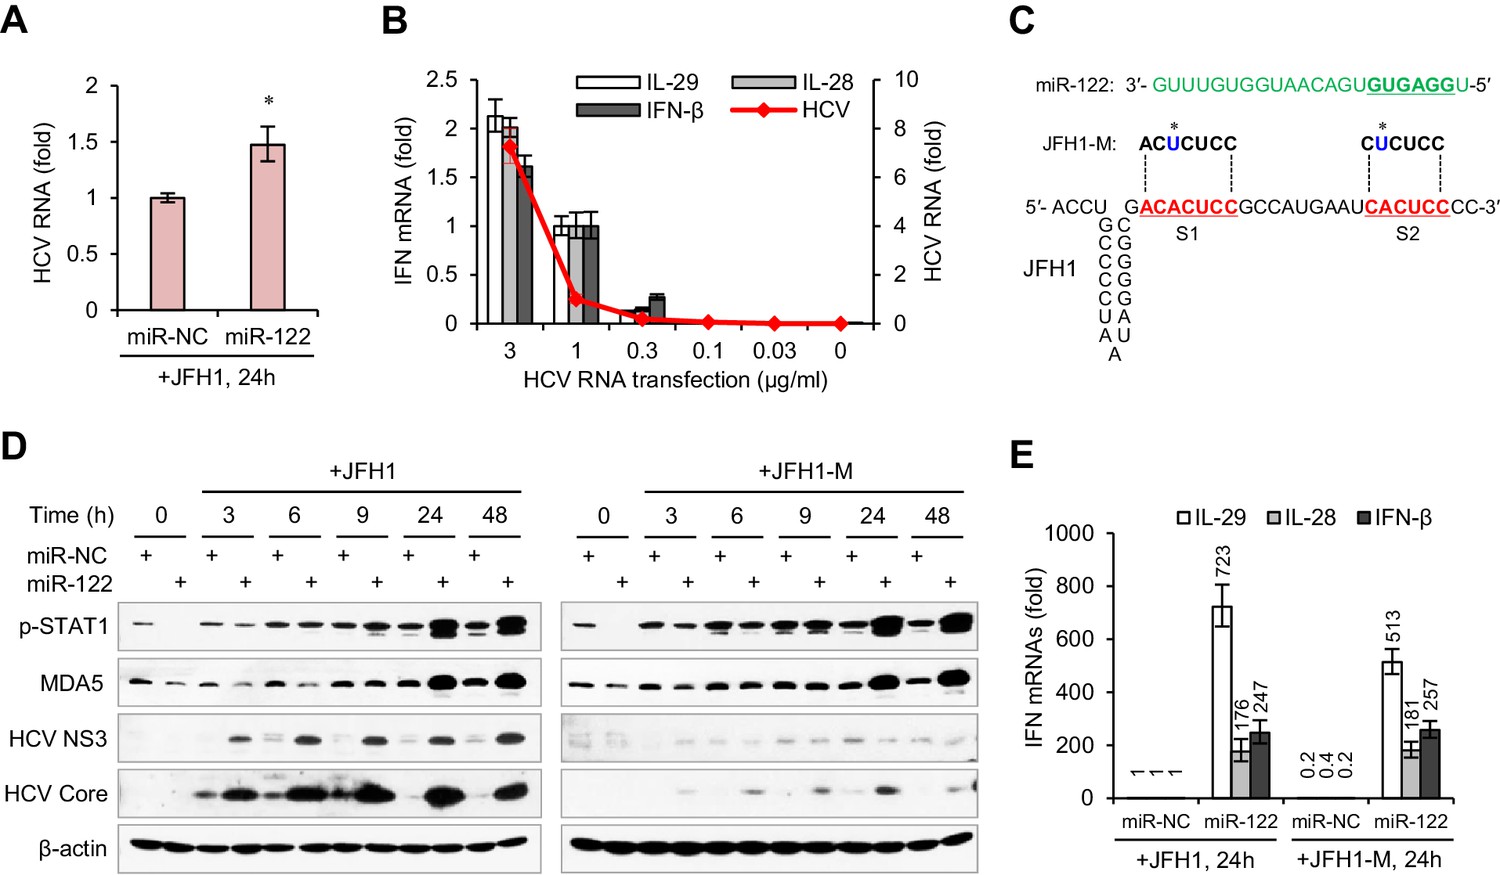
miR-122-induced promotion of IFN activation does not depend on miR-122 binding to the HCV 5′ UTR.
(A) qRT-PCR analysis of the relative level of HCV RNA in HepG2 cells first treated with miR-122 or control mimics for 2 days, and then transfected with JFH1 for 24 hr. (B) qRT-PCR analysis of HCV RNA and IFN mRNAs in HepG2 cells transfected with different doses of JFH1 RNA. The expression of IFNs and HCV RNA was normalized to GAPDH and then compared with the levels in cells transfected with 1 μg/ml JFH1 RNA. (C) Alignment of miR-122 to the binding sites (S1 and S2) in the 5′ -end of JFH1 and mutant JFH1 (JFH1-M). (D) Western blot analysis of p-STAT1 (Tyr701), MDA5, HCV Core and NS3 in HepG2 cells first treated with miR-122 or negative control (miR-NC) mimics for 2 days, and then transfected with JFH1 RNA for 3–48 hr. (E) qRT-PCR comparison of IFN expression in HepG2 cells treated with JFH1 or JFH1-M. qRT-PCR data are from one experiment that was representative of three experiments (mean ±SEM of technical triplicates). *p<0.05.
-
Figure 2—source data 1
qRT-PCR analysis of HCV RNA in HepG2 cells.
- https://doi.org/10.7554/eLife.41159.014
-
Figure 2—source data 2
Luciferase assays of the Gluc reporter treated with miR-122 mimic or XRN1 siRNA.
- https://doi.org/10.7554/eLife.41159.015
-
Figure 2—source data 3
qRT-PCR analysis of HCV RNA and IFN mRNAs in HepG2 cells transfected with different doses of JFH1 RNA.
- https://doi.org/10.7554/eLife.41159.016
-
Figure 2—source data 4
qRT-PCR comparison of IFN expression in HepG2 cells treated with JFH1 or JFH1-M.
- https://doi.org/10.7554/eLife.41159.017
Figure 2—figure supplement 1
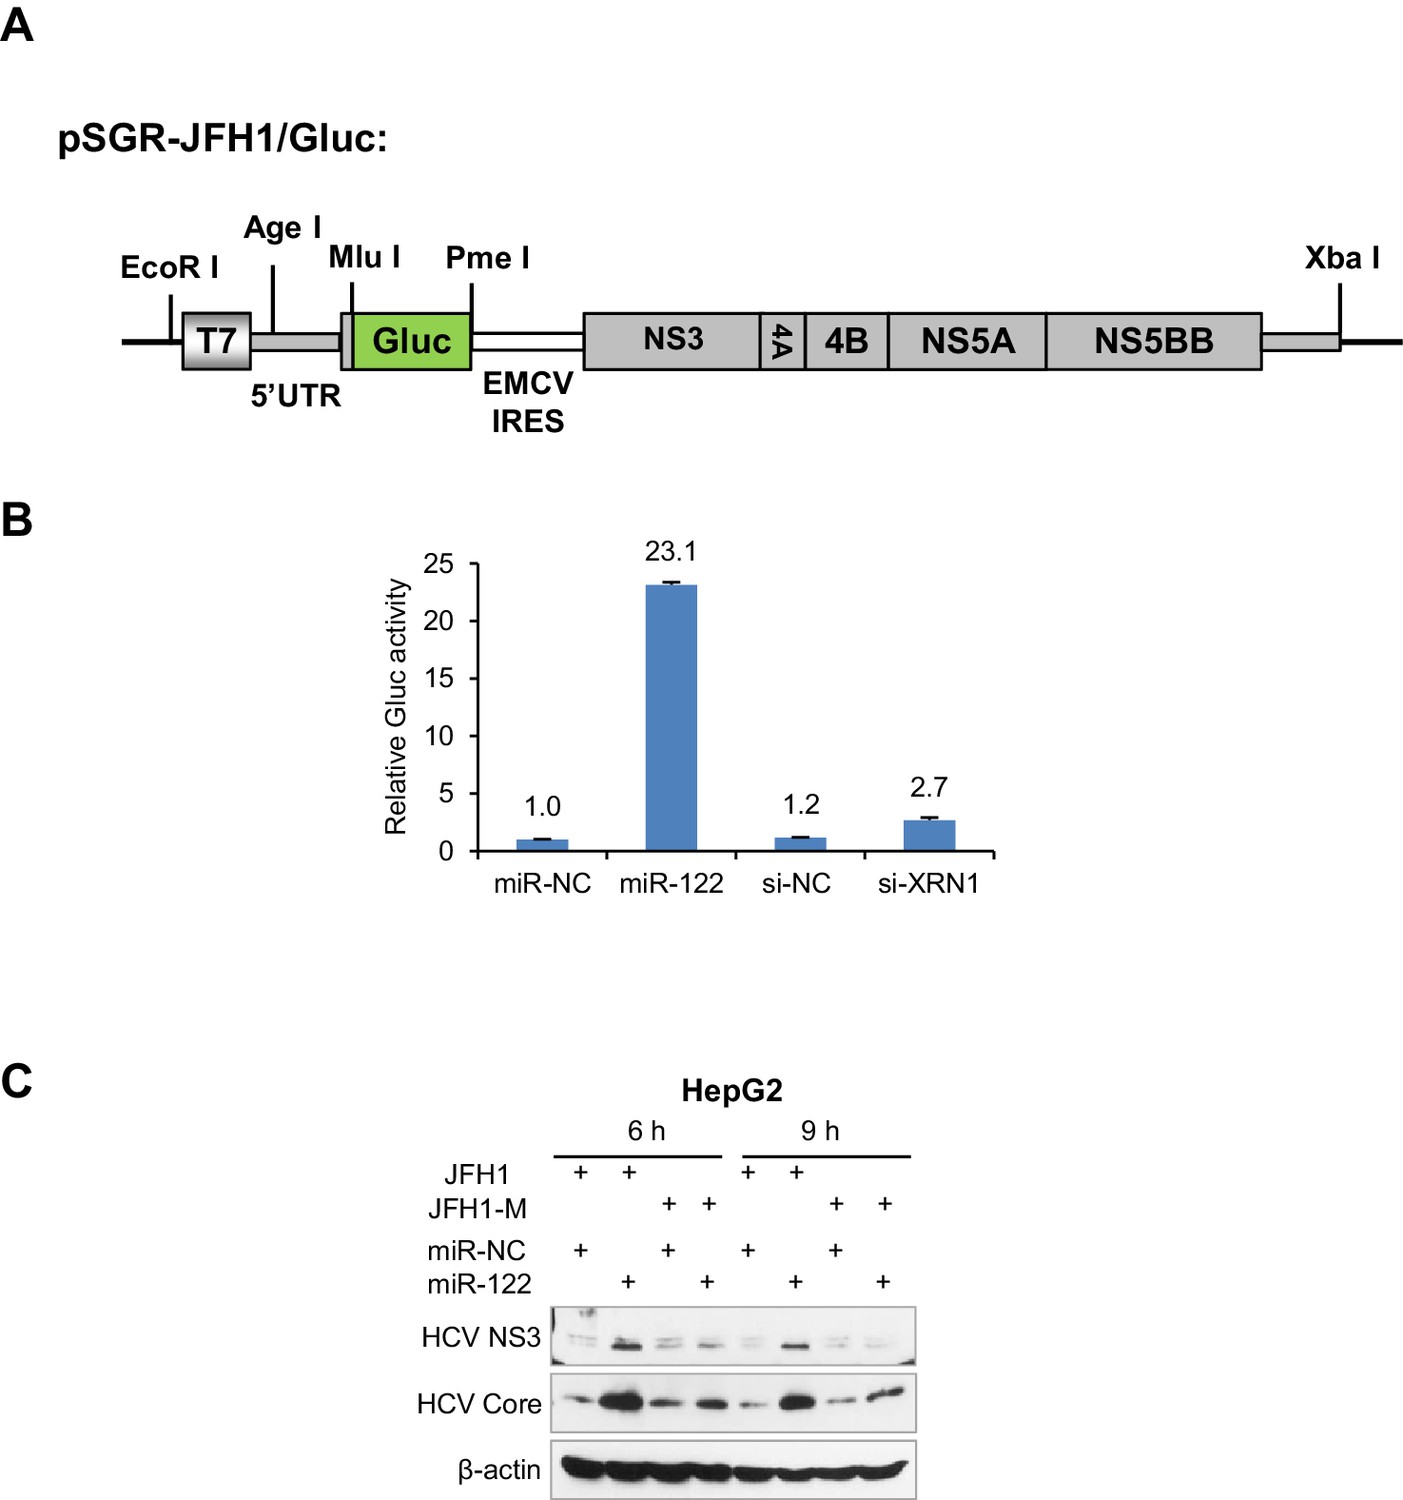
The effect of miR-122 on HCV translation.
(A) Structure of pSGR-JFH1/Gluc constructs. (B) Luciferase assays of the activity of Gluc reporter treated with miR-122 mimic or XRN1 siRNA. HepG2 cells were firstly treated with mimics or siRNAs for 48 hr and then transfected with SGR-JFH1/Gluc RNA for 24 hr. The activities of Gluc were measured and normalized to the level in miR-NC-treated cells. Data shown are mean +SD (n = 3). Gluc data are one experiment representative of three independent experiments (mean ± SEM of technical triplicates). (C) Comparing the effect of miR-122 on the translation of wildtype (JFH1) and mutant (JFH1-M) HCV.
Figure 3 with 2 supplements
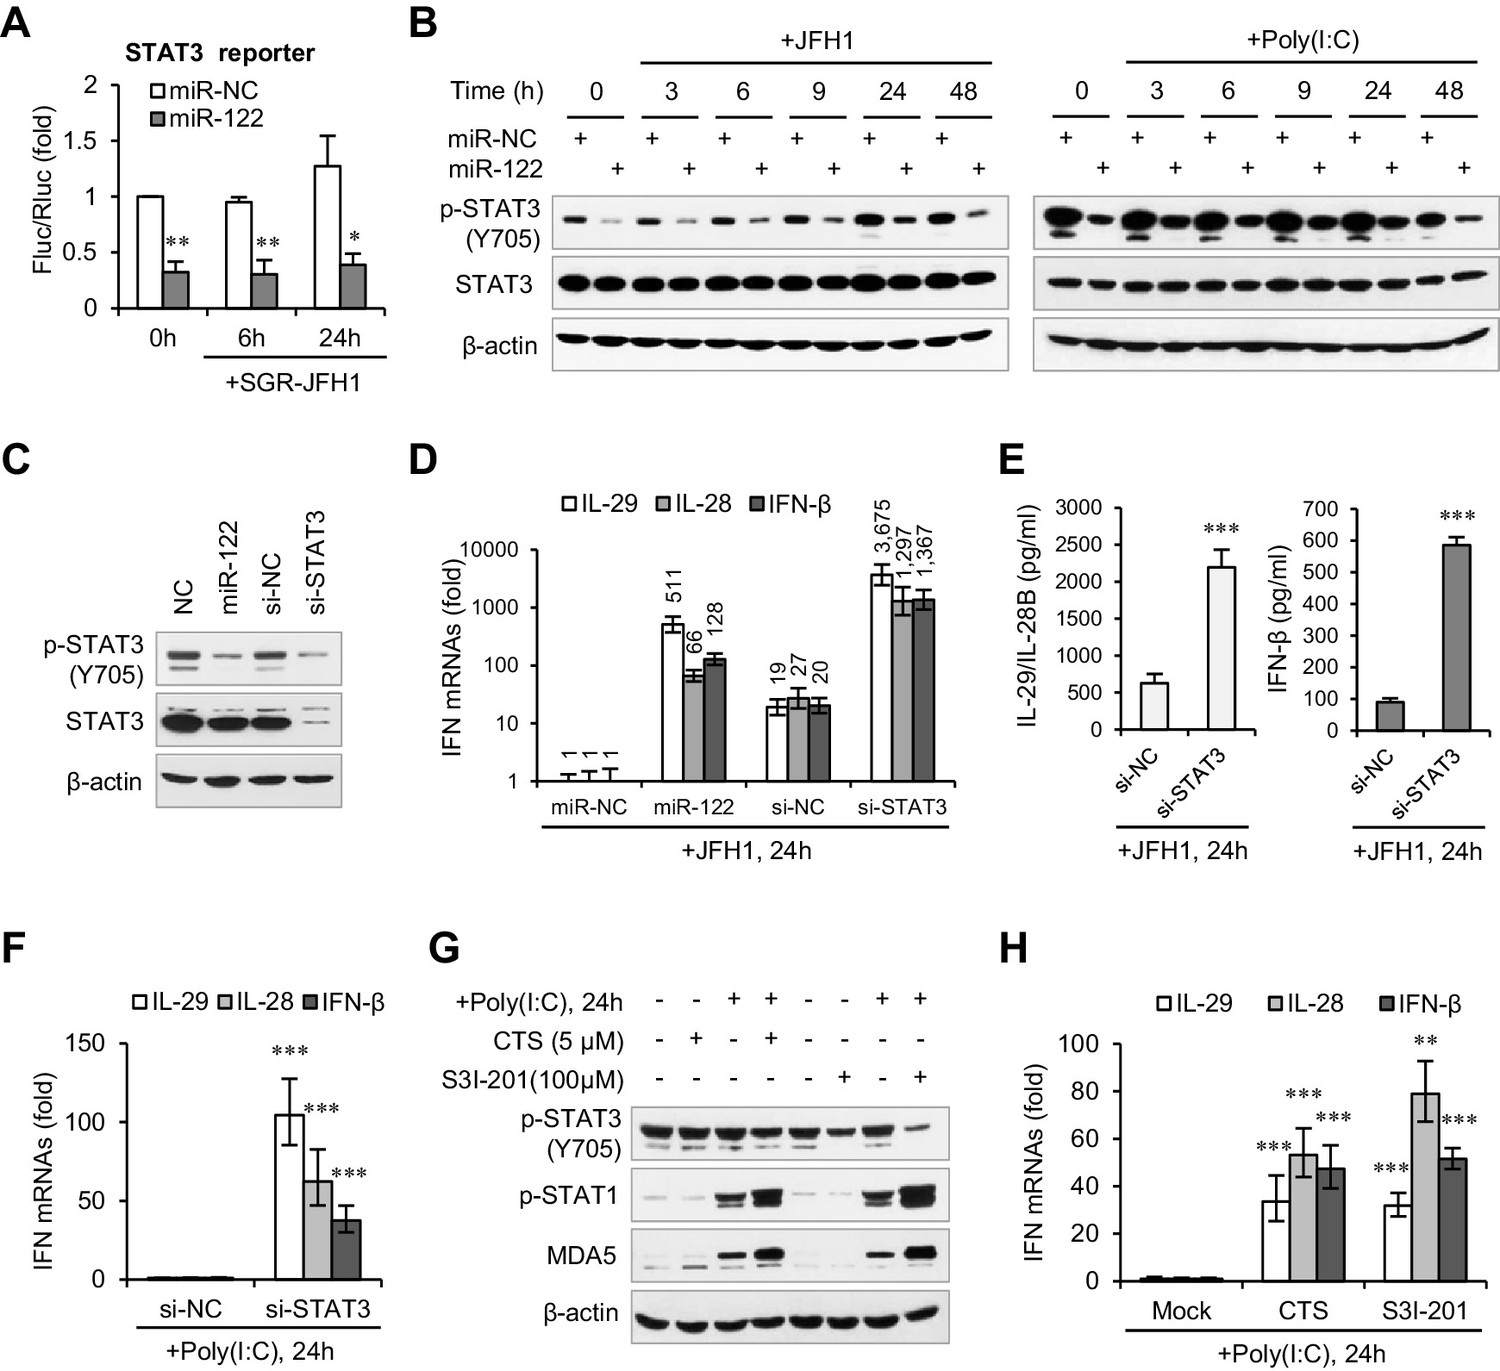
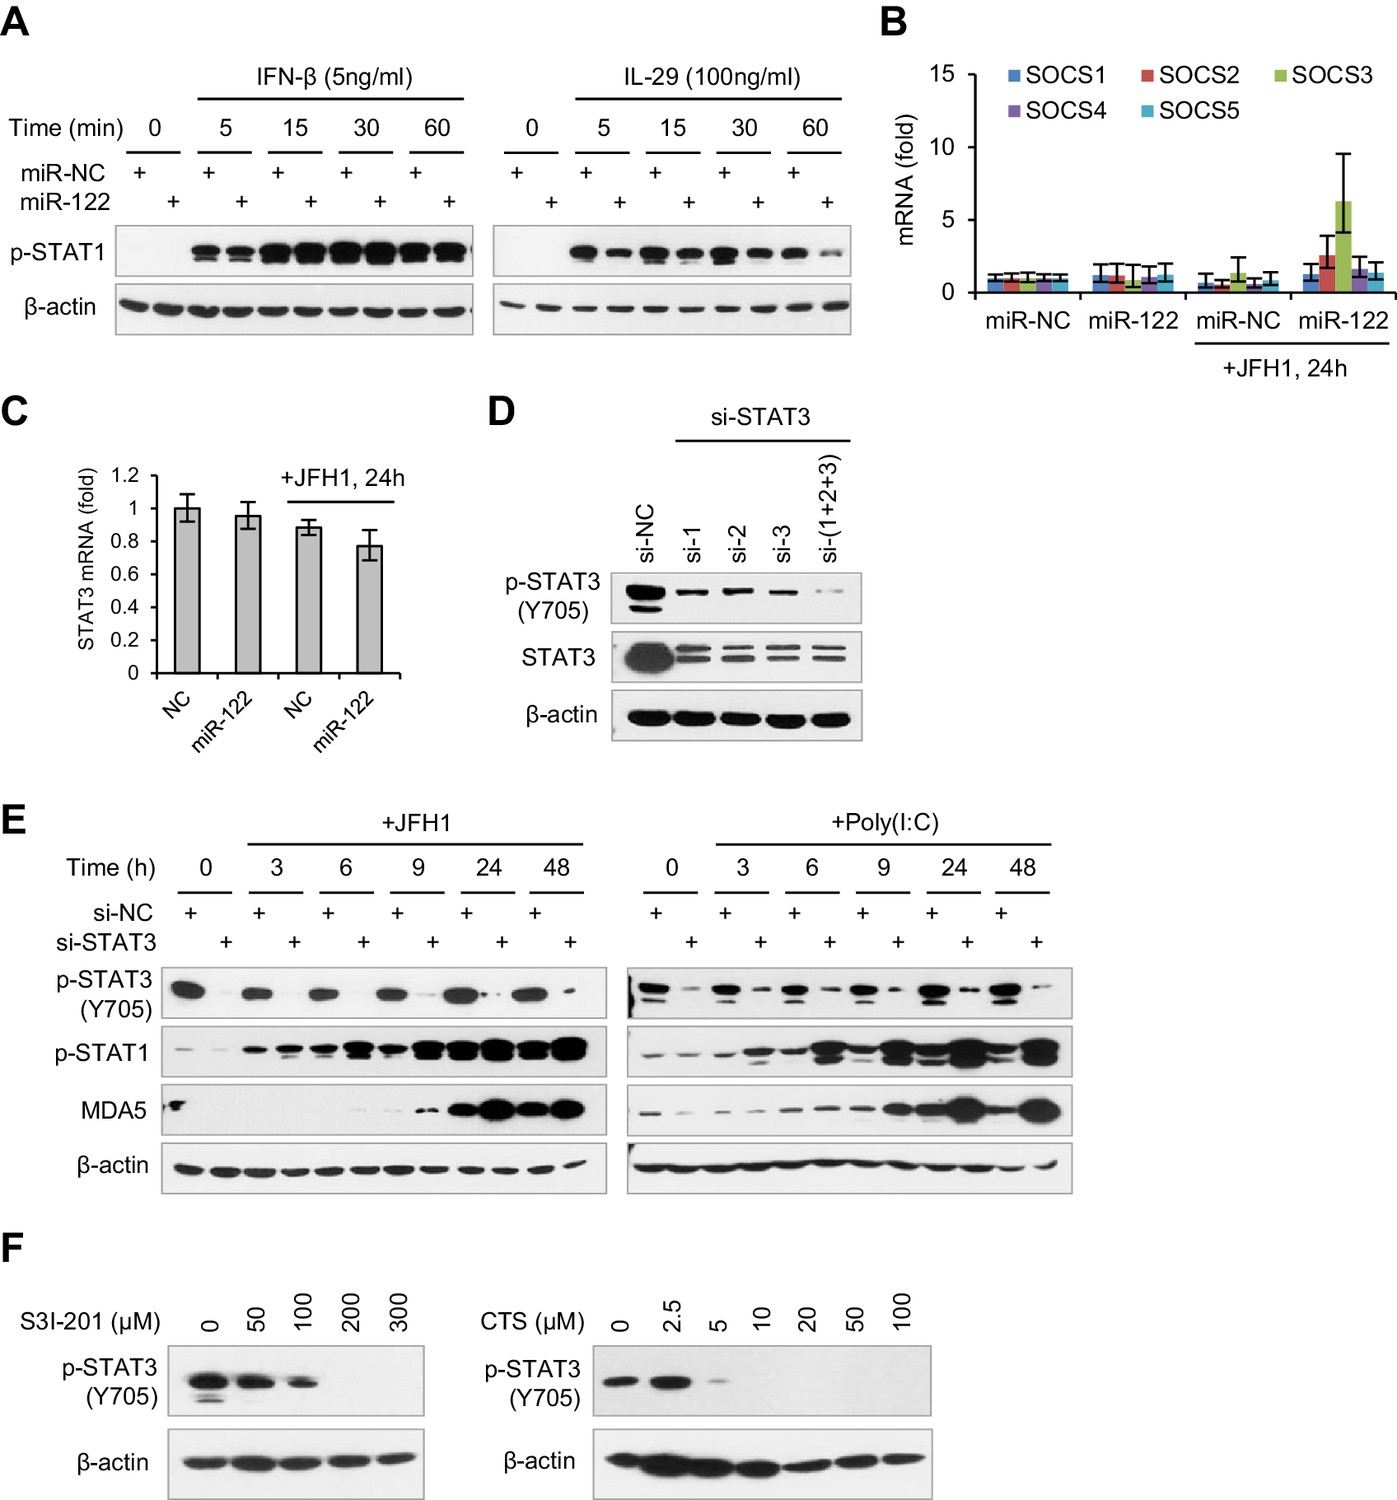
miR-122 enhances IFN response by suppressing p-STAT3.
(A) Luciferase activity of a STAT3-responsible promoter construct in HepG2 cells co-transfected with mimics (NC or miR-122) for 2 days, and then transfected with SGR-JFH1 RNA for the indicated time. (B) Western blot analysis of total and phosphorylated STAT3 (p-STAT3, Tyr705) in HepG2 cells first transfected with mimics (NC or miR-122) for 2 days, and then treated with JFH1 RNA or poly(I:C). (C) Analysis of STAT3 protein in HepG2 cells treated with mimics (NC or miR-122) or siRNAs (NC or STAT3). (D, E) Analysis of the mRNAs (D) and proteins (E) of IFNs in HepG2 cells treated with siRNAs (NC or STAT3) and then JFH1 RNA. Cells treated with miR-122 or NC mimics were used as controls in panel D. (F) Analysis of IFN mRNAs in HepG2 cells treated with siRNAs and then with poly(I:C). (G, H) Analysis of p-STAT1 protein and IFN mRNAs in HepG2 cells treated with either S3I-201 or cryptotanshinone (CST) for 24 hr, and then transfected with poly(I:C). Luciferase data are from three experiments (mean +SD). ELISA data are from two experiments (mean +SD). qRT-PCR data are from one experiment that was representative of three experiments (mean ± SEM of technical triplicates). *p < 0.05, **p < 0.01 and ***p < 0.001.
-
Figure 3—source data 1
qRT-PCR analysis of the five SOCS genes in HepG2 cells.
- https://doi.org/10.7554/eLife.41159.021
-
Figure 3—source data 2
Luciferase activity of a STAT3-responsible promoter construct in HepG2 cells.
- https://doi.org/10.7554/eLife.41159.022
-
Figure 3—source data 3
qRT-PCR analysis of STAT3 mRNA in HepG2 cells.
- https://doi.org/10.7554/eLife.41159.023
-
Figure 3—source data 4
qRT-PCR analysis of IFN mRNAs in HepG2 cells treated with siRNAs and then treated with JFH1.
- https://doi.org/10.7554/eLife.41159.024
-
Figure 3—source data 5
ELISA analysis of IFN proteins in HepG2 cells treated with siRNAs and then treated with JFH1.
- https://doi.org/10.7554/eLife.41159.025
-
Figure 3—source data 6
qRT-PCR analysis of IFN mRNAs in HepG2 cells treated with siRNAs and then treated with poly(I:C).
- https://doi.org/10.7554/eLife.41159.026
-
Figure 3—source data 7
qRT-PCR analysis of IFN mRNAs in HepG2 cells treated with either S3I-201 or cryptotanshinone (CST).
- https://doi.org/10.7554/eLife.41159.027
-
Figure 3—source data 8
qRT-PCR analysis of IFN mRNAs in Huh7 cells.
- https://doi.org/10.7554/eLife.41159.028
-
Figure 3—source data 9
qRT-PCR analysis of IFN mRNAs in Hep3B cells.
- https://doi.org/10.7554/eLife.41159.029
Figure 3—figure supplement 1
miR-122 regulates IFN response by repressing STAT3 phosphorylation.
(A) Analysis of p-STAT1 expression in HepG2 cells first transfected with mimics (NC or miR-122) for 2 days and then treated with IFN-β or IL-29 for 5–60 min. (B) qRT-PCR analysis of the five SOCS genes in HepG2 cells first treated with mimics for 2 days, and then transfected with JFH1 RNA for 24 hr. (C) qRT-PCR analysis of STAT3 mRNA in HepG2 cells, treated as in panel B. (D) Analysis of total and phosphorylated STAT3 in HepG2 cells treated with three independent siRNAs (si-1, si-2 and si-3) at a final concentration of 20 nM. (E) Analysis of p-STAT1 and MDA5 in HepG2 cells transfected with STAT3 siRNA and then treated with JFH1 RNA or poly(I:C). (F) Analysis of the dose-dependent effects of cryptotanshinone (CTS) and S3I-201 on p-STAT3. HepG2 cells were treated with either CST or S3I-201 at the indicated concentrations for 24 hr. qRT-PCR data are from one experiment that was representative of two (B) or three (C) independent experiments (mean ± SEM of technical triplicates).
Figure 3—figure supplement 2

The effects of miR-122 on p-STAT3 and IFN response in different liver cell lines.
(A) Western blot analysis of p-STAT1, p-STAT3 and IRF1 in Huh7 cells first transfected with mimics, siRNAs or inhibitors (for 2 days), and then treated with poly(I:C) for the indicated durations. T1, miR-NC (20nM); T2, miR-122 (20nM); T3, si-NC (20nM); T4, si-STAT3 (20nM); T5, NC inhibitor (40nM); T6, miR-122 inhibitor (40nM). (B) qRT-PCR analysis of IFN mRNA Huh7 cells, treated as in panel A. (C) Western blot analysis of p-STAT3 expression in cells transfected with mimics (NC or miR-122) for 2 days. (D) Analysis of the indicated proteins or IFN mRNAs in Hep3B cells, treated as in panels A and B. qRT-PCR data are one experiment that was representative of three independent experiments (mean ± SEM of technical triplicates).
Figure 4

STAT3 inhibits the transcriptional activation of IRF1.
(A) qRT-PCR analysis of IRF1, IRF3, NFKB1 and RELA in HepG2 cells first treated with mimics or siRNAs, and then transfected with or without JFH1 RNA for 24 hr. (B) Analysis of IRF1 and IRF3 protein expression in HepG2 cells treated with siRNAs and then JFH1 RNA. (C) qRT-PCR analysis of IRF1 and IFNs in HepG2 cells transfected with vectors expressing IRF1 or RFP (after 2 days). (D) Analysis of p-STAT1 and MDA5 in HepG2 cells transfected with IRF1 or RFP plasmids for 2 days, and then treated with poly(I:C) for 3–24 hr. (E) Analysis of p-STAT1 and MDA5 in HepG2 cells transfected with the indicated doses of IRF1 plasmids (0.05–1 μg/well in a 24-well-plate) for 2 days. (F) Analysis of IRF1, p-STAT1 and MDA5 in HepG2 cells transfected with plasmids expressing 7 HA-tagged transcription factors (after 2 days). HA-GFP was used as a negative control. (G) Analysis of IRF1 and p-STAT1 in HepG2 cells first transfected with STAT3 siRNA for 2 days, and then treated with IFN-β or IL-29 for 5–360 min. qRT-PCR data are from one experiment that was representative of three experiments (mean ± SEM of technical triplicates). *p<0.05, **p<0.01 and ***p<0.001.
-
Figure 4—source data 1
qRT-PCR analysis of transcription factors in HepG2 cells.
- https://doi.org/10.7554/eLife.41159.031
-
Figure 4—source data 2
qRT-PCR analysis of IRF1 and IFN in HepG2 cells transfected with IRF1 plasmid.
- https://doi.org/10.7554/eLife.41159.032
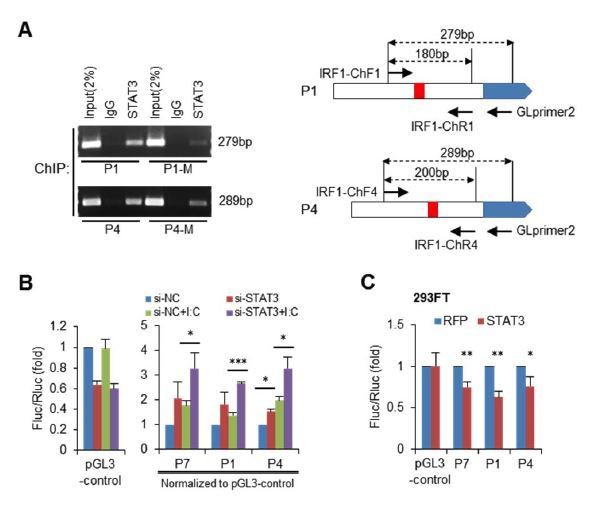
Figure 5 with 1 supplement
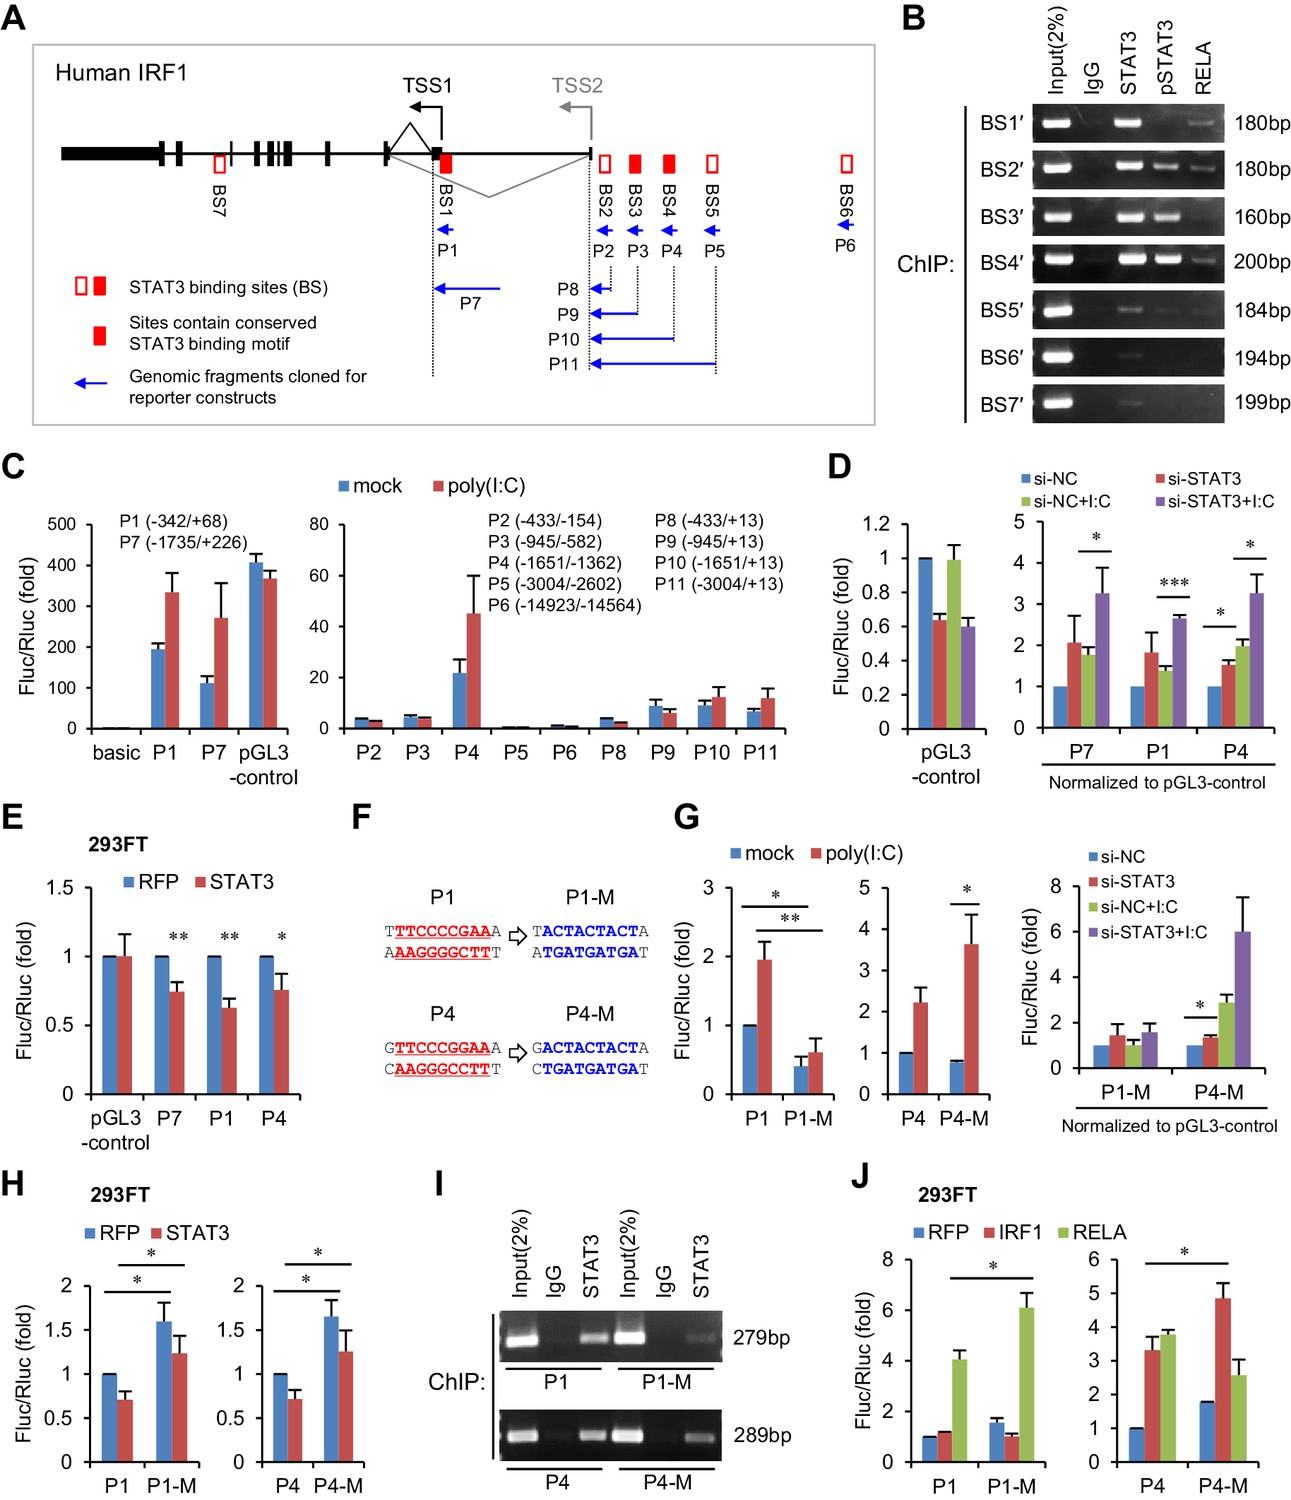
STAT3 directly binds to the promoter and enhancers of the IRF1 gene.
(A) Schematic representation of STAT3-binding clusters (BS1–BS7) on the human IRF1 gene. The DNA fragments selected for reporter constructs (P1–P11) are also shown. (B) ChIP-PCR assays show the binding of STAT3, p-STAT3 and RELA on the selected gene fragments of IRF1 in HepG2 cells. BS1′–BS7′ are short fragments (160–200 bp) corresponding to the BS1–BS7 clusters (290–410 bp), respectively. (C) Luciferase activity of different IRF1 promoter or enhancer constructs (P1–P11) in HepG2 cells treated with or without poly(I:C) (for 24 hr). The relative luciferase activities are the ratio of Firefly/Renilla luciferase normalized to the pGL3-basic vector (basic) without poly(I:C) stimulation. (D) Luciferase activity of P1, P7 and P4 constructs in HepG2 cells co-transfected with 20 nM STAT3 or control siRNAs for 2 days, and then treated with or without poly(I:C) for 24 hr. The fold changes of P1, P4 and P7 were normalized to the activity of the pGL3-control vector. (E) Luciferase activity of P1, P7 and P4 constructs in 293FT cells co-transfected with STAT3 or RFP plasmids (after 2 days). (F) The sequences of the STAT3 binding sites in wildtype (P1, P4) and mutant (P1-M, P4-M) constructs. (G, H) Luciferase activity of reporter constructs in HepG2 cells (G) or in 293FT cells (H) treated as in panels C, D and E, respectively. (I) ChIP-PCR assays show the binding of STAT3 to the wildtype or mutant reporter constructs in HepG2 cells. The forward primers that were used are the same as those used in panel B (BS1′ and BS4′), but GLprimer2 was used as the reverse primer. (J) Luciferase activity of reporter constructs in 293FT cells co-transfected with plasmids expressing the indicated proteins (after 2 days). Luciferase data are from two (C) or three (D, E, G, H and J) experiments (mean + SD). *p<0.05, **p<0.01 and ***p<0.001.
-
Figure 5—source data 1
Luciferase activity of different IRF1 promoter or enhancer constructs in HepG2 cells.
- https://doi.org/10.7554/eLife.41159.035
-
Figure 5—source data 2
Luciferase activity of constructs in HepG2 cells co-transfected with STAT3 or control siRNAs.
- https://doi.org/10.7554/eLife.41159.036
-
Figure 5—source data 3
Luciferase activity of constructs in 293FT cells co-transfected with STAT3 or RFP plasmids.
- https://doi.org/10.7554/eLife.41159.037
-
Figure 5—source data 4
Luciferase activity of mutant constructs in HepG2 cells.
- https://doi.org/10.7554/eLife.41159.038
-
Figure 5—source data 5
Luciferase activity of mutant constructs in 293FT cells.
- https://doi.org/10.7554/eLife.41159.039
-
Figure 5—source data 6
ChIP-qPCR assays of BS1′ and BS4′ fragments bound by STAT3.
- https://doi.org/10.7554/eLife.41159.040
-
Figure 5—source data 7
Luciferase activity of constructs in 293FT cells co-transfected with the indicated plasmids.
- https://doi.org/10.7554/eLife.41159.041
Figure 5—figure supplement 1
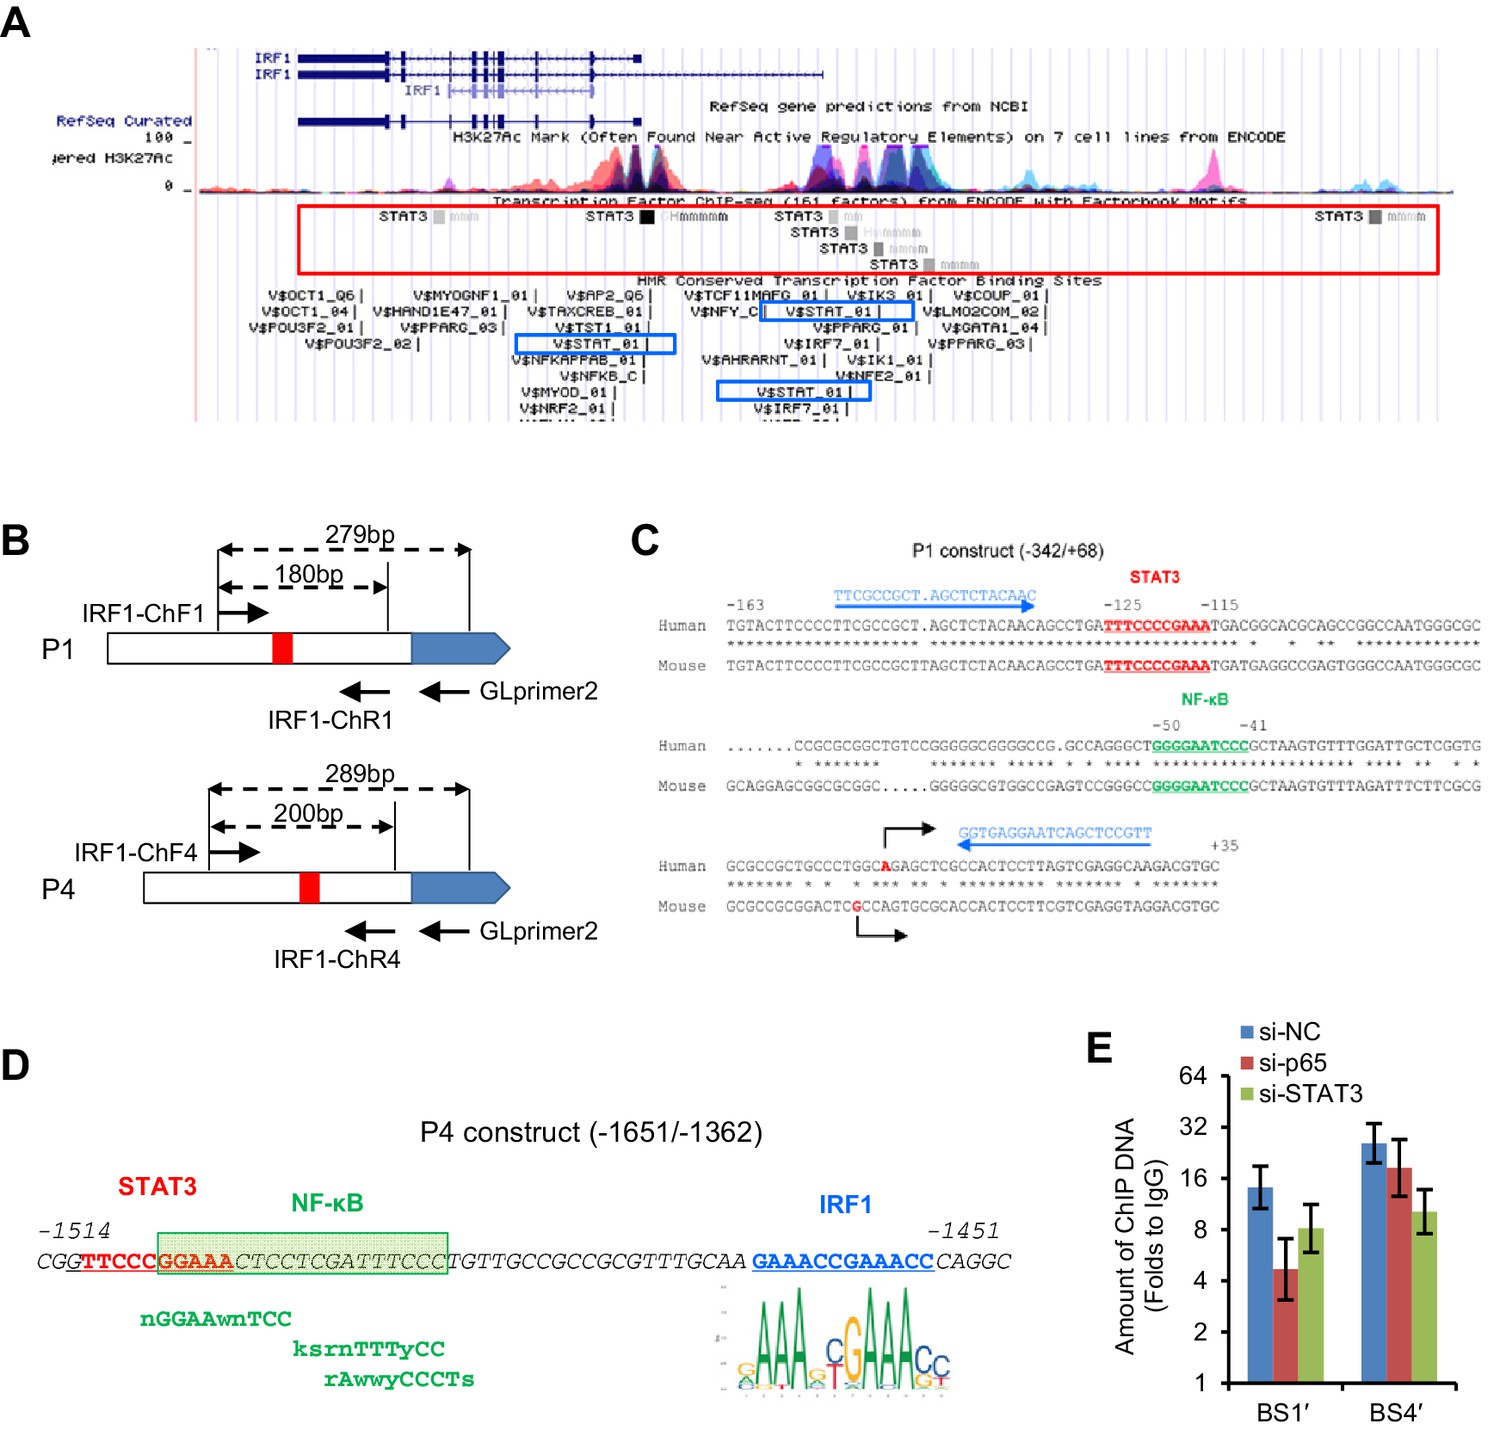
Predicted STAT3, NFκB and IRF1 binding sites on the human IRF1 gene.
(A) Screenshot (UCSC genome browser, GRCh37/hg19) showing STAT3-binding clusters from the ENCODE ChIP-seq data. Three conserved STAT-binding sites (in blue boxes) are predicted by the ‘TFBS Conserved’ tract. (B) Illustration of the locations of primers on the reporter constructs. (C) The sequences and locations of the STAT3- and NFκB-binding motifs within the P1 construct. The sequence and location of the PCR primers used for ChIP (referred to as BS1′) are shown in blue. (D) The sequences and locations of the STAT3-, NFκB- and IRF1-binding motifs within the P4 construct. Non-canonical NFκB-binding sites were predicted by AliBaba2.1. (E) ChIP-qPCR assays of BS1′ and BS4′ fragments bound by STAT3. HepG2 cells were transfected with the indicated siRNAs (20 nM) for 48 hr, and then harvested for ChIP using a STAT3 antibody or normal rabbit IgG. The amount of ChIP DNAs was first normalized to that of input DNAs and then further normalized to that of IgG groups. Data are from one experiment that was representative of three experiments (mean ± SEM of technical triplicates).
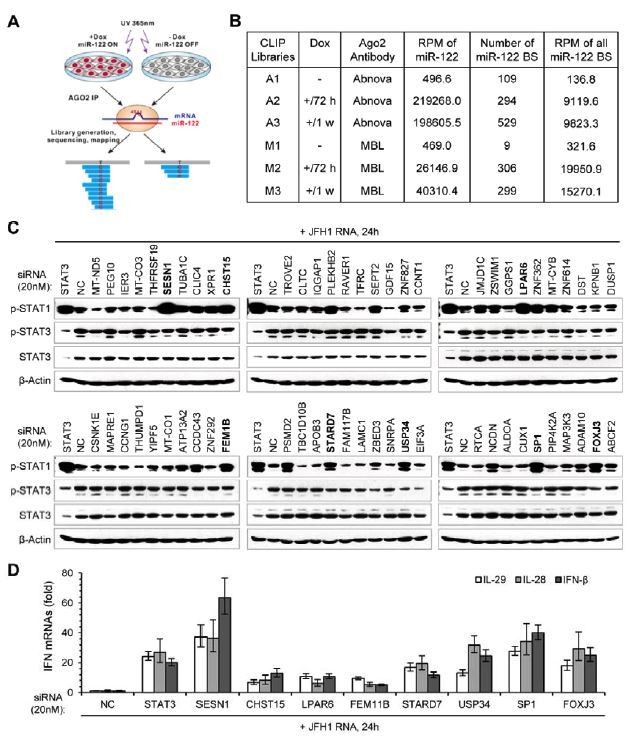
Figure 6 with 3 supplements
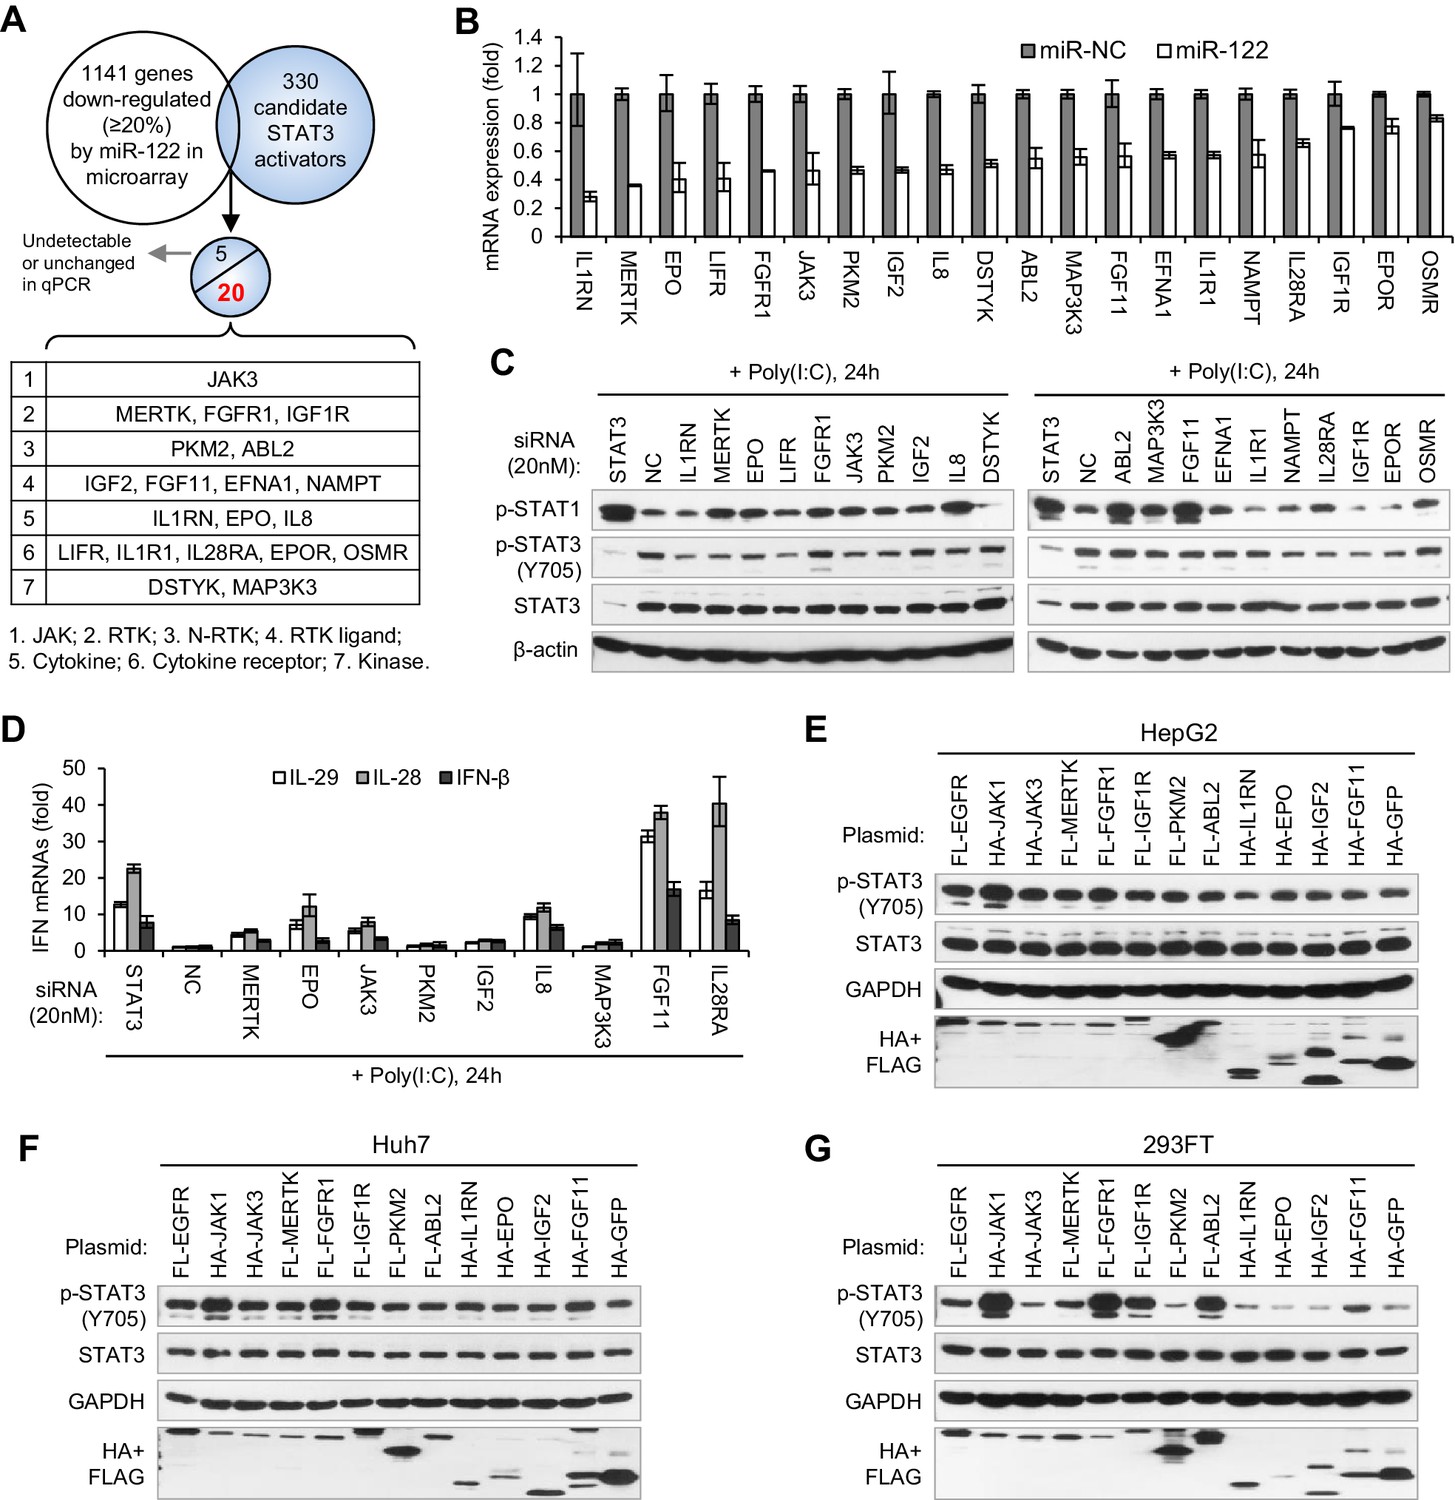
Identification of genes mediating miR-122 regulation of STAT3 and IFNs.
(A) Strategy for identifying genes that mediated miR-122 regulation of STAT3. (B) qRT-PCR analysis of the 20 genes in HepG2 cells transfected with miR-122 or NC mimics (50 nM). The genes are ranked by the repression ratio. (C) Analysis of p-STAT1, p-STAT3 and total STAT3 protein in HepG2 cells first treated with the indicated siRNAs (20 nM) for 2 days, and then transfected with poly(I:C) for 24 hr. (D) qRT-PCR analysis of IFNs in HepG2 cells treated with siRNAs and poly(I:C), as in panel C. (E–G) Analysis of total and phosphorylated STAT3 in HepG2 (E), Huh7 (F) and 293FT (G) cells transfected with plasmids expressing HA- or Flag (FL)-tagged proteins. HA-JAK1 and FL-EGFR plasmids were employed as positive controls. HA-GFP was used as a negative control. qRT-PCR data are from one experiment that was representative of three experiments (mean ± SEM of technical triplicates).
-
Figure 6—source data 1
qRT-PCR analysis of miR-122 levels in HepG2, Huh7, and miR-122-Tet-On cells.
- https://doi.org/10.7554/eLife.41159.046
-
Figure 6—source data 2
RT-PCR analysis of the 20 genes in HepG2 cells transfected with miR-122 or NC mimics.
- https://doi.org/10.7554/eLife.41159.047
-
Figure 6—source data 3
qRT-PCR analysis of the effectiveness of siRNAs.
- https://doi.org/10.7554/eLife.41159.048
-
Figure 6—source data 4
qRT-PCR analysis of IFNs in HepG2 cells treated with siRNAs and poly(I:C).
- https://doi.org/10.7554/eLife.41159.049
Figure 6—figure supplement 1
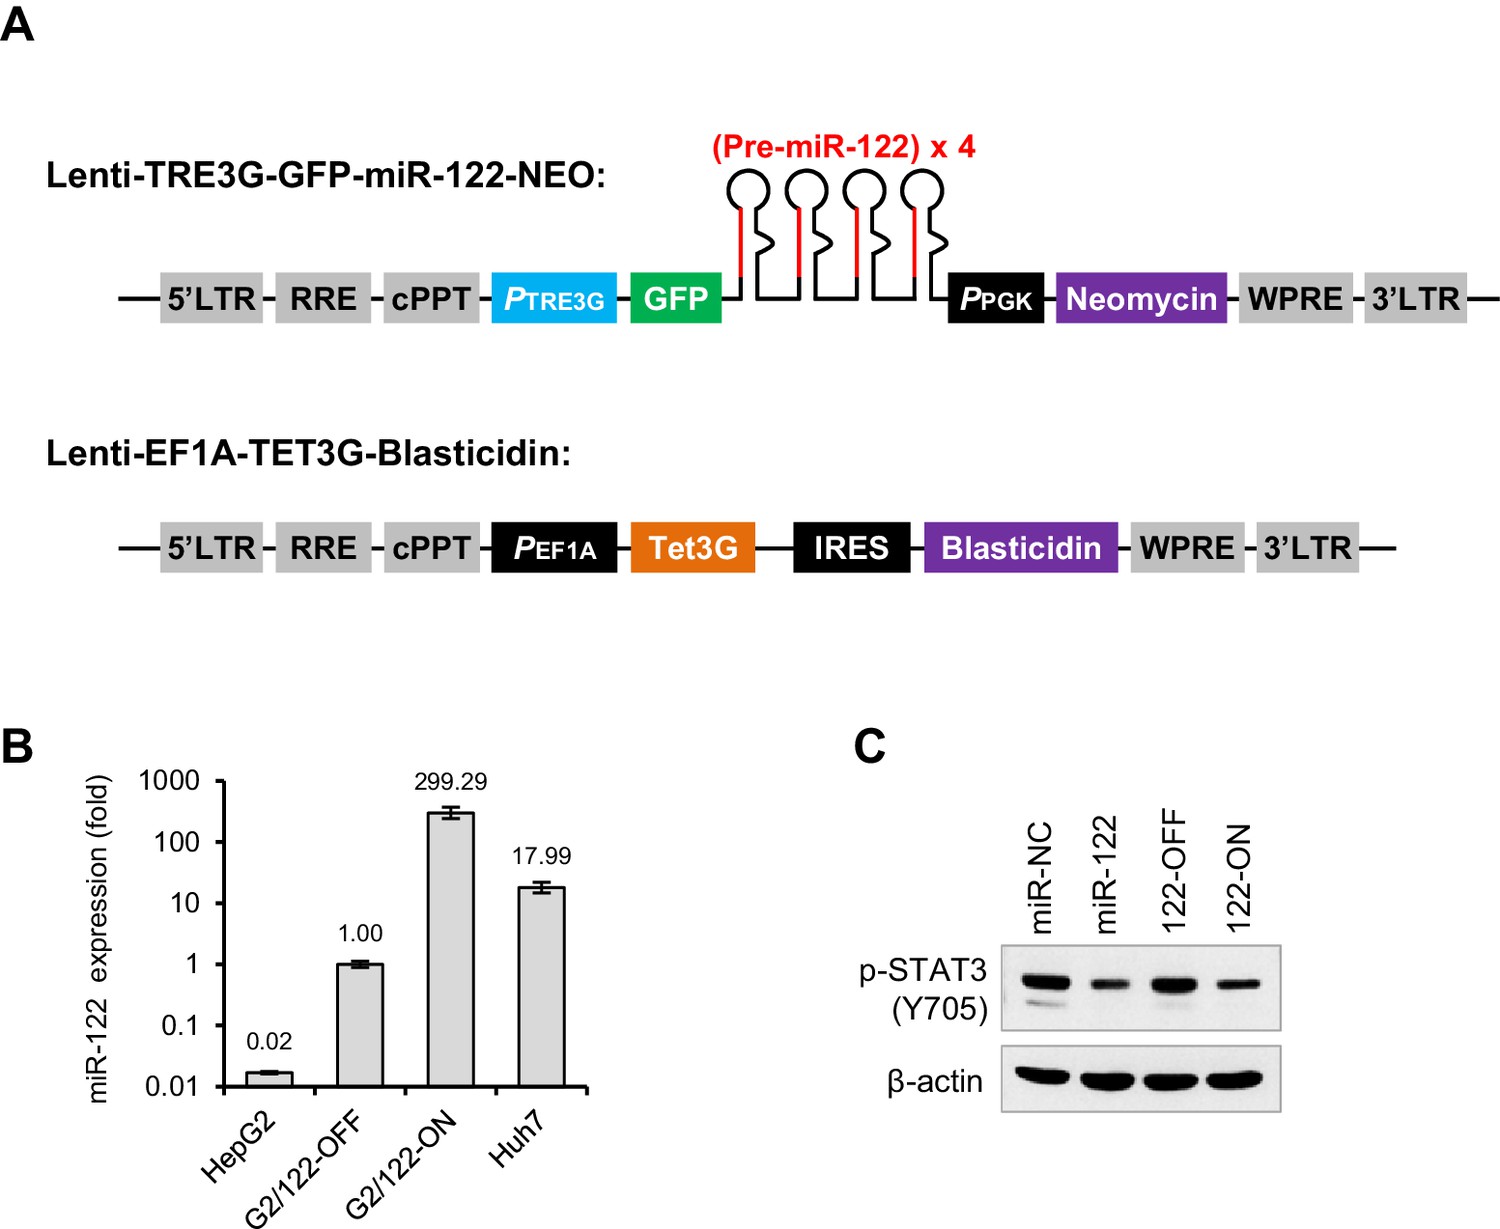
The miR-122-Tet-On cell line.
(A) Structure of the two lentiviral transfer vectors used for the expression of miR-122 hairpins (upper) and a Tet3G trans-activator (lower). (B) qRT-PCR analysis of miR-122 levels in HepG2, Huh7, miR-122-Tet-On cells with (G2/122-ON) or without (G2/122-OFF) doxycycline treatment (1000 ng/ml, 72 hr). (C) Comparison of the effect of transient and stable miR-122 overexpression on p-STAT3. qRT-PCR data are from one experiment that was representative of two independent experiments (mean ± SEM of technical triplicates).
Figure 6—figure supplement 2
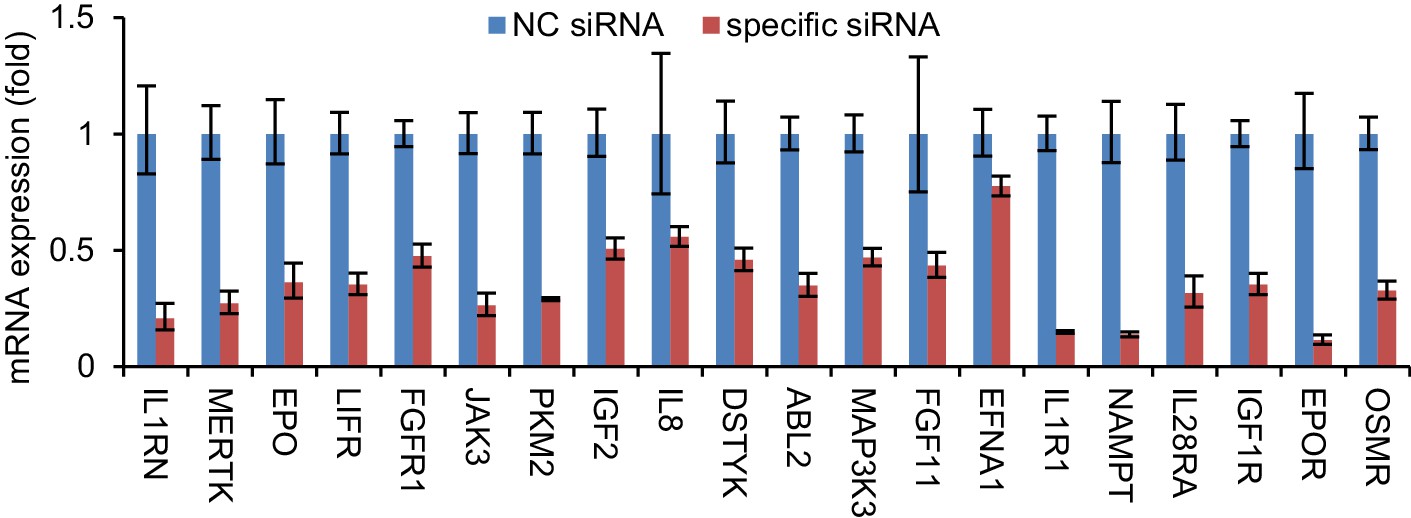
qRT-PCR analysis of the effectiveness of siRNAs in reducing the expression of the corresponding genes.
The expression of each gene was normalized to its level in si-NC-treated cells. qRT-PCR data are from one experiment that was representative of two independent experiments (mean ± SEM of technical triplicates).
Figure 6—figure supplement 3

The effects of eight tyrosine kinases on the phosphorylation of STAT3 and STAT1.
Cells were transfected with the indicated plasmids for 2 days. HA-GFP was employed as a negative control.
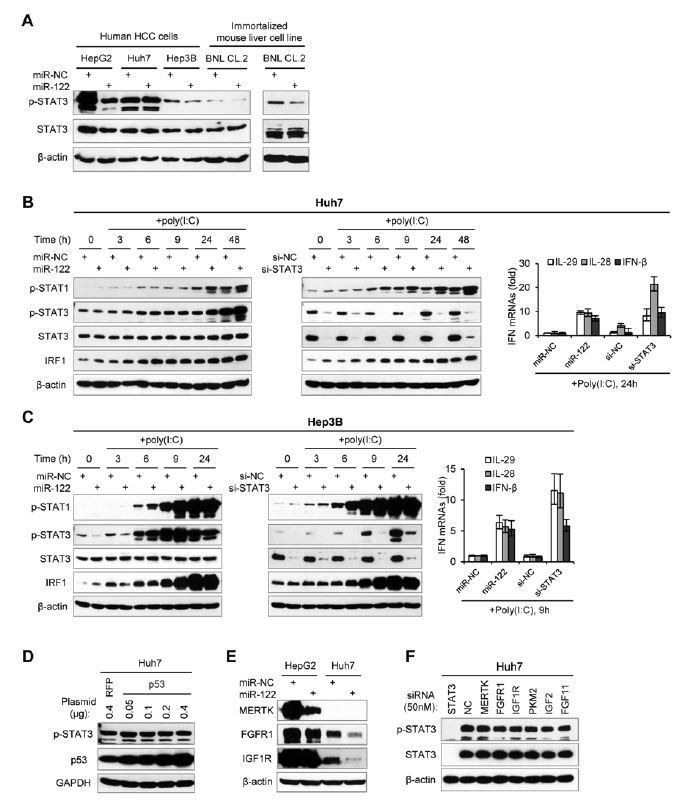
Figure 7 with 2 supplements
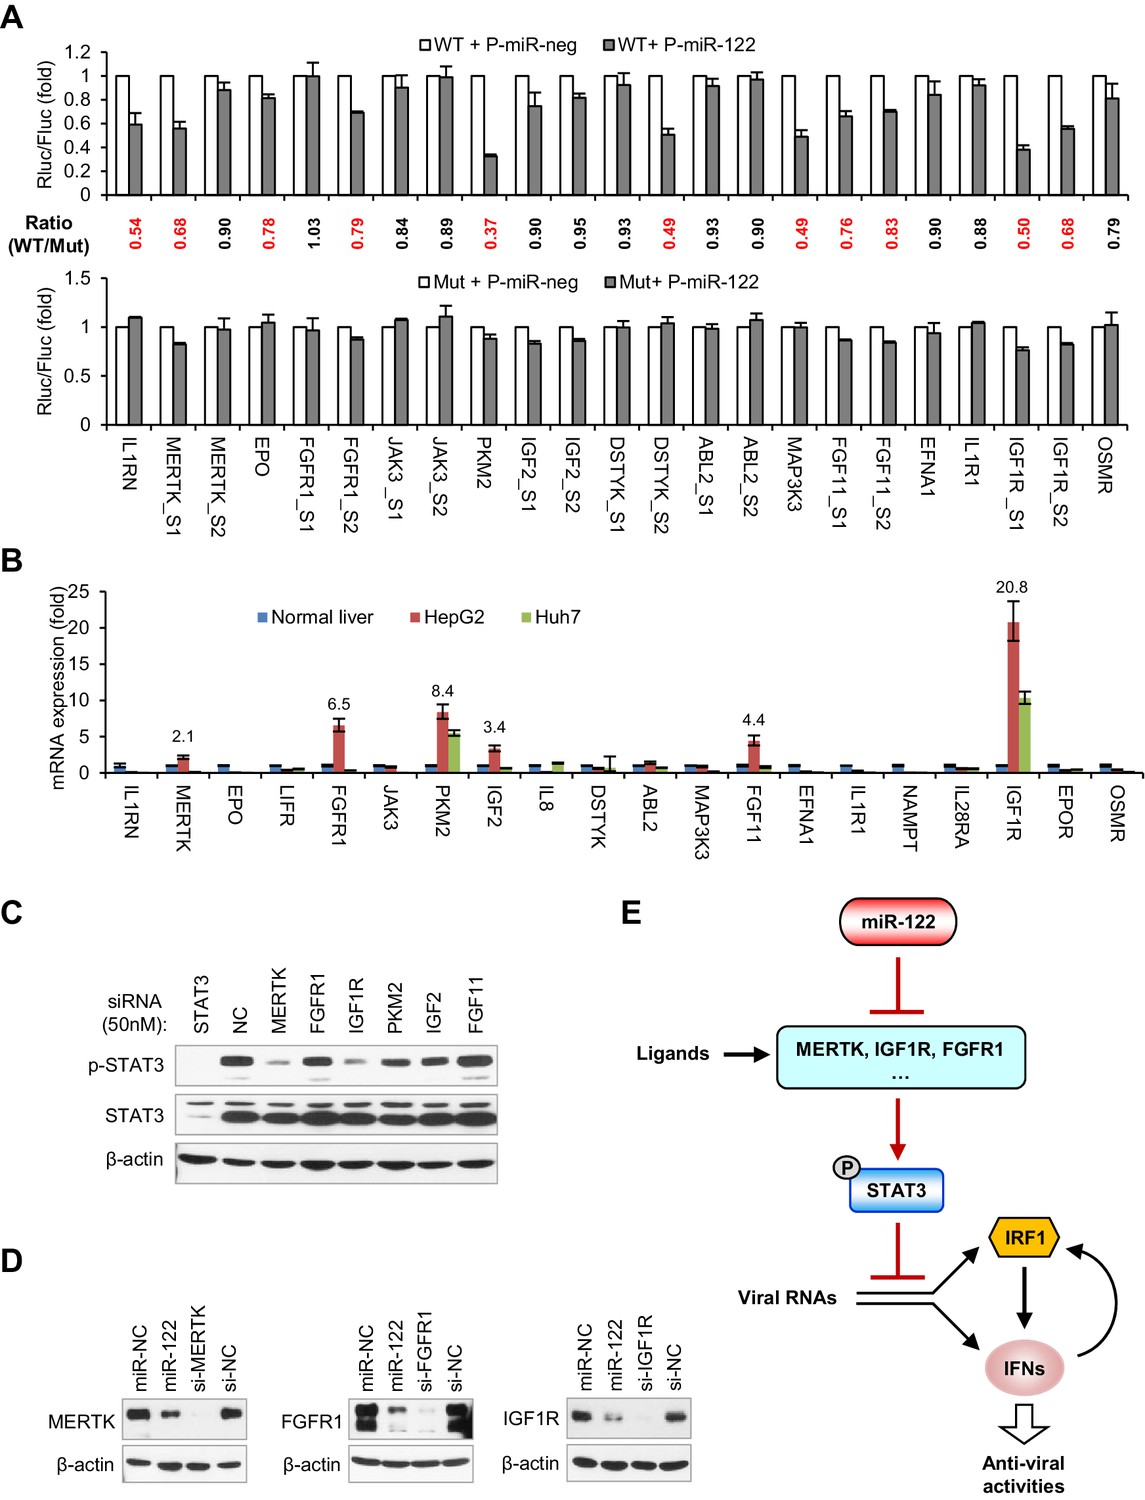
miR-122 targets RTK signaling to regulate STAT3 phosphorylation.
(A) Luciferase activity of wildtype (WT) and mutant (Mut) reporter constructs in 293FT cells co-transfected with pcDNA6.2-miR-122 (P-miR-122) or pcDNA6.2-miR-neg (P-miR-neg) plasmids. The relative luciferase activities are the ratio of Renilla/Firefly luciferase normalized to that in P-miR-neg groups. The repression ratios (WT/Mut) of each site are shown and sites that significantly (p<0.05) repressed by miR-122 are shown in red. (B) qRT-PCR analysis of the 20 genes in normal human liver, HepG2 and Huh7. The expression of each gene was normalized to its level in normal liver. (C) Analysis of total and phosphorylated STAT3 in HepG2 cells transfected with indicated siRNAs (50 nM) for 2 days. (D) Analysis of MERTK, FGFR1 and IGF1R expression in HepG2 cells treated with miR-122 mimics or specific siRNAs (for 2 days). (E) Illustration of the mechanism by which miR-122 regulates STAT3 phosphorylation and the IFN response. Phosphorylated STAT3 can inhibit IRF1 transcriptional activation and thus represses the induction of IFNs upon viral infection. In normal hepatocytes, miR-122 strongly limits the phosphorylation of STAT3 by targeting three RTKs and other STAT3 activators, enabling a robust IFN response upon infection. qRT-PCR data are from one experiment that was representative of three experiments (mean ± SEM of technical triplicates). Luciferase data are from three experiments (mean +SD).
-
Figure 7—source data 1
Luciferase activity of reporter constructs in 293FT cells co-transfected with miR-122 or negative control plasmids.
- https://doi.org/10.7554/eLife.41159.053
-
Figure 7—source data 2
qRT-PCR analysis of the 20 genes in normal human liver, HepG2 and Huh7.
- https://doi.org/10.7554/eLife.41159.054
-
Figure 7—source data 3
qRT-PCR analysis of the effects of STAT3 knockdown on the expression of 20 genes in HepG2 cells.
- https://doi.org/10.7554/eLife.41159.055
Figure 7—figure supplement 1
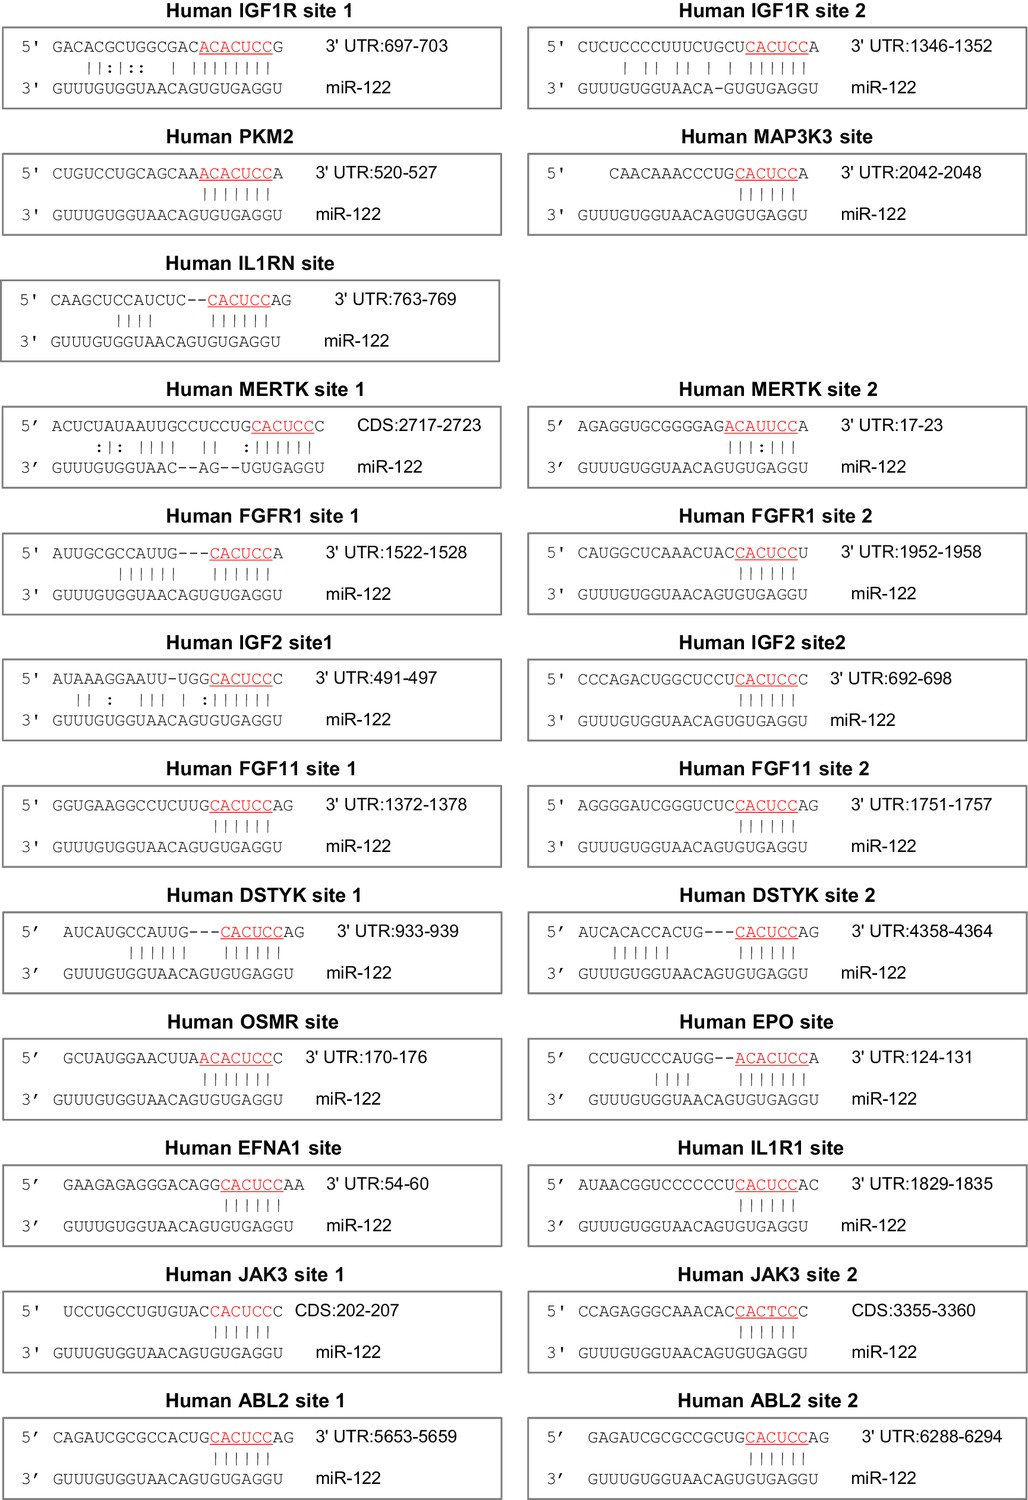
miR-122-binding sites in the 3′UTR or the CDS of candidate genes, predicted by TargetScan or RegRNA.
The binding sites of IGF1R (S1 and S2), PKM2 and MAP3K3 have been reported to be functional.
Figure 7—figure supplement 2

qRT-PCR analysis of the effects of STAT3 knockdown on the expression of 20 genes in HepG2 cells transfected with 20 nM siRNAs (NC or STAT3) for 2 days.
Data are from one experiment that was representative of two independent experiments (mean ± SEM of technical triplicates).
Author response image 1
Author response image 2
Author response image 3

Author response image 4
Author response image 5

Tables
Key resources table
| Reagent type (species) or resource | Designation | Source or reference | Identifiers | Additional information |
|---|---|---|---|---|
| Cell line (Homo sapiens) | HepG2 | http://www.cellbank.org.cn/ | Cat. #:TCHu 72, RRID:CVCL_0027 | |
| Cell line (H. sapiens) | Huh7 | Dr. Shi-Mei Zhuang (Sun Yat-sen University, China) | ||
| Cell line (H. sapiens) | Huh7.5.1 | PMID: 15939869 | RRID:CVCL_E049 | Dr. Jin Zhong (Institute Pasteur of Shanghai, China) |
| Cell line (H. sapiens) | 293FT | Invitrogen | Cat. #: R700-07, RRID:CVCL_6911 | |
| Cell line (H. sapiens) | Hep3B | Dr. Shu-Juan Xie (Sun Yat-sen University, China) | ||
| Cell line (Mus musculus) | BNL CL.2 | http://www.cellbank.org.cn/ | RRID:CVCL_4383 | ATCC TIB-73,https://www.atcc.org/ |
| Cell line (H. sapiens) | miR-122-Tet-On HepG2 | This paper | Figure 6—figure supplement 1; cell lines and tissue sample in the 'Materials and methods' | |
| Antibody | Rabbit anti-Phospho-STAT1 (Tyr701), (D4A7) Rabbit mAb | Cell signaling | Cat. #: 7649, RRID:AB_10950970 | WB (1:3000) |
| Antibody | Rabbit anti-Phospho-STAT3 (Tyr705), (D3A7) Rabbit mAb | Cell Signaling | Cat. #: 9145, RRID:AB_2491009 | WB (1:3000) |
| Antibody | Mouse anti-Phospho-STAT3 (Tyr705), (B-7) mouse mAb | Santa Cruz Biotechnology | Cat. #: sc-8059, RRID:AB_628292 | IP (2 ug/500 ul) |
| Antibody | Rabbit anti-STAT3, polyclonal | Santa Cruz Biotechnology | Cat. #: sc-482, RRID:AB_632440 | WB (1:10000), IP (2 ug/500 ul) |
| Antibody | Rabbit anti-IRF1, (D5E4) Rabbit mAb | Cell signaling | Cat. #: 8478, RRID:AB_10949108 | WB (1:2000) |
| Antibody | Rabbit anti-IRF3, (D6I4C) Rabbit mAb | Cell signaling | Cat. #: 11904, RRID:AB_2722521 | WB (1:2000) |
| Antibody | Rabbit anti-RELA, polyclonal | Santa Cruz Biotechnology | Cat. #: sc-372, RRID:AB_632037 | IP (2 ug/500 ul) |
| Antibody | Rabbit anti-MDA5, (D74E4) Rabbit mAb | Cell signaling | Cat. #: 5321, RRID:AB_10694490 | WB (1:3000) |
| Antibody | Mouse anti-HCV NS3, [H23] mouse mAb | Abcam | Cat. #: ab13830, RRID:AB_300673 | WB (1:3000, in 1% milk/TBST) |
| Antibody | Mouse anti-HCVcore, (C7-50) mouse mAb | Thermo Fisher | Cat. #: MA1-080, RRID:AB_325417 | WB (1:3000) |
| Antibody | Mouse anti-MERTK, (B-1) mouse mAb | Santa Cruz Biotechnology | Cat. #: sc-365499, RRID:AB_10843860 | WB (1:2000) |
| Antibody | Rabbit anti-FGFR1, (D8E4) Rabbit mAb | Cell signaling | Cat. #: 9740, RRID:AB_11178519 | WB (1:2000) |
| Antibody | Rabbit anti-IGF1Rβ, (111A9) Rabbit mAb | Cell signaling | Cat. #: 3018, RRID:AB_10848600 | WB (1:2000) |
| Recombinant DNA reagent | pJFH1 | PMID: 15951748 | Dr. Takaji Wakita (National Institute of Infectious Diseases) | |
| Recombinant DNA reagent | pSGR-JFH1 | PMID: 15951748 | Dr. Takaji Wakita (National Institute of Infectious Diseases) | |
| Recombinant NA reagent | pJFH1-M (S1-S2-p6m) | This paper | Viral constructs and viral RNA preparation in the 'Materials and methods' | |
| Recombinant DNA reagent | pSGR-JFH1/ Gluc | This paper | Viral constructs and viral RNA preparation in the 'Materials and methods' | |
| Recombinant DNA reagent | pGL3-IRF1-P1 | This paper | Constructs in the'Materials andmethods' | |
| Recombinant DNA reagent | pGL3-IRF1-P1-M | This paper | Constructs in the'Materials andmethods' | |
| Recombinant DNA reagent | pGL3-IRF1-P7 | This paper | Constructs in the'Materials andmethods' | |
| Recombinant DNA reagent | pGL3-IRF1-P4 | This paper | Constructs in the'Materials and methods' | |
| Recombinant DNA reagent | pGL3-IRF1-P4-M | This paper | Constructs in the'Materials andmethods' |
Author response table 1
| Candidate STAT3 activators that predicted to be miR-122 targets in CLIP-seq data | |
|---|---|
| Our CLIP-seq data | Published CLIP-seq data |
| ABL1, ABL2, ERBB3, IFNAR2, IL18BP, JAK1, MAP3K3, PRLR | ABL1, ABL2, ANGPTL4, CHUK, CSF1, CXCL12, DDR2, DSTYK, EFNA1, EFNA3, EFNB2, EPHB2, ERBB3, ERBB4, FGF18, FGF5, FGFR1, FGFR3, IFNGR2, IGF1R, IGF2R, IL18, IL18BP, IL1R1, IL1RL1, IL1RN, IL6ST, IL7R, JAK1, KITLG, LIF, MAP3K2, MAP3K3, MAPK4, MET, MST1R, NTRK2, OSMR, PDGFA, PDGFB, PRLR, RET, ROR1, ROR2, SRC, TEX14, VEGFB |
Additional files
-
Supplementary file 1
The 330 candidate STAT3 regulators.
- https://doi.org/10.7554/eLife.41159.056
-
Supplementary file 2
The expression of 25 candidate STAT3 activators in microarray data.
- https://doi.org/10.7554/eLife.41159.057
-
Supplementary file 3
Candidate STAT3 activators that are predicted to be miR-122 targets in published CLIP-seq data.
The candidate miR-122 targets and binding sites were predicted by starbase (http://starbase.sysu.edu.cn/). The targets shown are 47 genes from among the 330 candidate STAT3 regulators.
- https://doi.org/10.7554/eLife.41159.058
-
Supplementary file 4
Oligonucleotides.
- https://doi.org/10.7554/eLife.41159.059
-
Transparent reporting form
- https://doi.org/10.7554/eLife.41159.060
Download links
A two-part list of links to download the article, or parts of the article, in various formats.
Downloads (link to download the article as PDF)
Open citations (links to open the citations from this article in various online reference manager services)
Cite this article (links to download the citations from this article in formats compatible with various reference manager tools)
MicroRNA-122 supports robust innate immunity in hepatocytes by targeting the RTKs/STAT3 signaling pathway
eLife 8:e41159.
https://doi.org/10.7554/eLife.41159


