Sleep-promoting effects of threonine link amino acid metabolism in Drosophila neuron to GABAergic control of sleep drive
- Ulsan National Institute of Science and Technology, Republic of Korea
Figures
Figure 1 with 8 supplements
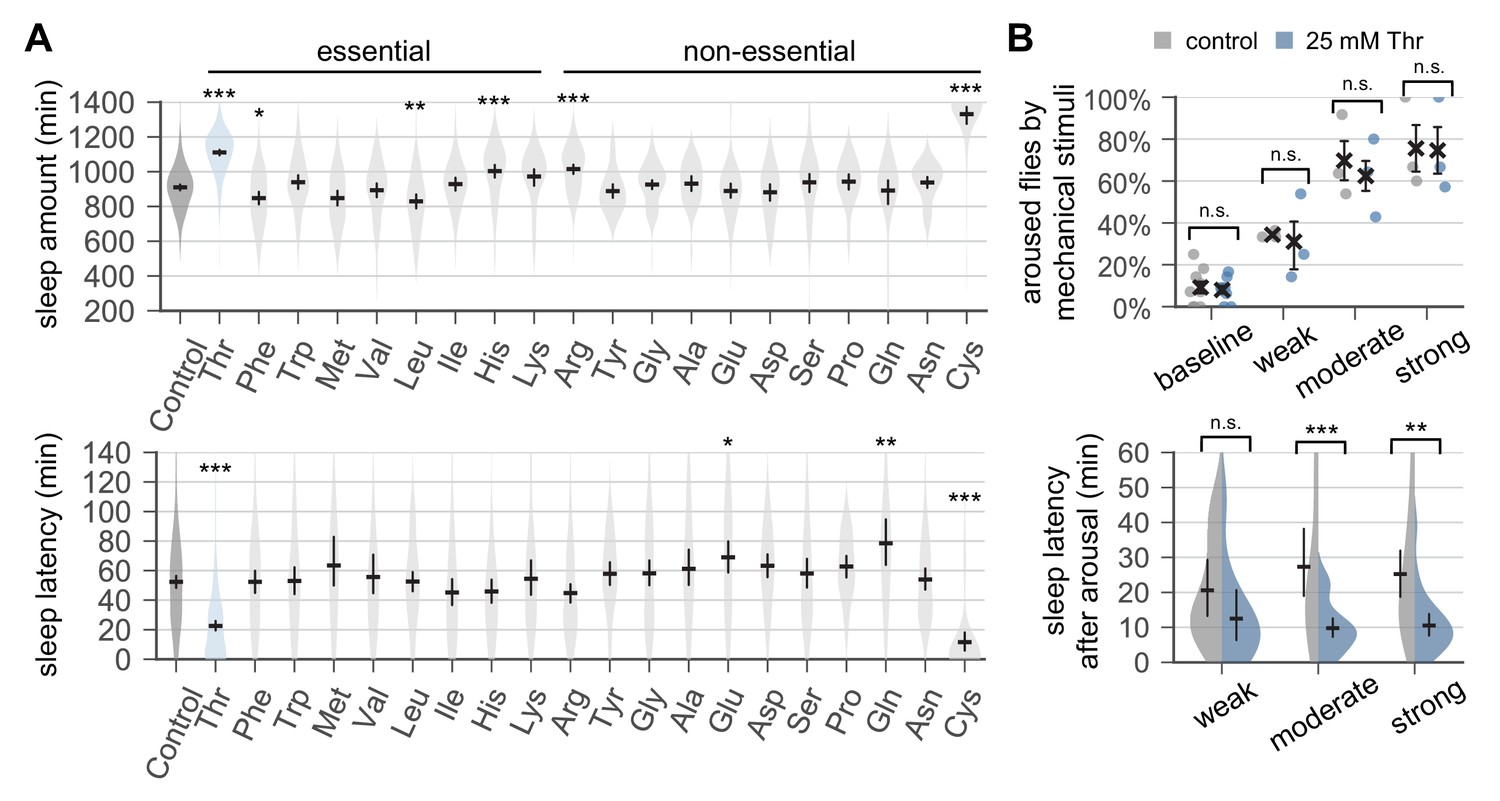
Dietary threonine promotes sleep and facilitates sleep onset.
(A) Wild-type male flies were individually loaded on to 5% sucrose food containing 17.5 mM of each amino acid (day 0) and entrained in LD cycles at 25°C. Total sleep amount (top) and latency to sleep onset after lights-off (bottom) were calculated in individual flies on day 4 and averaged for each amino acid. Essential and non-essential amino acids are grouped separately as shown at the top. The width of a violin plot indicates the density of samples. The violins are restricted by the observed ranges. Error bars indicate mean ±95% confidence interval (CI) (n = 29–213). *p<0.05, **p<0.01, ***p<0.001 to control (i.e., no amino acid supplement) as determined by one-way ANOVA, Dunnett’s multiple comparisons test. (B) Control- and threonine-fed flies were awakened by a range of mechanical stimuli 4 hr after lights-off on day 4. Aroused flies were defined if they displayed no activity for >5 min prior to the stimulus but showed any locomotor response within 10 min. The percentage of aroused flies per condition was averaged from three independent experiments (top). Error bars indicate mean ± SEM (n = 3). Sleep latency after arousal was calculated in individual flies and averaged for each condition (bottom). Error bars indicate mean ±95% CI (n = 12–27). Two-way ANOVA detected significant effects of dietary threonine on sleep latency after arousal (F[1,119]=20.43, p<0.0001) but not on % aroused flies (F[1,16]=0.227, p=0.6402). n.s., not significant; **p<0.01, ***p<0.001 as determined by Bonferroni’s multiple comparisons test.
Figure 1—figure supplement 1
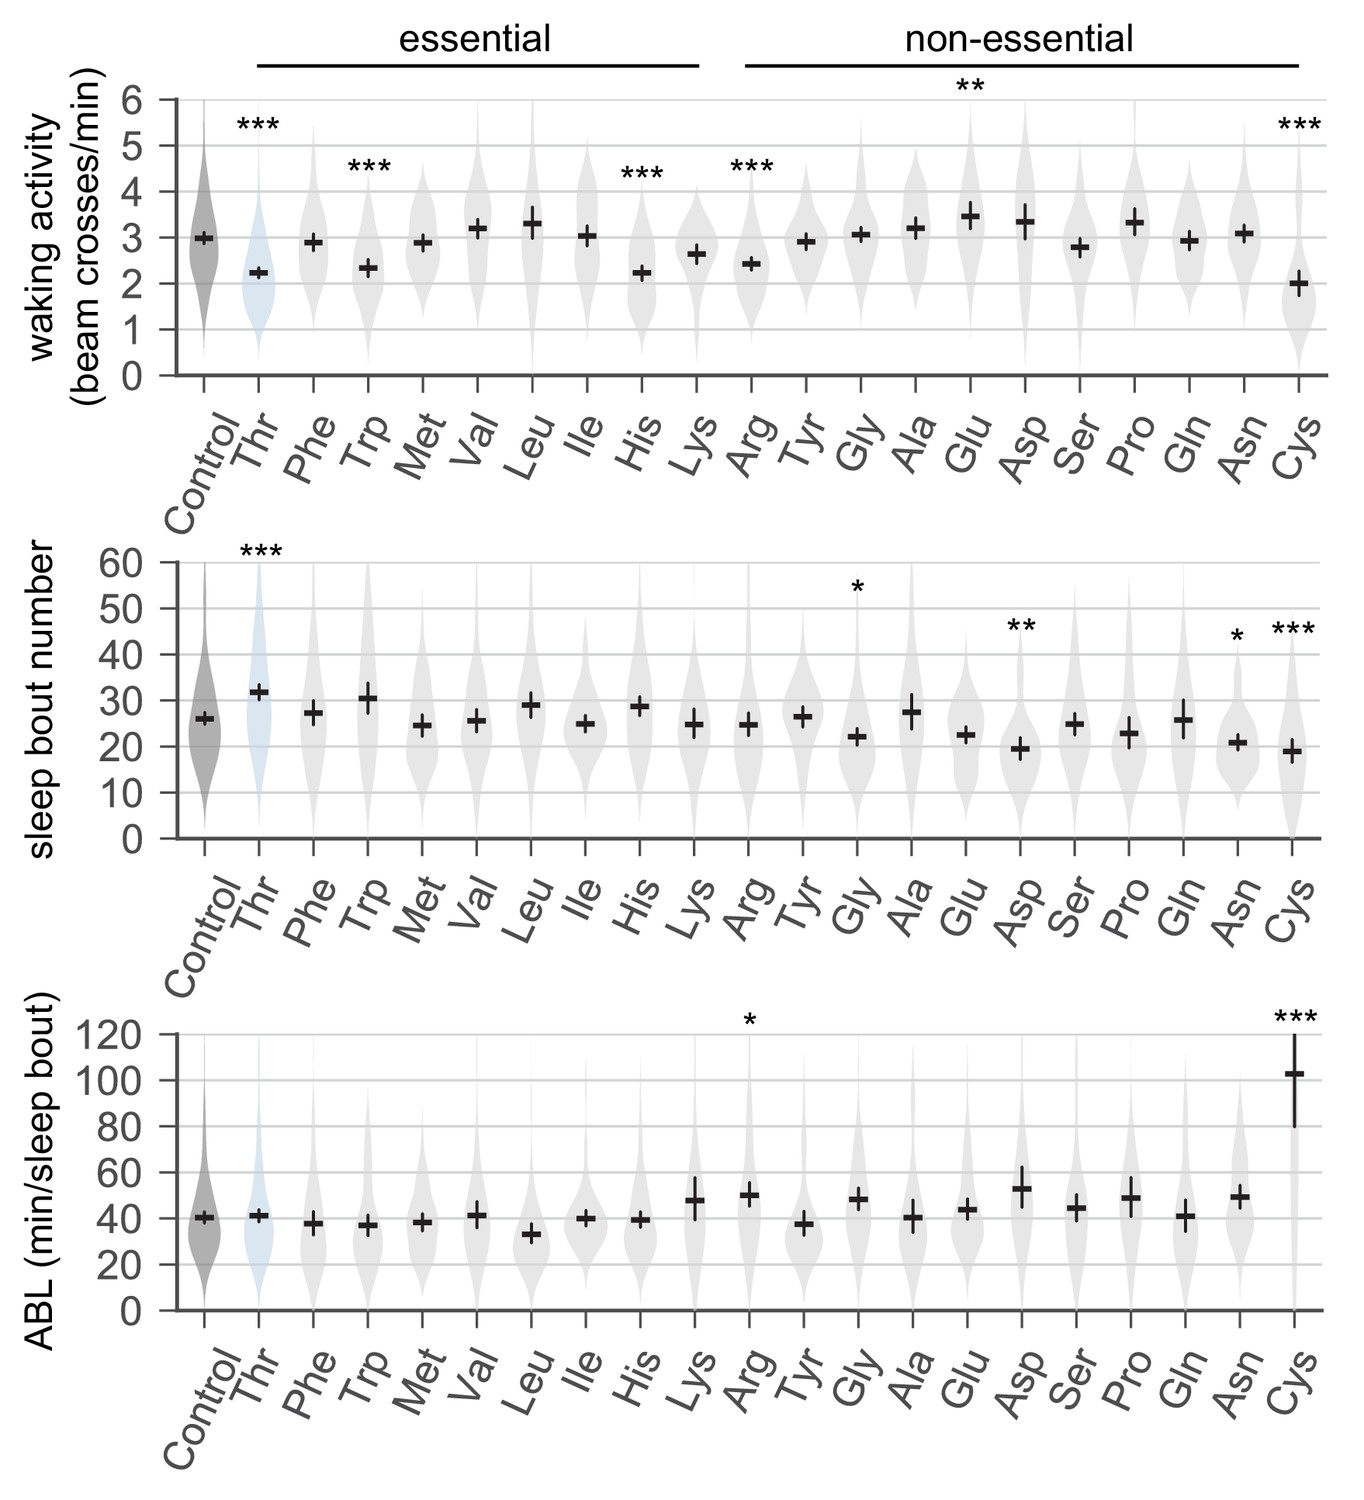
Dietary threonine increases the number of sleep bouts but decreases waking activities.
Sleep behaviors in wild-type male flies were analyzed similarly to the data presented in Figure 1A. Waking activity (top), the number of sleep bouts (middle), and averaged sleep bout length (ABL, bottom) were calculated from individual flies on day 4 and averaged for each amino acid. Essential and non-essential amino acids are grouped separately as shown at the top. Error bars indicate mean ±95% CI (n = 29–213). *p<0.05, **p<0.01, ***p<0.001 to control (no amino acid supplement) as determined by one-way ANOVA, Dunnett’s multiple comparisons test.
Figure 1—figure supplement 2

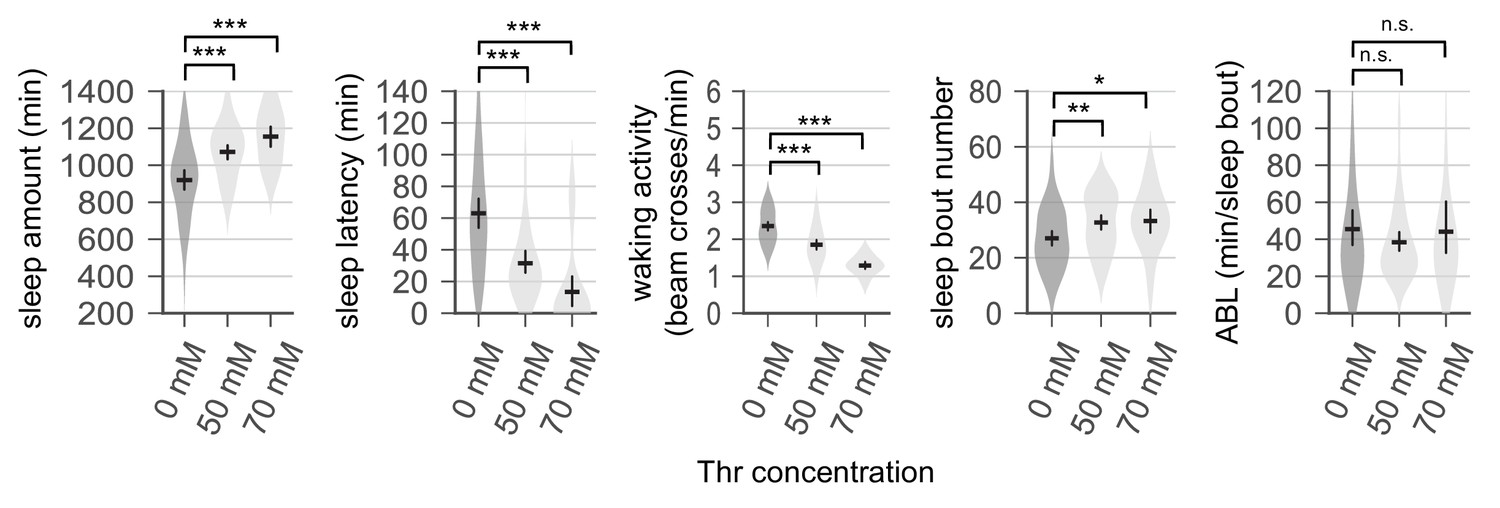
Sleep-promoting effects of dietary threonine (SPET) are dose-dependent and observed in both male and female flies.
(A and B) Sleep behaviors in individual male (A) or female (B) flies were analyzed similarly to the data presented in Figure 1A. Error bars indicate mean ±95% CI (n = 11–213). *p<0.05, ***p<0.001 to control (0 mM Thr) as determined by one-way ANOVA, Dunnett’s multiple comparisons test.
Figure 1—figure supplement 3
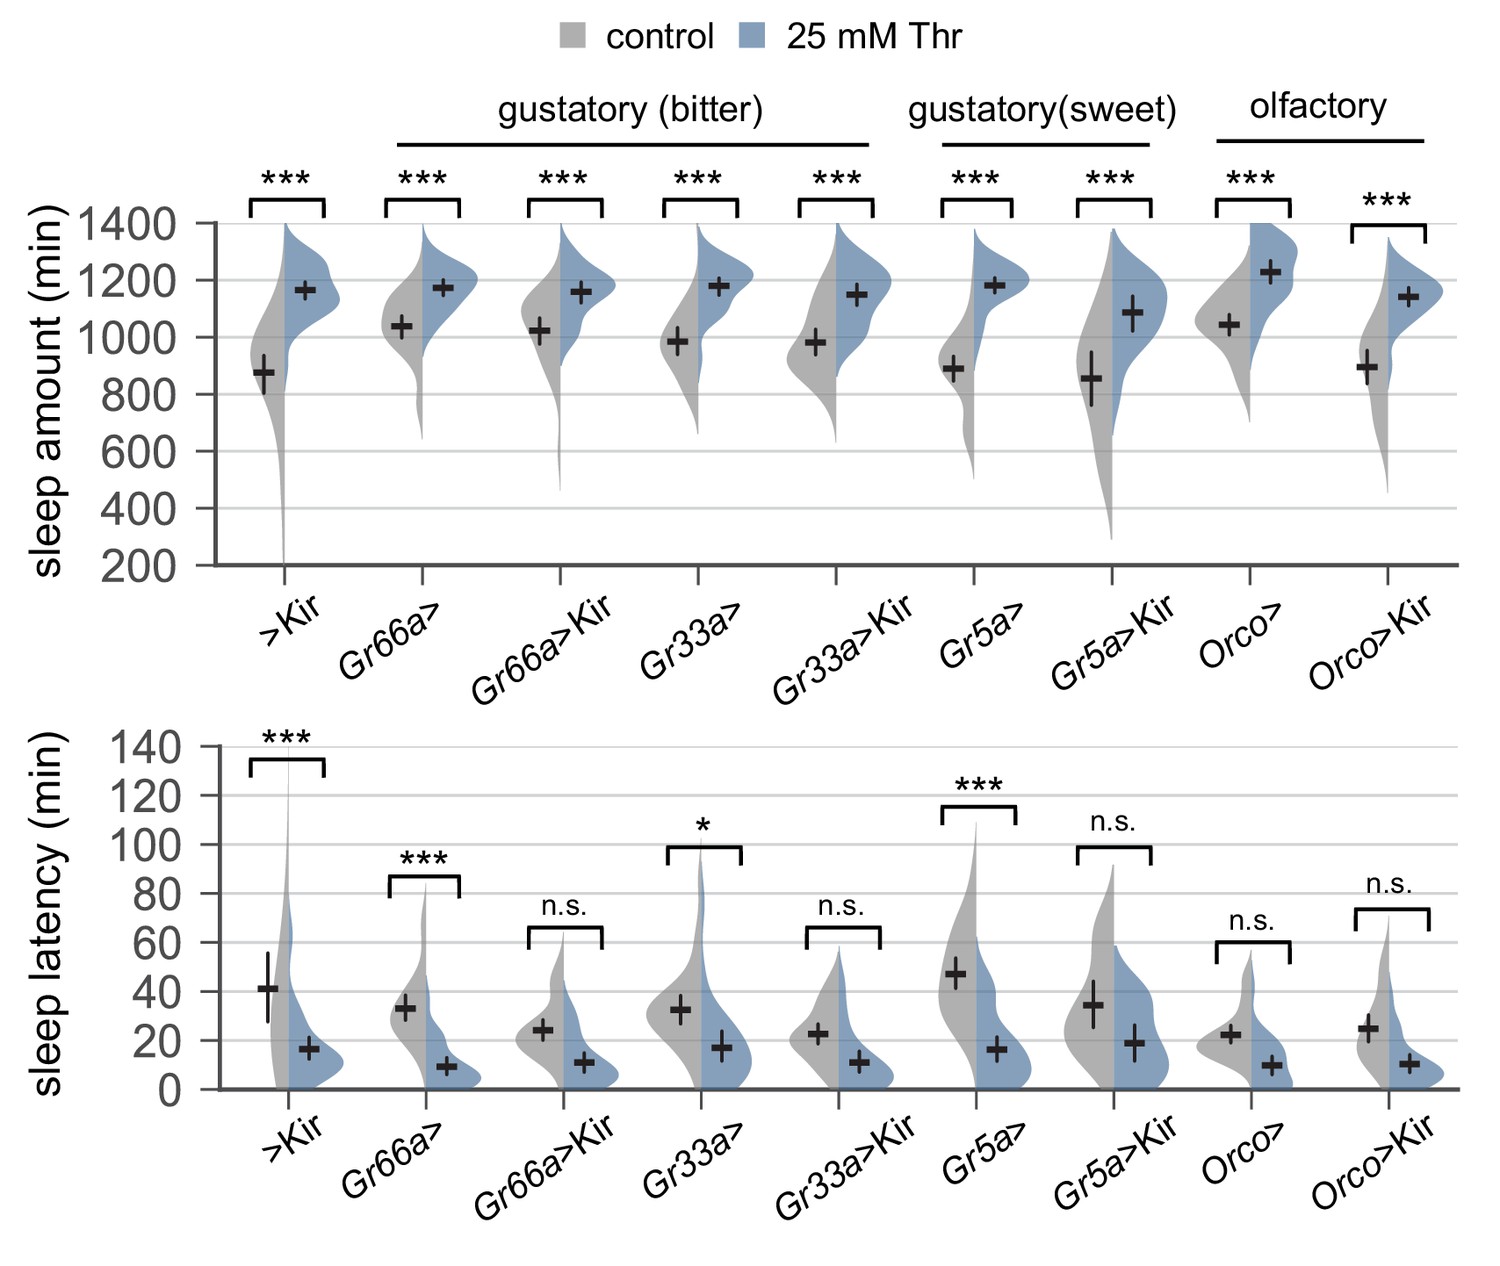
Transgenic silencing of sensory neurons that express either gustatory or olfactory receptors does not abolish SPET.
Sleep behaviors in individual male flies were analyzed similarly to the data presented in Figure 1A. Error bars indicate mean ±95% CI (n = 14–38). Two-way ANOVA detected significant effects of dietary threonine on daily sleep amount and sleep latency in all genotypes tested (p<0.001). No significant interactions between dietary threonine and transgenic silencing were observed when SPET on sleep amount and sleep latency in Gal4 >Kir trans-heterozygous flies were compared to those in heterozygous controls (Gal4 >or > Kir). n.s., not significant; *p<0.05, ***p<0.001 as determined by Tukey’s multiple comparisons test. Gr, gustatory receptor; Orco, olfactory co-receptor.
Figure 1—figure supplement 4
Wild-type flies fed protein-rich food display SPET comparably to those fed sucrose-based food.
Wild-type flies were loaded on to nutrient-rich cornmeal-yeast-agar food containing additional protein sources (e.g., cornmeal, yeast) along with the indicated concentration of threonine supplement (day 0) and entrained in LD cycles at 25°C. Sleep behaviors in individual male flies were analyzed similarly to the data presented in Figure 1A. Error bars indicate mean ±95% CI (n = 25–61). n.s., not significant; *p<0.05, **p<0.01, ***p<0.001 as determined by one-way ANOVA, Dunnett’s multiple comparisons test.
Figure 1—figure supplement 5
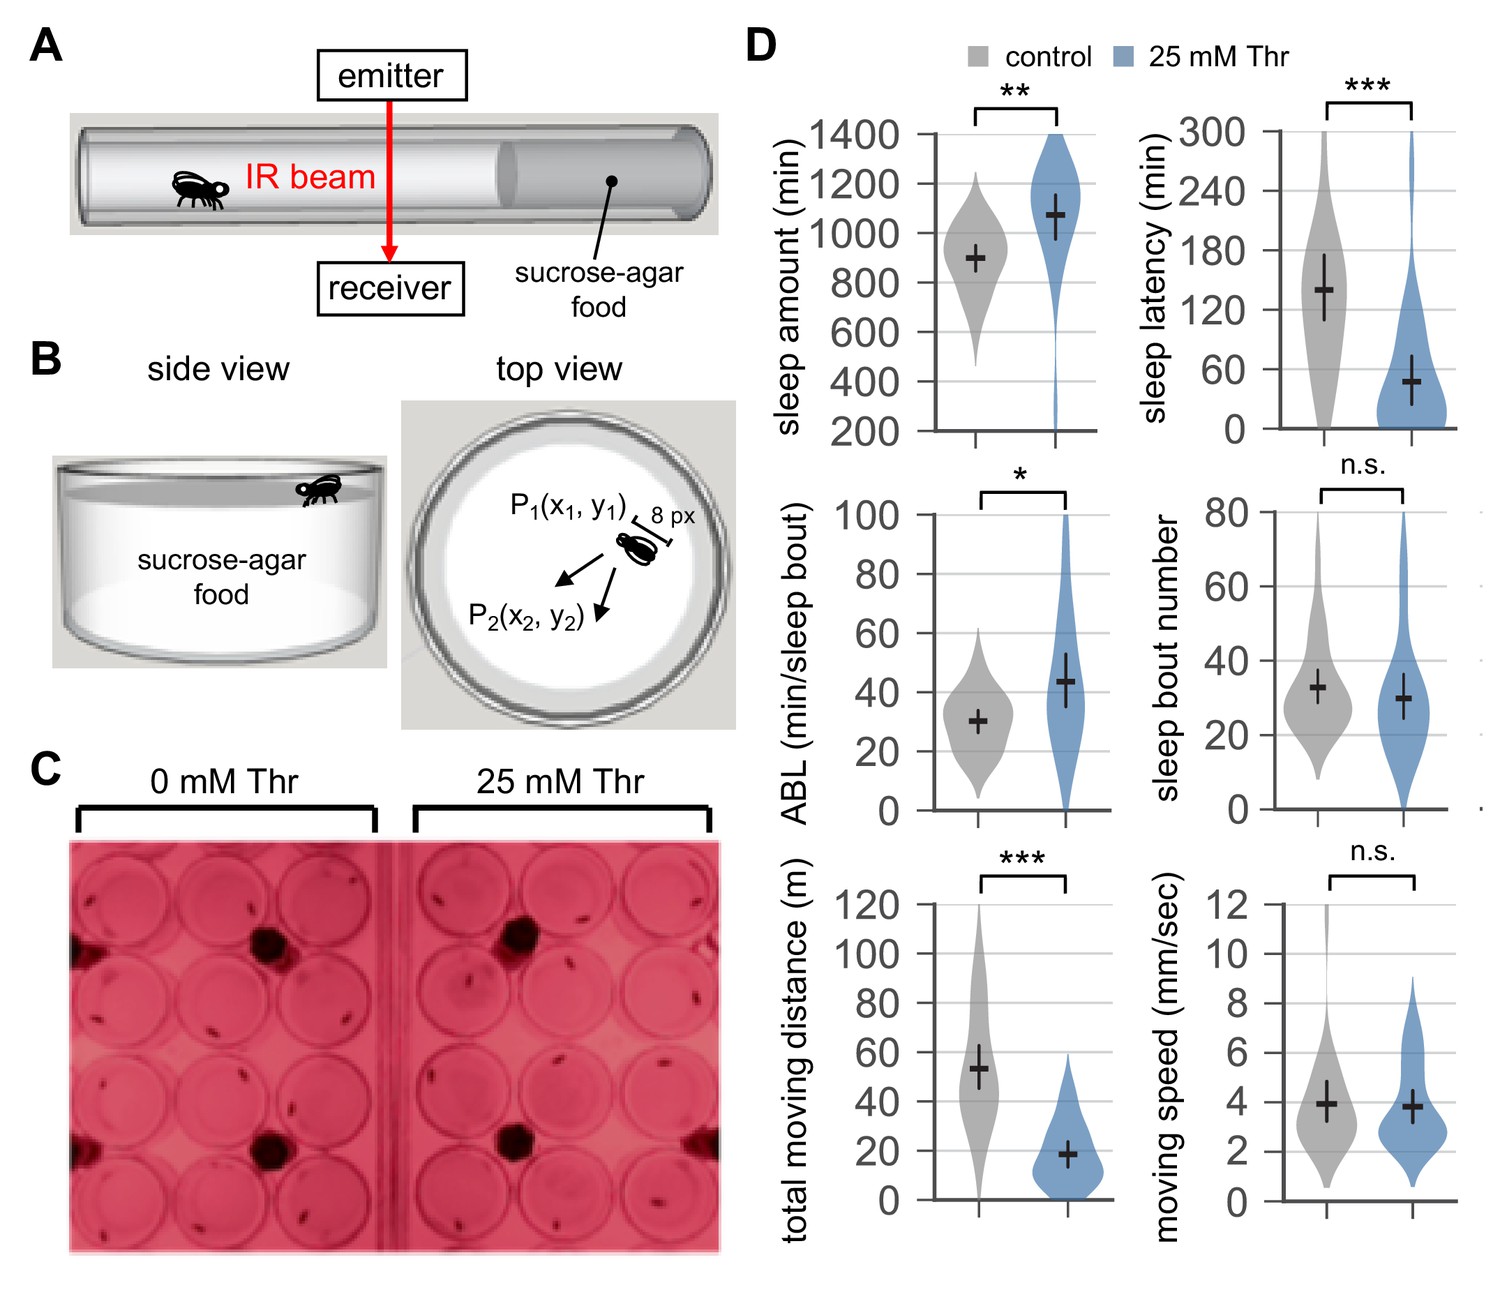
A video-based sleep analysis validates SPET in threonine-fed flies.
(A) The DAM system counts when a fly in the glass tube crosses an infrared (IR) beam sensor. The total number of beam crosses per minute is continuously recorded as a proxy for the locomotor activity in individual flies. (B and C) Individual male flies were placed into each arena (diameter x height = 16 mm x 2 mm) in a 24-well plate filled with behavior food (5% sucrose +2% agar±25 mM threonine). Positional changes in X- and Y-axes were calculated from two consecutive frames of time-lapse images by measuring the distance between P1 and P2. Any positional difference larger than eight pixels was considered as a movement. A window of the time frames with no positional change for >5 min was defined as a sleep bout. A dim-red light (red LED) was used for the image recording during the subjective night in LD cycles. (D) Wild-type male flies were loaded on to the video-tracking arena in the 24-well plate (day 0) and entrained in LD cycles at 25°C. On day 4, time-lapse images were obtained at 0.3–1 Hz using HandyAVI software (AZcendant). Sleep behaviors in individual flies were analyzed as described above. Error bars indicate mean ±95% CI (n = 22). n.s., not significant; *p<0.05, **p<0.01, ***p<0.001 as determined by Student’s t-test.
Figure 1—figure supplement 6
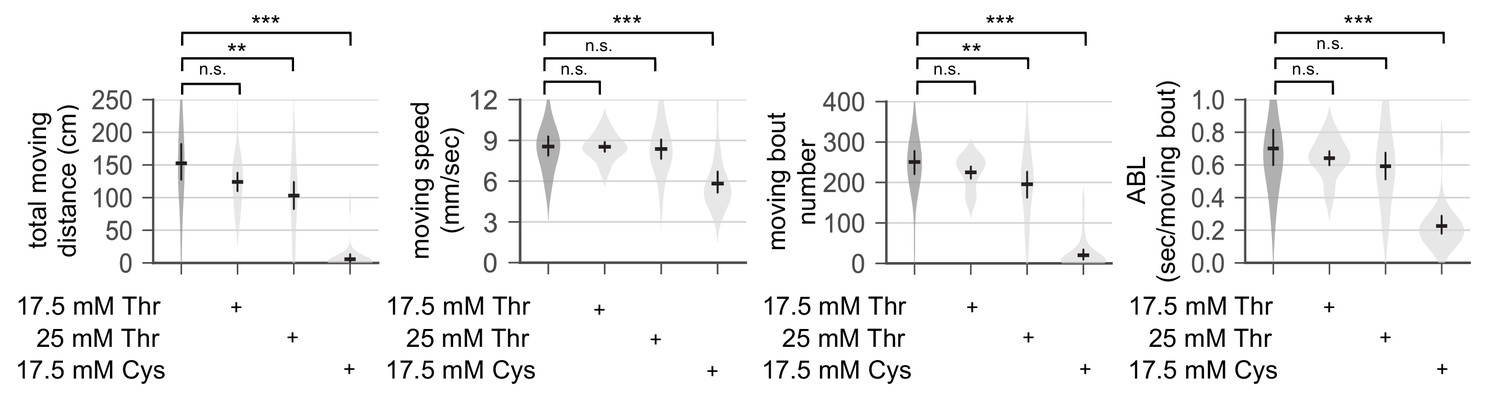
Dietary threonine does not impair general locomotion.
Wild-type male flies were loaded on to 5% sucrose food containing each amino acid (day 0) and entrained in LD cycles at 25°C. Individual flies were transferred into each arena (diameter x height = 35 mm x 2 mm) in a 6-well plate and their locomotor activities were video-recorded for 5 min on day 4. Total moving distance, moving speed, the number of moving bouts, and averaged moving bout length (ABL) were calculated from individual flies and averaged for each condition. Error bars indicate mean ±95% CI (n = 34–76). n.s., not significant; **p<0.01, ***p<0.001 as determined by one-way ANOVA, Dunnett’s multiple comparisons test.
Figure 1—figure supplement 7
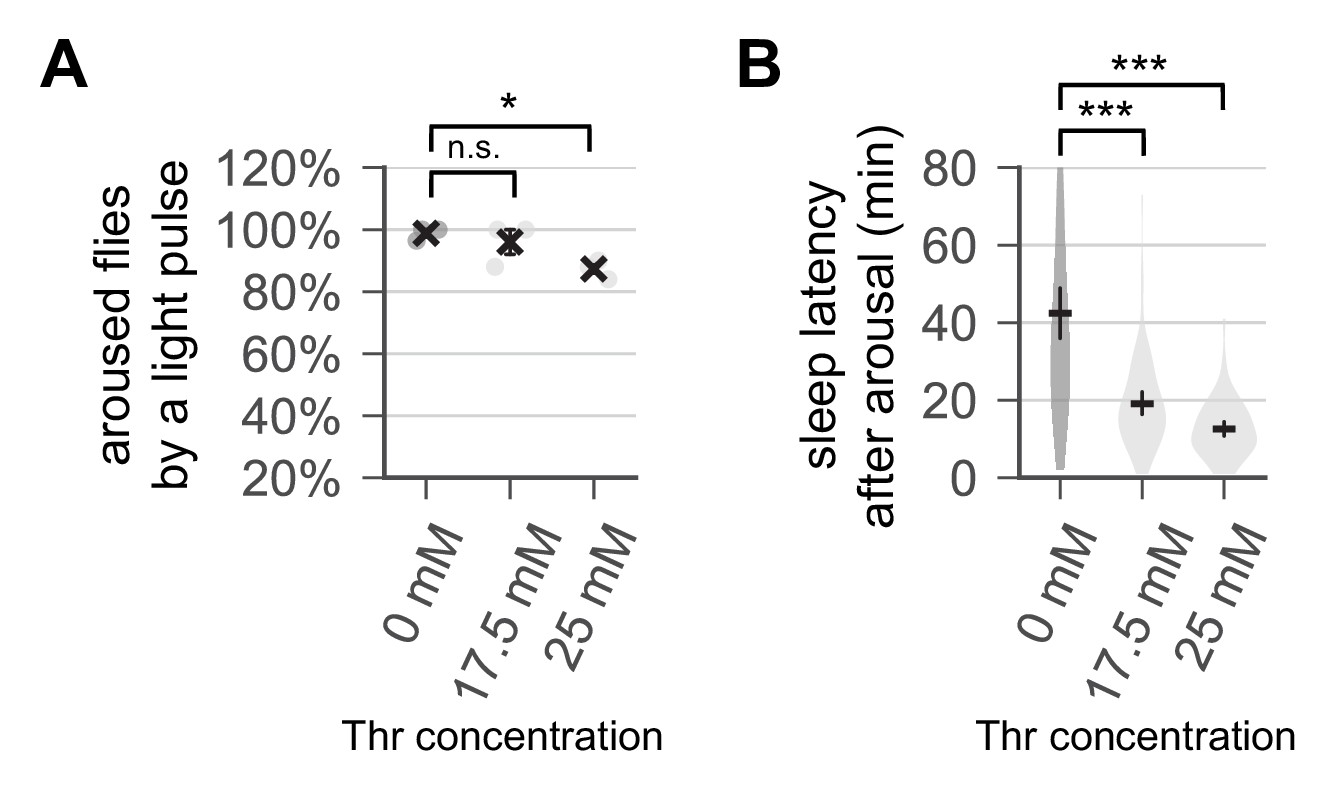
Dietary threonine induces a higher sleep drive.
Wild-type male flies were loaded on to 5% sucrose food containing the indicated amount of threonine (day 0) and entrained in LD cycles at 25°C. Control- and threonine-fed flies were exposed to a 1 min light pulse at ZT16 (i.e., 4 hr after lights-off) on day 4. (A) The percentage of light-aroused flies per condition was calculated and averaged from three independent experiments. Error bars indicate mean ± SEM (n = 3). (B) Sleep latency after light-induced arousal was calculated from individual flies and averaged for each condition (n = 61–74). Error bars indicate mean ±95% CI (n = 61–74). n.s., not significant; *p<0.05, ***p<0.001 as determined by one-way ANOVA, Dunnett’s multiple comparisons test.
Figure 1—figure supplement 8
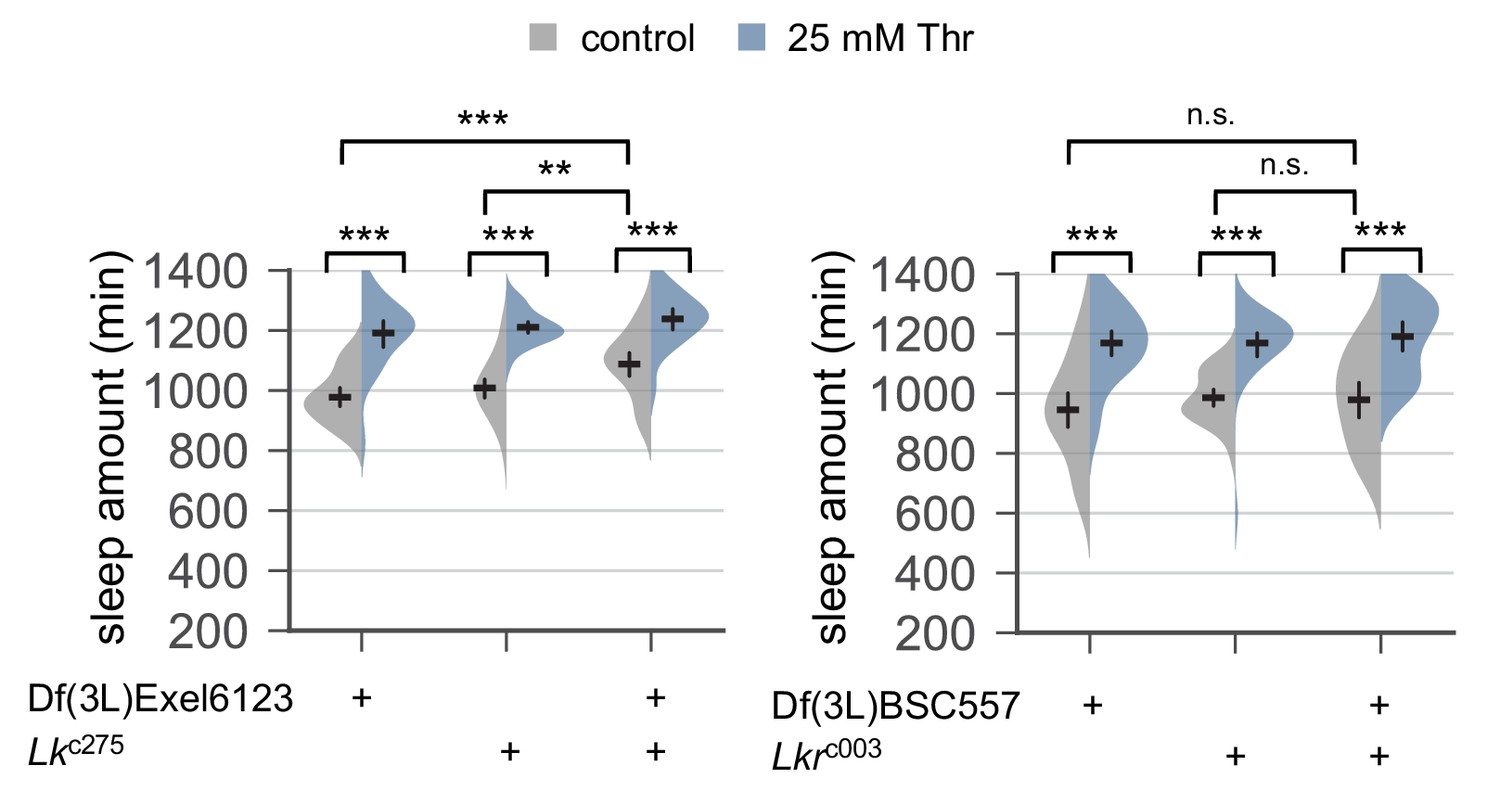
Genetic loss of Lk or Lkr function does not affect SPET.
Sleep behaviors in individual male flies trans-heterozygous or heterozygous for Lk or Lkr mutant alleles were analyzed similarly to the data presented in Figure 1A. Two-way ANOVA detected comparable SPET on daily sleep amount between trans-heterozygous mutants and their heterozygous controls of Lk (F[2, 177]=1.946, p=0.1459 by two-way ANOVA) or Lkr (F[2, 182]=0.371, p=0.6906). Error bars indicate mean ±95% CI (n = 22–41). n.s., not significant; **p<0.01, ***p<0.001 as determined by Tukey’s multiple comparisons test.
Figure 2 with 2 supplements
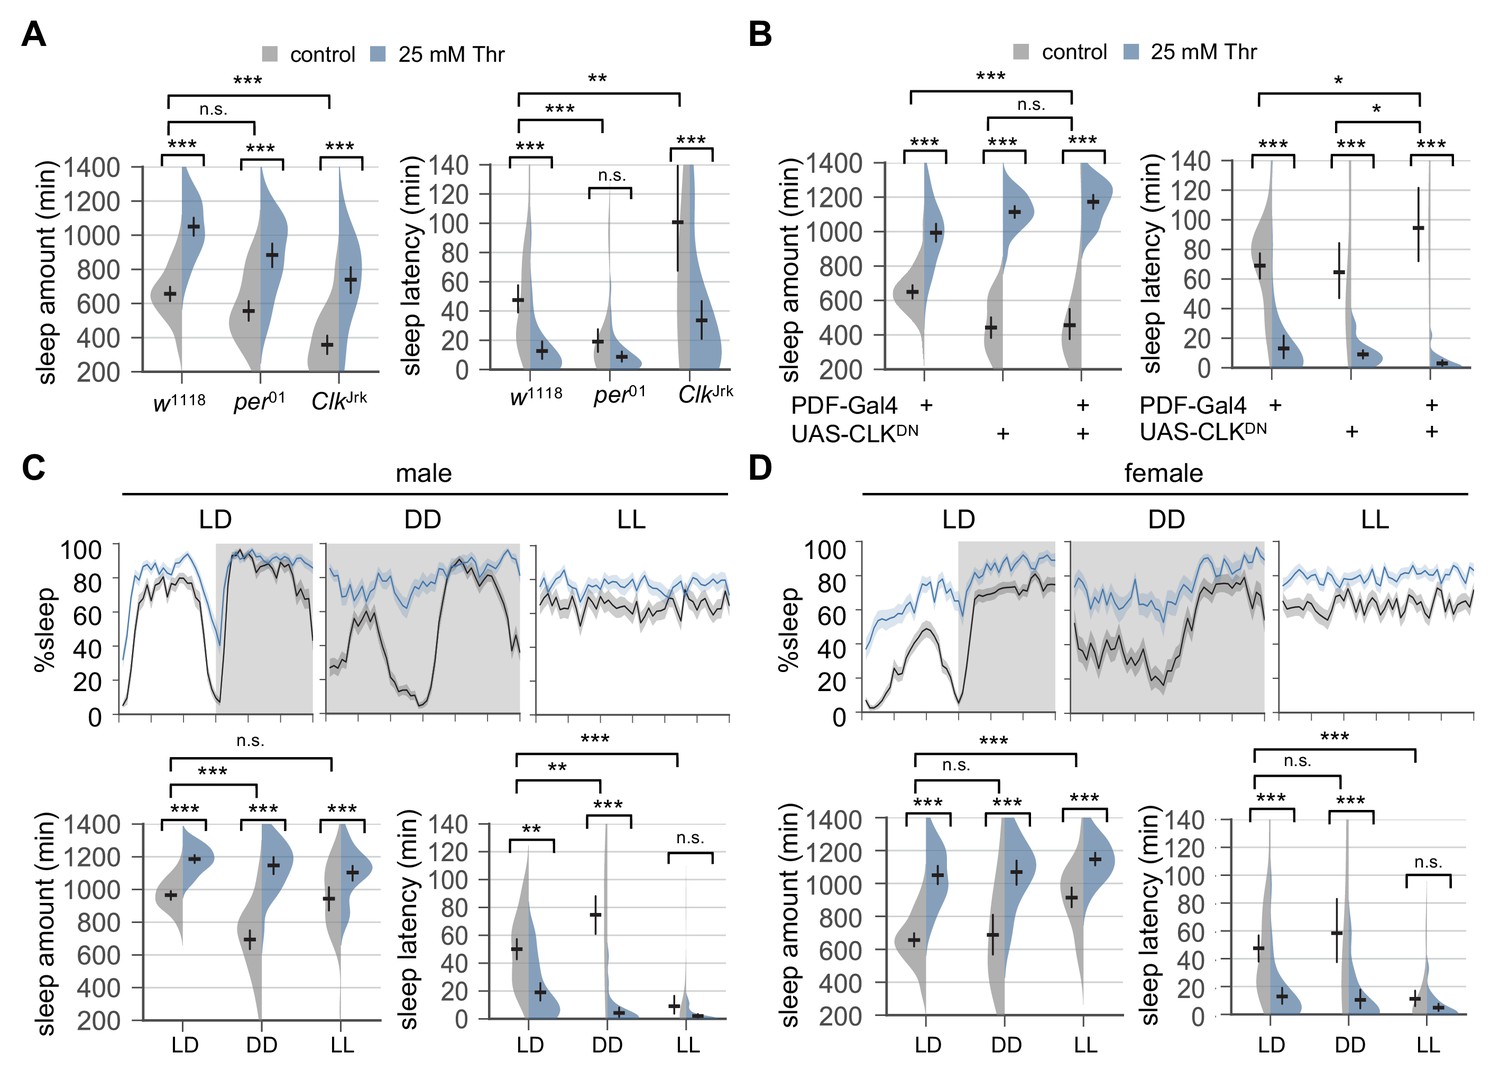
Circadian rhythms and clock-dependent control of sleep onset are dispensable for SPET.
(A) Arrhythmic clock mutants were loaded on to 5% sucrose food containing the indicated amount of threonine (day 0) and entrained in LD cycles at 25°C. Sleep behaviors in individual female flies were analyzed similarly to the data presented in Figure 1A. Two-way ANOVA detected no significant interaction of SPET with per01 (F[1,159]=1.293, p=0.2573 for sleep amount) or ClkJrk (F[1,160]=0.0426, p=0.8367 for sleep amount; F[1,160]=2.199, p=0.14 for sleep latency). Error bars indicate mean ±95% CI (n = 35–46). (B) PDF neuron-specific overexpression of dominant-negative CLK proteins (CLKDN) lengthened sleep latency in female flies fed control food (5% sucrose) but it did not suppress SPET. Error bars indicate mean ±95% CI (n = 26–42). (C and D) Wild-type flies were loaded on to 5% sucrose food containing the indicated amount of threonine (day 0) and then entrained in LD or constant light (LL) cycles at 25°C. For sleep analyses in constant dark (DD), LD-entrained flies were transferred to DD at the end of day 4 and their sleep was monitored during the first DD cycle (day 5). Averaged sleep profiles (% sleep per 30 min bin) on day 4 (LD or LL) or day 5 (DD) were shown at the top. Data represent mean ± SEM (n = 25–46). Error bars in the violin plots indicate mean ±95% CI (n = 25–46). n.s., not significant; *p<0.05, **p<0.01, ***p<0.001 as determined by two-way ANOVA, Tukey’s multiple comparisons test.
Figure 2—figure supplement 1
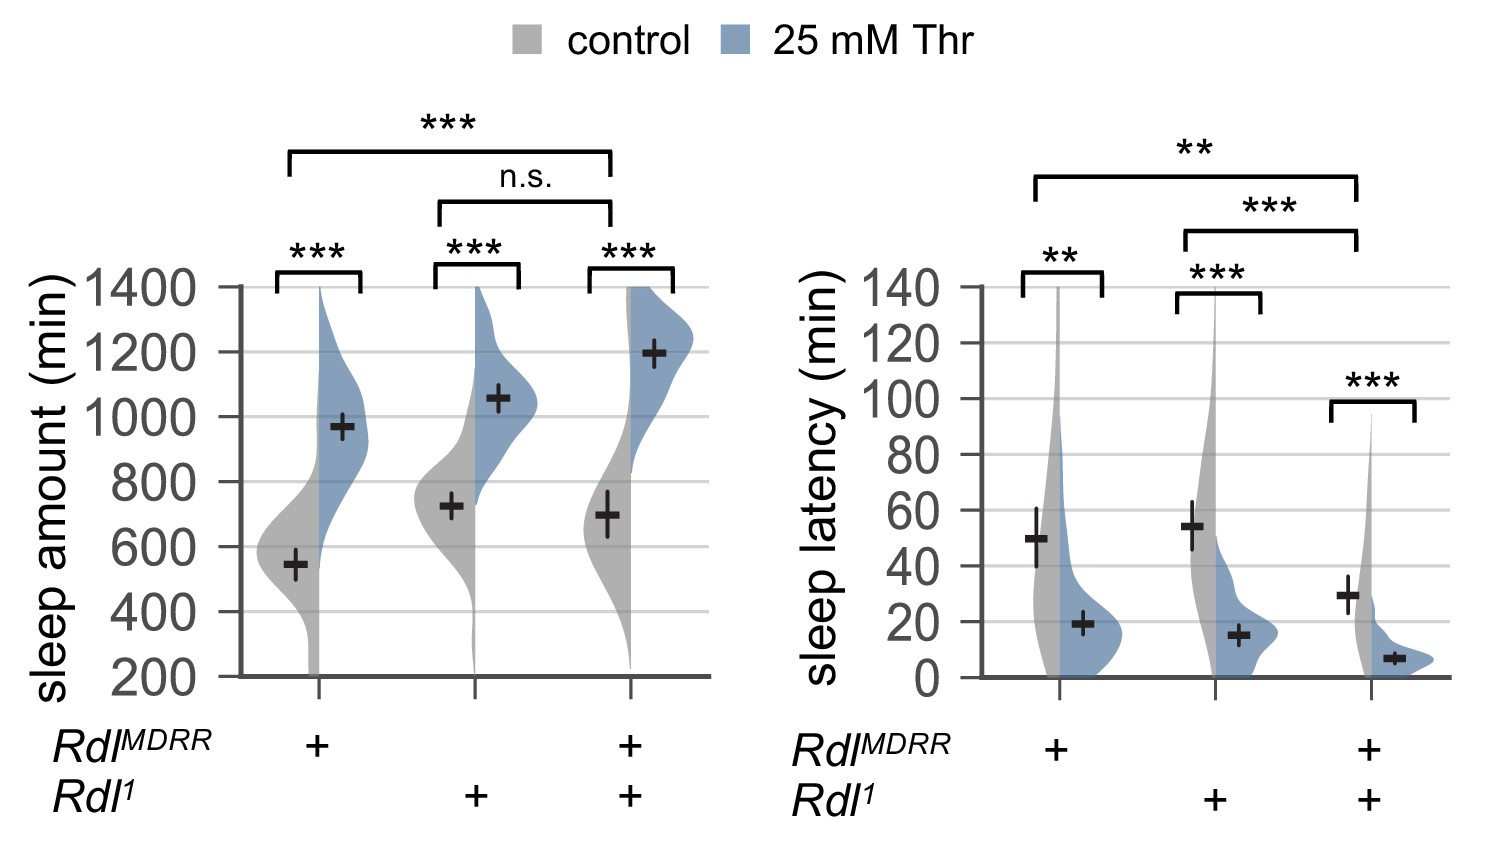
Genetic loss of Rdl function does not suppress SPET.
Female mutants trans-heterozygous or heterozygous for hypomorphic Rdl alleles (RdlMDRR or Rdl1) were loaded on to 5% sucrose food containing the indicated amount of threonine (day 0) and entrained in LD cycles at 25°C. Sleep behaviors in individual flies were analyzed similarly to the data presented in Figure 1A. Two-way ANOVA detected comparable SPET between trans-heterozygous Rdl mutants and one of their heterozygous controls (F[1,169]=2.22, p=0.1381 to RdlMDRR heterozygotes for sleep amount; F[1,169]=1.136, p=0.2881 to RdlMDRR heterozygotes for sleep latency). Error bars indicate mean ±95% CI (n = 32–57). n.s., not significant; **p<0.01, ***p<0.001 as determined by Tukey’s multiple comparisons test.
Figure 2—figure supplement 2
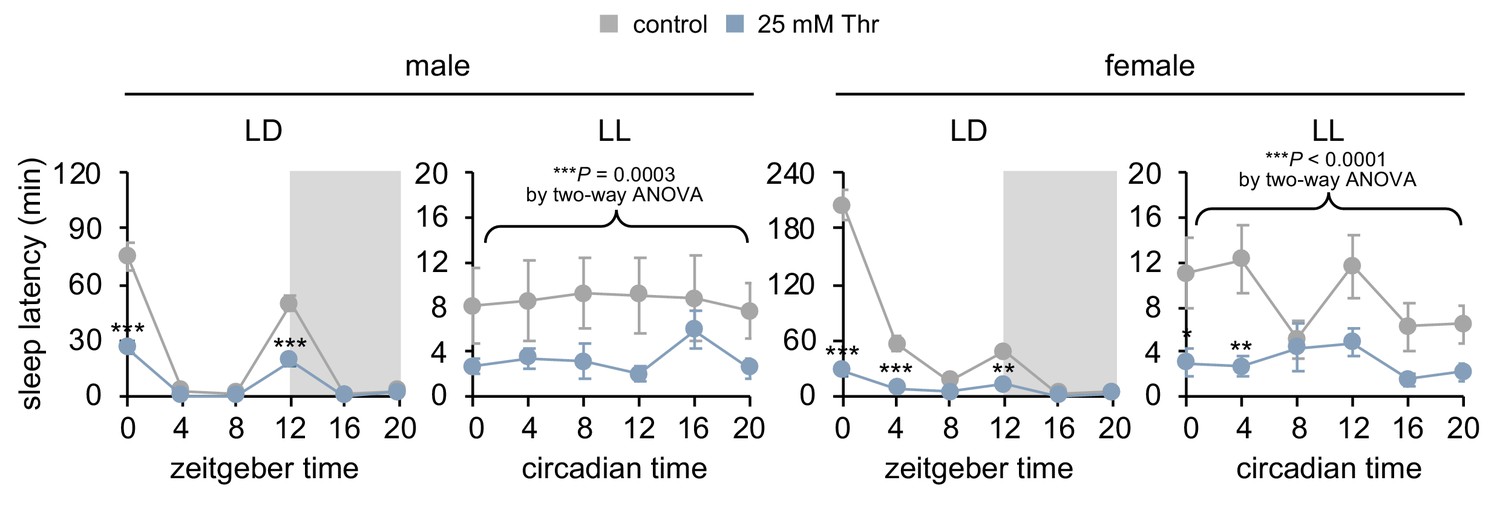
Constant light (LL) strongly dampens daily rhythms in sleep-wake cycles and sleep latency, but SPET is detectable in LL.
Sleep behaviors in individual flies were analyzed similarly to the data presented in Figure 2C. Sleep latency was measured at each time-point during LD or LL cycle on day 4. Two-way ANOVA detected significant effects of dietary threonine on sleep latency in LL (F[1,402]=13.03, p=0.0003 for male; F[1,474]=23.10, p<0.0001 for female). Data represent mean ± SEM (n = 34–46). *p<0.05, **p<0.01, ***p<0.001 to sleep latency in control-fed flies at each time-point as determined by Bonferroni’s multiple comparisons test.
Figure 3 with 1 supplement
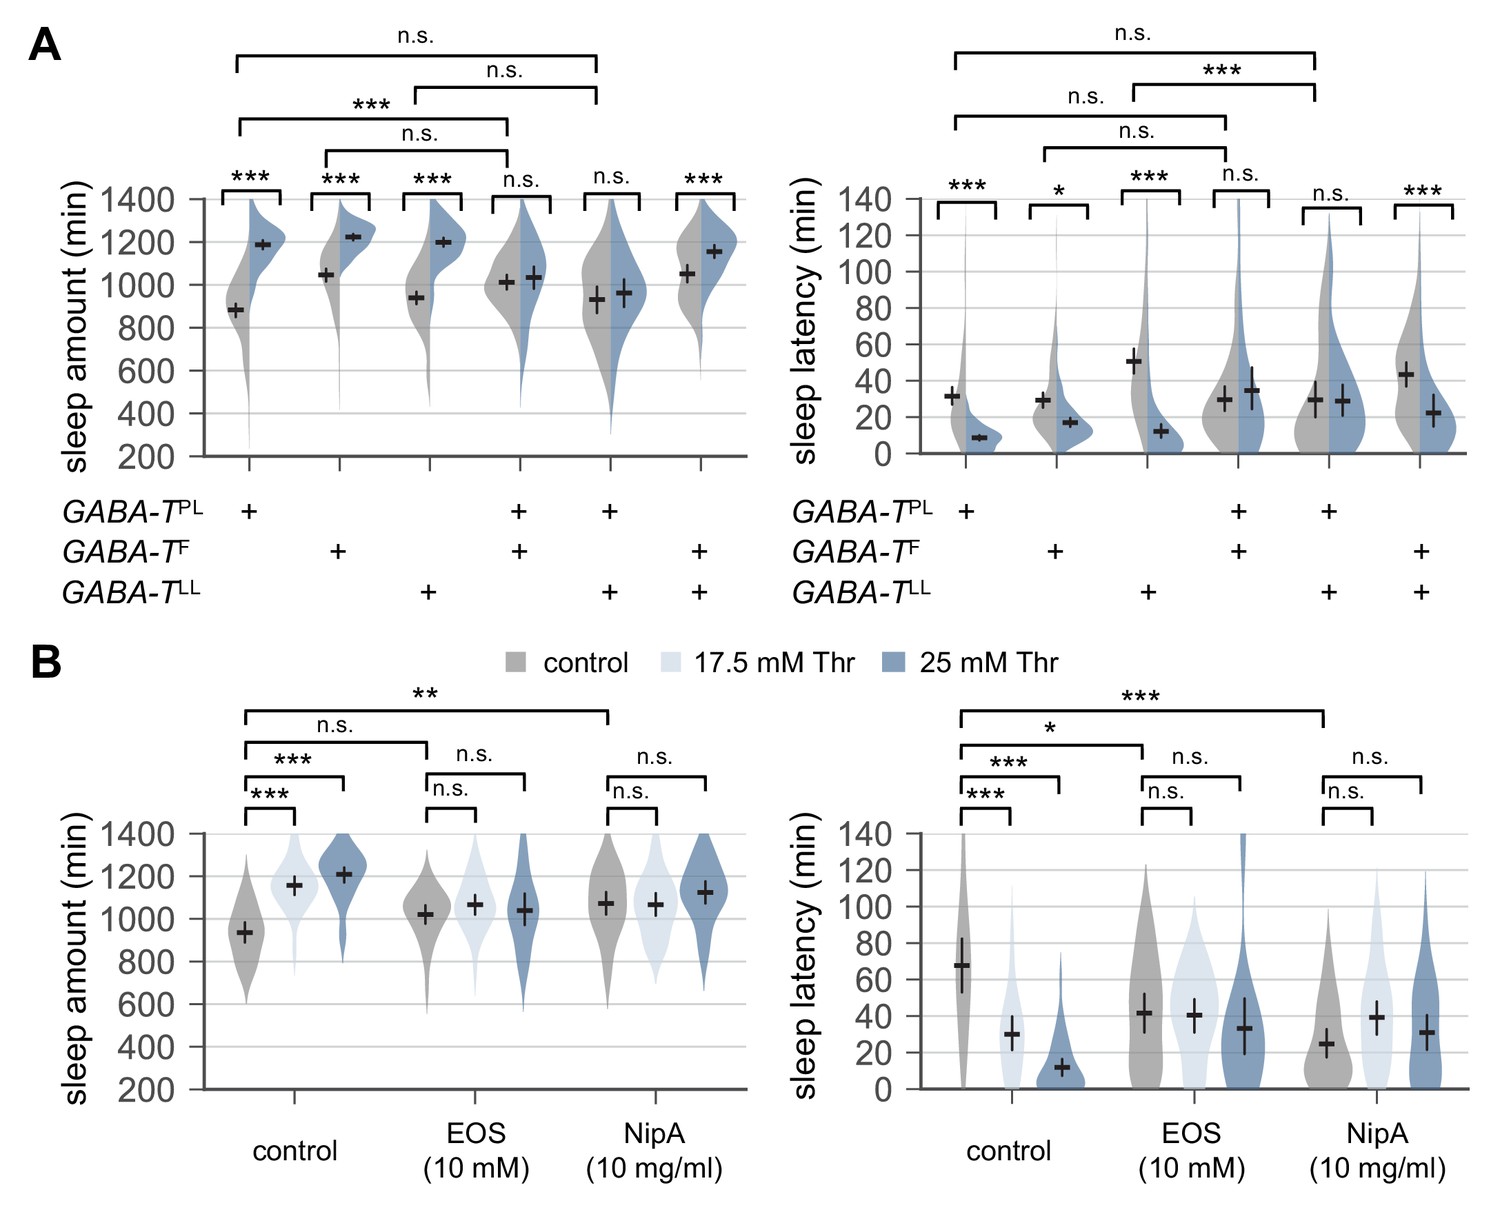
Genetic or pharmacological elevation of GABA suppresses SPET.
(A) GABA-T trans-heterozygous mutants were resistant to SPET. Sleep behaviors in individual male flies were analyzed similarly to the data presented in Figure 1A. Two-way ANOVA detected significant suppression of SPET in GABA-T trans-heterozygous mutants on sleep amount (F[2,403]=39.21, p<0.0001 for GABA-TPL/GABA-TF; F[2,430]=32.28, p<0.0001 for GABA-TPL/GABA-TLL; F[2,454]=13.99, p<0.0001 for GABA-TF/GABA-TLL) and sleep latency (F[2,403]=13.35, p<0.0001 for GABA-TPL/GABA-TF; F[2,430]=15.97, p<0.0001 for GABA-TPL/GABA-TLL; F[2,454]=9.324, p=0.0001 for GABA-TF/GABA-TLL), compared to their heterozygous controls. Error bars indicate mean ±95% CI (n = 32–114).(B) Co-administration of GABA-T inhibitor (EOS) or GABA transporter inhibitor (NipA) with threonine blocked SPET in wild-type flies. Where indicated, EOS or NipA was added to the sucrose food containing the increasing amounts of threonine. Sleep behaviors were analyzed as described above. Two-way ANOVA detected significant interaction of SPET with EOS (F[2,155]=14.07, p<0.0001 for sleep amount; F[2,155]=11.2, p<0.0001 for sleep latency) or NipA (F[2,162]=13.09, p<0.0001 for sleep amount; F[2,162]=26.58, p<0.0001 for sleep latency). Error bars indicate mean ±95% CI (n = 22–37) .n.s., not significant; *p<0.05, **p<0.01, ***p<0.001 as determined by Tukey’s multiple comparisons test.
Figure 3—figure supplement 1
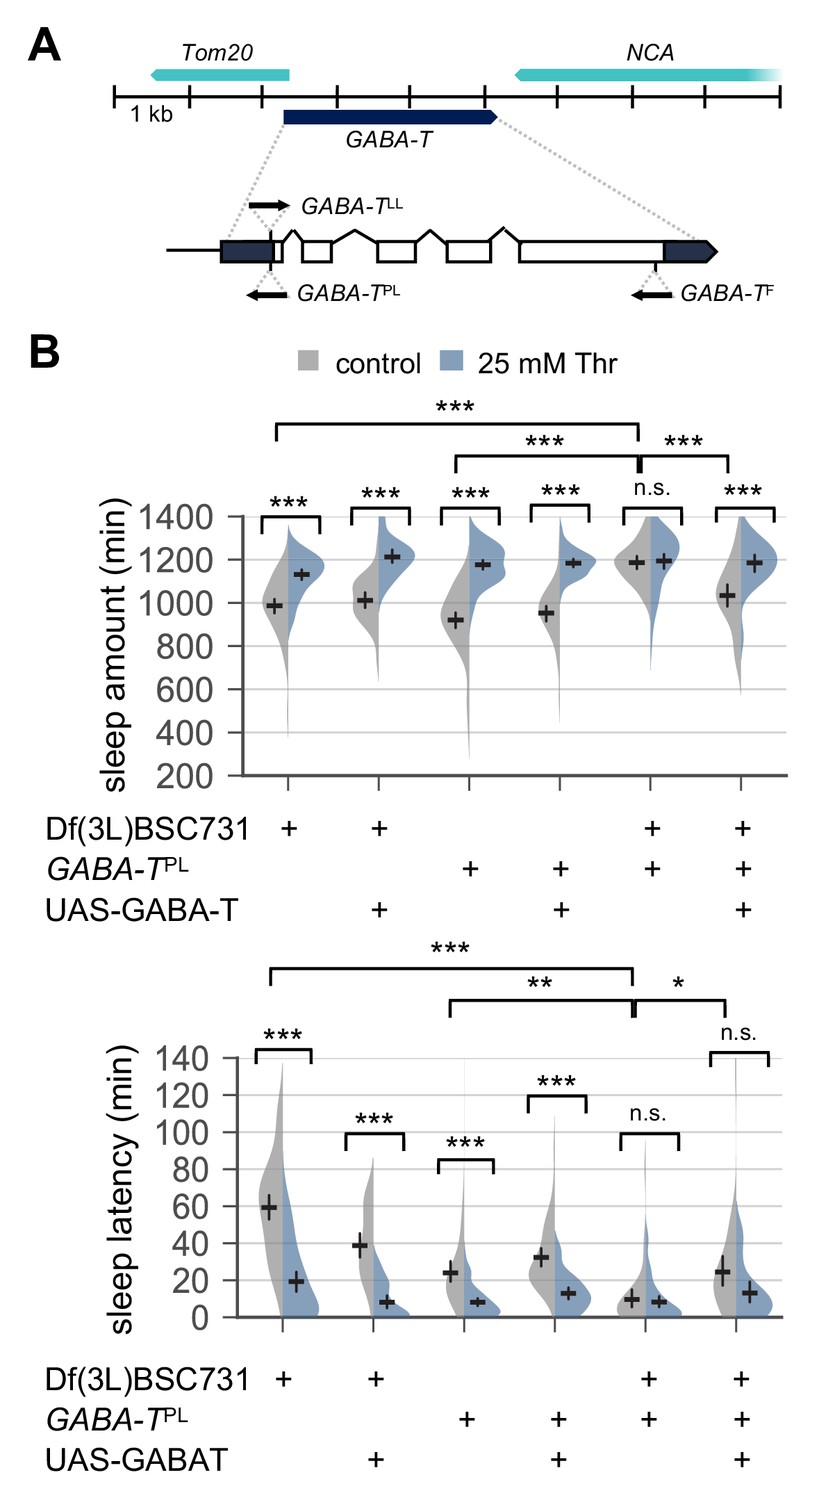
Transgenic overexpression of wild-type GABA-T partially rescues baseline sleep and SPET in GABA-T mutants.
(A) Loss-of-function mutant alleles in the GABA-T locus. Upper or lower arrows indicate the direction of the insertional allelic transgenes in relative to the transcriptional start site in the GABA-T locus (B) GABA-T overexpression in male mutants trans-heterozygous for GABA-TPL over chromosomal deficiency rescued long sleep in control-fed condition and partially restored SPET. GABA-TPL is a null allele that harbors an enhancer-trapping Gal4 transgene. When combined with UAS-GABA-T transgene, GABA-TPL can drive the overexpression of wild-type GABA-T cDNA downstream of Gal4-binding UAS in GABA-T expressing cells (Chen et al., 2015). Two-way ANOVA detected significant masking of SPET in GABA-T trans-heterozygous mutants compared to their heterozygous controls (F[2,320]=29.99, p<0.0001 for sleep amount; F[2,320]=30.12, p<0.0001 for sleep latency). GABA-T overexpression by GABA-TPL >UAS GABA-T in GABA-T trans-heterozygous mutants restored SPET on sleep amount (F[2,193]=2.329, p=0.1001 by two-way ANOVA), but not on sleep latency (F[2,193]=5.629, p=0.0042 by two-way ANOVA). Error bars indicate mean ±95% CI (n = 27–60) .n.s., not significant; *p<0.05, **p<0.01, ***p<0.001 as determined by Tukey’s multiple comparisons test.
Figure 4 with 6 supplements
Down-regulation of metabotropic GABA transmission likely mediates SPET.
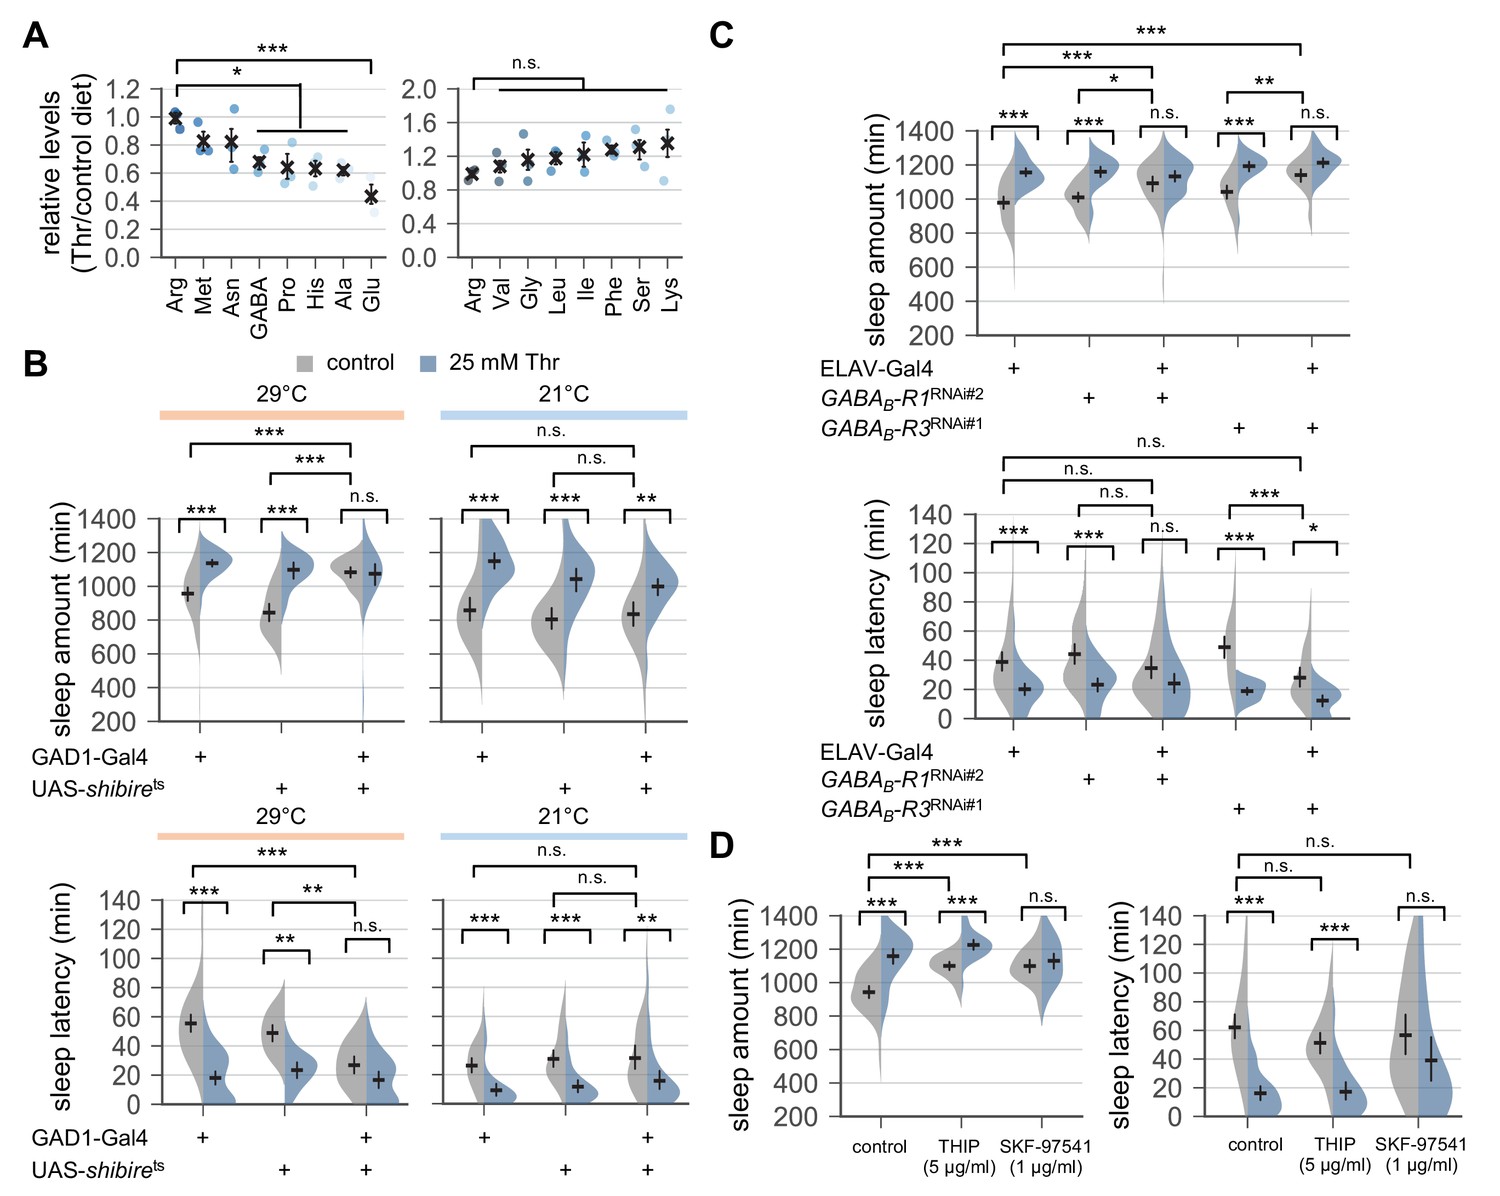
(A) Dietary threonine decreased the relative levels of select amino acids including GABA and glutamate. Wild-type male flies were loaded on to standard cornmeal-yeast-agar food containing either 0 mM (control) or 50 mM threonine, and then entrained in LD cycles at 25°C for 4 days before harvest. Relative levels of free amino acids in head extracts from threonine-fed flies were measured using ion exchange chromatography and then normalized to those in head extracts from control-fed flies. Error bars indicate mean ± SEM (n = 3). n.s., not significant; *p<0.05, ***p<0.001 to the relative levels of arginine as determined by one-way ANOVA, Dunnett’s multiple comparisons test. (B) Conditional blockade of GABAergic transmission promoted sleep in control-fed condition and masked SPET. Transgenic flies expressing a temperature-sensitive allele of shibire (shibirets) were loaded on to 5% sucrose food containing the indicated amount of threonine (day 0) and entrained in LD cycles at 29°C (restrictive) or 21°C (permissive). Sleep behaviors in individual male flies were analyzed on day 3 (29°C) or day 6 (21°C) since low temperature delayed SPET even in heterozygous controls. Two-way ANOVA detected significant masking of SPET by shibirets overexpression in GAD1-expressing cells at 29°C (F[2,197]=14.06, p<0.0001 for sleep amount; F[2,196]=6.953, p=0.0012 for sleep latency), but not at 21°C (F[2,184]=2.055, p=0.131 for sleep amount; F[2,184]=0.1835, p=0.8325 for sleep latency) as compared to their heterozygous controls. Error bars indicate mean ±95% CI (n = 14–63 for 29°C; n = 25–35 for 21°C). (C) Pan-neuronal deletion of metabotropic GABA receptors (GABAB-R1 and GABAB-R3) by transgenic RNA interference (RNAi) increased daily sleep amount in control-fed condition and masked SPET. Locomotor activities in individual male flies were monitored similarly to the data presented in Figure 1A. Sleep behaviors were analyzed on day 3 to better compare the sensitivity to SPET among different genotypes. Two-way ANOVA detected significant masking of SPET by the pan-neuronal RNAi on sleep amount (F[2,236]=8.913, p=0.0002 for GABAB-R1RNAi#2; F[2,317]=16.78; F[2,193]=4.594, p=0.0112 for GABAB-R3RNAi#1) and sleep latency (F[2,193]=3.267, p=0.0403 for GABAB-R3RNAi#1) as compared to their heterozygous controls. Error bars indicate mean ±95% CI (n = 24–50). (D) Oral administration of SKF-97541 (an agonist of metabotropic GABA receptor), but not of THIP (an agonist of ionotropic GABA receptor), suppressed SPET. Sleep behaviors in individual male flies were analyzed as described above. Where indicated, THIP (5 μg/ml) or SKF-97541 (1 μg/ml) was added to the behavior food. Two-way ANOVA detected significant effects of SKF-97541 on SPET (F[1,143]=17.39, p<0.0001 for sleep amount; F[1,143]=6.898, p=0.0096 for sleep latency).Error bars indicate mean ±95% CI (n = 27–53). n.s., not significant; *p<0.05, **p<0.01, ***p<0.001 as determined by Tukey’s multiple comparisons.
Figure 4—figure supplement 1
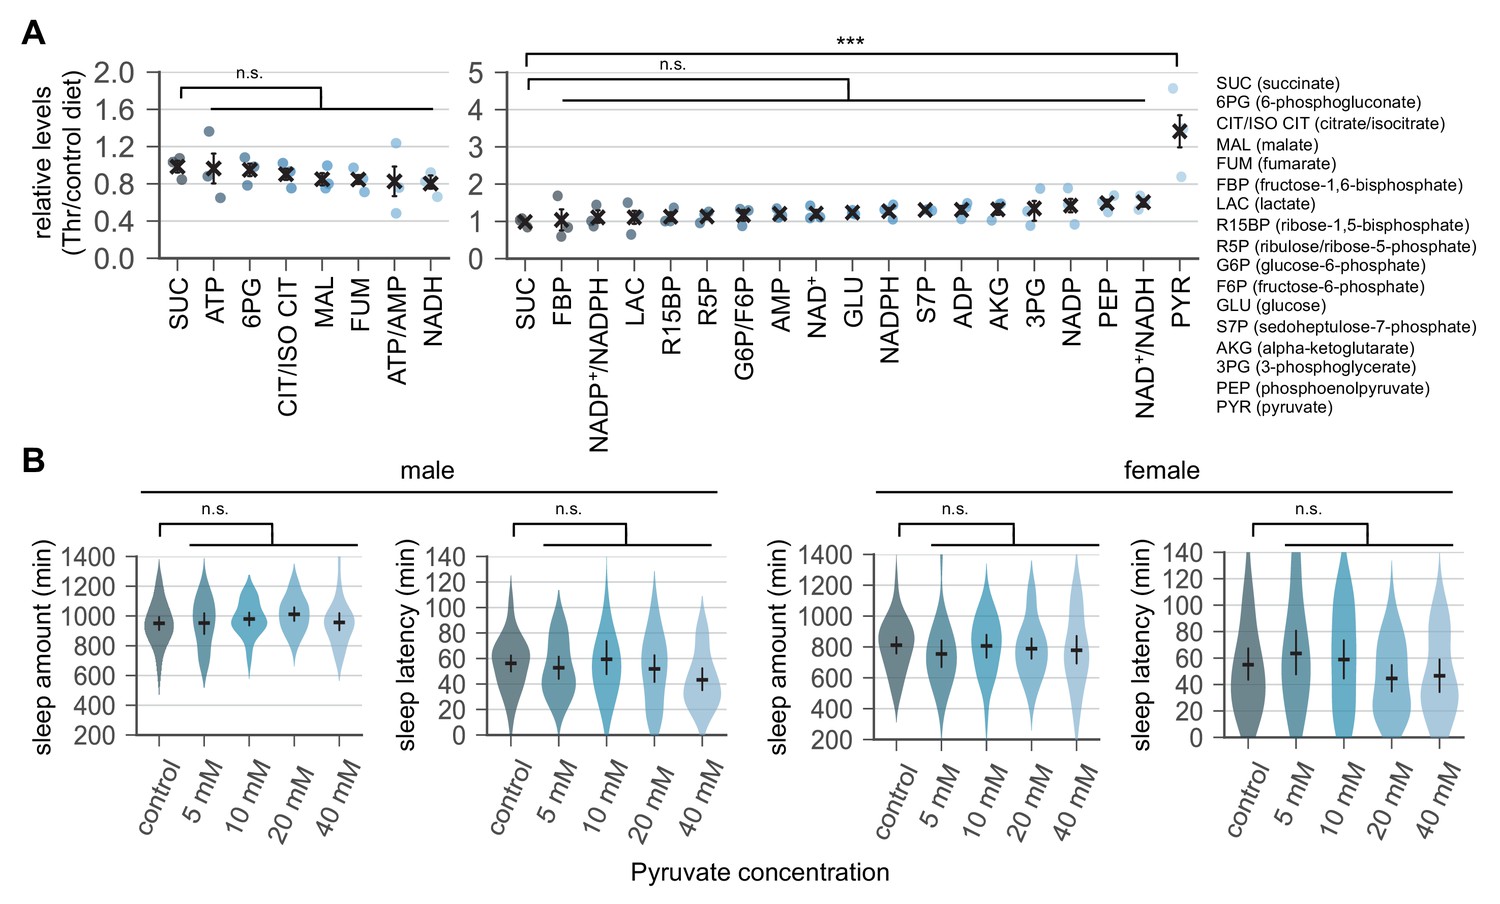
Dietary threonine selectively elevates pyruvate levels but dietary pyruvate itself does not promote sleep.
(A) Quantitative analyses of energy metabolites in fly heads. Wild-type male flies were loaded on to standard cornmeal-yeast-agar food containing either 0 mM (control) or 50 mM threonine, and then entrained in LD cycles at 25°C for 4 days before harvest. Relative levels of each metabolite in head extracts from threonine-fed flies were measured using liquid chromatograph-tandem mass spectrometry and then normalized to those in head extracts from control-fed flies. Error bars indicate mean ± SEM (n = 3). n.s., not significant; ***p<0.001 to the relative levels of succinate as determined by one-way ANOVA, Dunnett’s multiple comparisons test. (B) Wild-type male (left) or female (right) flies were individually loaded on to 5% sucrose food containing the increasing amount of pyruvate (day 0) and entrained in LD cycles at 25°C. Sleep behaviors in individual flies were analyzed on day 4 similarly to the data presented in Figure 1A. Error bars indicate mean ±95% CI (n = 20–41). n.s., not significant as determined by one-way ANOVA, Dunnett’s multiple comparisons test.
Figure 4—figure supplement 2
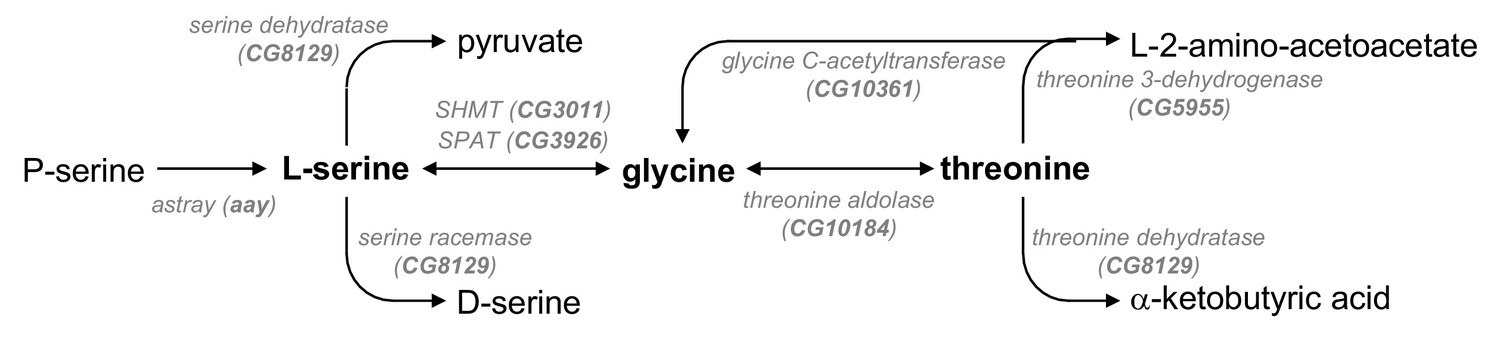
A metabolic pathway of serine, glycine, and threonine.
A schematic diagram of enzymes (Drosophila homologs) and biochemical reactions in the metabolic pathway of serine, glycine, and threonine was adopted and modified from KEGG pathway database (http://www.genome.jp/kegg/pathway.html). SHMT, serine hydroxymethyl transferase; SPAT, serine pyruvate aminotransferase.
Figure 4—figure supplement 3

Glutamate supplement does not suppress SPET.
Wild-type flies were individually loaded on to 5% sucrose food containing the increasing amount of threonine (day 0) and entrained in LD cycles at 25°C. Where indicated, 25 mM glutamate was added to the behavior food. Sleep behaviors in individual male flies were analyzed on day 4 similarly to the data presented in Figure 1A. Two-way ANOVA detected comparable SPET between control- and glutamate-fed flies (F[2,287]=0.09432, p=0.91 for sleep amount; F[2,287]=0.6632, p=0.516 for sleep latency). Error bars indicate mean ±95% CI (n = 40–61). n.s., not significant; ***p<0.001 as determined by Tukey’s multiple comparisons test.
Figure 4—figure supplement 4
Dietary threonine elevates intracellular Ca2+ levels in a subset of GABAergic neurons.
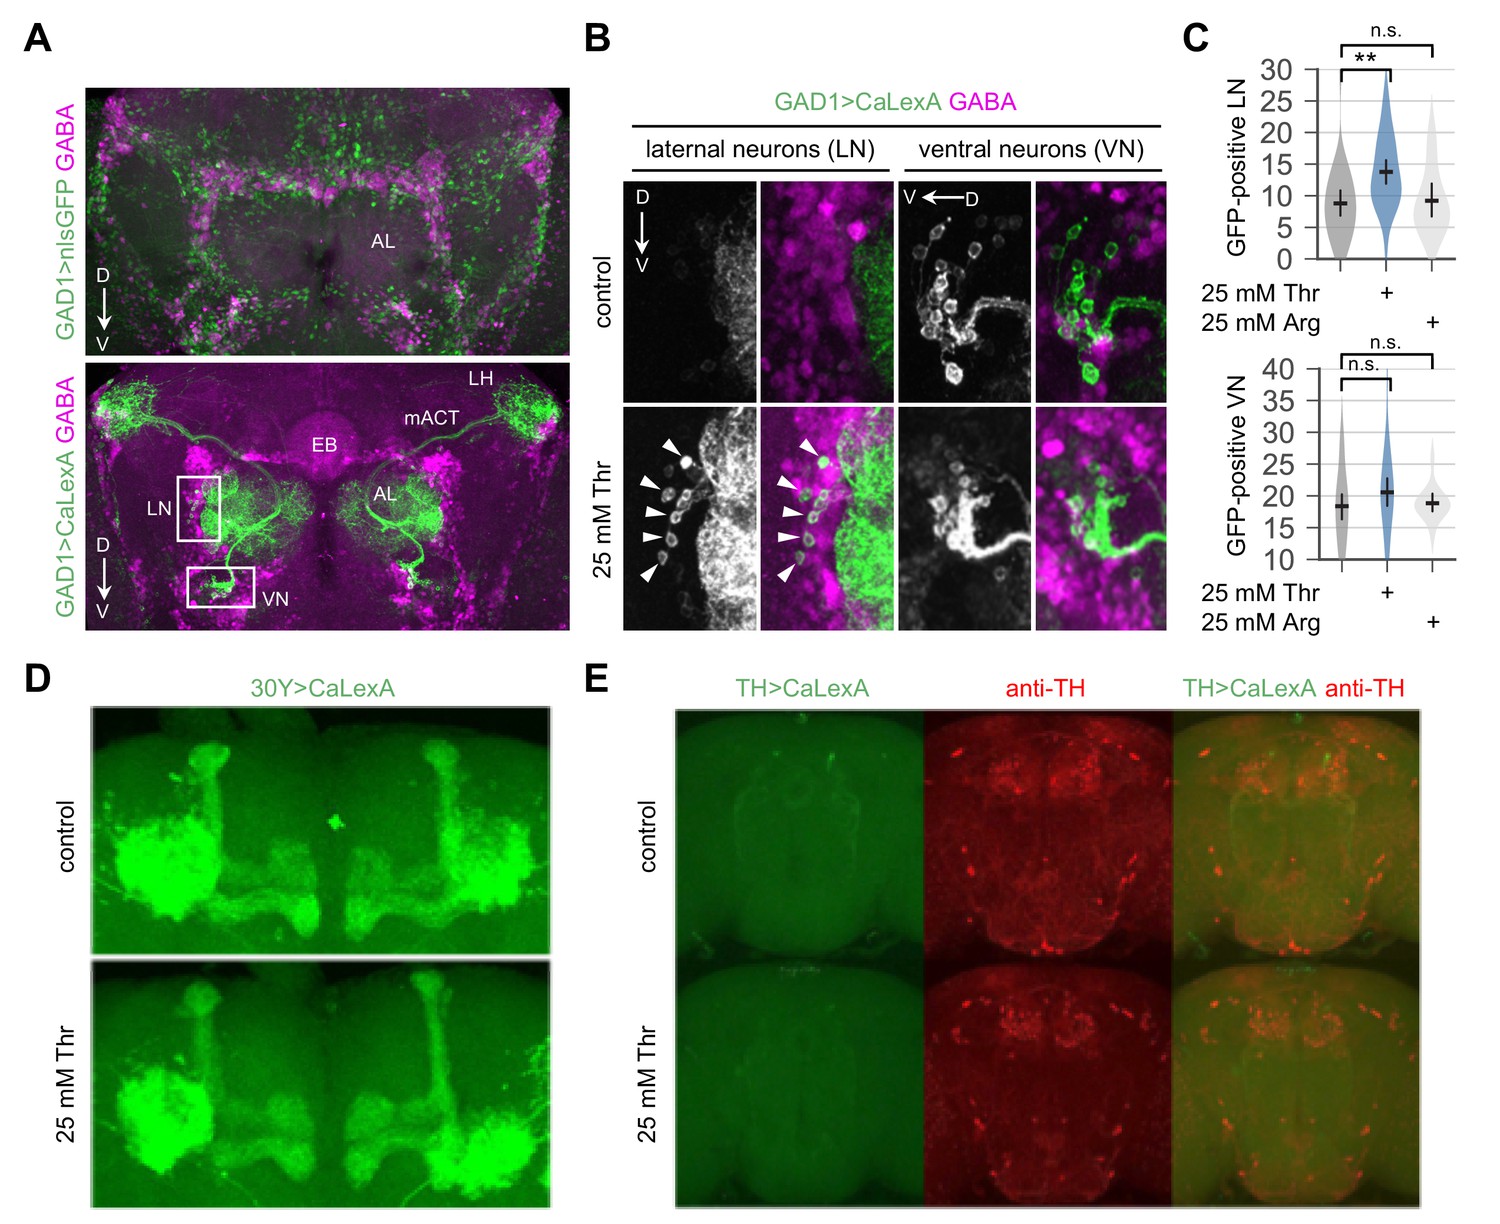
(A) Confocal imaging of nuclear GFP (top, green) or a transcriptional reporter for intracellular Ca2+ (i.e., CaLexA-induced GFP) (bottom, green) expressed in GAD1-expressing GABAergic neurons by the GAD1-Gal4 driver. Adult fly brains were co-stained with mouse anti-GFP and rabbit anti-GABA antibodies (magenta). AL, antennal lobe; D, dorsal; LH, lateral horn; LN, lateral interneurons; mACT, medial antenno-cerebral tract; V, ventral; VN, ventral interneurons. (B) Representative images of LN and VN in control- or threonine-fed flies. Arrow heads indicate threonine-induced expression of GFP by CaLexA in LN. (C) The number of LN or VN expressing CaLexA-induced GFP was quantified in each brain hemisphere from control-, threonine-, or arginine-fed flies. Error bars indicate mean ±95% CI (n = 14–32) .n.s., not significant; **p<0.01 to control as determined by one-way ANOVA, Dunnett’s multiple comparisons test. (D and E) Effects of dietary threonine on CaLexA-induced GFP expression in mushroom body (D, 30Y > CaLexA) or in dopaminergic neurons expressing tyrosine hydroxylase (E, TH >CaLexA) were examined similarly as above and representative confocal images were shown. Dopaminergic neurons were labeled using anti-TH antibody (E, red).
Figure 4—figure supplement 5
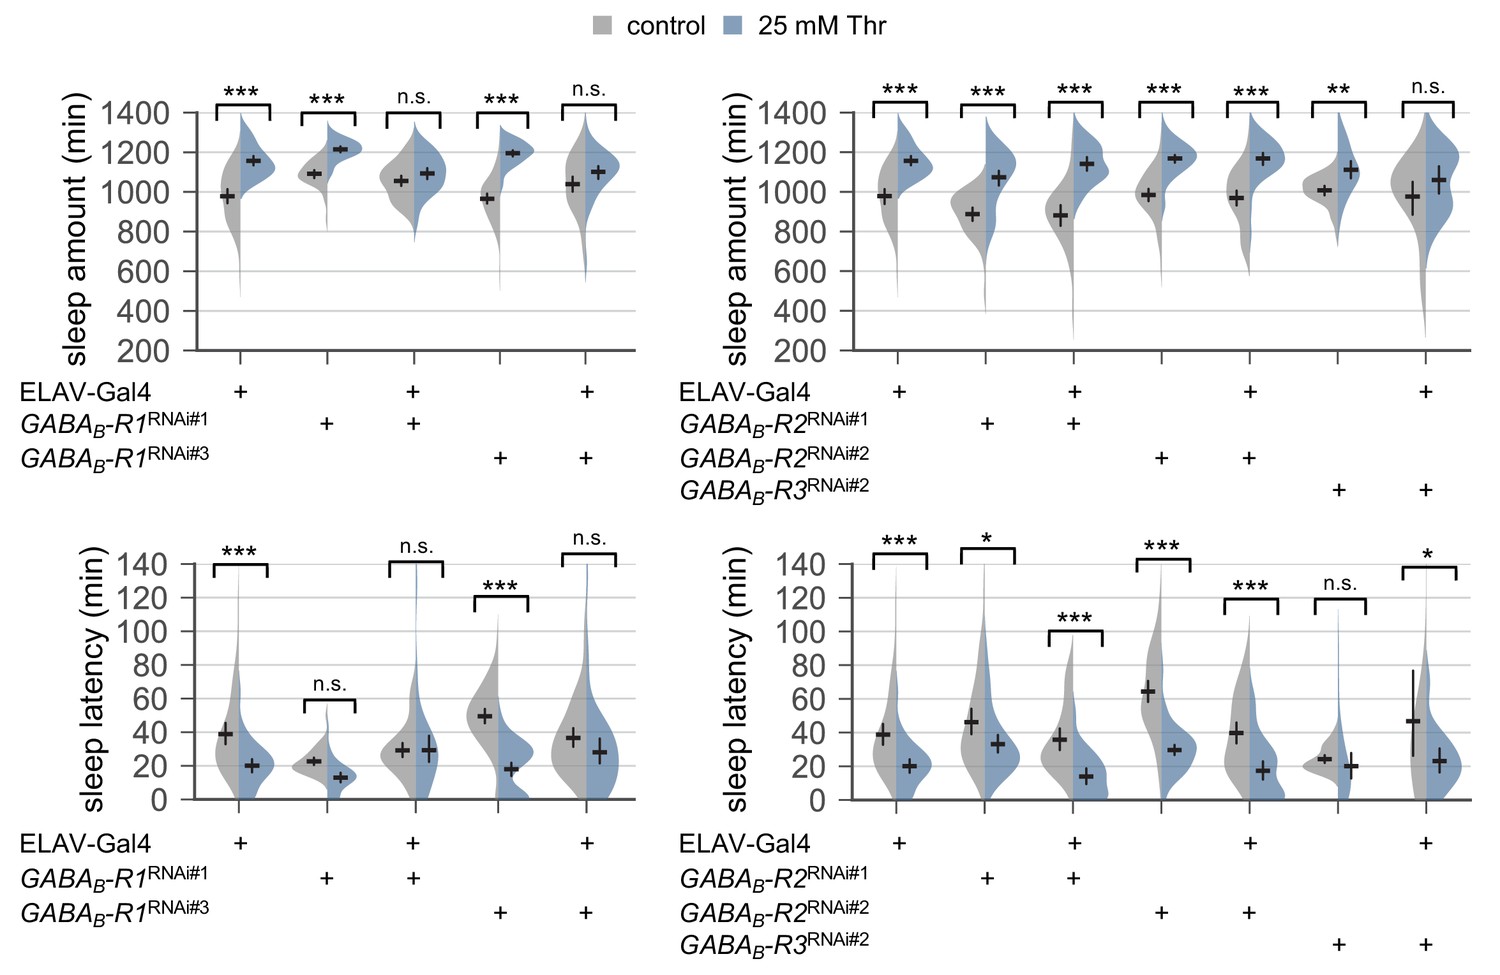
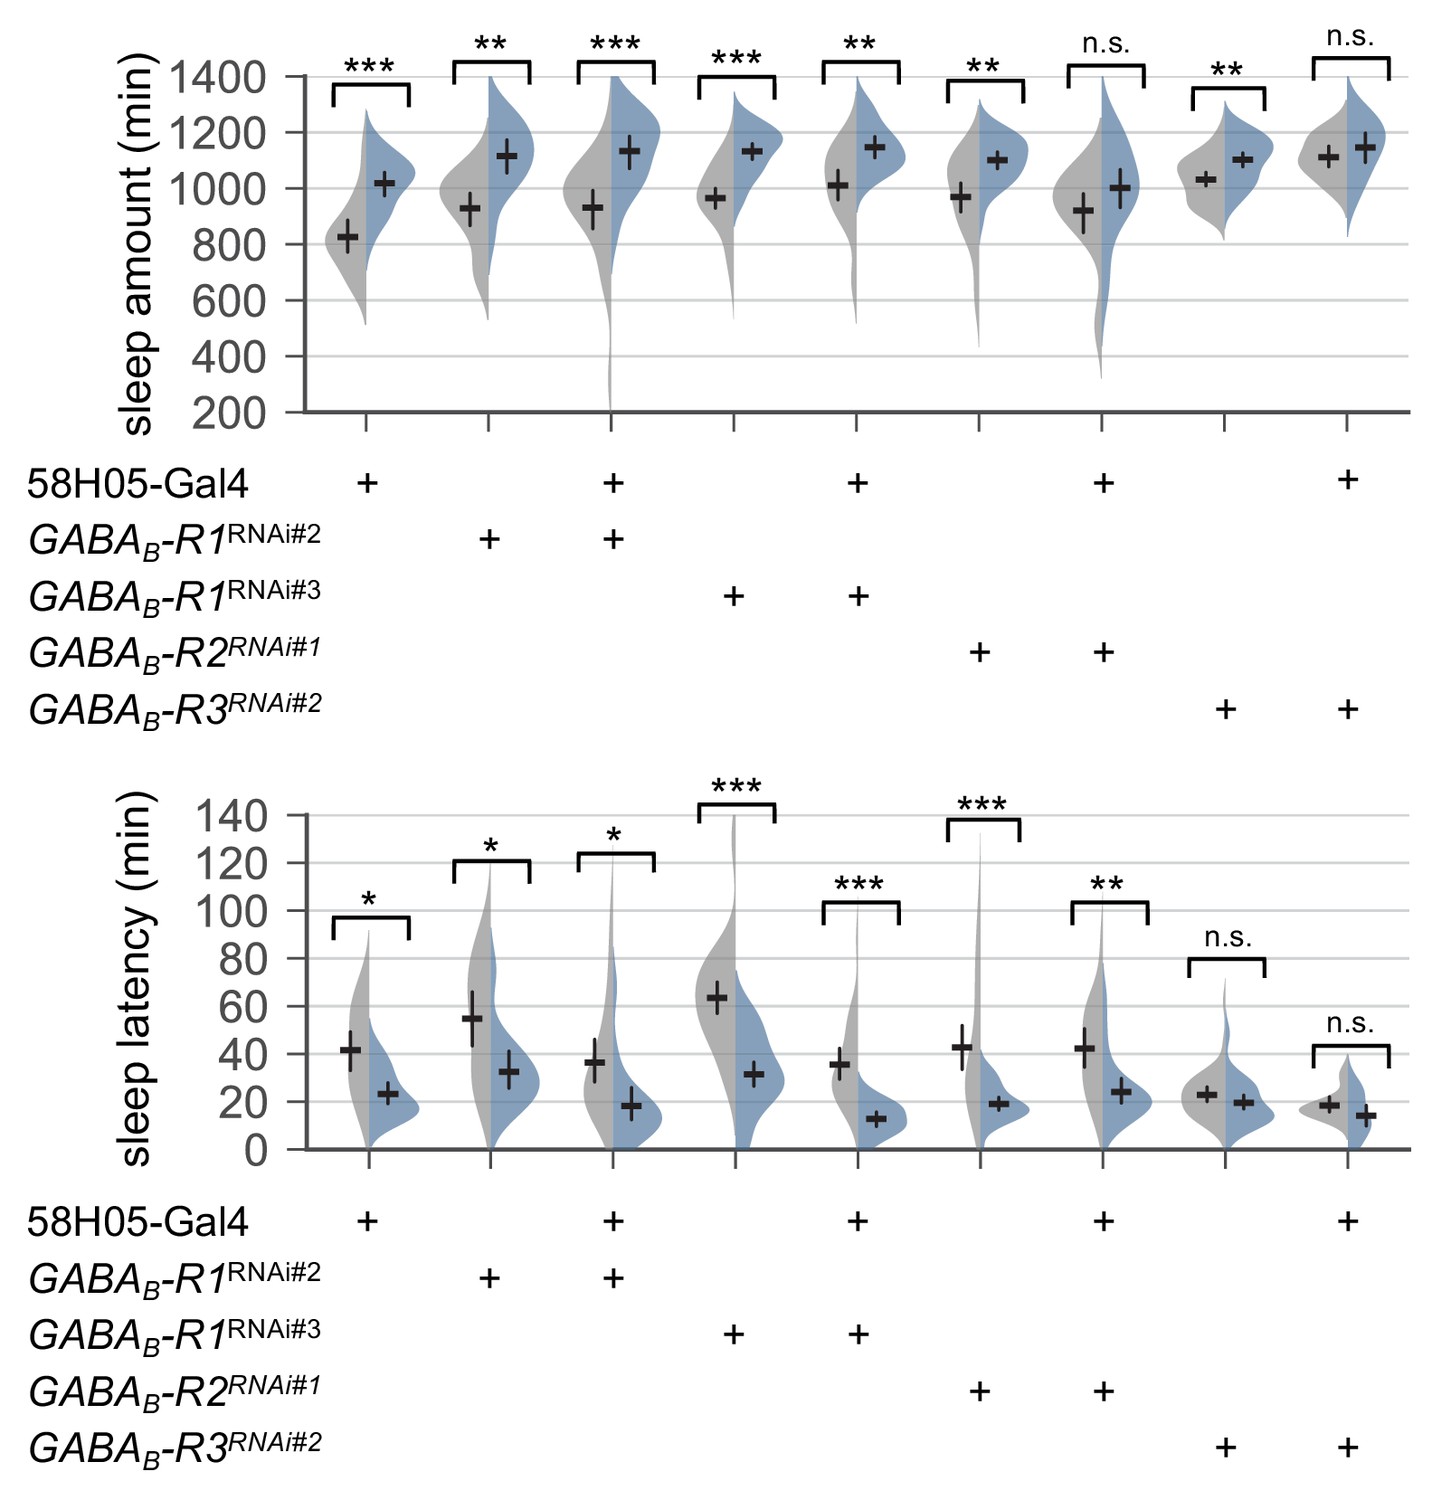
Pan-neuronal depletion of metabotropic GABA receptor R1, but not R2, affects SPET.
Sleep behaviors in individual male flies were monitored similarly to the data presented in Figure 4C. Two-way ANOVA detected significant masking of SPET by the pan-neuronal RNAi on sleep amount (F[2,268]=13.22, p<0.0001 for GABAB-R1RNAi#1; F[2,317]=16.78, p<0.0001 for GABAB-R1RNAi#3) and sleep latency (F[2,268]=6.431, p=0.0019 for GABAB-R1RNAi#1; F[2,317]=9.21, p<0.0001 for GABAB-R1RNAi#3) as compared to their heterozygous controls. Error bars indicate mean ±95% CI (n = 17–72). n.s., not significant; *p<0.05, **p<0.01, ***p<0.001 as determined by Tukey’s multiple comparisons.
Figure 4—figure supplement 6

Structural and functional relevance of alpha-ketobutyric acid, a threonine derivative, to GABA and GABA derivatives.
Space filling models were adopted from Wikipedia (https://en.wikipedia.org/).
Figure 5 with 2 supplements
Metabotropic GABA transmission in ellipsoid body R2 neurons contributes to SPET.
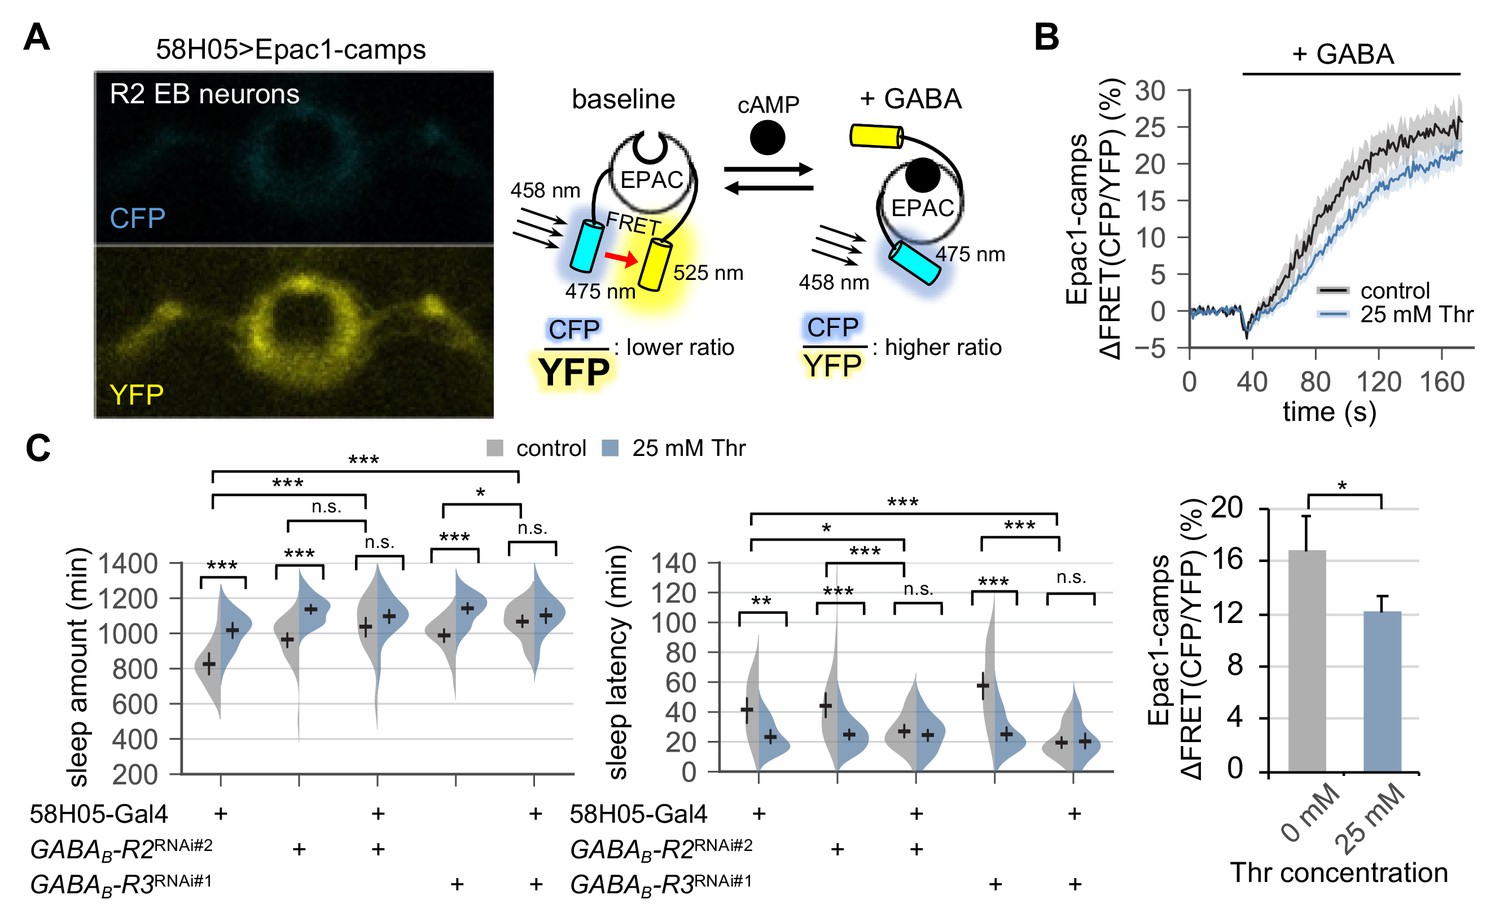
(A) A representative live-brain image of Epac1-camps (a transgenic FRET sensor for cAMP) expressed in R2 EB neurons by 58H05-Gal4 driver (left). An inverse correlation between intracellular cAMP levels and FRET intensity was depicted on the right. CFP, cyan fluorescent protein; YFP, yellow fluorescent protein. (B) Transgenic flies (58H05 > Epac1 camps) were fed on control or threonine-containing food for 4 days in LD cycles at 25°C. Whole brains were dissected out and transferred to an imaging chamber. A time series of the fluorescence images was recorded using a multi-photon microscopy. Where indicated, 100 mM GABA was batch-applied to the imaging medium. FRET analysis was performed using ZEN software. Averaged histograms of the relative changes in FRET intensity (top) and their averaged median values (bottom) were shown. Data represent mean ± SEM (n = 10–14). *p<0.05 as determined by Student’s t-test. (C) The RNAi-mediated deletion of metabotropic GABA receptors (GABAB-R2 and GABAB-R3) in R2 EB neurons induced sleep in control-fed condition and masked SPET. Sleep behaviors in individual male flies were monitored similarly to the data presented in Figure 4C. Two-way ANOVA detected significant masking of SPET by the overexpression of RNAi transgenes in R2 EB neurons on sleep amount (F[2,161]=4.818, p=0.0093 for GABAB-R2RNAi#2; F[2,133]=7.669, p=0.0007 for GABAB-R3RNAi#1) and sleep latency (F[2,161]=5.088, p=0.0072 for GABAB-R2RNAi#2; F[2,133]=14.65, p<0.0001 for GABAB-R3RNAi#1) as compared to their heterozygous controls. Error bars indicate mean ±95% CI (n = 17–34). n.s., not significant; *p<0.05, **p<0.01, ***p<0.001 as determined by Tukey’s multiple comparisons.
Figure 5—figure supplement 1
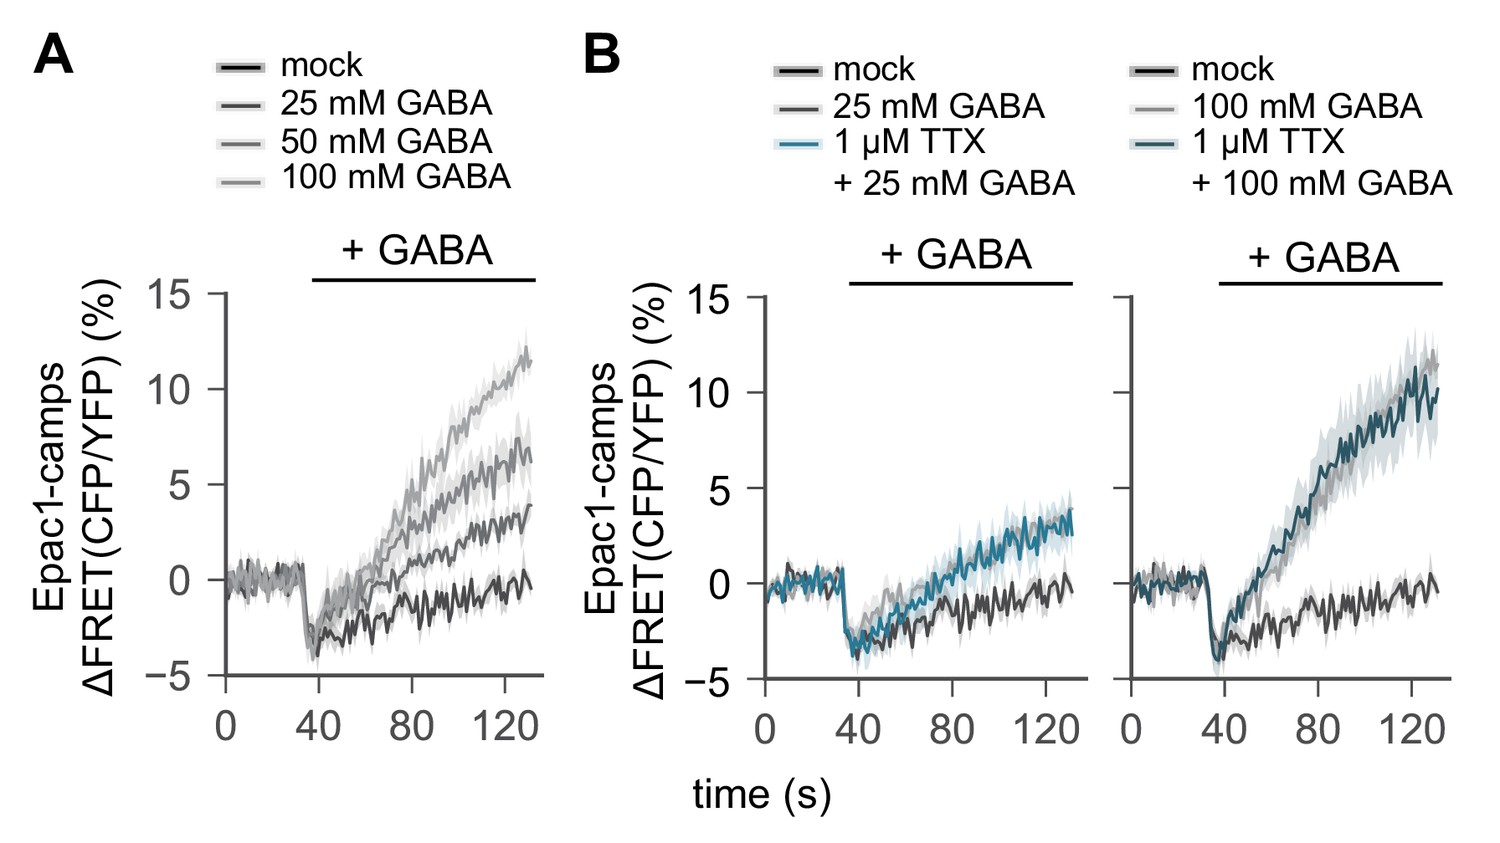
R2 EB neurons are GABA-ceptive.
(A) A transgenic FRET sensor for cAMP (Epac1-camps) was expressed in R2 EB neurons by 58H05-Gal4 driver. Whole brains were dissected out from transgenic female flies and transferred to an imaging chamber. The increasing amount of GABA was batch-applied to the imaging brain samples. A time series of the fluorescence images was recorded using a multi-photon microscopy and their FRET analysis was performed using ZEN software. (B) Where indicated, dissected brains were pre-incubated with 1 µM TTX for 15 min prior to the live-brain imaging of the GABA-induced FRET signals. Data represent mean ± SEM (n = 6–9).
Figure 5—figure supplement 2
Transgenic depletion of metabotropic GABA receptor R1 in R2 EB neurons does not affect SPET.
Sleep behaviors in individual male flies were monitored similarly to the data presented in Figure 4C. Two-way ANOVA detected no significant masking of SPET on sleep amount or sleep latency by the overexpression of individual RNAi transgenes in R2 EB neurons as compared to their heterozygous controls. Error bars indicate mean ±95% CI (n = 17–43). n.s., not significant; *p<0.05, **p<0.01, ***p<0.001 as determined by Tukey’s multiple comparisons.
Figure 6 with 1 supplement
Dietary threonine rescues short-term memory in dumb mutants with memory deficit in a sleep-dependent manner.
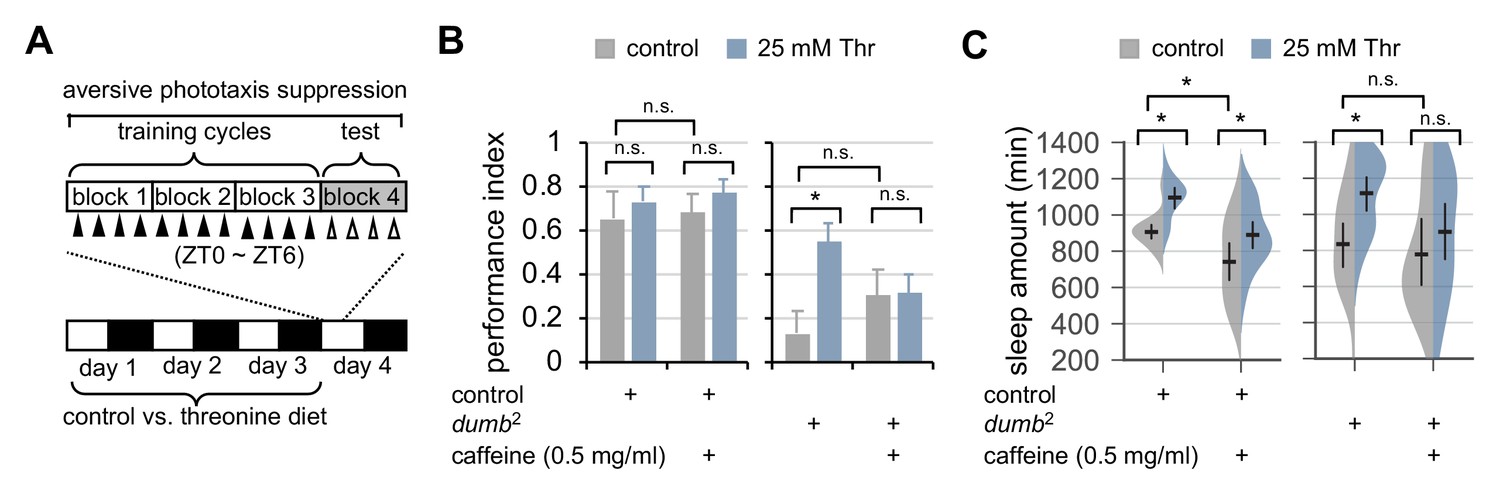
(A) An experimental design of the short-term memory (STM) test after three cycles of training on aversive phototaxis suppression. Wild-type (Canton S) or dumb2 mutant flies were individually loaded on to 5% sucrose food containing either 0 mM (control) or 25 mM threonine (day 0), and then entrained for 3 days in LD cycles at 25°C. Where indicated, 0.5 mg/ml of caffeine was added to the behavior food. Locomotor activity in individual male flies was monitored using the DAM system to analyze sleep behaviors on day 3 prior to the STM test on day 4. (B) The performance index during the test session was calculated in individual flies and averaged for each condition. Two-way ANOVA detected no significant effects of threonine or caffeine on STM in control flies (F[1,41]=0.9644, p=0.3318 for threonine; [1,41]=0.1433, p=0.7070 for caffeine). By contrast, two-way ANOVA detected significant interaction between threonine and caffeine on STM in dumb mutants (F[1,43]=4.329, p=0.0435). Data represent average ± SEM (n = 10–13). (C) Sleep behaviors in individual male flies were analyzed similarly to the data presented in Figure 1A. Two-way ANOVA detected significant effects of threonine or caffeine on daily sleep amount in control flies (F[1,62]=18.41, p<0.0001 for threonine; F[1,62]=22.26, p<0.0001 for caffeine), but not their significant interaction (F[1,62]=0.2836, p=0.5963). Additive effects of threonine and caffeine on daily sleep amount were also observed in dumb mutants (F[1,56]=1.091, p=0.3007 by two-way ANOVA). Error bars indicate mean ±95% CI (n = 11–19). n.s., not significant; *p<0.05 as determined by Tukey’s multiple comparisons test.
Figure 6—figure supplement 1
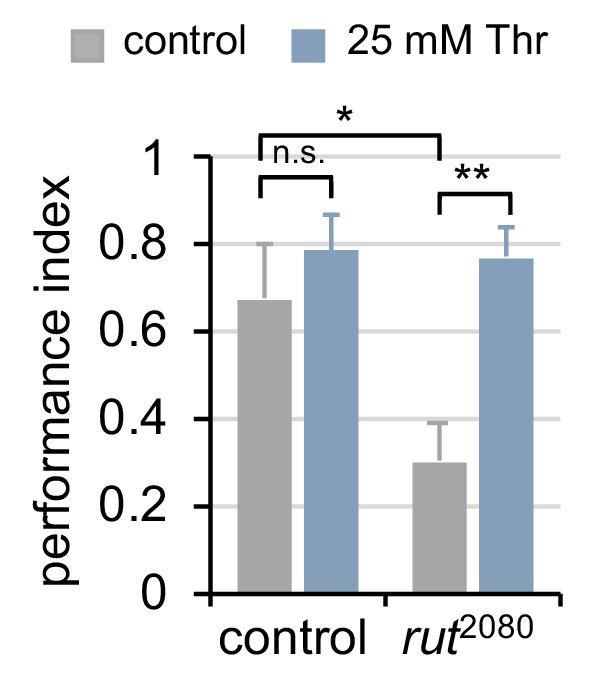
Dietary threonine rescues short-term memory in rutabaga mutants with memory deficit.
Wild-type or rutabaga mutant flies (rut2080) were fed control or threonine-containing food for 3 days in LD cycles at 25°C. Aversive phototaxic suppression was then tested in individual male flies as depicted in Figure 6A. The performance index during the test session was calculated in individual flies and averaged for each condition. Data represent average ± SEM (n = 7–12). n.s., not significant; *p<0.05, **p<0.01 as determined by two-way ANOVA, Tukey’s multiple comparisons test.
Figure 7
Genetic suppression of threonine 3-dehydrogenase elevates endogenous threonine levels and facilitates sleep onset.
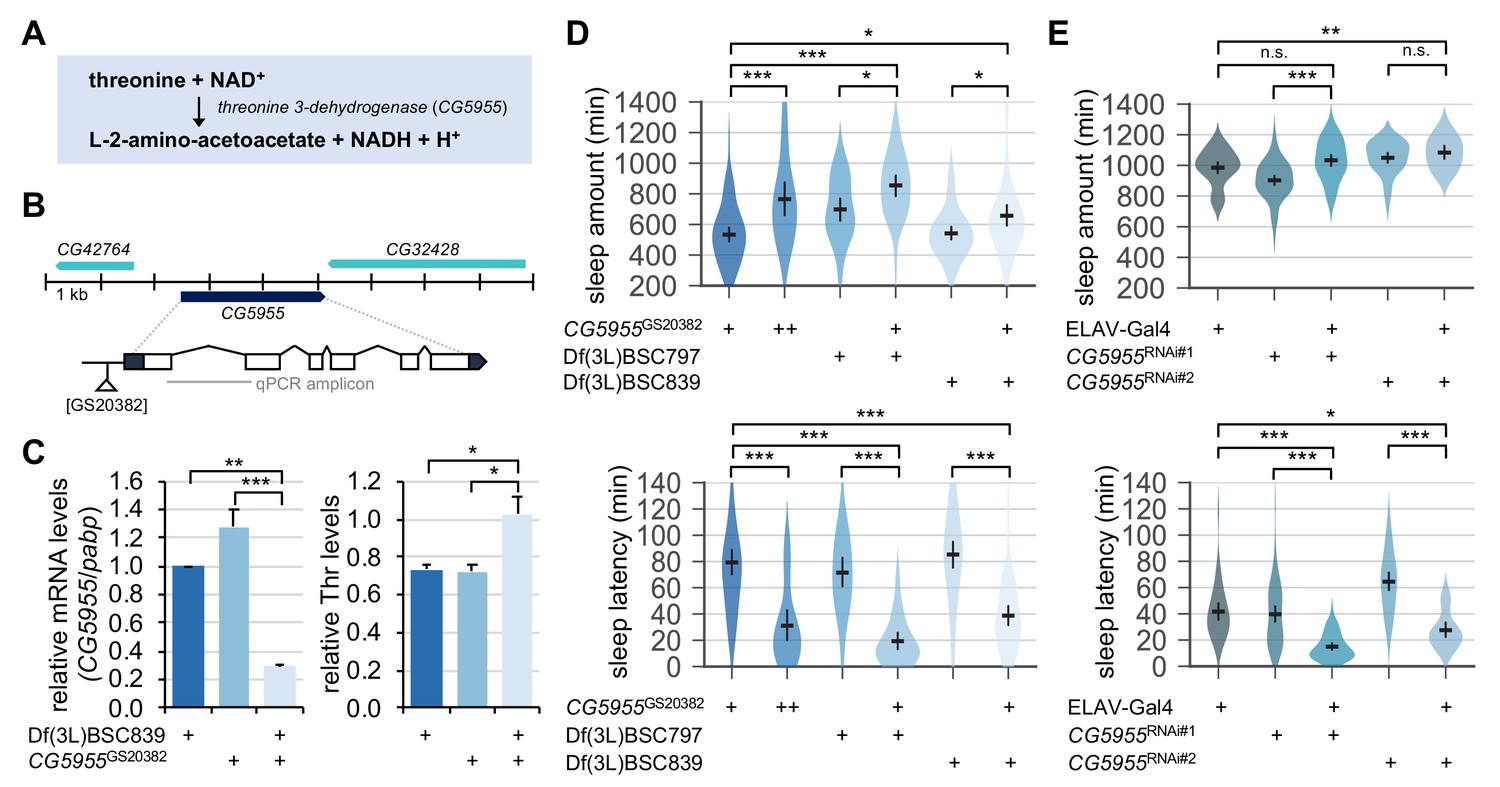
(A) A threonine metabolism catalyzed by threonine 3-dehydrogenase (CG5955). (B) A hypomorphic mutant allele of the P element insertion ([GS20382]) in the CG5955 locus. An amplicon used in quantitative PCR was depicted by a gray line. (C) Trans-heterozygous mutations in CG5955 reduced CG5955 mRNA levels (left, normalized to polyA-binding protein mRNA levels) but elevated endogenous threonine levels (right, normalized to protein levels). Data represent mean ± SEM (n = 3). *p<0.05, **p<0.01, ***p<0.001 as determined by one-way ANOVA, Tukey’s multiple comparisons test. (D) Loss-of-function mutations in CG5955 promoted sleep. CG5955 mutants were loaded on to 5% sucrose (day 0) and entrained in LD cycles at 25°C. Sleep behaviors in individual female flies were analyzed on day 3 and averaged for each genotype. Error bars indicate mean ±95% CI (n = 26–76). *p<0.05, ***p<0.001 as determined by one-way ANOVA, Tukey’s multiple comparisons test. (E) Pan-neuronal depletion of CG5955 expression shortened sleep latency. Sleep behaviors in individual male flies were analyzed as described above due to the X-chromosomal insertion of the pan-neuronal ELAV-Gal4 driver. DICER-2 was co-expressed with each of two independent RNAi transgenes (CG5955RNAi #1 and CG5955RNAi #2) to enhance the RNAi effects. Error bars indicate mean ±95% CI (n = 20–64). n.s., not significant; *p<0.05, **p<0.01, ***p<0.001 as determined by one-way ANOVA, Dunnett’s multiple comparisons test.
Tables
Key resources table
| Reagent type (species) or resource | Designation | Source or reference | Identifiers | Additional information |
|---|---|---|---|---|
| Genetic reagent (D. melanogaster) | w1118 | Bloomington Drosophila Stock Center | RRID:BDSC_5905 | |
| Genetic reagent (D. melanogaster) | Canton S | Korea Drosophila Resource Center | Stock #K211 | |
| Genetic reagent (D. melanogaster) | CG5955GS20382 | Kyoto Drosophila Genomics and Genetics Resources | RRID:DGGR_201409 | |
| Genetic reagent (D. melanogaster) | Df(3L)BSC797 | Bloomington Drosophila Stock Center | RRID:BDSC_27369 | CG5955 deficiency |
| Genetic reagent (D. melanogaster) | Df(3L)BSC839 | Bloomington Drosophila Stock Center | RRID:BDSC_27917 | CG5955 deficiency |
| Genetic reagent (D. melanogaster) | rut2080 | Bloomington Drosophila Stock Center | RRID:BDSC_9405 | |
| Genetic reagent (D. melanogaster) | DA1dumb2 | Harvard Medical School | RRID: FlyBase_FBst1017920 | Dop1R1f02676 |
| Genetic reagent (D. melanogaster) | ELAV-Gal4 | Bloomington Drosophila Stock Center | RRID:BDSC_458 | |
| Genetic reagent (D. melanogaster) | GAD1-Gal4 | Bloomington Drosophila Stock Center | RRID:BDSC_51630 | |
| Genetic reagent (D. melanogaster) | 58H05-Gal4 | Bloomington Drosophila Stock Center | RRID:BDSC_39198 | |
| Genetic reagent (D. melanogaster) | Gr5a-Gal4 | Bloomington Drosophila Stock Center | RRID:BDSC_57591 | |
| Genetic reagent (D. melanogaster) | Gr33a-Gal4 | Bloomington Drosophila Stock Center | RRID:BDSC_31425 | |
| Genetic reagent (D. melanogaster) | Gr66a-Gal4 | Bloomington Drosophila Stock Center | RRID:BDSC_28801 | |
| Genetic reagent (D. melanogaster) | Orco-Gal4 | Bloomington Drosophila Stock Center | RRID:BDSC_26818 | |
| Genetic reagent (D. melanogaster) | Lkc275 | Bloomington Drosophila Stock Center | RRID:BDSC_16324 | |
| Genetic reagent (D. melanogaster) | Df(3L)Exel6123 | Bloomington Drosophila Stock Center | RRID:BDSC_7602 | Lk deficiency |
| Genetic reagent (D. melanogaster) | Lkrc003 | Bloomington Drosophila Stock Center | RRID:BDSC_16250 | |
| Genetic reagent (D. melanogaster) | Df(3L)BSC557 | Bloomington Drosophila Stock Center | RRID:BDSC_25119 | Lkr deficiency |
| Genetic reagent (D. melanogaster) | per01 | PMID: 9630223 | RRID:BDSC_80917 | |
| Genetic reagent (D. melanogaster) | ClkJrk | PMID: 9630223 | RRID:BDSC_24515 | |
| Genetic reagent (D. melanogaster) | PDF-Gal4 | PMID: 10619432 | ||
| Genetic reagent (D. melanogaster) | UAS-ClkDN | Tanoue et al., 2004 | RRID:BDSC_36318 | |
| Genetic reagent (D. melanogaster) | RdlMDRR | Kyoto Drosophila Genomics and Genetics Resources | RRID:DGGR_106444 | |
| Genetic reagent (D. melanogaster) | Rdl1 | Kyoto Drosophila Genomics and Genetics Resources | RRID:DGGR_106453 | |
| Genetic reagent (D. melanogaster) | GABA-TPL | Bloomington Drosophila Stock Center | RRID:BDSC_19461 | GABATPL00338, null mutants |
| Genetic reagent (D. melanogaster) | GABA-TF | Harvard Medical School | RRID:FlyBase_FBst101711 | GABATf01602, hypomorphic |
| Genetic reagent (D. melanogaster) | GABA-TLL | Kyoto Drosophila Genomics and Genetics Resources | RRID:DGGR_141269 | GABATLL04492, hypomorphic |
| Genetic reagent (D. melanogaster) | UAS-GABA-T | Chen et al., 2015 | RRID:FlyBase_FBst0491743 | |
| Genetic reagent (D. melanogaster) | Df(3L)BSC731 | Bloomington Drosophila Stock Center | RRID:BDSC_26829 | GABA-T deficiency |
| Genetic reagent (D. melanogaster) | UAS-shibirets | Kitamoto, 2001 | ||
| Genetic reagent (D. melanogaster) | 30Y-Gal4 | Bloomington Drosophila Stock Center | RRID:BDSC_30818 | |
| Genetic reagent (D. melanogaster) | TH-Gal4 | Bloomington Drosophila Stock Center | RRID:BDSC_8848 | |
| Genetic reagent (D. melanogaster) | UAS-mLexA-VP16-NFAT | Masuyama et al., 2012 | RRID:BDSC_66542 | |
| Genetic reagent (D. melanogaster) | UAS-Epac1-camps | Bloomington Drosophila Stock Center | RRID:BDSC_25407 | |
| Genetic reagent (D. melanogaster) | UAS-CG5955RNAi#1 | Vienna Drosophila Resource Center | RRID:FlyBase_FBst0452036 | V15838 |
| Genetic reagent (D. melanogaster) | UAS-CG5955RNAi#2 | Bloomington Drosophila Stock Center | RRID:BDSC_64566 | |
| Genetic reagent (D. melanogaster) | UAS-Kir | PMID: 11222642 | ||
| Genetic reagent (D. melanogaster) | UAS-GABAB-R1RNAi#1 | Vienna Drosophila Resource Center | RRID:FlyBase_FBst0473313 | V101440 |
| Genetic reagent (D. melanogaster) | UAS-GABAB-R1RNAi#2 | Vienna Drosophila Resource Center | RRID:FlyBase_FBst0490977 | V330042 |
| Genetic reagent (D. melanogaster) | UAS-GABAB-R1RNAi#3 | Bloomington Drosophila Stock Center | RRID:BDSC_51817 | T51817 |
| Genetic reagent (D. melanogaster) | UAS-GABAB-R2RNAi#1 | Vienna Drosophila Resource Center | RRID:FlyBase_FBst0452890 | V1784 |
| Genetic reagent (D. melanogaster) | UAS-GABAB-R2RNAi#2 | Vienna Drosophila Resource Center | RRID:FlyBase_FBst0452896 | V1785 |
| Genetic reagent (D. melanogaster) | UAS-GABAB-R3RNAi#1 | Vienna Drosophila Resource Center | RRID:FlyBase_FBst0468888 | V50176 |
| Genetic reagent (D. melanogaster) | UAS-GABAB-R3RNAi#2 | Vienna Drosophila Resource Center | RRID:FlyBase_FBst0477558 | V108036 |
| Chemical compound, drug | EOS | Tokyo Chemical Industry | Cat. No. S0445 | |
| Chemical compound, drug | NipA | Sigma | Cat. No. 211672 | |
| Chemical compound, drug | THIP | Tocris | Cat. No. 0807 | Also known as gaboxadol, 2000x stock |
| Chemical compound, drug | SKF-97541 | Tocris | Cat. No. 0379 | 10000x stock |
| Chemical compound, drug | GABA | Acros | Cat. No. AC103280250 | 10x stock |
| Chemical compound, drug | Pyruvate | Sigma | Cat. No. P2256 | |
| Chemical compound, drug | Tetrodotoxin (TTX) | Alomone Labs | Cat. No. T-550 | 1000x stock |
| Chemical compound, drug | caffeine | Alfa Aesar | Cat. No. A10431 | 1000x stock |
| Antibody | Mouse anti-GFP, monoclonal | UC Davis/NIH NeuroMab Facility | RRID:AB_10671955 | 1:1000 dilution |
| Antibody | Rabbit anti-GABA, polyclonal | Sigma | RRID:AB_477652 | 1:2000 dilution |
| Antibody | Rabbit anti-TH, polyclonal | Millipore | RRID:AB_390204 | 1:1000 dilution |
| Antibody | Donkey anti-Mouse AF488 | Jackson Immunoresearch | RRID:AB_2340846 | 1:600 dilution |
| Antibody | Donkey anti-Rabbit AF594 | Jackson Immunoresearch | RRID:AB_2340621 | 1:600 dilution |
Additional files
-
Transparent reporting form
- https://doi.org/10.7554/eLife.40593.029
Download links
A two-part list of links to download the article, or parts of the article, in various formats.
Downloads (link to download the article as PDF)
Open citations (links to open the citations from this article in various online reference manager services)
Cite this article (links to download the citations from this article in formats compatible with various reference manager tools)
Sleep-promoting effects of threonine link amino acid metabolism in Drosophila neuron to GABAergic control of sleep drive
eLife 8:e40593.
https://doi.org/10.7554/eLife.40593


