Auxiliary subunits keep AMPA receptors compact during activation and desensitization
- Humboldt Universität zu Berlin, Germany
- Leibniz Forschungsinstitut für Molekulare Pharmakologie (FMP), Germany
- NeuroCure, Charité Universitätsmedizin, Germany
Figures
Figure 1
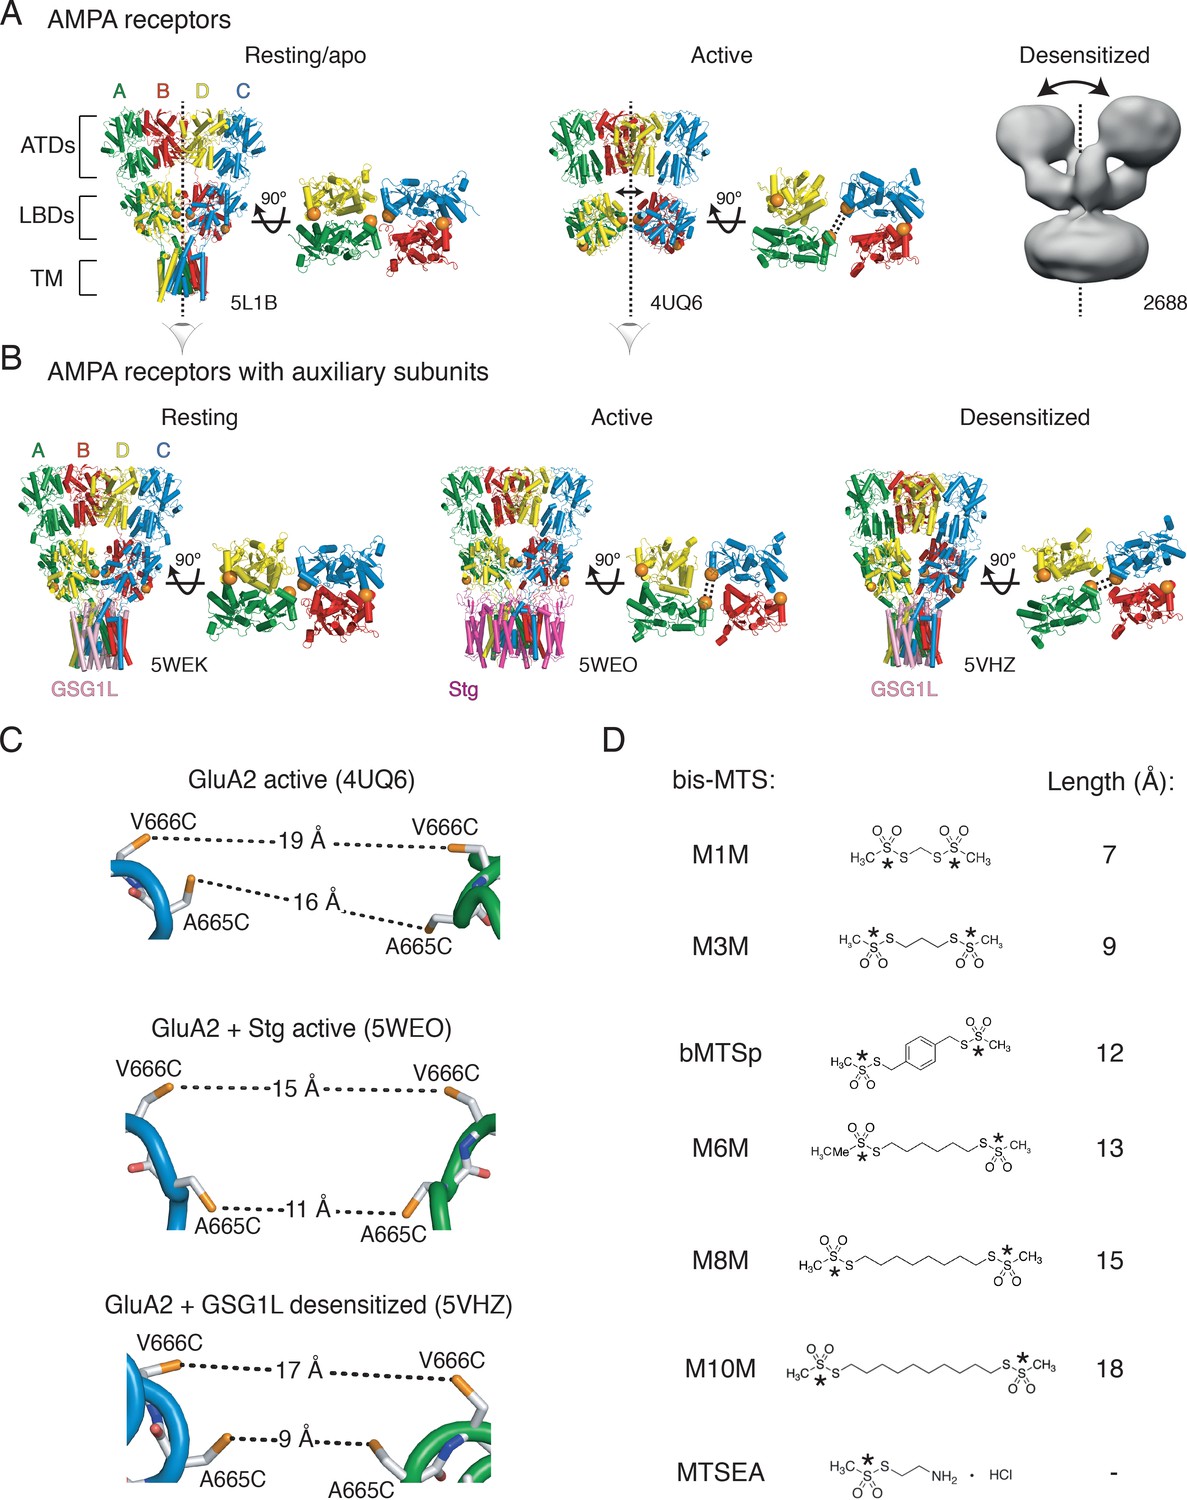
Geometry of AMPA receptors.
(A) Structures of full-length AMPA receptors in resting, active and desensitized states. Accesion codes for PBD or EMDB are indicated. Subunits are color-coded: A – green, B – red, C – blue and D – yellow. Brackets delineate AMPA receptor domains: ATDs – amino terminal domains, LBDs – ligand binding domains and TM – transmembrane region. The cytoplasmic domain is not resolved. Vertical, dashed lines indicate central twofold symmetry axis. The corresponding LBDs are shown in the bottom-up view. Double-headed arrows indicate movements of dimers in the extracellualr layer. Each orange sphere indicates position of residues 665 and 666 (mutated individually in this study). In subunits A and C, the mutated residues are facing each other across the LBD inter-dimer interface, whereas in subunits B and D, they are located on the outer surface of the protein. Based on the structures, the mutated residues could cross-link across subunits A and C, as symbolized by the double dashed lines for the functional states studied here. The measured distances are shown in (C). Details are omitted for the desensitized structure (2688) due to its low resolution. (B) Same as in (A) but for GluA2 structures complexed with auxiliary subunits: Stg – Stargazin (dark purple) and GSG1L (light purple). (C) Distances between sulfhydryl groups (orange) of individually mutated residues, A665C and V666C, in agonist-bound strucures shown in panels A and B. (D) Structures of bifunctional (bis-MTS: M1M-M10M) and monofunctional (MTSEA) compounds. Lengths were measured between reactive sulphur atoms (SG, asterisks).
Figure 2 with 3 supplements
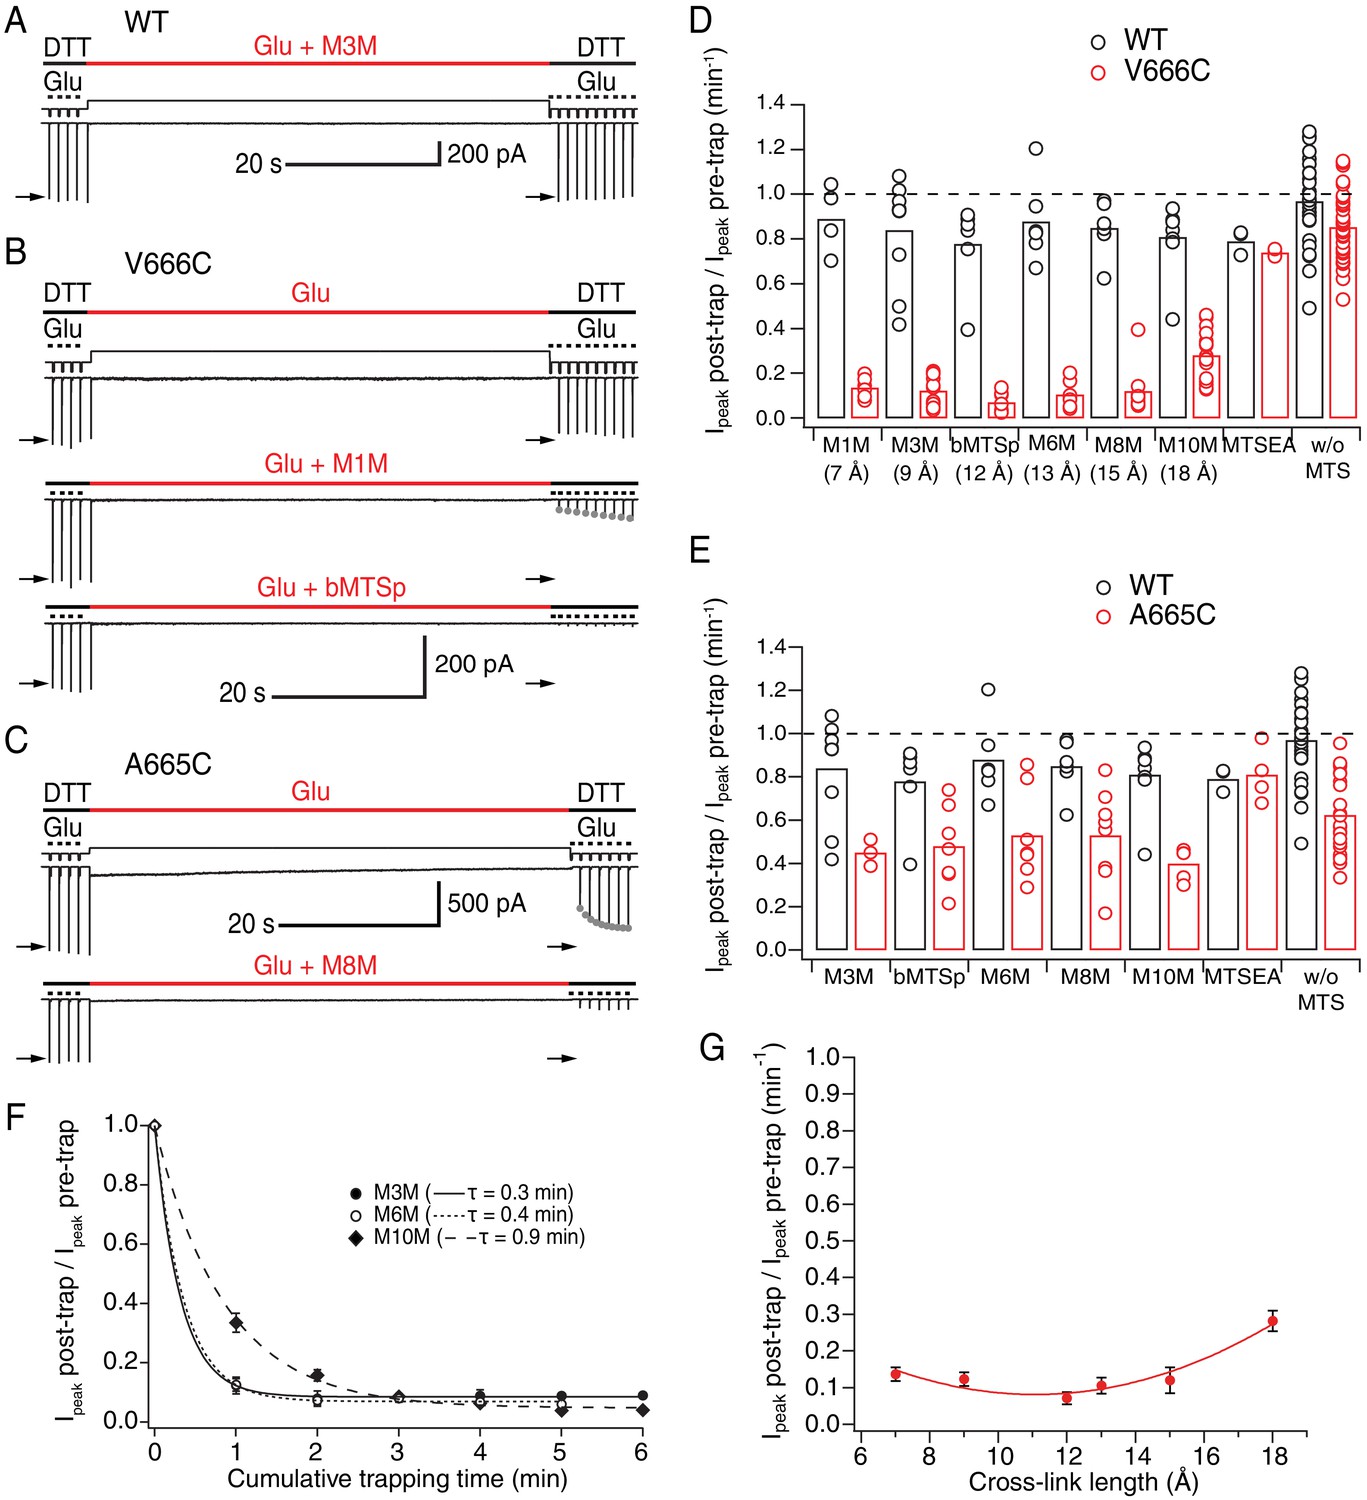
LBDs can separate ≥18 Å in desensitized GluA2.
(A) Control recording of wild-type (WT) GluA2 receptors in response to a trapping protocol. Movements of the piezo reflecting the solution exchange are shown in thin, black lines above the current trace. Composition of the solutions is indicated in thick lines above the piezo trace. Downward ticks are 200 ms control jumps from DTT (1 mM) to DTT and glutamate (Glu, 10 mM). Four pre-trap control pulses were followed by a 1 min long trapping pulse (red line) in Glu (10 mM) and M3M (1 μM). After the trapping pulse, the patch was exposed to 10 post-trap control pulses. The first post-trap pulse gives no response because receptors are desensitized (for details, see Materials and methods). (B) Same as in (A), but for V666C mutant. The top two recordings are from the same patch: in the first trace, V666C receptors were exposed only to Glu. Trapping of the same patch in Glu and M1M (1 μM), results in pronounced peak current reduction, which partly recovered with τrecovery = 30 ± 7 s, n = 5 (grey dots; post-trap control pulses extended to 30 for fit). The bottom trace is a different patch trapped in bMTSp (1 μM), showing even stronger peak current reduction without any recovery. (C) As in (B) but for the A665C mutant. The two traces are paired recordings of the same patch. Post-trap control pulses show that A665C cross-links to itself, but most of the current recovers within several seconds after the trap (grey dots; τrecovery = 3.3 ± 0.4 s, n = 17). If the same patch is now trapped in Glu and M8M (1 μM), the peak current reduction is much more pronounced and does not recover. (D) Summary of the trapping effects for WT (black) and V666C (red) for cross-linkers M1M (7 Å) to M10M (18 Å). Trapping effect after 1 min was calculated as the ratio of the post-trap and pre-trap peak current (arrows in A-C). MTSEA is a monofunctional reagent and ‘w/o MTS’ stands for ‘without MTS’ (Glu only, pooled for all experiments). Dashed line indicates no effect. For peak current reduction in a bis-MTS vs. w/o MTS (pooled), p < 10−7, for all cross-linkers. (E) Same as in (D), but for A665C (red) in cross-linkers M3M (9 Å) to M10M (18 Å). A665C mutant in the presence and absence of an MTS cross-linker resulted in p ≤ 0.02, depending on the cross-linker. For statistics vs. WT and between different bis-MTS, see Figure 2—source data 1. (F) Trapping time for V666C receptors in M3M, M6M and M10M. The 1-min trapping protocol was repeated up to six times, resulting in a cumulative exposure of the patch to a bis-MTS of up to 6 min. The data were fit with a monoexponential for each cross-linker (τ indicated in brackets). (G) Trapping profile of desensitized V666C receptors shows the effect of each cross-linker vs. its length, in the first minute of exposure. The data were fit with a parabola (red line): f(x) = K0 + K1*(x – K2)2 (for details, see Materials and methods).
-
Figure 2—source data 1
Statistics of trapping desensitized wild-type (WT), A665C and V666C receptors with different bis-MTS cross-linkers; data from Figure 2D–E.
The effect was measured after 1 min of exposure to a given bis-MTS reagent.
- https://doi.org/10.7554/eLife.40548.008
Figure 2—figure supplement 1
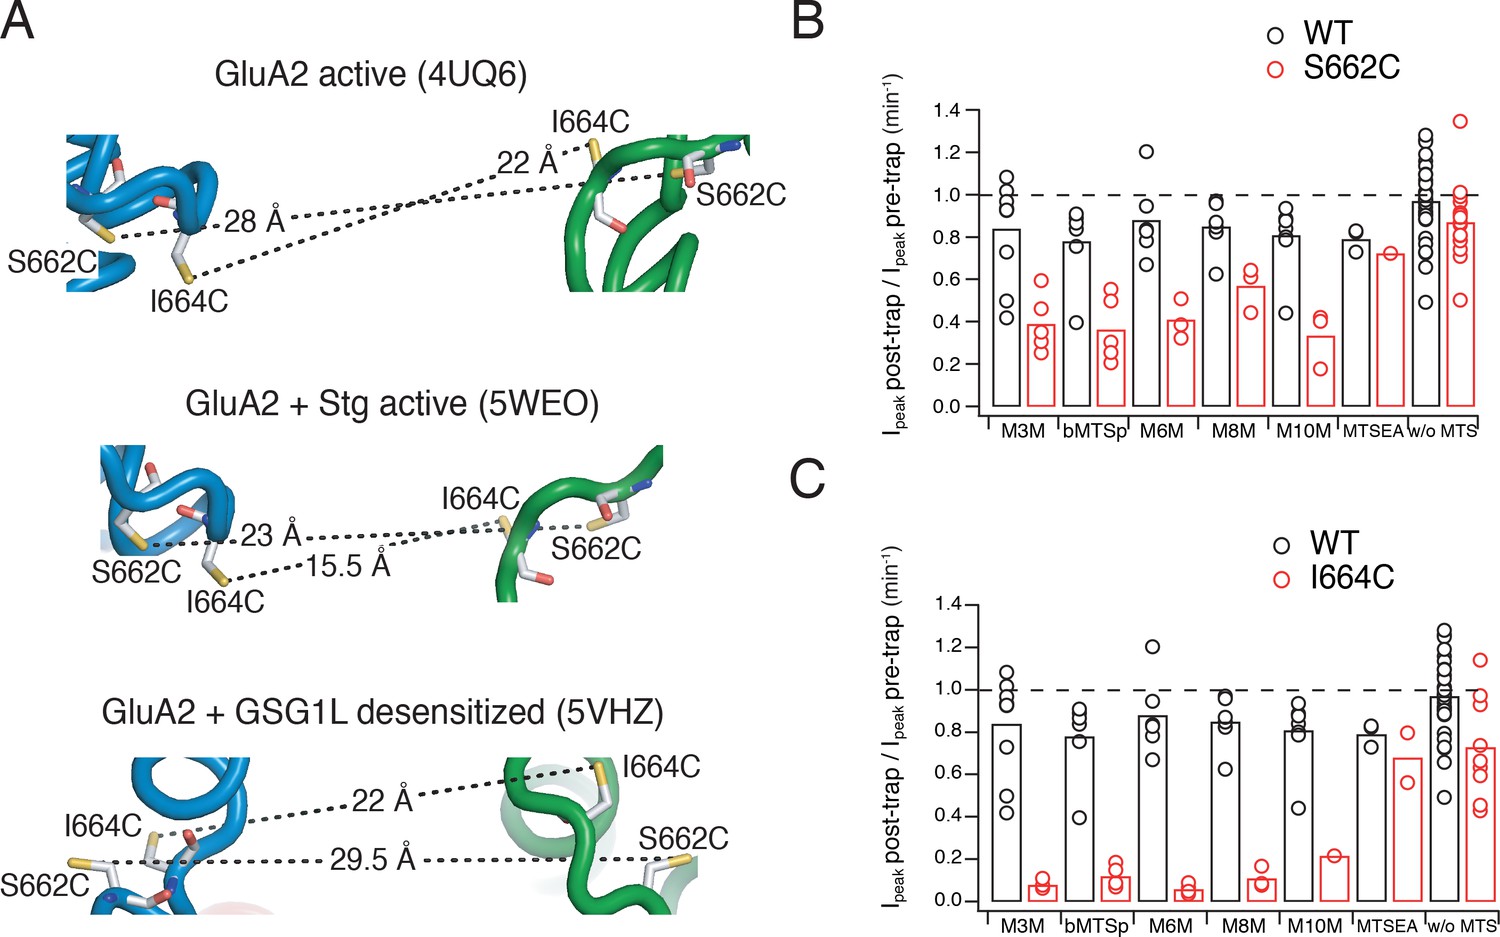
Effects of bis-MTS cross-linkers on S662C and I664C mutants.
(A) Distances between sulfhydryl groups of GluA2 S662C and I664C residues in the respective full-length cryo-EM structures (PDB accession codes in capitals). Color-coding as in Figure 1. (B) Summary of trapping effects for cross-linkers M3M-M10M for S662C mutant compared with WT. WT data are the same as in Figure 2D–E. Trapping effect was measured as a ratio of the peak current post and pre-trap as described in Materials and methods. Dashed line indicates no effect. (D) Same as in (C), but for I664C mutant.
Figure 2—figure supplement 2
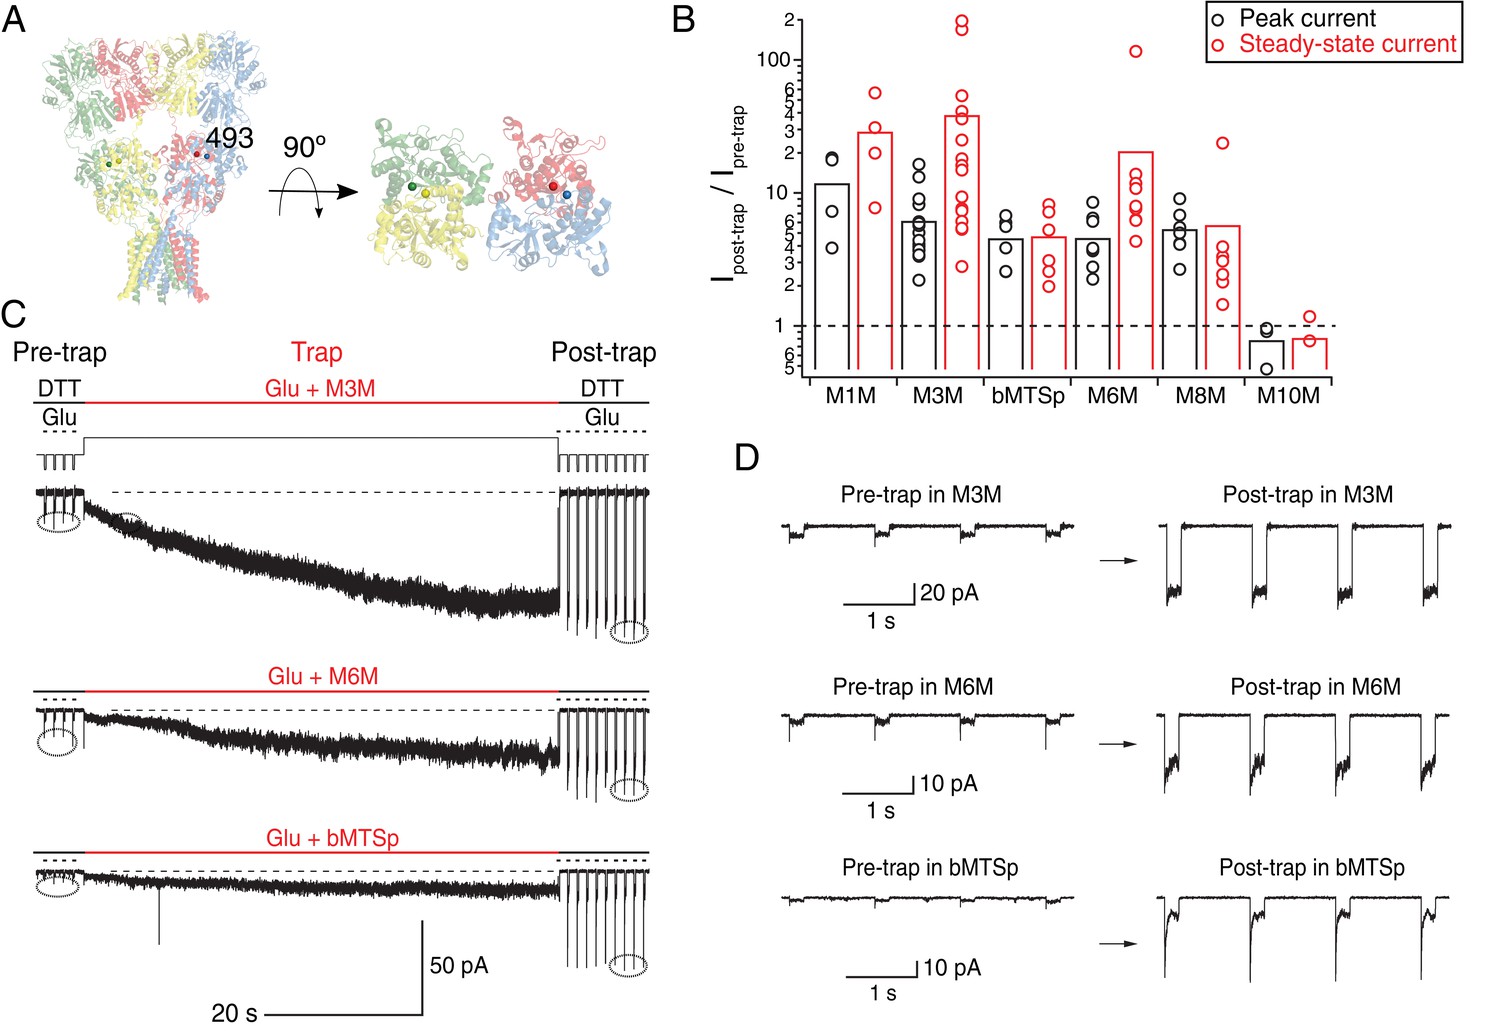
Bis-MTS cross-linkers potentiate K493C currents by accessing intra-dimer space.
(A) Position of the K493C mutant in a full-length GluA2 receptor (PDB: 3 KG). Subunits are color-coded as in Figure 1 and Cα atoms of K493C are shown as spheres. Top-down view of the LBDs shows intra-dimer position of the mutation. (B) Effects of bis-MTS cross-linkers M1M-M10M on peak currents (black) and steady-state currents (red) of K493C mutant. Trapping effects are shown as a ratio of averaged post-trap over averaged pre-trap currents (encircled in (C)). Amplitude of the post-trap current was determined once the steady-state levels were reached, which in some patches took >1 min of exposure to bis-MTS. Dashed line indicates no effect. (C) Current traces of K493C receptors during trapping with various bis-MTS cross-linkers. Legend is the same as in Figure 2A–C. Baseline is indicated as a black, dashed line at the bottom of each trace. Note current increase during the cross-linker application (thick, red line). (D) Zooms of encircled pre- and post-trap control pulses from traces in (C).
Figure 2—figure supplement 3
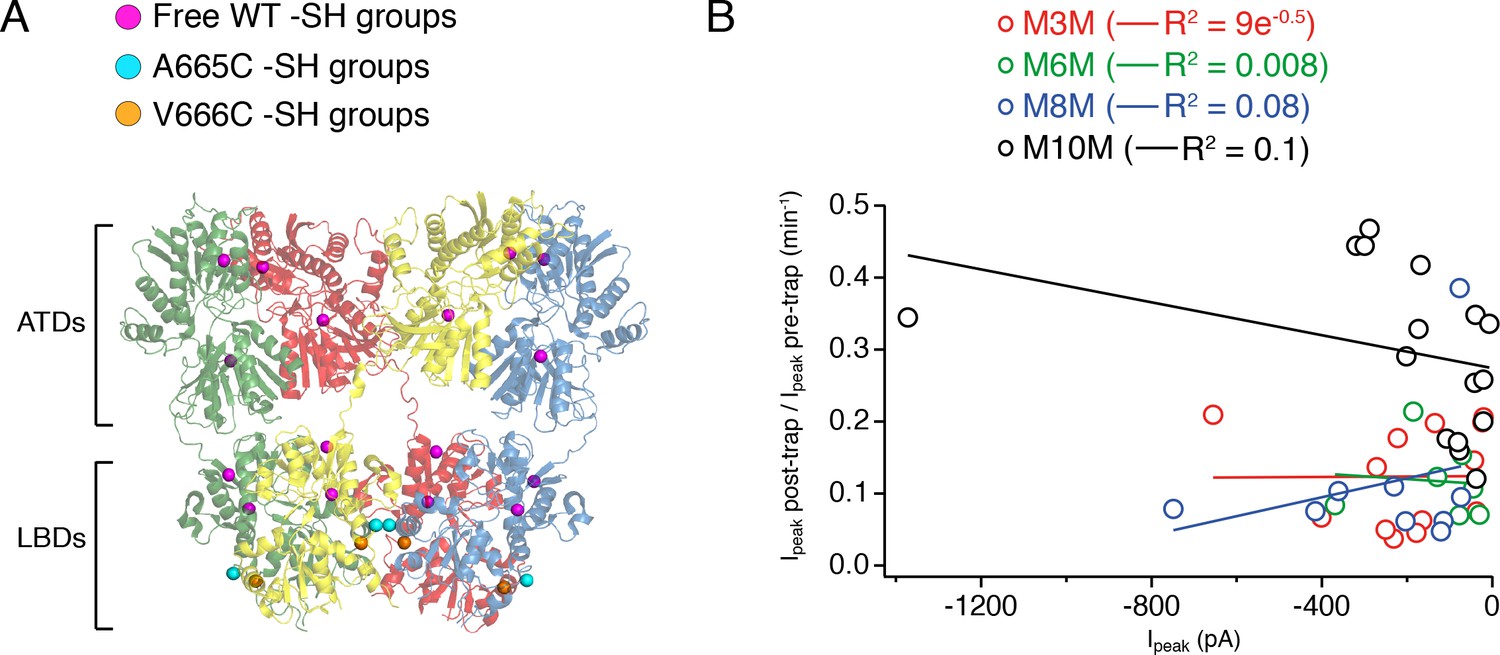
Bis-MTS compounds do not form inter-receptor cross-links.
(A) Extracellular domains of an GluA2 receptor (subunits color-coded as in Figure 1), with SG atoms of wild-type, free cysteines shown as magenta spheres, of A665C mutant as cyan and of V666C as orange spheres. (B) Plot summarizing size of the trapping effect vs. absolute peak current in the patch for M3M (red), M6M (green), M8M (blue) and M10M (black) cross-linkers. Solid lines are linear regression fits with the resulting R2 indicated in brackets.
Figure 3
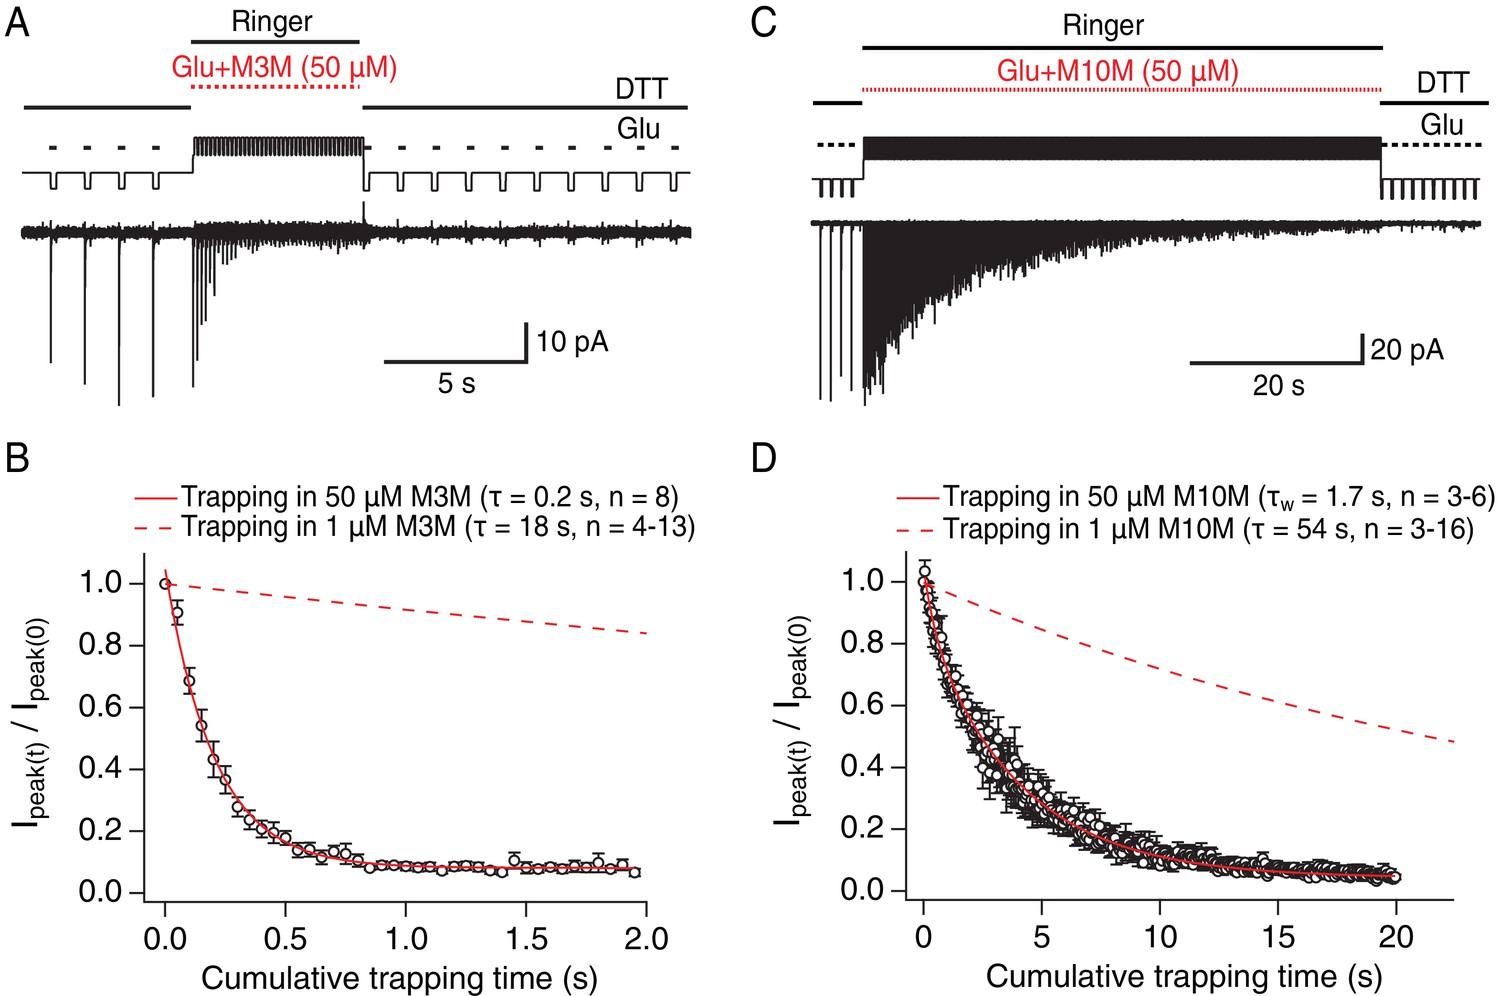
Bis-MTS cross-linkers trap in milliseconds.
(A) Trapping protocol for V666C receptors in 50 μM M3M and 10 mM glutamate (Glu), same as in Figure 2A–C, but with a trapping jump consisting of 50 ms-pulses into 50 μM M3M and 10 mM Glu at 6.7 Hz (thick, red lines), interspersed with 100 ms intervals in Ringer solution. (B) Progression of the peak current reduction in response to the trapping pulses (red in (A)) was determined for each patch, normalized to the first pulse, averaged across patches and plotted. The resulting decrease in the peak current was fit with a monoexponential (red line) with τ = 0.2 s. Dashed line is a fit to trapping in 1 μM M3M from Figure 2F. (C) As in (A), but for M10M, with the trapping jump prolonged to 1 min to complete the peak current reduction. (D) As in (B), but for M10M. Peak current decay was best fit with a double exponential resulting in weighted τW of 1.7 s.
Figure 4 with 1 supplement
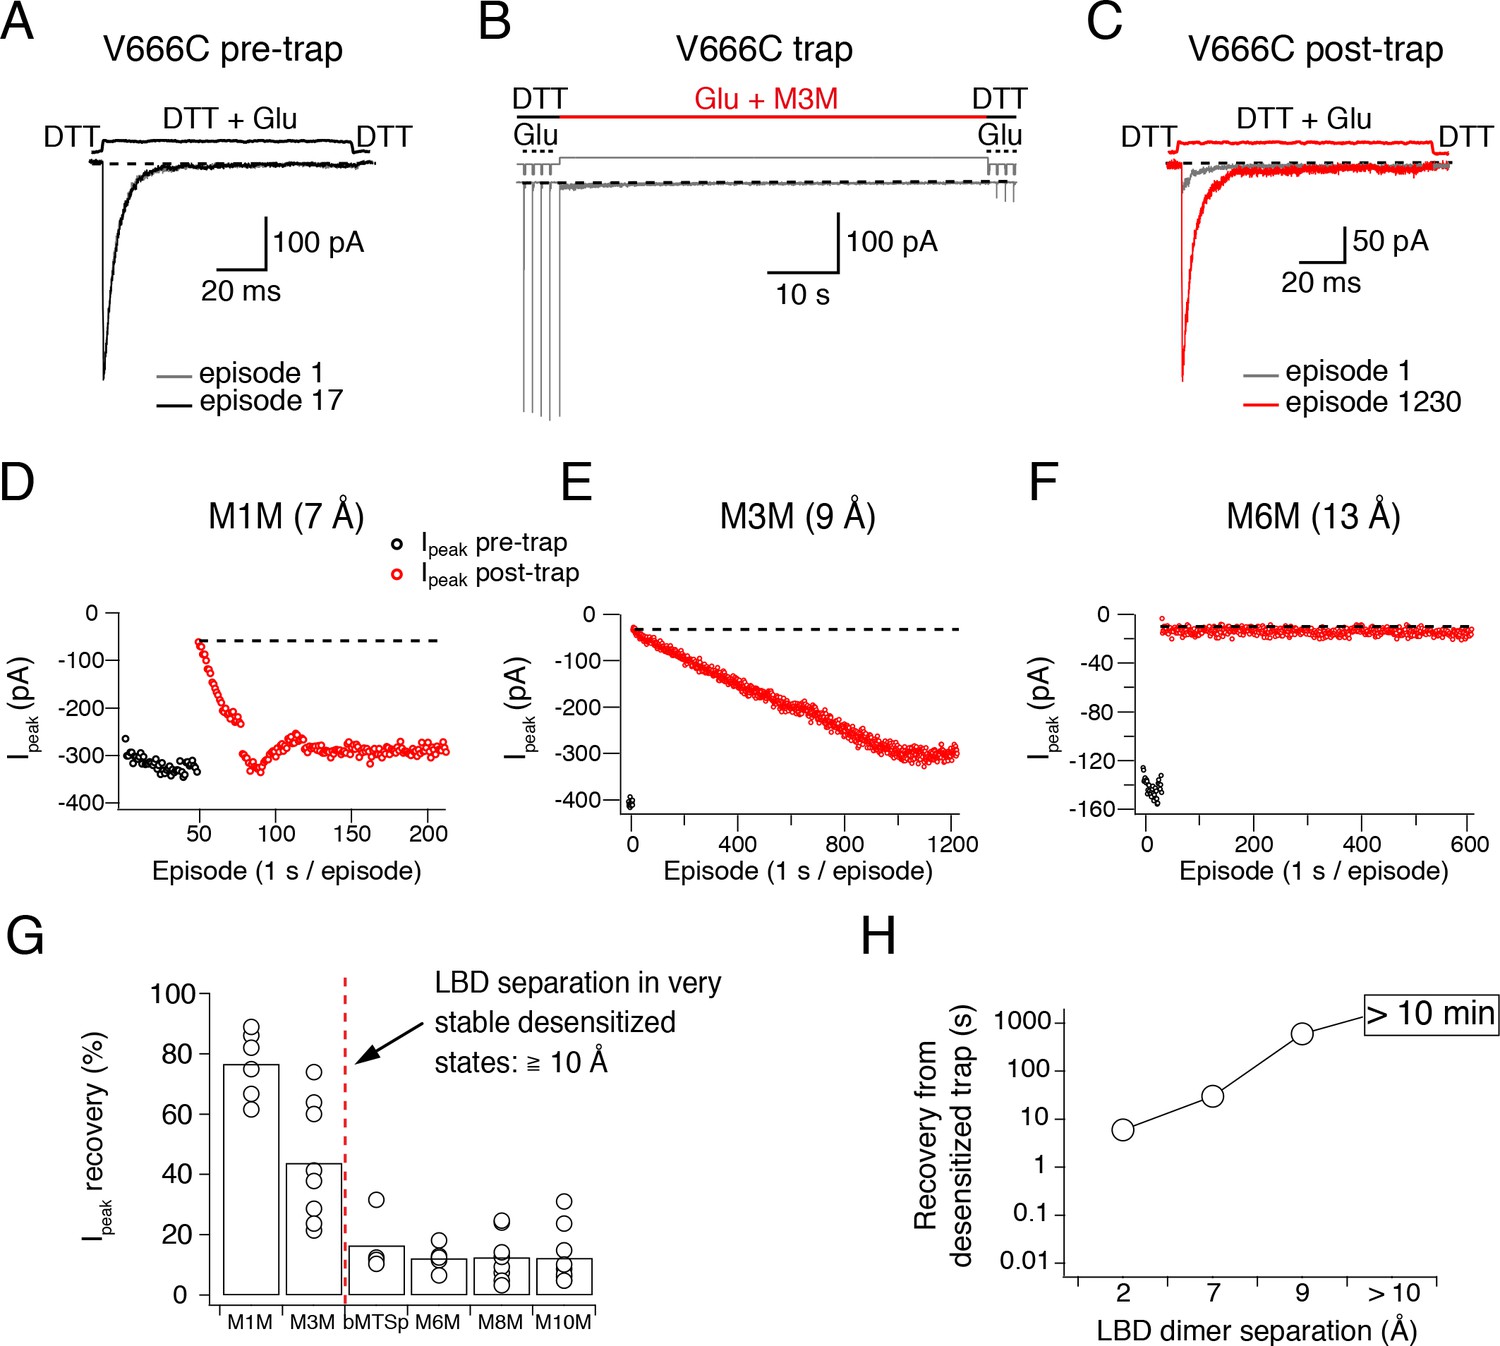
Recovery of trapped desensitized V666C receptors depends on the LBD separation.
(A) To obtain a stable baseline response to glutamate, we first repeated brief glutamate applications in reducing conditions (1 mM DTT). In the given example, we gave 17 pulses (100 ms, 1 Hz). (B) In the following step, the patch was exposed to 1 μM cross-linker (here M3M) and 10 mM Glu for 1 min, with control pulses before and after the trap. (C) After the trapping protocol, the patch was again exposed to fast, reducing Glu jumps like in (A) in order to follow recovery of the response. In this example, we could record 1230 consecutive episodes (~20 min) and obtain almost complete recovery. Note the difference between the current amplitude in the 1st episode (grey) and the 1230th episode (red). The recovery of the patch current (Ipeak) in typical experiments for different cross-linkers is plotted in panels D - F (panel E is the same patch as in panels A - C). Black dots show the responses before the trap and red dots the peak current after the trap. The gap in red dots in (D) represents a switch between recording protocols. (G) Summary of the peak current recovery for different cross-linkers. The percentage of recovered current is the ratio of the peak currents recorded 3–10 min after the trap to the peak current before trapping. Dashed, red line denotes a limit after which no recovery of the current could be measured within 10 min after the trap. (H) Plot of recovery time from trapped desensitized states (as described above and in Materials and methods) vs. the inter-dimer separation at position V666C in the LBD layer. The first data point indicates recovery from V666C disulphide bridges formed in desensitized state.
Figure 4—figure supplement 1
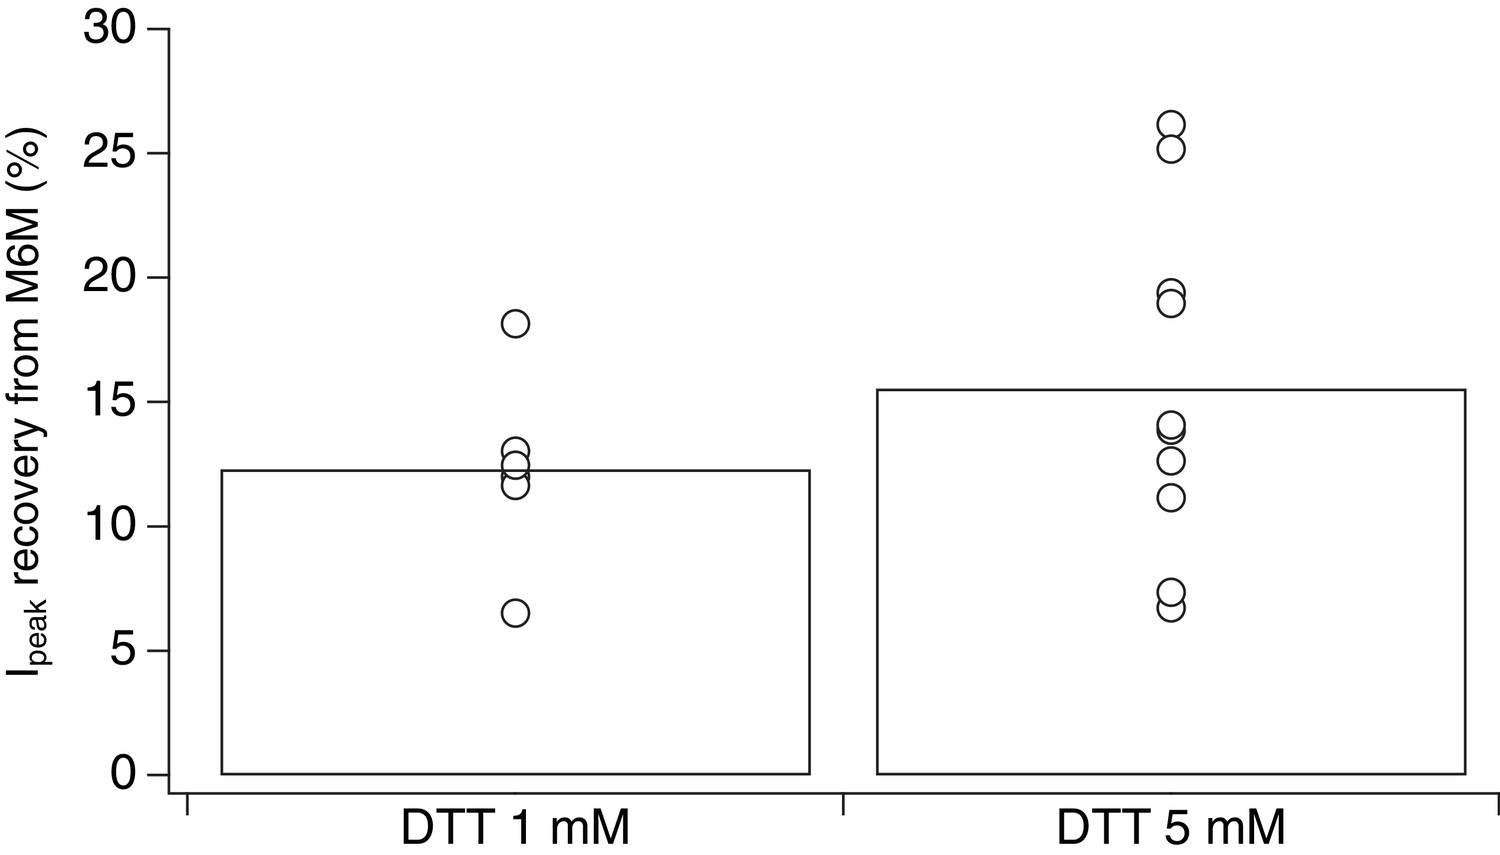
Stronger reducing conditons do not increase recovery of desensitized V666C receptors trapped by M6M.
Increasing the concentraion of the reducing agent DTT from 1 to 5 mM during control pulses did not result in consistent increase in recovery of the peak current after trapping in 1 μM M6M. Recovery experiment was the same as described in Figure 4A–C, but with 5 mM DTT in the control pulses (n = 6 and n = 10 for 1 and 5 mM DTT, respectively). The percentage of recovered peak current was determined as the ratio of the peak current 3–10 min after the trap over the peak current just before the trap.
Figure 5 with 1 supplement
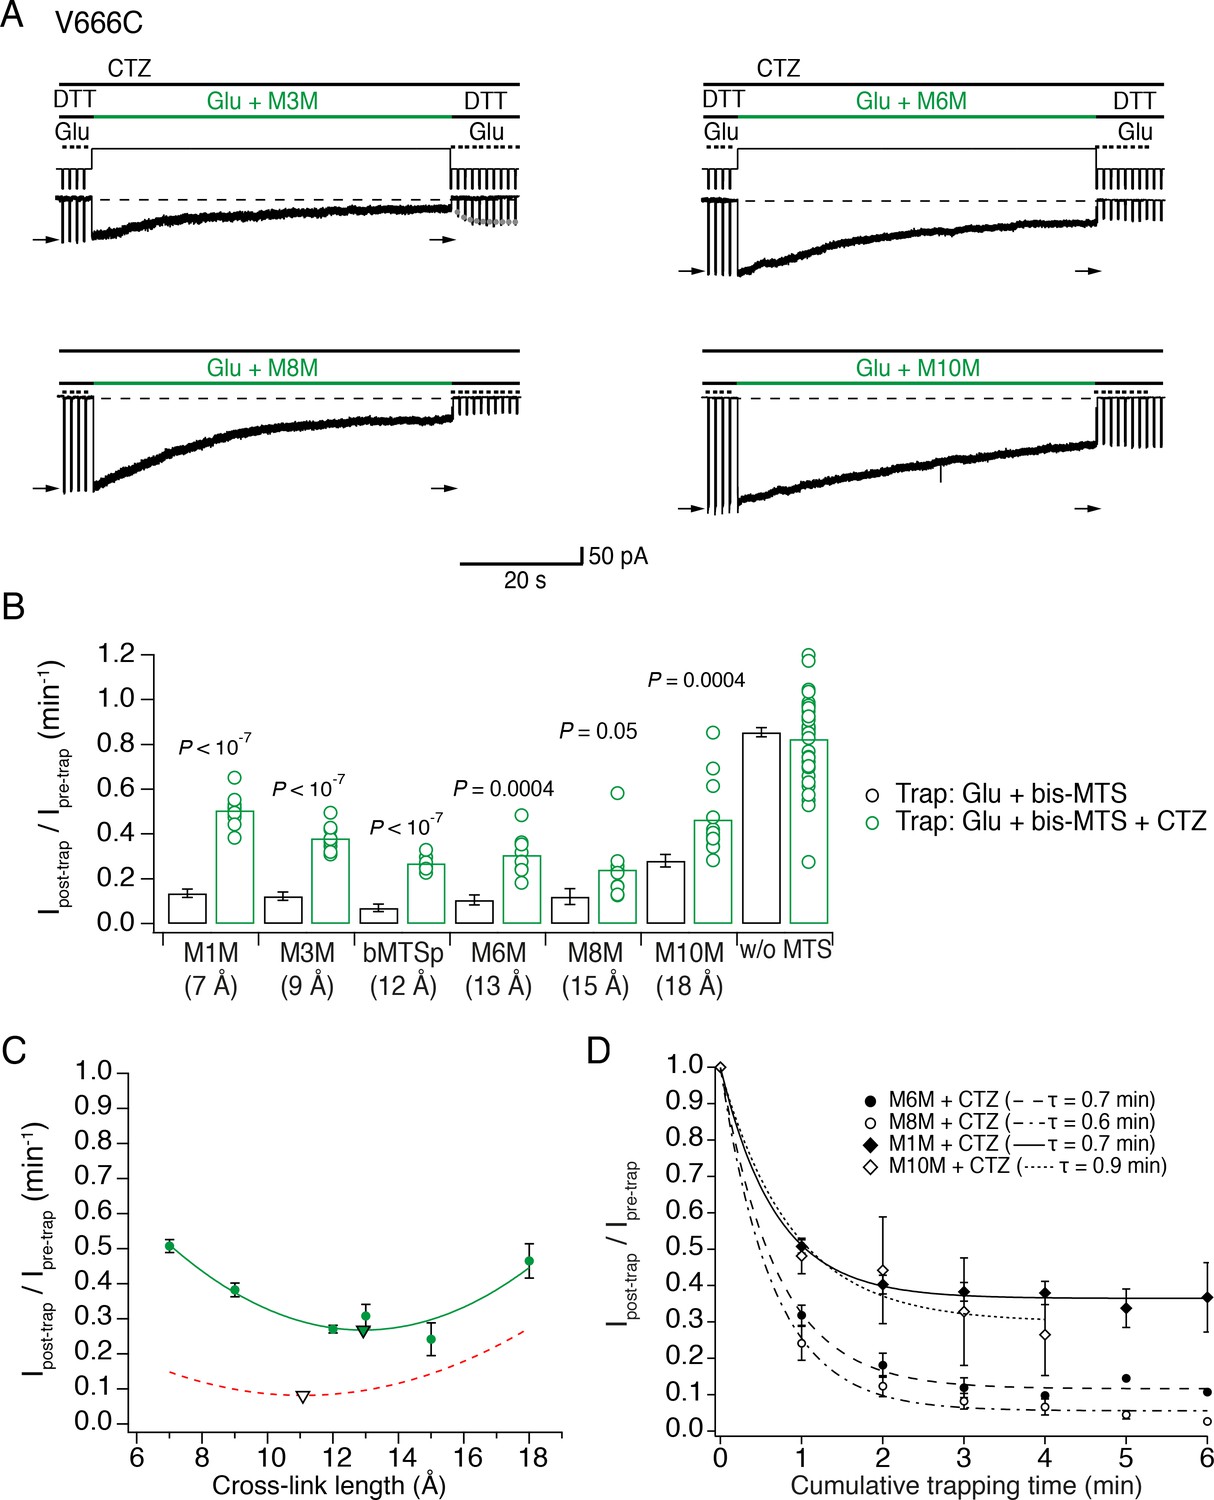
The active LBD layer is dilated.
(A) Current traces of trapping active V666C receptors. Cyclothiazide (CTZ) was included at 100 μM throughout the experiment to block desensitization. The duration of the trapping pulse is indicated in green. For M3M, gray dots indicate recovery from trap immediately after the trap (τ = 2.0 ± 0.2 s, n = 8). Post- and pre-trap current amplitude was determined from the control pulses (arrows). (B) Summary of bis-MTS trapping (1 min) of desensitizing (black) and non-desensitizing V666C receptors (green). Desensitizing data are from Figure 2E. p values compare the desensitizing and non-desensitizing condition. For p values comparing effects with and without bis-MTS and between the cross-linkers, see Figure 5—source data 1. Bis-MTS length is indicated in brackets; ‘w/o MTS’: without MTS. (C) Trapping profile of active V666C receptors after the first minute of exposure fit with parabola (green line), reaching the minimum (green triangle) at (13, 0.3). Trapping profile of desensitized receptors is shown as a red, dashed line (parabola with minimum at 11 Å, black triangle). (D) Dependence of the trapping time on the length of the bis-MTS. V666C receptors were exposed up to six times to the trapping protocol described in (A). Current reduction was determined after each 1-min application to a bis-MTS. Current decay was described with a monexponential fit (τ in brackets).
-
Figure 5—source data 1
Statistics of trapping active V666C receptors with different bis-MTS cross-linkers; data from Figure 5B.
The peak current reduction was measured after 1 min of exposure to a given bis-MTS reagent.
- https://doi.org/10.7554/eLife.40548.014
Figure 5—figure supplement 1
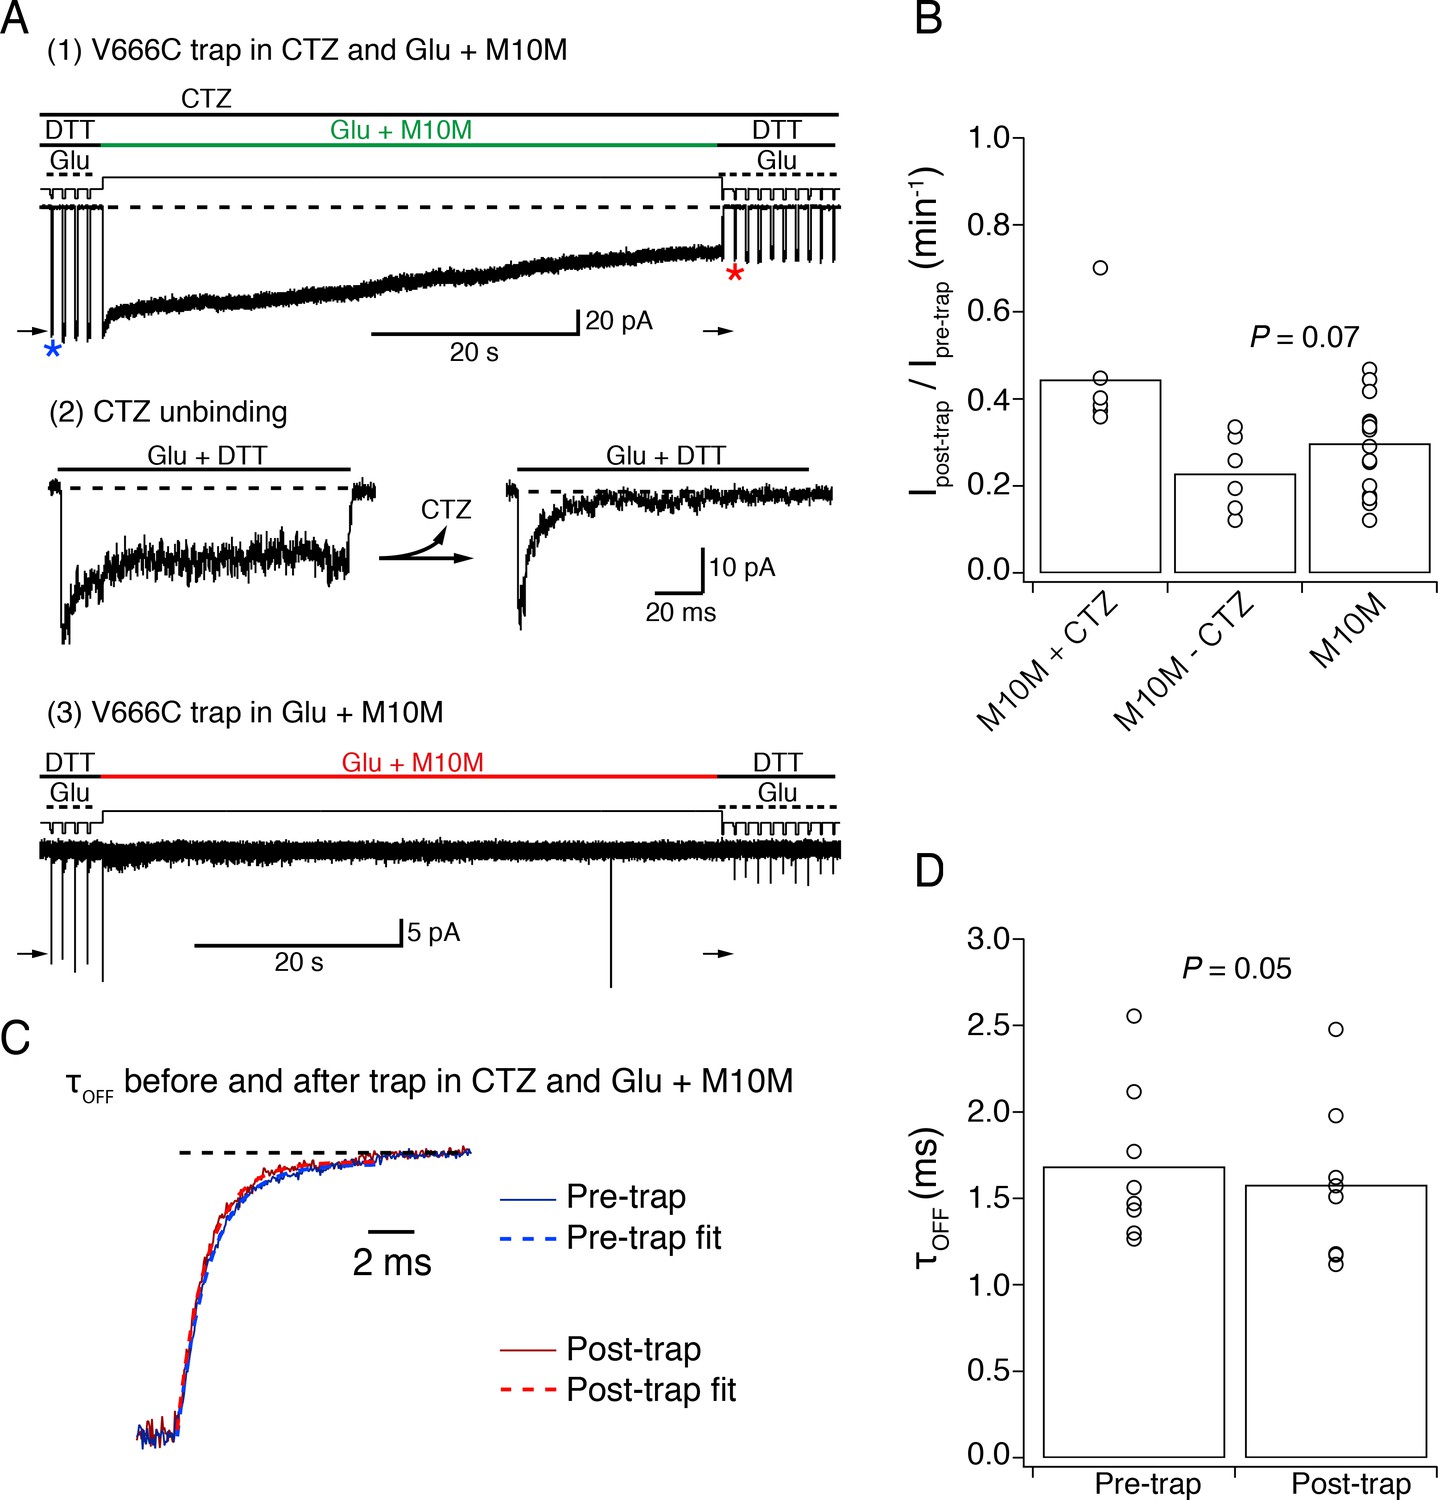
No silent modification of active V666C receptors.
(A) To check whether M10M modifies active V666C receptors silently, a patch containing V666C receptors was first exposed to Glu (10 mM) and M10M (1 µM) in CTZ (100 µM) to block desensitization as shown in (1). Colors are as in Figures 2 and 5. The patch was then exposed to short (100 ms) jumps into 10 mM Glu (in reducing conditions), until CTZ unbound, as deduced from desensitization of the response (2). Freely desensitizing receptors in the same patch were then exposed again to M10M and glutamate, without CTZ (3). (B) Summary of effects on V666C receptors in active state (M10M + CTZ) and after CTZ unbinding (M10M-CTZ) (paired recordings). For comparison, the trapping of patches that were never treated with CTZ (M10M) is also plotted. Pre- and post-trap current amplitudes were measured from peaks indicated with arrows in (A). P value compares patches from which CTZ unbound and patches that were never treated with CTZ. (C) Time constant of deactivation (τOFF) was measured for active V666C receptors before (blue) and after (red) 1 min trap in M10M (from control pulses as indicated with a blue and red star in (A-1)). Normalized current decays were fit with a monoexponential. (D) Summary of τOFF as determined in (C).
Figure 6 with 1 supplement
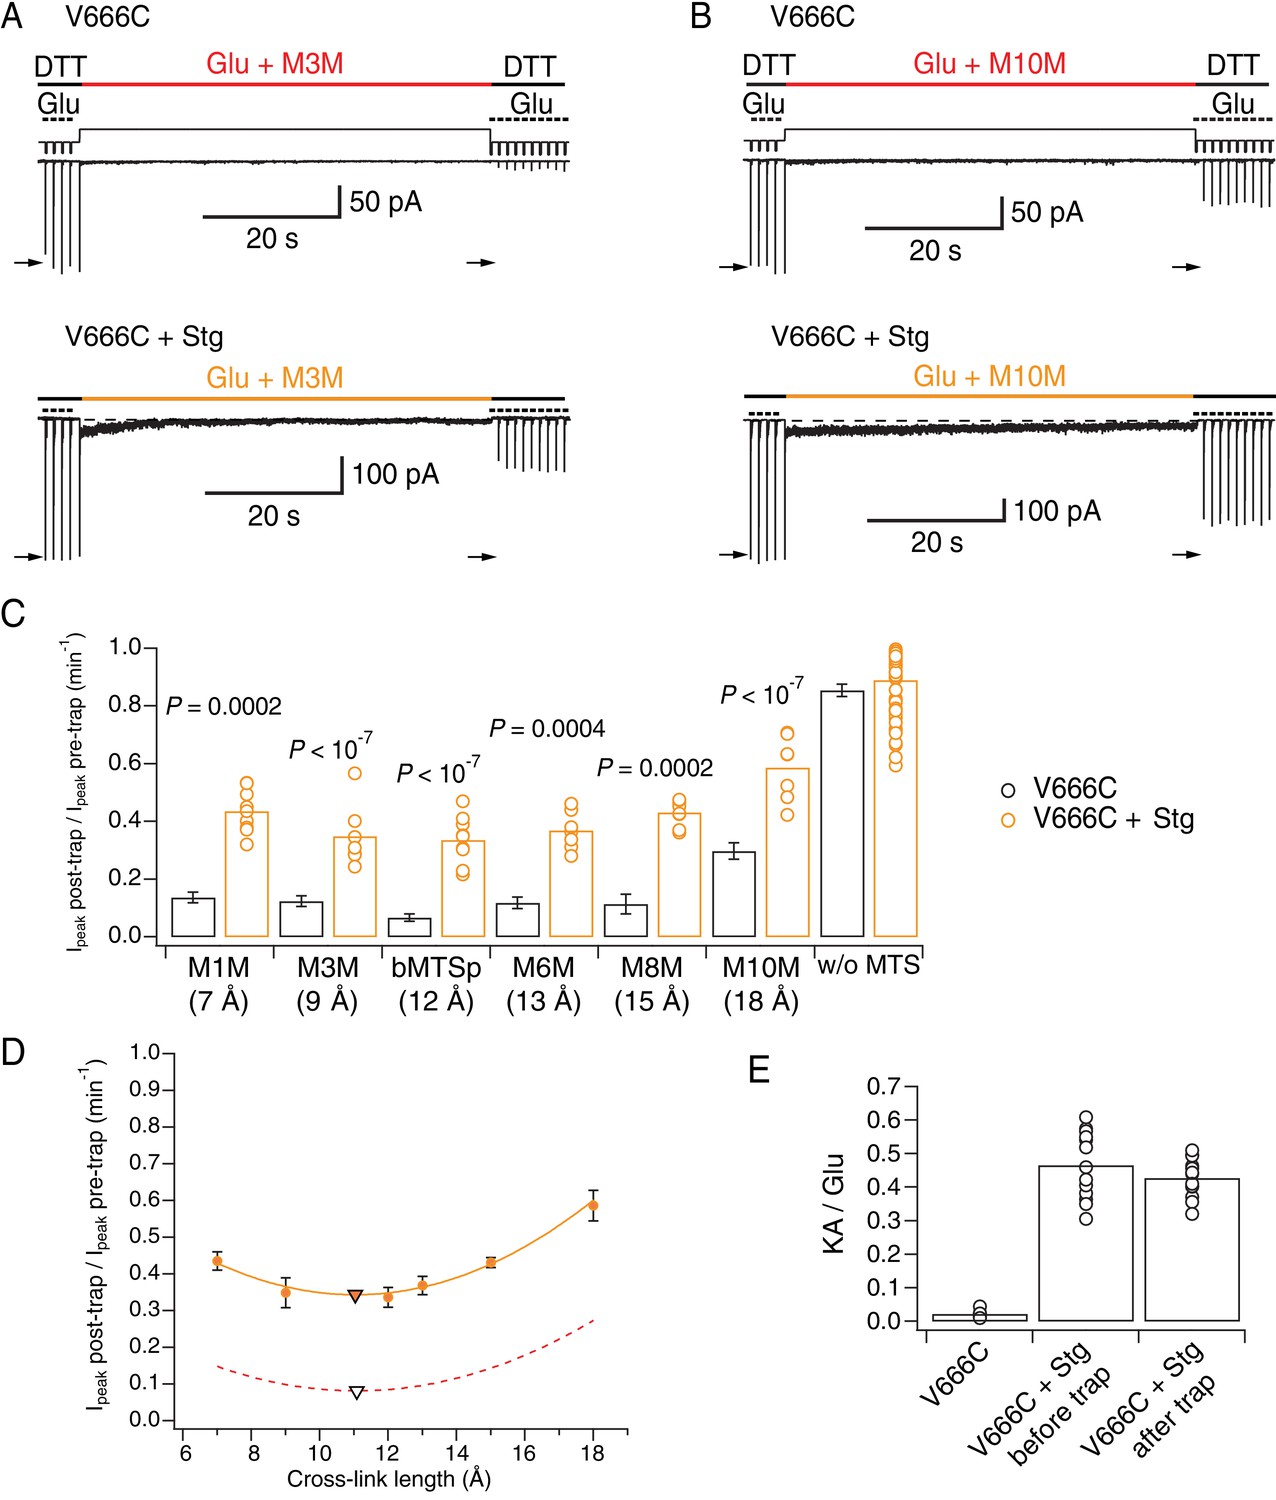
Stargazin attenuates effects of bis-MTS cross-linkers.
(A) Current traces of V666C trapping in M3M, without (top) and with Stargazin (Stg; bottom). Legend is the same as in Figure 2, with a trapping pulse shown here in orange. (B) Same as in (A), but for M10M. (C) Trapping effects for V666C without (black) and with Stg (orange). Post- and pre-trap peak current was determined from the control pulses (arrows in (A) and (B)). Data without Stg are the same as in Figure 2D. p values compare the effects of the respective cross-linker with and without Stg. For statistics vs. w/o MTS and between cross-linkers, see Figure 6—source data 1. (D) Trapping profile of desensitizing V666C + Stg complexes. The data were fit with a parabola (orange line); the fit reaches minimum (orange triangle) at (11, 0.3). Trapping profile of desensitized receptors without Stg is shown as red, dashed line (parabola with minimum at (11, 0.1); black tringle). (E) The kainate/glutamate (KA/Glu) peak current ratio was determined for each patch before and after trapping with a bis-MTS (similar to the experimental design in Figure 3A–C with 1 mM KA and 10 mM Glu in 1 mM DTT). V666C + Stg KA/Glu measurements before and after trap shown here are paired recordings, pooled for various bis-MTS cross-linkers.
-
Figure 6—source data 1
Statistics of trapping V666C receptors with Stargazin (Stg) with different bis-MTS cross-linkers; data from Figure 6C.
The current reduction was measured after 1 min of exposure to a given bis-MTS reagent.
- https://doi.org/10.7554/eLife.40548.017
Figure 6—figure supplement 1
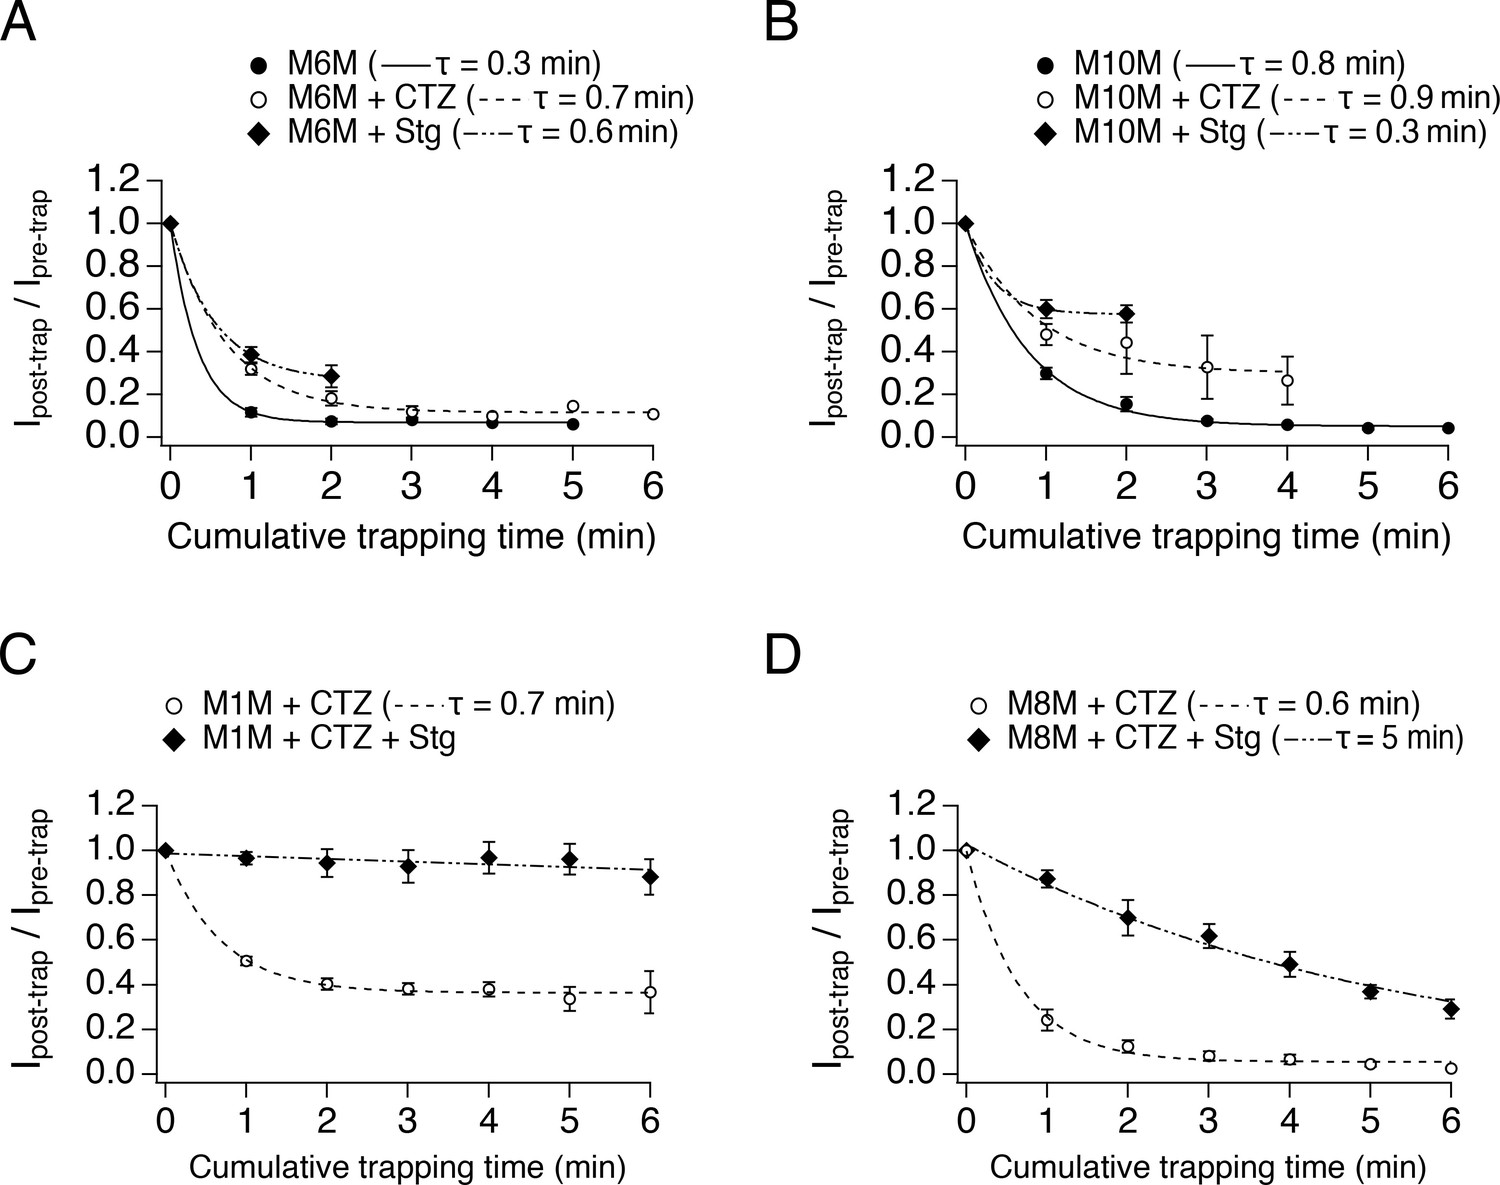
Cross-linking times depend on the length of the bis-MTS cross-linker, functional state of the receptor and the presence Stargazin.
(A) Trapping speed of M6M for active V666C receptors (empty circles) and desensitized in the presence (black diamonds) and absence (black circles) of Stargazin (Stg). Receptors were exposed to 1 μM M6M for 1 min intervals (as described Figure 2F and Materials and methods), with up to six sequential applications. Current reduction was determined after each 1-min exposure, averaged across patches and plotted here vs. cumulative trapping time. Current decay was monoexponential in every case, with τ indicated in brackets. (B) Same as in (A), but for M10M. (C) Trapping speed of M1M for active V666C receptors in the presence (black diamonds) and absence (empty circles) of Stg. (D) Same as in (C) but for M8M.
Figure 7
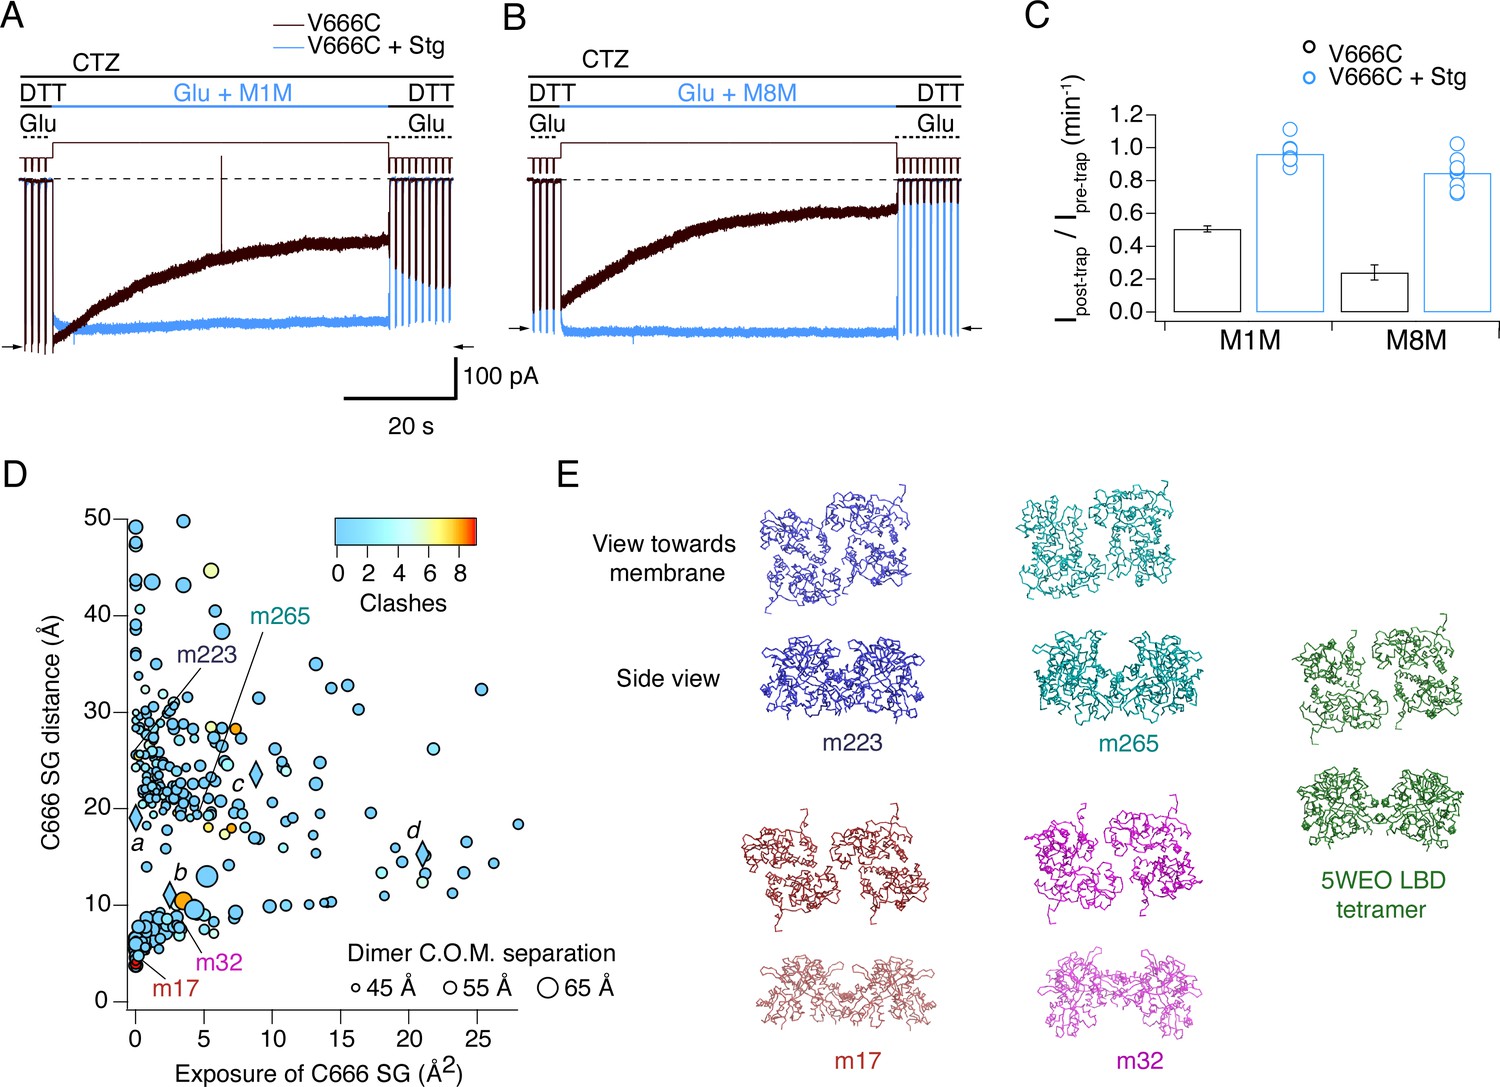
Stargazin blocks access to bis-MTS cross-linkers in the active state.
(A) Traces showing trapping by M1M in the active state in the absence (black) and presence (blue) of Stargazin (Stg). Legend is the same as in Figure 2, with a trapping pulse shown here in blue. Desensitization was blocked by CTZ (100 μM) present throughout the experiment. Glutamate (Glu) was 10 mM and DTT 1 mM. (B) Same as in (A), but for M8M cross-linker. (C) Summary of the trapping effects for M1M and M8M in the active state in the absence (black) and presence (blue) of Stg. Pre- and post-trap current was determined from control pulses as indicated by arrows. (D) Putative compact structures that could protect from bis-MTS modification. Results of 268 runs of rigid body docking of LBD dimers against each other, to minimize Cys666 access in subunit A and mimic the protection from crosslinking. Results from known structures (5JEI, 4YU0 loose, 4YU0 tight and 5WEO, diamonds a-d) and four of the generated models – m17, m32, m223, and m265 - segregate into two classes, similar to the loose (SG-SG distance between subunits < 10 Å) and tight arrangements (SG-SG distance > 20 Å, C666 SG buried close to helix K) (Baranovic et al., 2016). The symbol size corresponds to the dimer centre of mass separation and the color to the number of atom clashes (distance < 2.2 Å.) For reference, dimer centre of mass separations of known structures are: 5JEI, 44 Å; 4YU0 loose, 47 Å; 4YU0 tight, 47 Å and 5WEO, 52 Å. Note that m17 is selected from a cluster of models with zero clashes (cyan), but adjacent in the graph to two other models with clashes (red circles). (E) LBD arrangements in four models marked on the graph in panel D and the original seed for each optimization, the glutamate bound LBD tetramer from 5WEO full-length GluA2 structure with Stg.
Figure 8 with 1 supplement

The presence of Stargazin and short agonist exposures keep the agonist-bound LBD layer compact.
(A) Trapping profiles for V666C in desensitized states, without (red) and with (orange) Stargazin (Stg). Solid lines are fit parabola, with local minima indicated as triangles. The right handside of the x-axis is marked as > 18 Å, as the resolution of the only available desensitized structure without auxiliary subunits is too low to measure residue distances. Vertical, dashed, black lines indicate V666C sulfhydryl separation in the respective structure (PDB accession codes in brackets). Names of structures are color-coded same as the trapping profiles. (B) Same as in (A), but for active state without (green) and with Stg (orange). 4YU0 is a structure of soluble, isolated LBDs. Quis: quisqualate (full agonist), RR: (R, R) −2b (Kaae et al., 2007) and LY: LY451646 (both desensitization blockers). (C) Schematic summarizing the bis-MTS cross-linking results. Color-code same as in Figure 1; ATDs are omitted. Black spheres represent bound glutamate. Upper row: in the absence of Stg, GluA2 receptors access ‘open’ LBD conformation (black arrows) upon long exposures to agonist. Bottom row: presence of Stg limits ‘opening’ of the LBD layer even at longer agonist exposures.
Figure 8—figure supplement 1
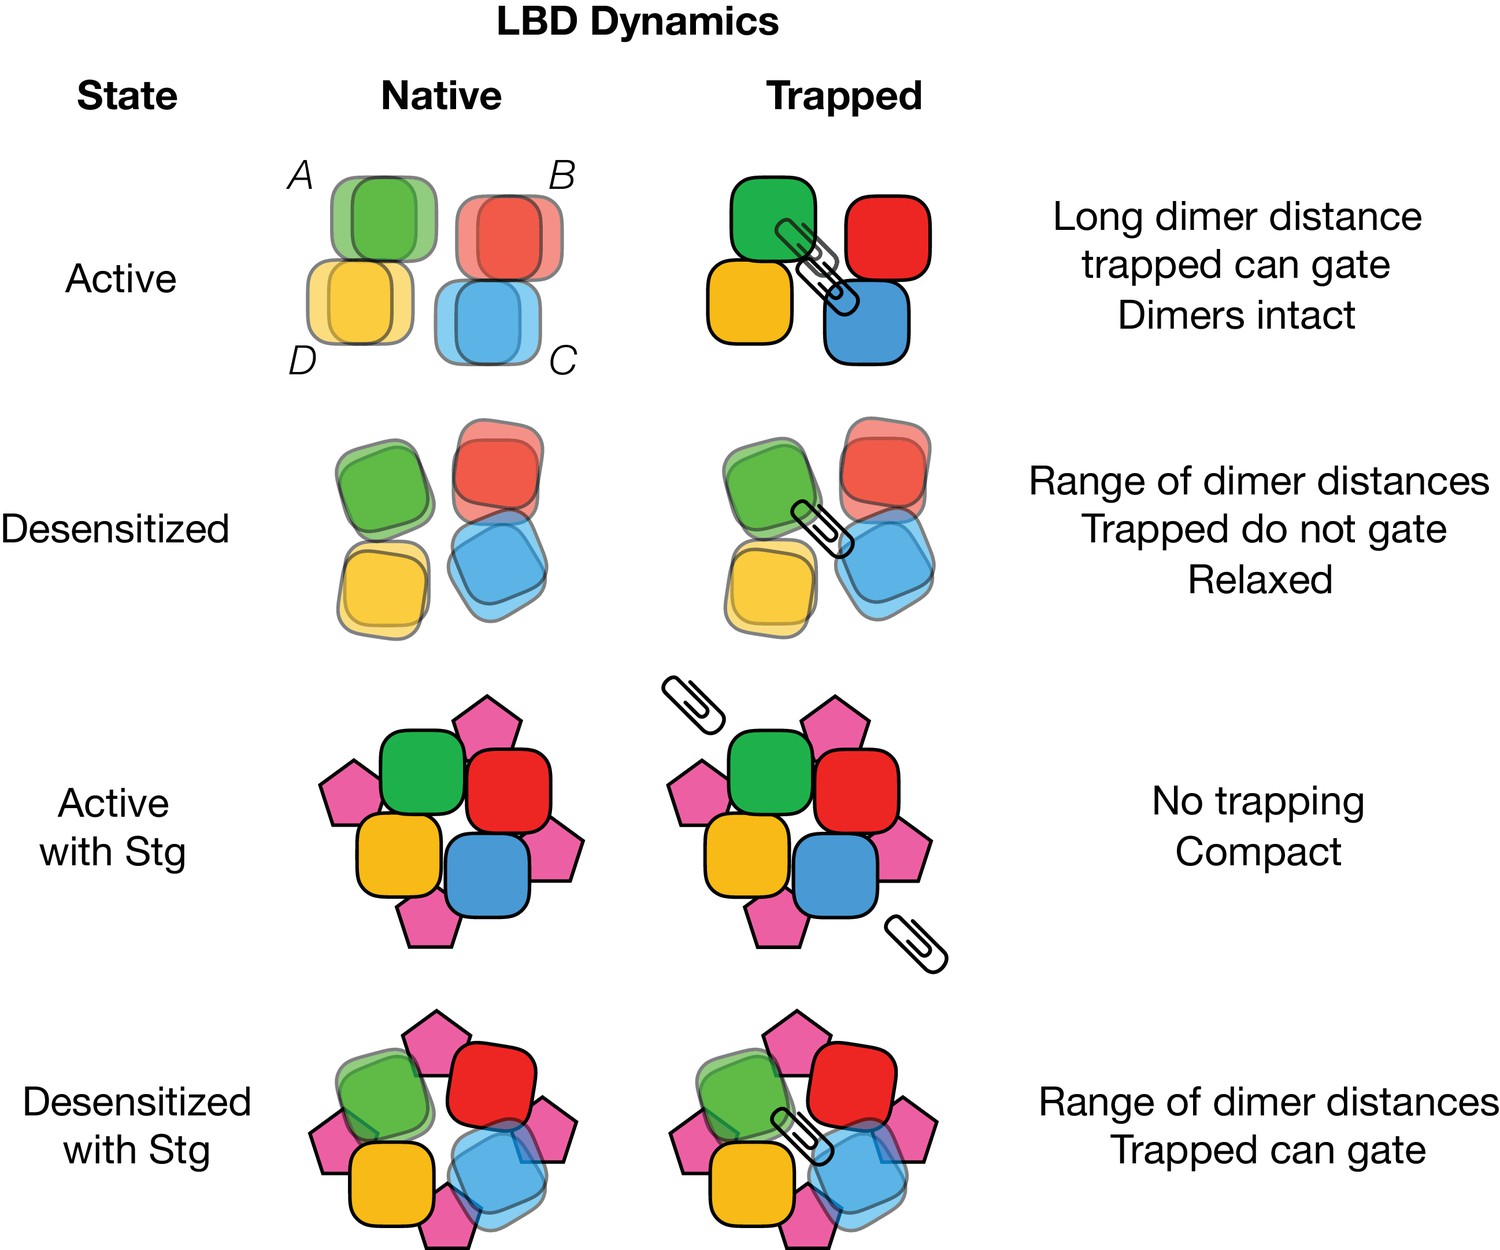
Cartoon depicting cross-linking (paperclips) of A-C subunits (green and blue), while B-D subunits are left free (red and yellow).
‘Native’ column represents apparent conformations of the LBD layer when it is not crosslinked. Muliple overlaid tiles indicate mulitple available positions of an LBD..
Tables
Key resources table
| Reagent type (species) or resource | Designation | Source or reference | Identifiers | Additional information |
|---|---|---|---|---|
| Cell line (Homo sapiens) | HEK293 | RRID: CVCL_0045 | ACC No. 305 | Obtained from Leibniz Forschungsinstitut DSMZ (Deutsche Sammlung von Mikroorganismen und Zellkulturen GmbH, Germany). |
| Transfected construct (Rattus norvegicus) | GluA2; GluA2flip | Other | ID_GenBank: M38061.1 | Gift from Mark Mayer (NIH); vector: pRK5 with IRES eGFP, unedited (Q) at the pore site, signal peptide: 21 amino acid. |
| Transfected construct (Mus musculus) | Stargazin; Stg | Other | ID_GenBank: NM_007583.2 | Gift from Susumu Tomita; vector: pRK5 with IRES dsRed (dsRed_Max Addgene plasmid: 21718). |
| Commercial assay or kit | Nucleobond Xtra Midi EF | Macherey and Nagel | 740420.5 | Plasmid DNA preparation kit. |
| Chemical compound, drug | Bifunctional methanethiosulfonate cross-linkers; bis-MTS | Toronto Research Chemicals, North York, Canada | M1M: M258800; M3M: P760350; M6M: H294250; bMTSp: P193250; M8M: O235850; M10M: D210875 | Obtained as powder, stock prepared in DMSO, used at final concentration of 1 μM or 50 μM, as indicated. |
| Chemical compound, drug | Monofunctional methanethiosulfonate linker; MTSEA | Toronto Research Chemicals, North York, Canada | MTSEA: A609150 | Obtained as powder, stock prepared in DMSO, used at final concentration of 1 μM. |
| Chemical compound, drug | Cyclothiazide; CTZ | Hello Bio, Bristol, UK | HB0221 | Obtained as powder, stock prepared in DMSO, used at final concentration of 100 μM. |
| Chemical compound, drug | Kainate; KA | Abcam plc, Cambridge, UK | ab120100 | Obtained as powder, stock prepared in Ringer, used at final concentration of 1 mM. |
| Software, algorithm | Docking | Source: https://github.com/aplested/cystance (copy archived at https://github.com/elifesciences-publications/cystance); this paper (Plested, 2018) | Python script for PyMOL and CCP4. | |
| Software, algorithm | Randomization test | Source: https://github.com /aplested/DC-Stats (copy archived at https://github.com/elifesciences-publications/DC-Stats);DC-Stats suite (Plested and Lape, 2018) | 10^5 iterations performed for each test. |
Additional files
-
Transparent reporting form
- https://doi.org/10.7554/eLife.40548.021
Download links
A two-part list of links to download the article, or parts of the article, in various formats.
Downloads (link to download the article as PDF)
Open citations (links to open the citations from this article in various online reference manager services)
Cite this article (links to download the citations from this article in formats compatible with various reference manager tools)
Auxiliary subunits keep AMPA receptors compact during activation and desensitization
eLife 7:e40548.
https://doi.org/10.7554/eLife.40548


