A conserved filamentous assembly underlies the structure of the meiotic chromosome axis
- University of California, San Diego, United States
- Ludwig-Maximilians-Universität München, Germany
- Institute of Molecular Biology of Barcelona (IBMB-CSIC), Spain
- Institució Catalana de Recerca i Estudis Avançats (ICREA), Spain
- Wesleyan University, United States
- Ludwig Institute for Cancer Research, United States
Figures
Figure 1 with 3 supplements
Molecular architecture of the budding-yeast Red1 C-terminal domain.
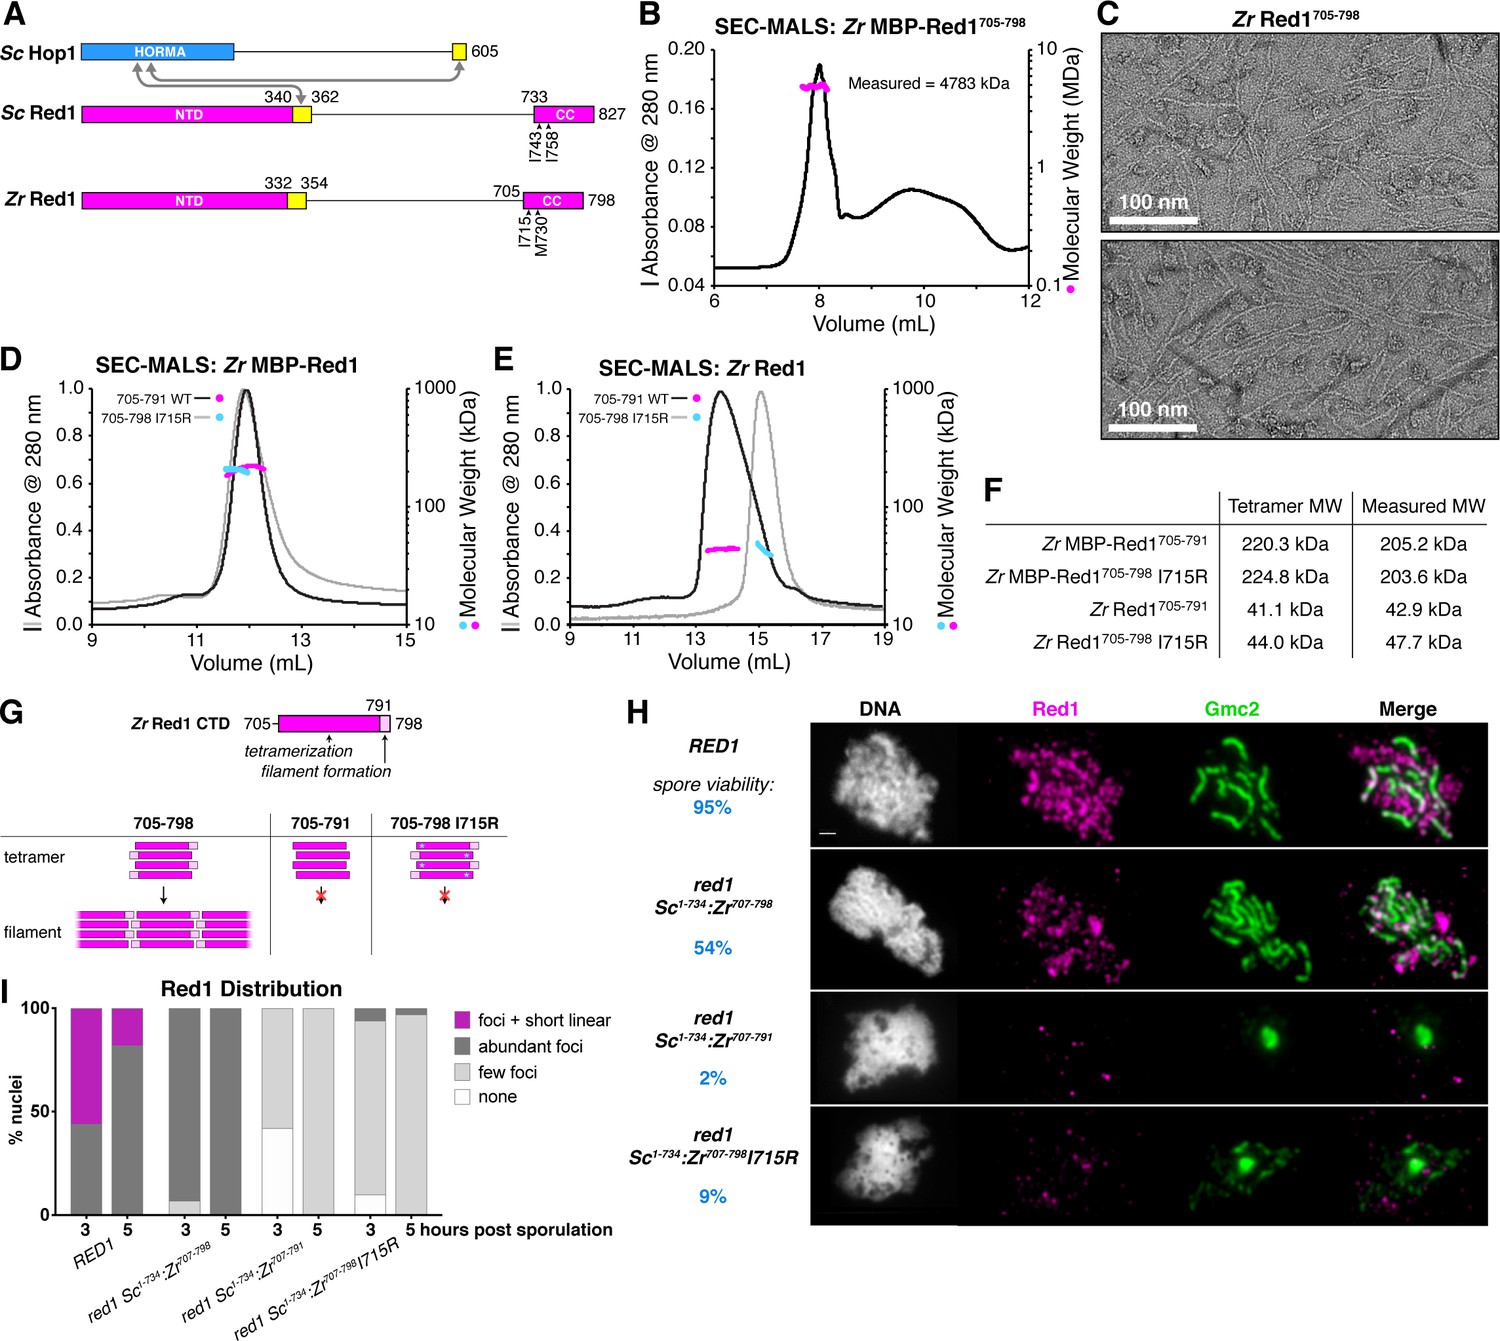
(A) Schematic of S. cerevisiae (Sc) chromosome axis proteins Hop1 and Red1, and Zygosaccharocmyces zouxii (Zr) Red1. Yellow regions indicate Hop1-binding closure motifs (West et al., 2018). For S. cerevisiae Red1, the positions of two previously-identified mutations in the C-terminal domain that disrupt axis function, I743A (Eichinger and Jentsch, 2010) and I758R (Lin et al., 2010), are shown. See Figure 1—figure supplement 1A for sequence alignment of the Red1 C-terminal domain. (B) SEC-MALS analysis of purified His6-MBP-Zr Red1705-798. Calculated molecular weight of a monomer = 55.9 kDa; Measured molecular weight = 4783 kDa (~85 mer). (C) Representative negative-stain electron micrographs of purified untagged Zr Red1705-798. See Figure 1—figure supplement 2A for additional full micrographs, and Figure 1—figure supplement 2B for micrographs of His6-MBP-Zr Red1705-798. (D) SEC-MALS analysis of purified His6-MBP-Zr Red1705-791 and His6-MBP-Zr Red1705-798 I715R. (E) SEC-MALS analysis of purified Zr Red1705-791 and Zr Red1705-798 I715R (as in panel D, but with His6-MBP tag removed). (F) Table summarizing SEC-MALS results from (D) and (E). (G) Schematic of Zr Red1 C-terminal domain oligomerization. Wild-type Zr Red1705-798 forms homotetramers that further oligomerize into extended filaments. Removal of the C-terminal seven amino acids (Zr Red1705-791) or mutations of I715 to arginine (Zr Red1705-798 I715R) results in loss of filament formation but maintenance of tetramer formation. (H) Representative surface-spread mid-meiotic prophase nuclei from wild-type (top row), and red1 mutant alleles: red1-Sc1-734:Zr707-798 (second row), red1-Sc1-734:Zr707-791 (third row), and red1-Sc1-734:Zr707-798 I715R] (bottom row). Spore viability for each homozygous strain is shown in blue (n = 52–128, see Materials and Methods). Mid-meiotic prophase chromosomes are stained with DAPI to label DNA (white), anti-Red1 (magenta), and anti-Gmc2 (green). Scale bar, 1 μm. See Figure 1—figure supplement 3B–E for additional images. (I) Quantification of the distribution of Red1 on meiotic chromosomes at 3 hr and 5 hr after introduction into sporulation medium (n = 30–50 cells for each strain and time-point). ‘foci + short linear’=cells with abundant foci and short linear stretches of Red1 staining; ‘abundant foci’=cells with more than 25 strong Red1 foci; ‘few foci’=cells with fewer than 25 weak Red1 foci. See Figure 1—figure supplement 3F–H for further quantification of Red1, Gmc2, and polycomplex assembly.
Figure 1—figure supplement 1

Sequence and structural analysis of the fungal Red1 C-terminus.
(A) Sequence alignment of budding-yeast Red1 proteins. Yellow boxes indicate the two isoleucine residues in S. cerevisiae Red1 (I743, I758) whose mutation strongly affects spore viability (Eichinger and Jentsch, 2010; Lin et al., 2010). The magenta box indicates the region of Zr Red1 necessary for assembly of high-order oligomers. (B) SEC-MALS analysis of purified His6-MBP-Sc Red1731-827 (red), and His6-MBP-Sc Red1731-827 I743R (yellow) and His6-MBP-Sc Red1731-827 I758R (gray).
Figure 1—figure supplement 2
Electron microscopy of the fungal Red1 C-terminus.
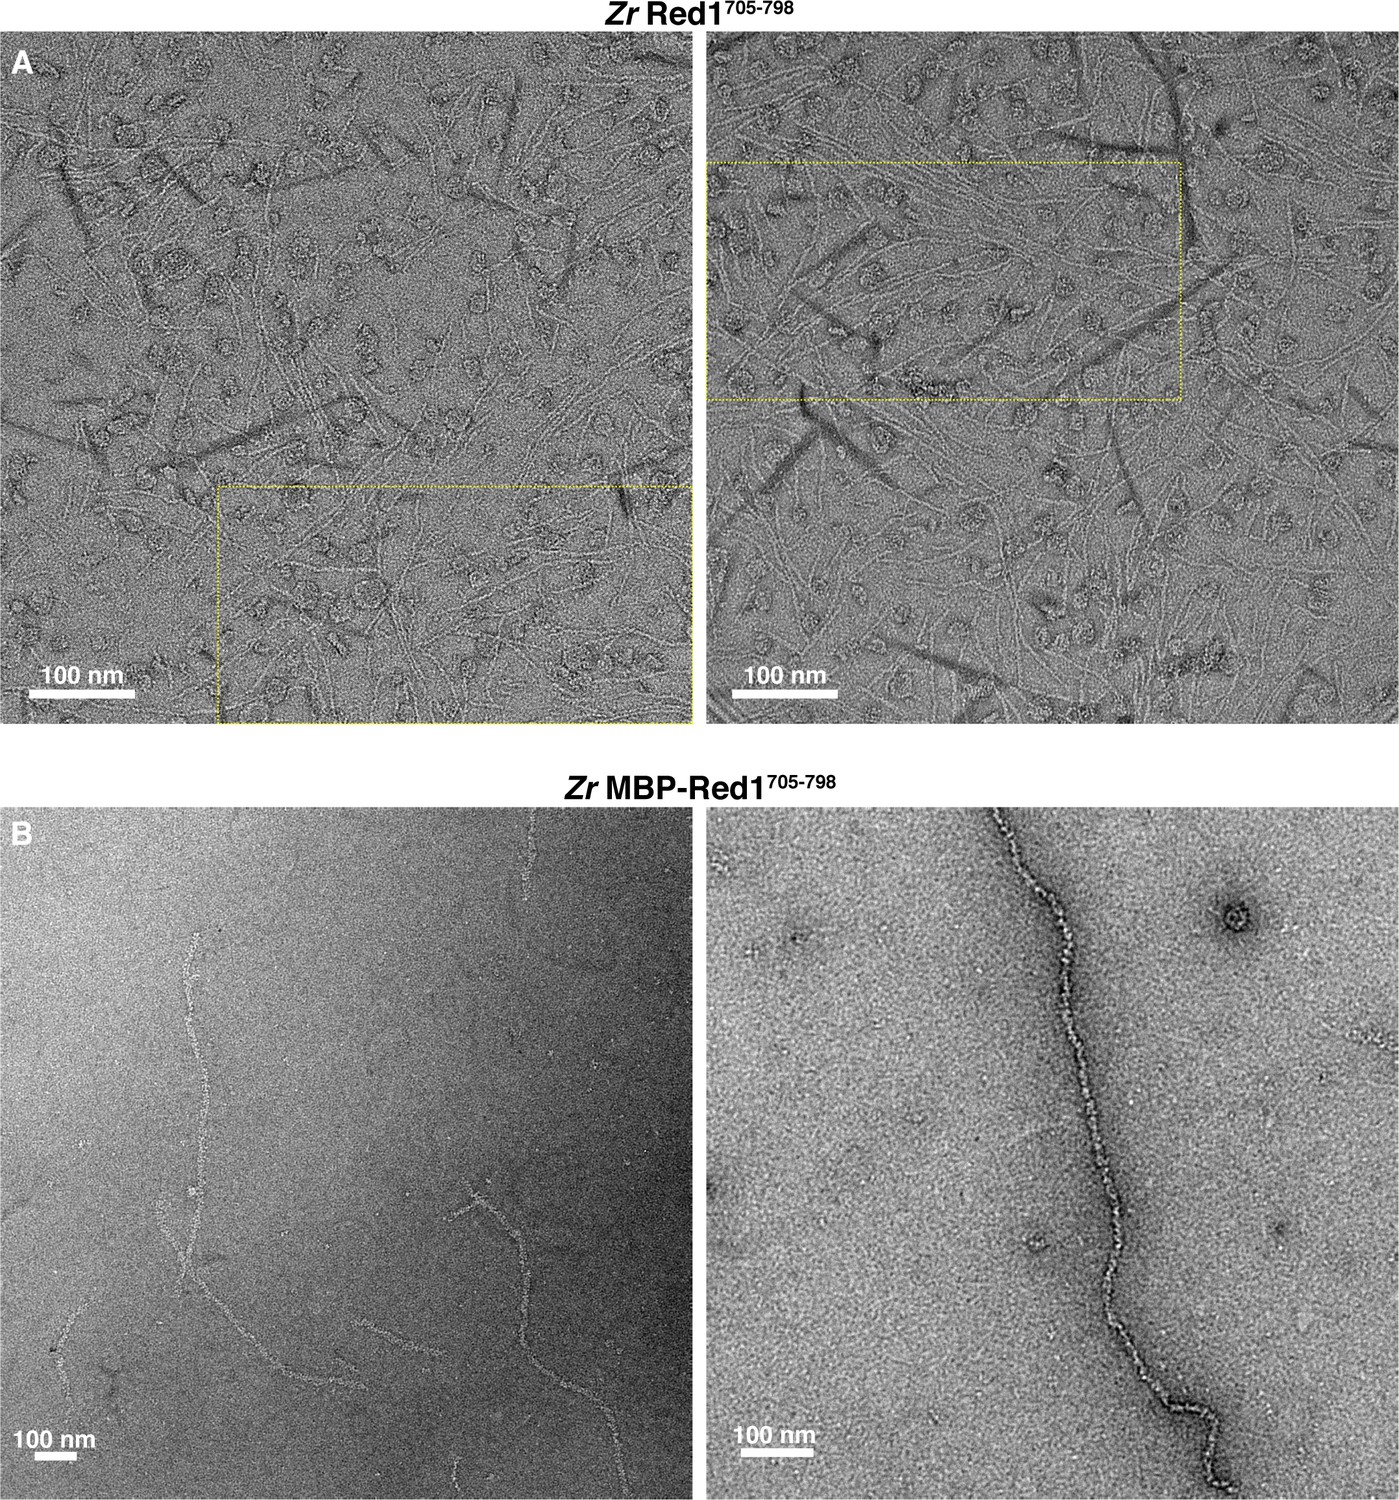
(A) Micrographs of untagged Zr Red1705-798 filaments. Yellow dotted boxes indicate the area of micrographs shown in Figure 1C. Darkly-stained regions are crystallized uranyl formate stain. (B) Micrographs of His6-MBP-Zr Red1705-798 filaments. The high density of MBP tags along these filaments means that individual MBP molecules are not discernable.
Figure 1—figure supplement 3

Red1 chromosome localization and synaptonemal complex assembly in chimeric Sc-Zr red1 strains.
(A) Western blot showing expression of wild-type and mutant Red1 proteins in meiosis. While Red1 is largely degraded by 5 hr post meiotic induction in the wild-type strain, all three mutant strains show a delay in Red1 degradation. Asterisk indicates a non-specific band in the RED1 strain. (B) Representative surface-spread mid-meiotic prophase nuclei from wild-type cells, at 3 and 5 hr after transfer to sporulation media. Mid-meiotic prophase chromosomes are stained with DAPI to label DNA (white), anti-Red1 (green), and an antibody against the SC structural protein, Gmc2 (magenta). Scale bar, 1 μm. (C) Representative surface-spread mid-meiotic prophase nuclei from red1-Sc1-734:Zr707-798 cells, stained as above. (D) Representative surface-spread mid-meiotic prophase nuclei from red1-Sc1-734:Zr707-791 cells, stained as above. (E) Representative surface-spread mid-meiotic prophase nuclei from red1-Sc1-734:Zr707-798I715R cells, stained as above. (F) Quantification of Red1 spatial distribution on meiotic chromosomes. n = 30–50 for each condition. ‘foci + short linear’=cells with abundant foci and short linear stretches of Red1 staining; ‘abundant foci’=cells with more than 25 strong Red1 foci; ‘few foci’=cells with fewer than 25 weak Red1 foci. (G) Quantification of Gmc2 spatial distribution on meiotic chromosomes. n = 30–50 for each condition. ‘long linear’=cells with chromosome-length stretches of Gmc2 staining; ‘foci + short linear’=cells with abundant foci and short linear stretches of Gmc2 staining; ‘foci’=cells with foci but no visible linear stretches of Gmc2 staining. (H) Quantification of Gmc2-containing polycomplex formation in mid-meiotic prophase cells. n = 30–50 for each condition.
Figure 2 with 5 supplements
Protein-protein interactions and filament formation by mammalian SYCP2 and SYCP3.
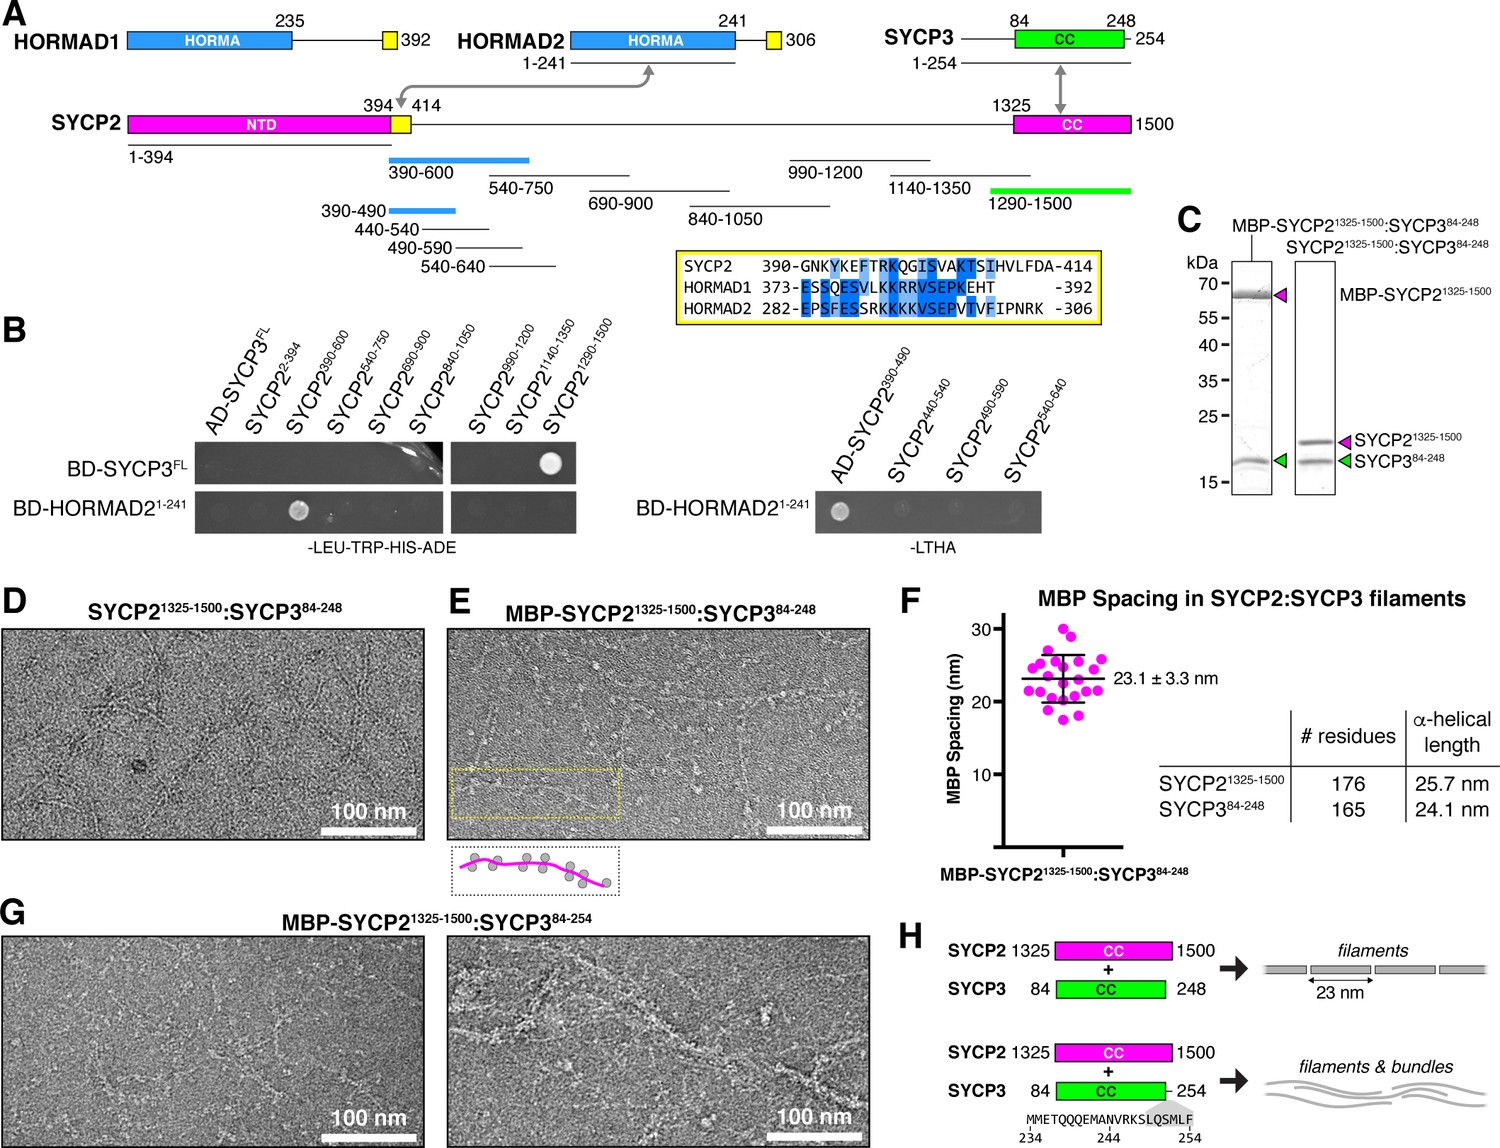
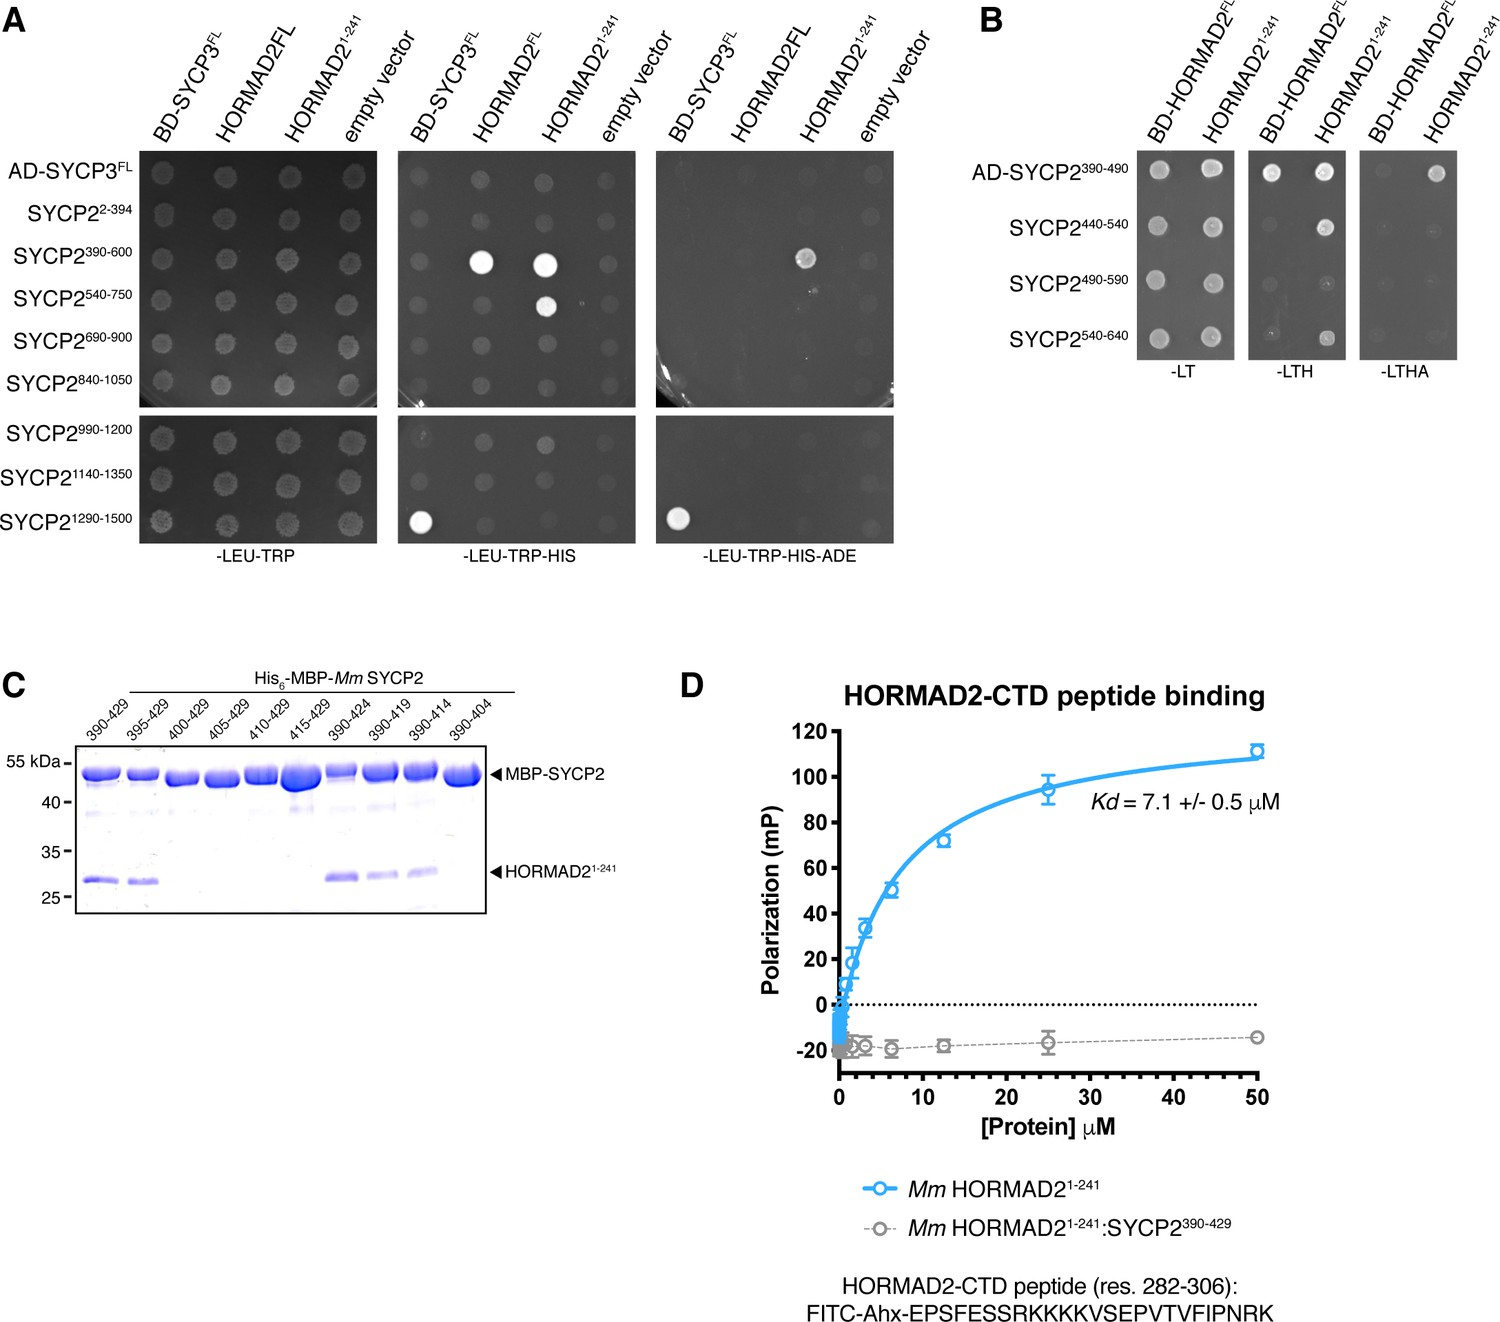
(A) Schematic of M. musculus (Mm) chromosome axis proteins, with underlines indicating fragments used for yeast two-hybrid analysis. The SYCP2 NTD (residues 1–394) forms a globular structure with unknown function (Feng et al., 2017). See Figure 2—figure supplement 1 for detailed coiled-coil and alpha-helix predictions of the SYCP2 and SYCP3 C-terminal domains. Yellow regions indicate putative HORMAD-binding closure motifs (Figure 2—figure supplement 3). (B) Yeast two-hybrid analysis of SYCP2 truncations versus SYCP3 and the HORMAD2 HORMA domain (residues 1-241). AD: Gal4 activation domain fusion; BD: Gal4 DNA-binding domain fusion. Stringent selection on -LEU-TRP-HIS-ADE (-LTHA) media is shown; see Figure 2—figure supplement 2 for complete yeast two-hybrid results and for coexpression of SYCP2 fragments with HORMAD21-241. (C) SDS-PAGE analysis of purified Mm SYCP21325-1500:SYCP384-248 complexes, with an N-terminal MBP tag on SYCP2 (left) or with the tag removed (right). (D) Representative negative-stain electron micrograph of purified Mm SYCP21325-1500:SYCP384-248. See Figure 2—figure supplement 4A for additional full micrographs. (E) Representative negative-stain electron micrographs of purified His6-MBP-Mm SYCP21325-1500:SYCP384-248. See Figure 2—figure supplement 4B for additional full micrographs. (F) Quantification of inter-MBP spacing in micrographs of His6-MBP-Mm SYCP21325-1500:SYCP384-248 filaments. The measured spacing of 23.1 ± 3.3 nm (mean ±standard deviation from 23 measured intervals) is equivalent to the length of a ~160 residue coiled-coil (0.146 nm rise per residue). (G) Representative negative-stain electron micrographs of purified His6-MBP-Mm SYCP21325-1500:SYCP384-254. See Figure 2—figure supplement 5 for additional full micrographs. (H) Schematic summary of negative-stain electron microscopy results: Mm SYCP21325-1500:SYCP384-248 forms individual filaments assembled from ~23 nm units, while re-addition of the highly-conserved C-terminal six residues of SYCP3 (249–254; shown in gray below schematic) causes self-association/bundling of these filaments.
Figure 2—figure supplement 1
Coiled-coil and helical predictions for mammalian SYCP2 and SYCP3.
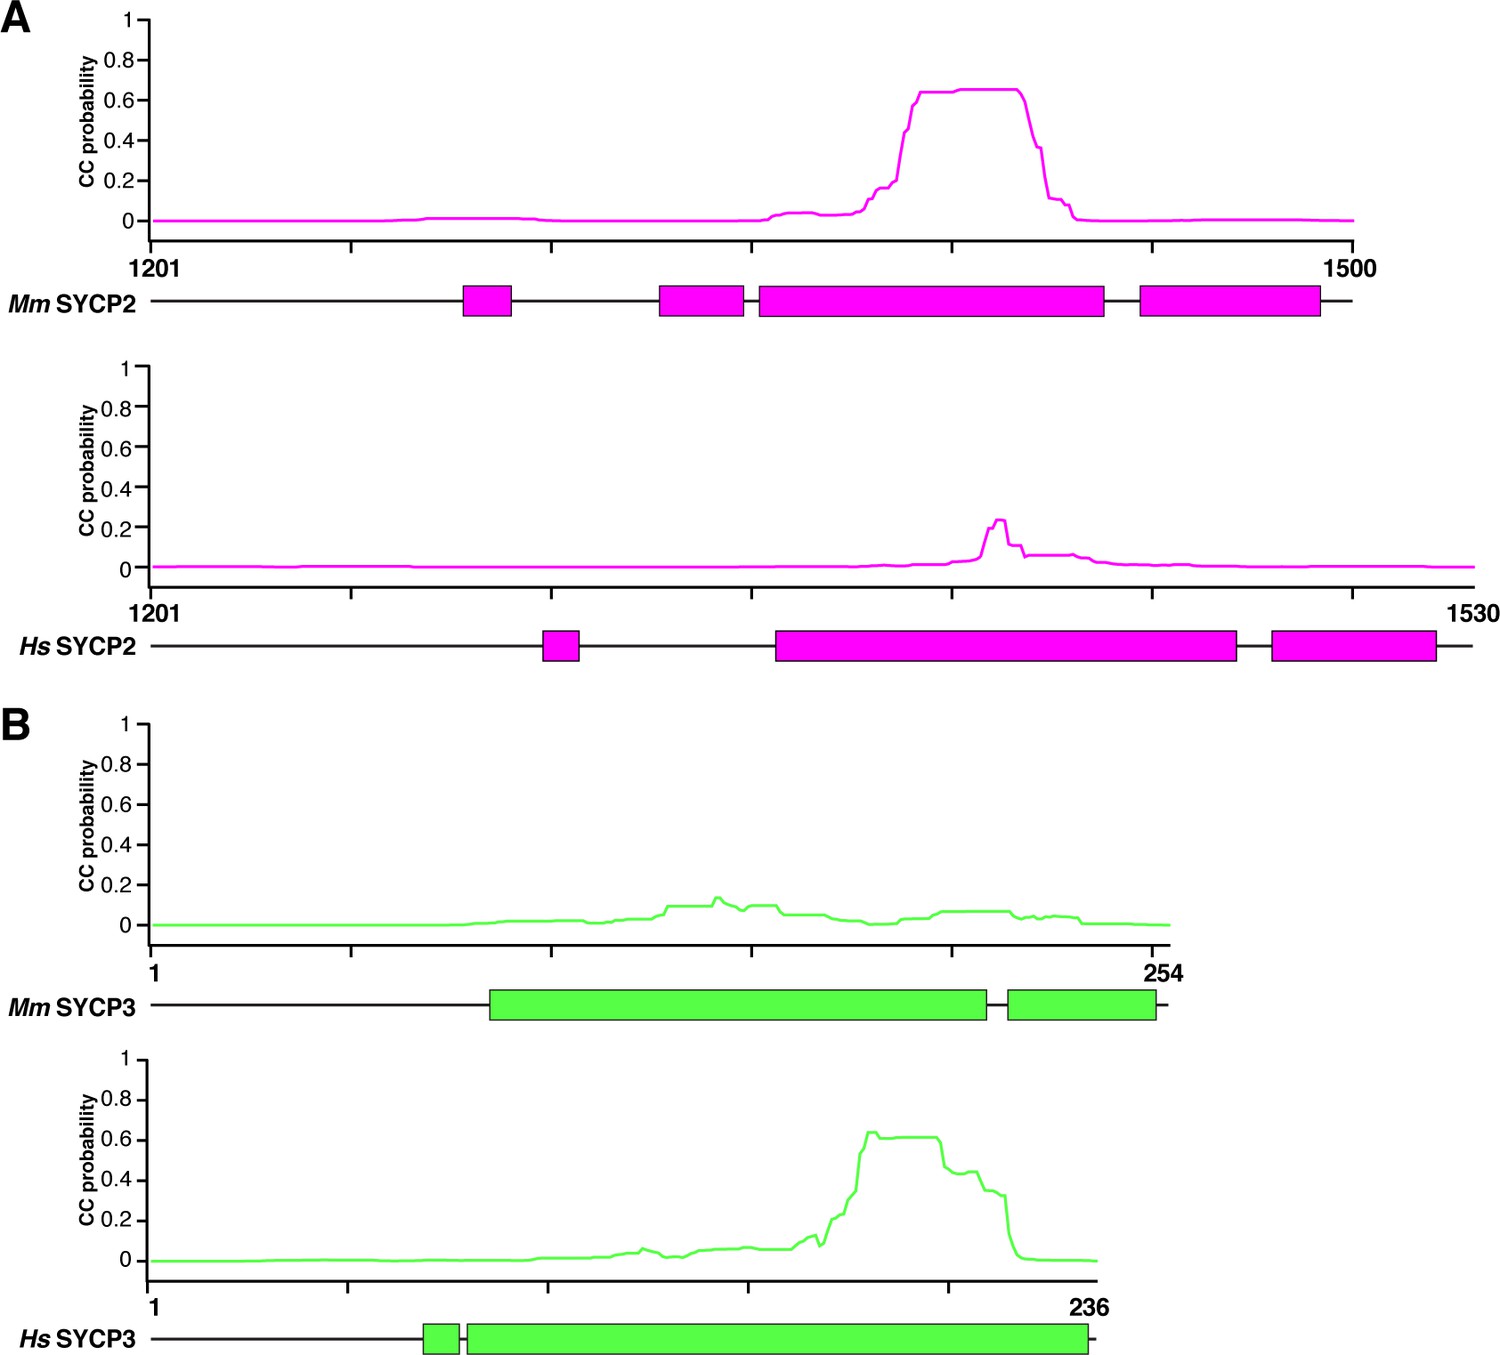
(A) Schematic highlighting predicted α-helical regions (colored blocks, bottom; from PSI-PRED server v. 3.3; Buchan et al., 2013) and total coiled-coil propensity (graphs, top; from MULTICOIL server v. 1.0; Wolf et al., 1997) for human and mouse SYCP2 C-terminal region. (B) Schematic highlighting predicted α-helical regions (colored blocks, bottom; from PSI-PRED server) and total coiled-coil propensity (graphs, top; from MULTICOIL server) for human and mouse SYCP3.
Figure 2—figure supplement 2
Protein-protein interactions in the mammalian meiotic chromosome axis.
(A, B) Yeast two-hybrid analysis of SYCP3 and HORMAD2 versus SYCP2 fragments. AD: indicated proteins were cloned into pGADT7 (Gal4 activation domain fusion); BD: indicated proteins were cloned into pBridge (Gal4 DNA-binding domain fusion). -LEU-TRP: non-selective; -LEU-TRP-HIS: weak selection; -LEU-TRP-HIS-ADE: stringent selection. (C) Co-expression and Ni2+-pulldown of His6-MBP Mm SYCP2 fragments with untagged HORMAD21-241 reveals the minimal HORMAD-binding closure motif in SYCP2 as residues 395–414. (D) Fluorescence polarization assay measuring binding of Mm HORMAD22-241 (blue) and Mm HORMAD22-241:SYCP2390-429 complex (gray) to a HORMAD2282-306 peptide. Kd values were calculated from triplicate data.
Figure 2—figure supplement 3
Alignment of putative closure motifs in mammalian SYCP2, HORMAD1, and HORMAD2.
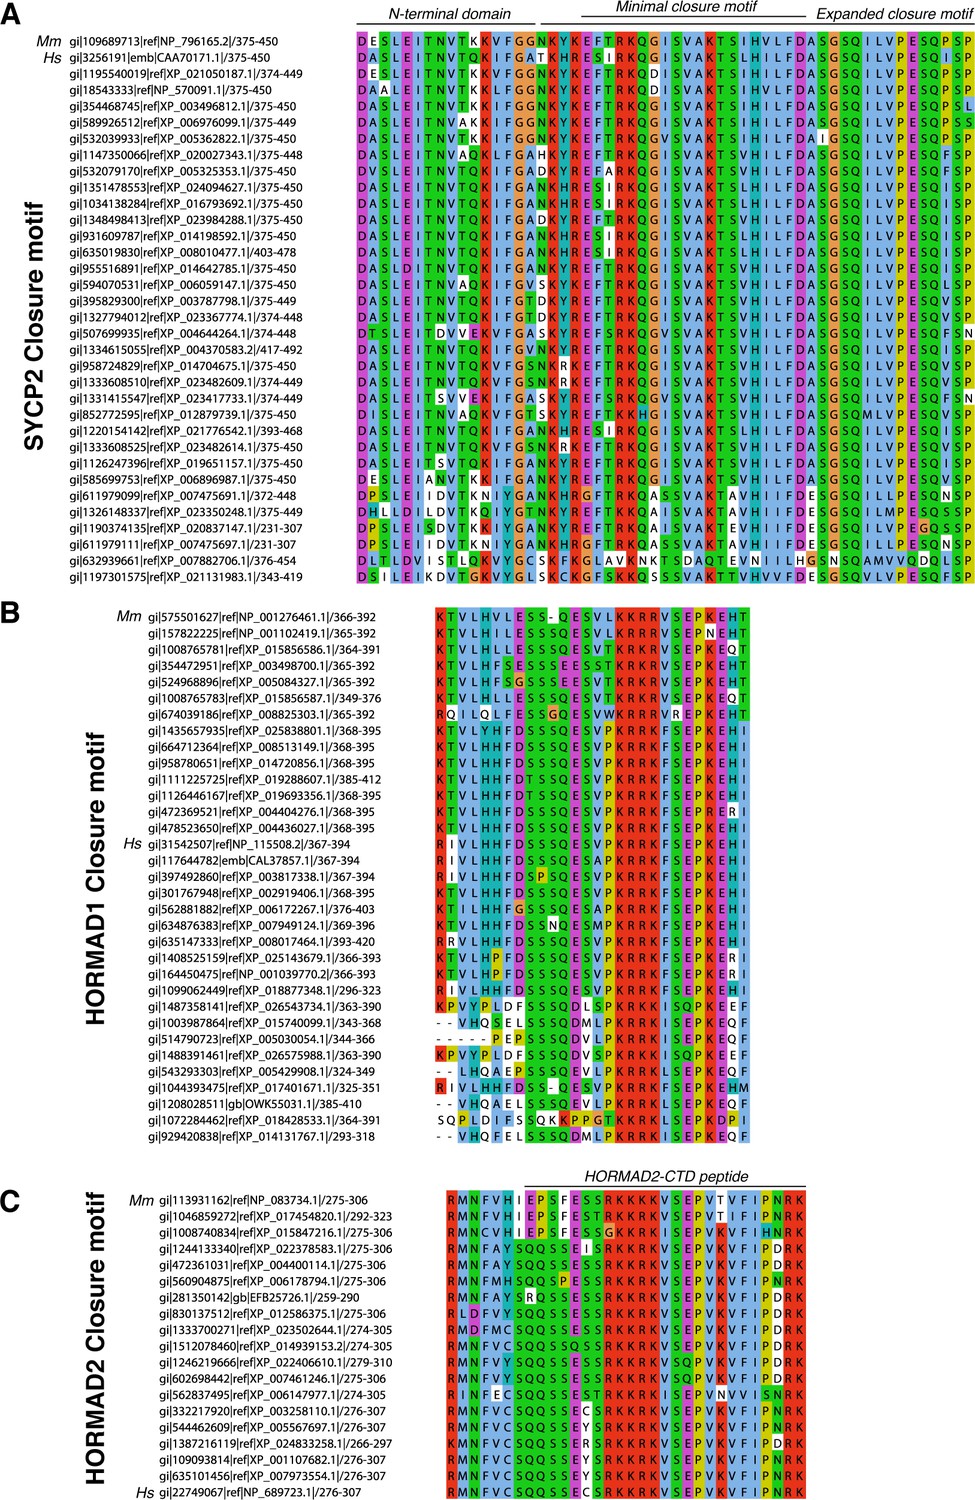
(A) Sequence alignment of minimal HORMAD2-binding region of mammalian SYCP2. M. musculus (Mm) and H. sapiens (Hs) sequences are noted. ‘Minimal closure motif’ denotes residues 395–414; truncation beyond this minimal region reduces detected binding by co-expression and Ni2+ pulldown (see Figure 2—figure supplement 2C). (B) Sequence alignment of the HORMAD1 C-terminus. (C) Sequence alignment of the HORMAD2 C-terminus, which is homologous to the HORMAD1 C-terminal region. Black line at top indicates the HORMAD2-CTD peptide used in Figure 2—figure supplement 2D.
Figure 2—figure supplement 4
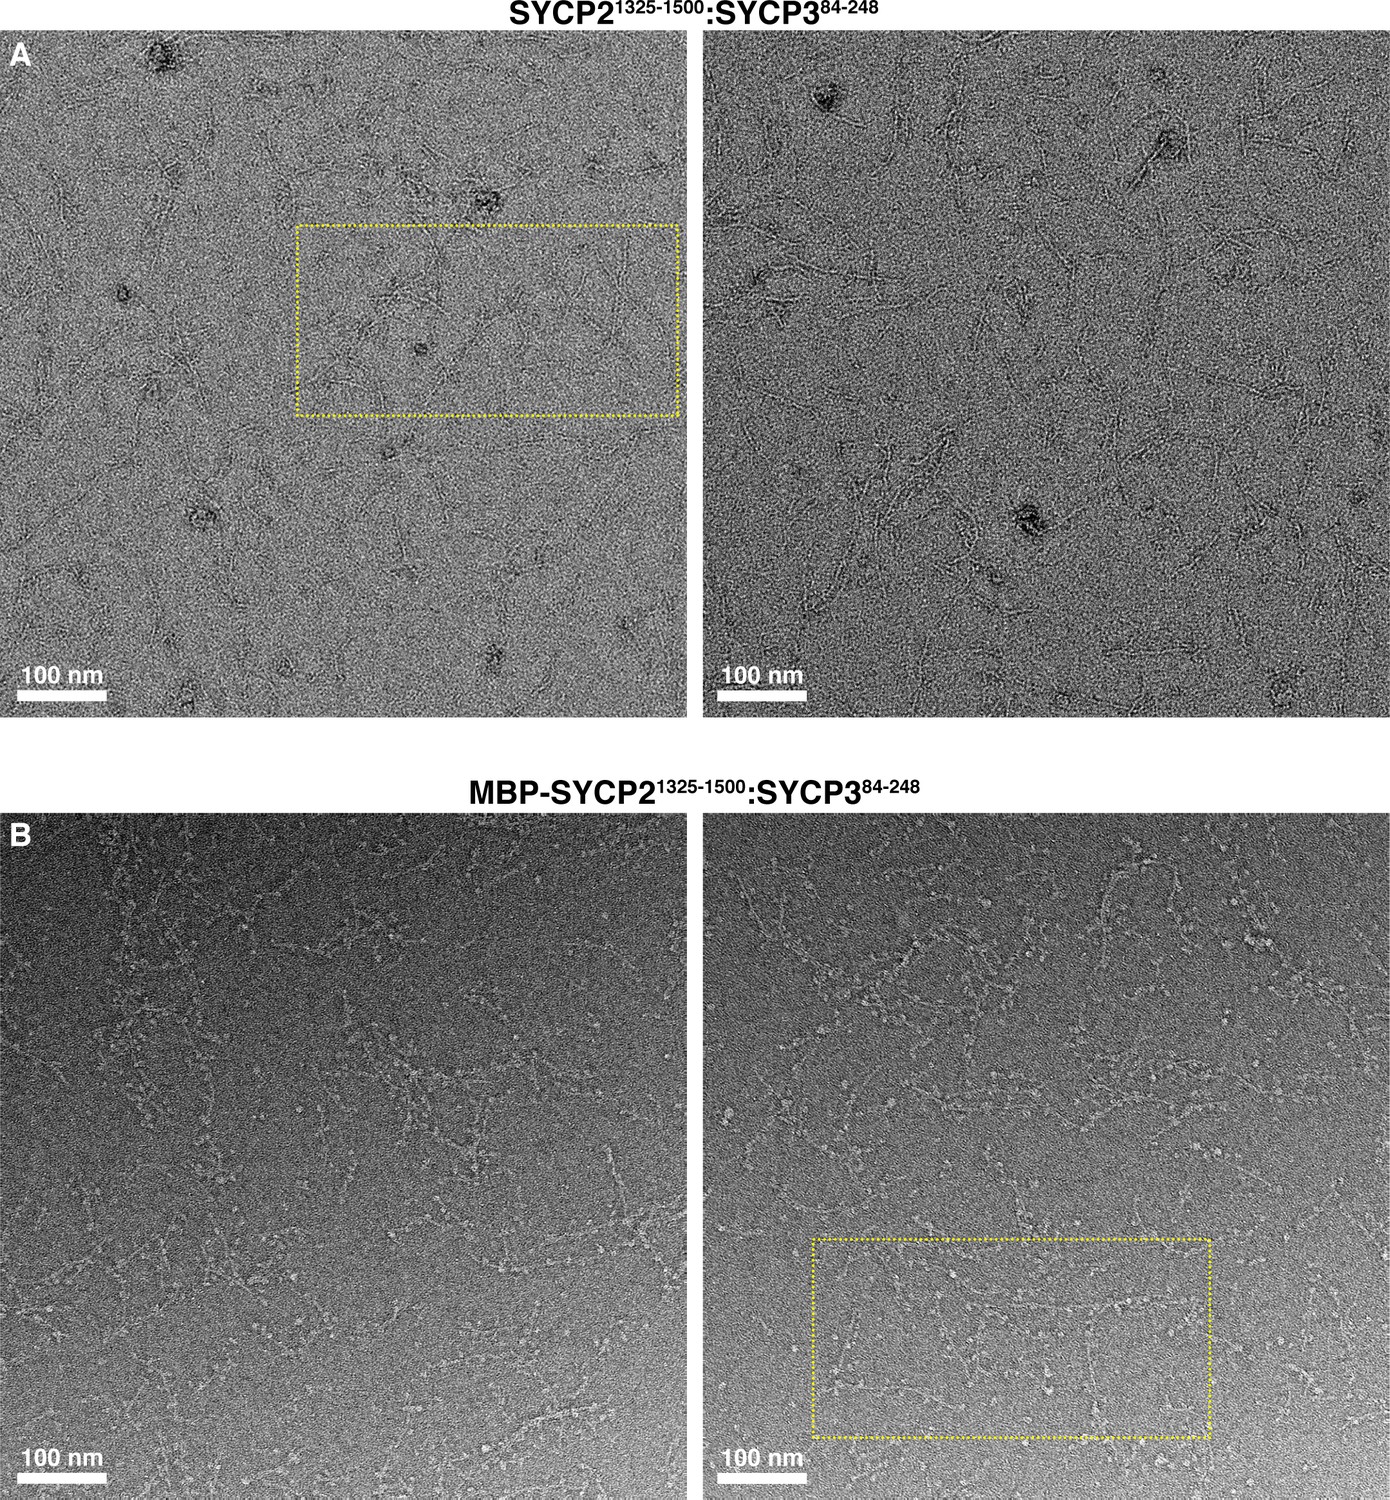
Electron micrographs of Mm SYCP21325-1500:SYCP384-248 filaments.
(A) Negative-stain electron micrographs of Mm SYCP21325-1500:SYCP384-248 filaments. Yellow dotted box indicates the area of micrograph shown in Figure 2D. (B) Micrographs of Mm SYCP21325-1500:SYCP384-248 filaments with the N-terminal His6-MBP tag on SYCP2 intact. Yellow dotted box indicates the area of micrograph shown in Figure 2E.
Figure 2—figure supplement 5
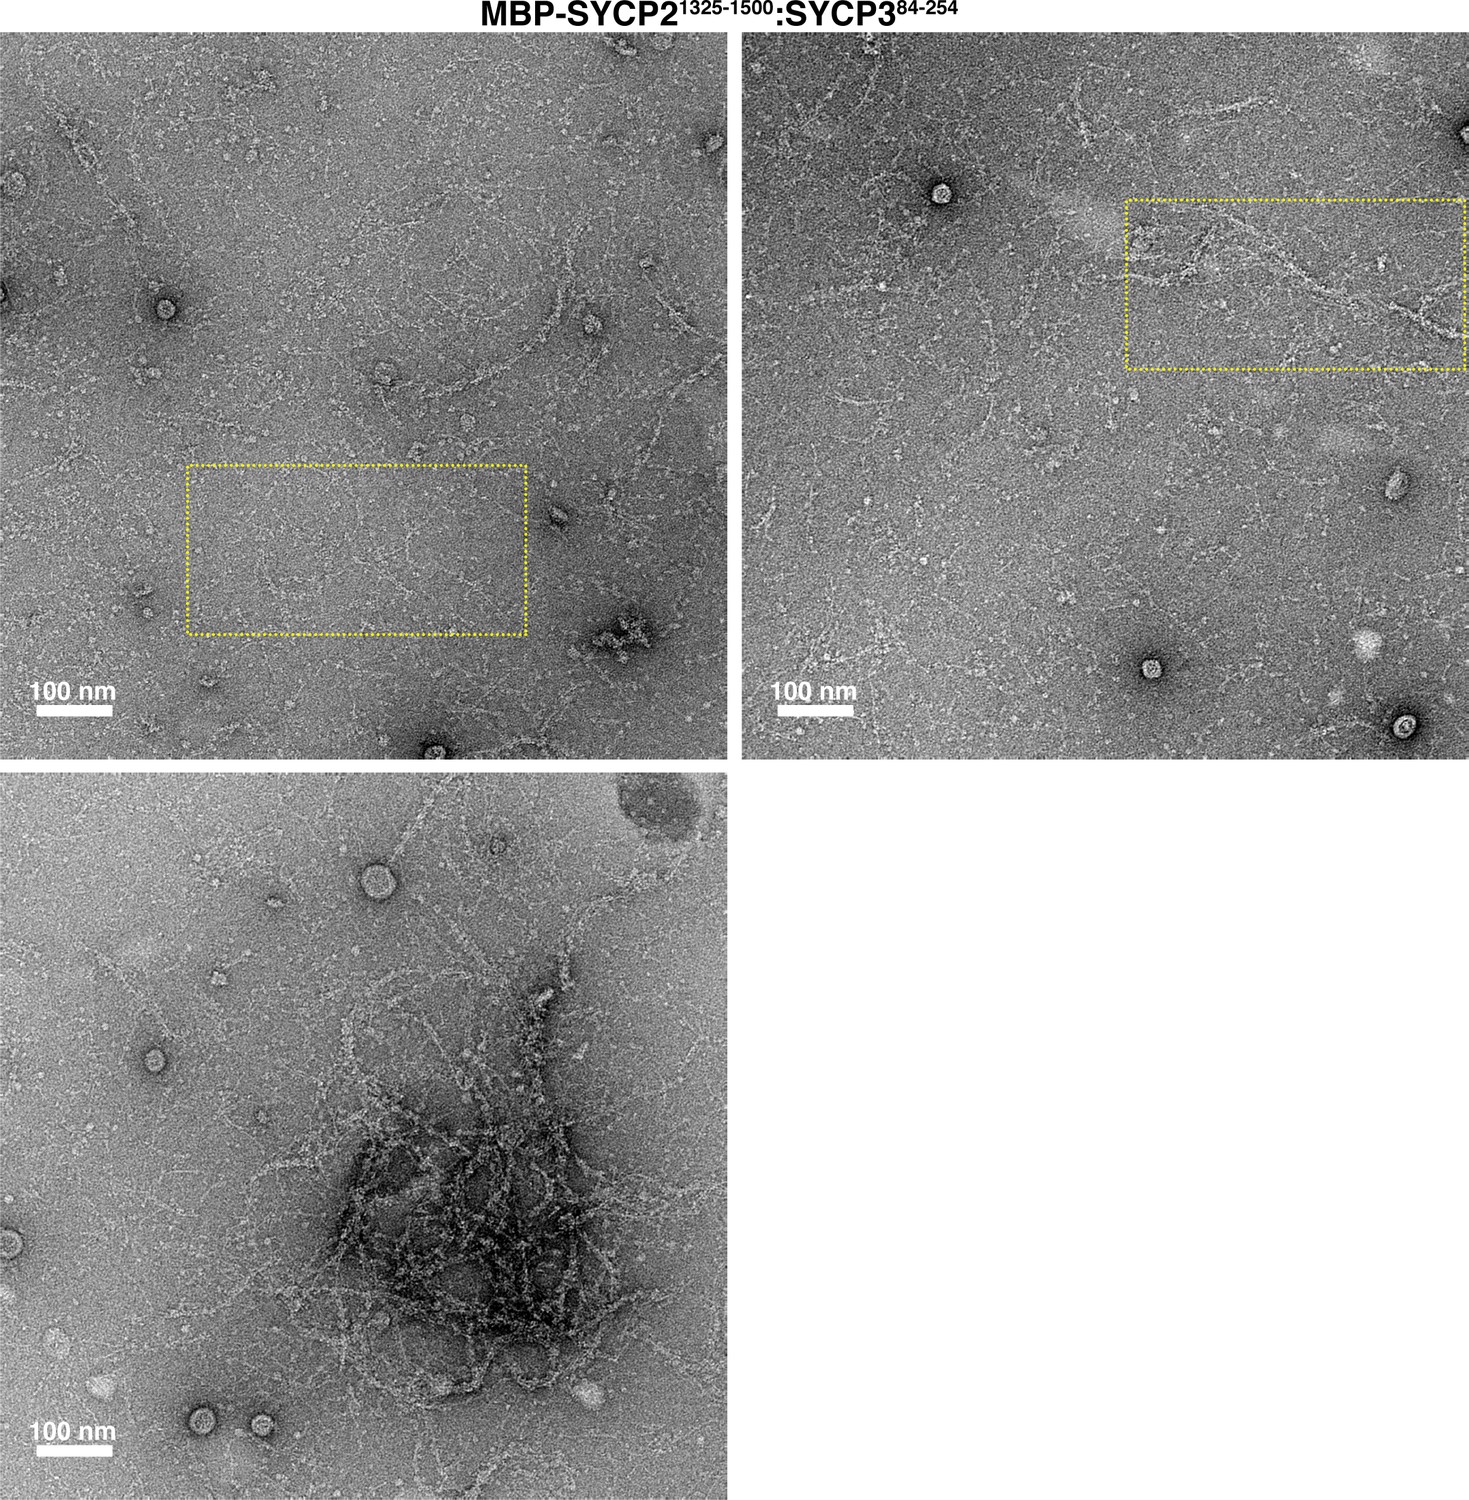
Electron micrographs of Mm SYCP21325-1500:SYCP384-254 filaments and bundles.
Yellow dotted boxes indicate areas of micrographs used in Figure 2G.
Figure 3
SYCP2:SYCP3 filaments are assembled from end-to-end interactions of a 2:2 heterotetrameric unit.
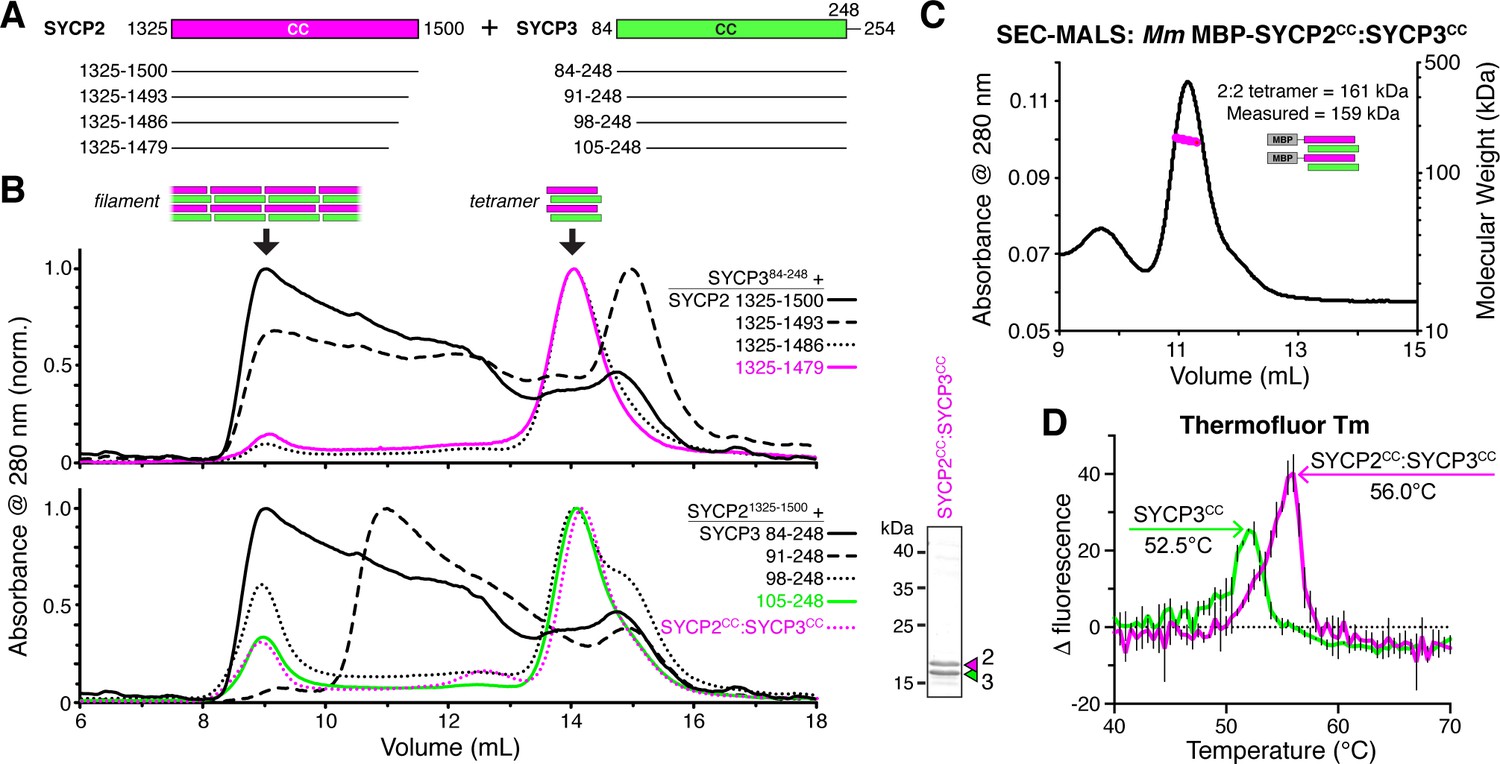
(A) Schematic of the predicted coiled-coil regions of M. musculus SYCP2 and SYCP3, with truncations used for co-expression/size exclusion chromatography analysis in panels (B) and (C). (B) Superose-6 size exclusion chromatography analysis of truncated Mm SYCP2:SYCP3 complexes. All complexes were purified after co-expression using an N-terminal His6-MBP tag on SYCP2. Upper panel: truncation of the SYCP2 coiled-coil C-terminus, from 1325 to 1500 (black) to 1325–1479 (magenta), all co-expressed with SYCP384-248. Lower panel: truncation of SYCP3 coiled-coil N-terminus, from 84 to 248 (black) to 105–248 (green), all co-expressed with SYCP31325-1500. Magenta dotted line indicates elution profile of MBP-SYCP21325-1479:SYCP3105-248 complex (Mm SYCP2CC:SYCP3CC), used for SEC-MALS in panel (C). Lower right: SDS-PAGE analysis of purified Mm SYCP2CC:SYCP3CC complex (with His6-MBP tag removed). (C) SEC-MALS analysis of purified His6-MBP-Mm SYCP2CC:SYCP3CC complex. Calculated molecular weight of a 2:2 heterotetramer = 161.4 kDa; Measured molecular weight = 158.6 kDa. (D) Thermofluor melting-temperature (Tm) analysis for Mm SYCP2CC:SYCP3CC (red) versus a homotetrameric Mm SYCP3CC complex (green). Thick colored lines represent an average of three independent measurements, with standard deviation represented by thin vertical black lines.
Figure 4 with 5 supplements
Structural analysis of the SYCP2:SYCP3 complex.
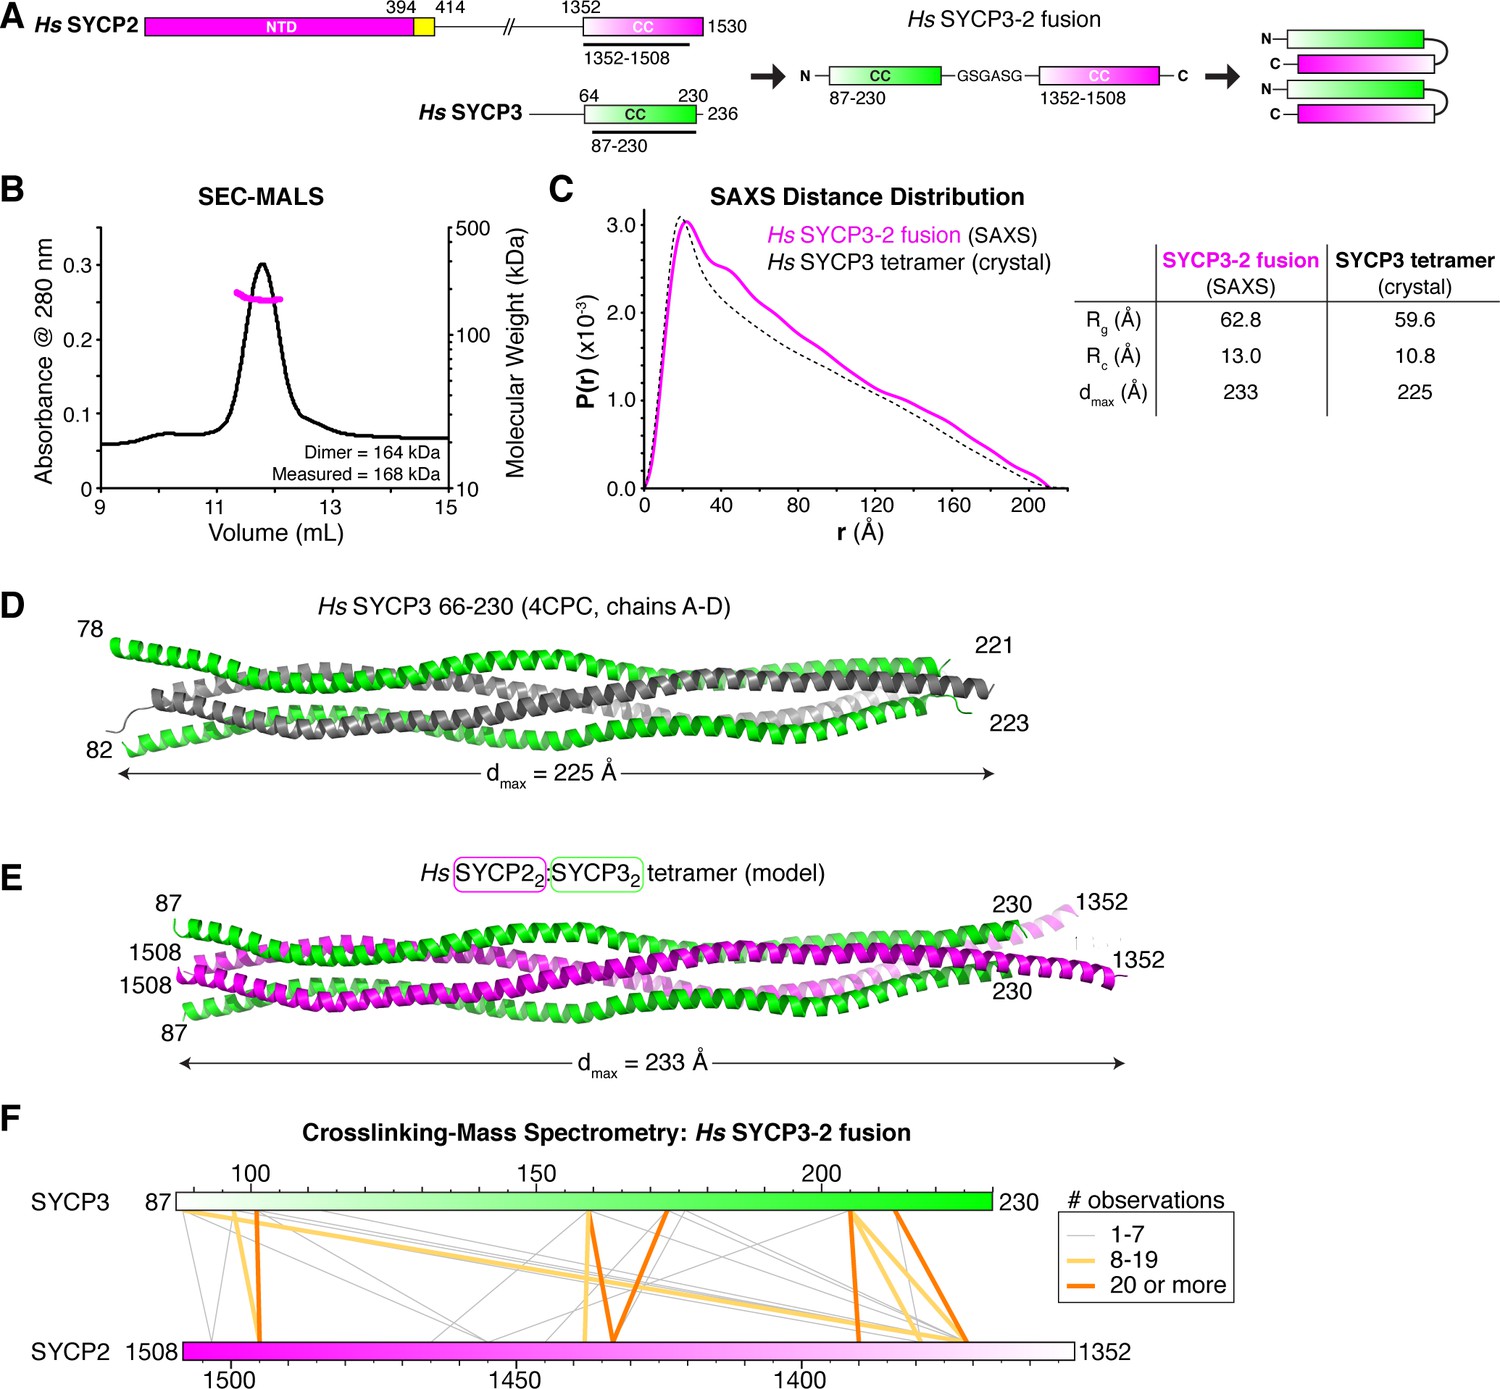
(A) Design of the H. sapiens SYCP3CC-SYCP2CC fusion, based on the idea that SYCP2 and SYCP3 helices pack antiparallel in the 2:2 heterotetrameric structure. (B) SEC-MALS analysis of purified His6-MBP-Hs SYCP3CC-[GSGASG]-SYCP2CC. Measured molecular weight (167.7 kDa) is equivalent to the calculated molecular weight of a homodimer (equivalent to a 2:2 heterotetramer of SYCP2 and SYCP3; 163.7 kDa). (C) Intra-particle distance distribution (P(r)) curve for the Hs SYCP3CC-SYCP2CC fusion construct derived from small-angle x-ray scattering (SAXS) analysis (magenta), compared to the calculated distance distribution of the Hs SYCP3CC homotetramer structure (PDB ID 4CPC; dotted black line) (Syrjänen et al., 2014). Lower: table comparing radius of gyration (Rg), cross-sectional radius of gyration (Rc), and maximum dimensions (dmax) of the Hs SYCP3CC-SYCP2CC fusion (calculated from SAXS; see Figure 4—figure supplement 2) and the Hs SYCP3CC homotetramer (calculated from the crystal structure). See Figure 4—figure supplement 3 for SAXS analysis of Hs MBP-SYCP3CC-SYCP2CC, and Figure 4—figure supplement 4 for SAXS analysis of the Mm SYCP2CC:SYCP3CC complex. (D) Structure of the Hs SYCP3CC homotetramer structure (PDB ID 4CPC; dotted black line) (Syrjänen et al., 2014), with two parallel chains (N-termini left) colored green, and the other two chains (N-termini right) colored gray. We determined the crystal structure of the M. musculus SYCP3CC homotetramer in two different crystal forms (Figure 4—figure supplement 1A–D). This structure resembles the structure of Hs SYCP3CC in the central coiled-coil region, but adopts a distinct, more disordered structure near both ends. (E) Model of an Hs SYCP2CC:SYCP3CC 2:2 heterotetramer, with two SYCP3 chains colored green as in panel (D) (N-termini left), and two SYCP2 chains colored magenta (N-termini right). Sequence register was derived from aligning SYCP2 and SYCP3 sequences. (F) Schematic of crosslinking mass spectrometry (XLMS) results on the Hs SYCP3CC-SYCP2CC fusion. Crosslinks observed at least eight times are colored yellow, and crosslinks observed at least 20 times are colored orange. See Supplementary file 2–4 and Figure 4—figure supplement 5 for full results. 9 of 10 high-scoring crosslinks support the antiparallel subunit arrangement shown in panel (E).
Figure 4—figure supplement 1
Structure of Mm SYCP3CC homotetramer and modeling of an SYCP2:SYCP3 heterotetramer.
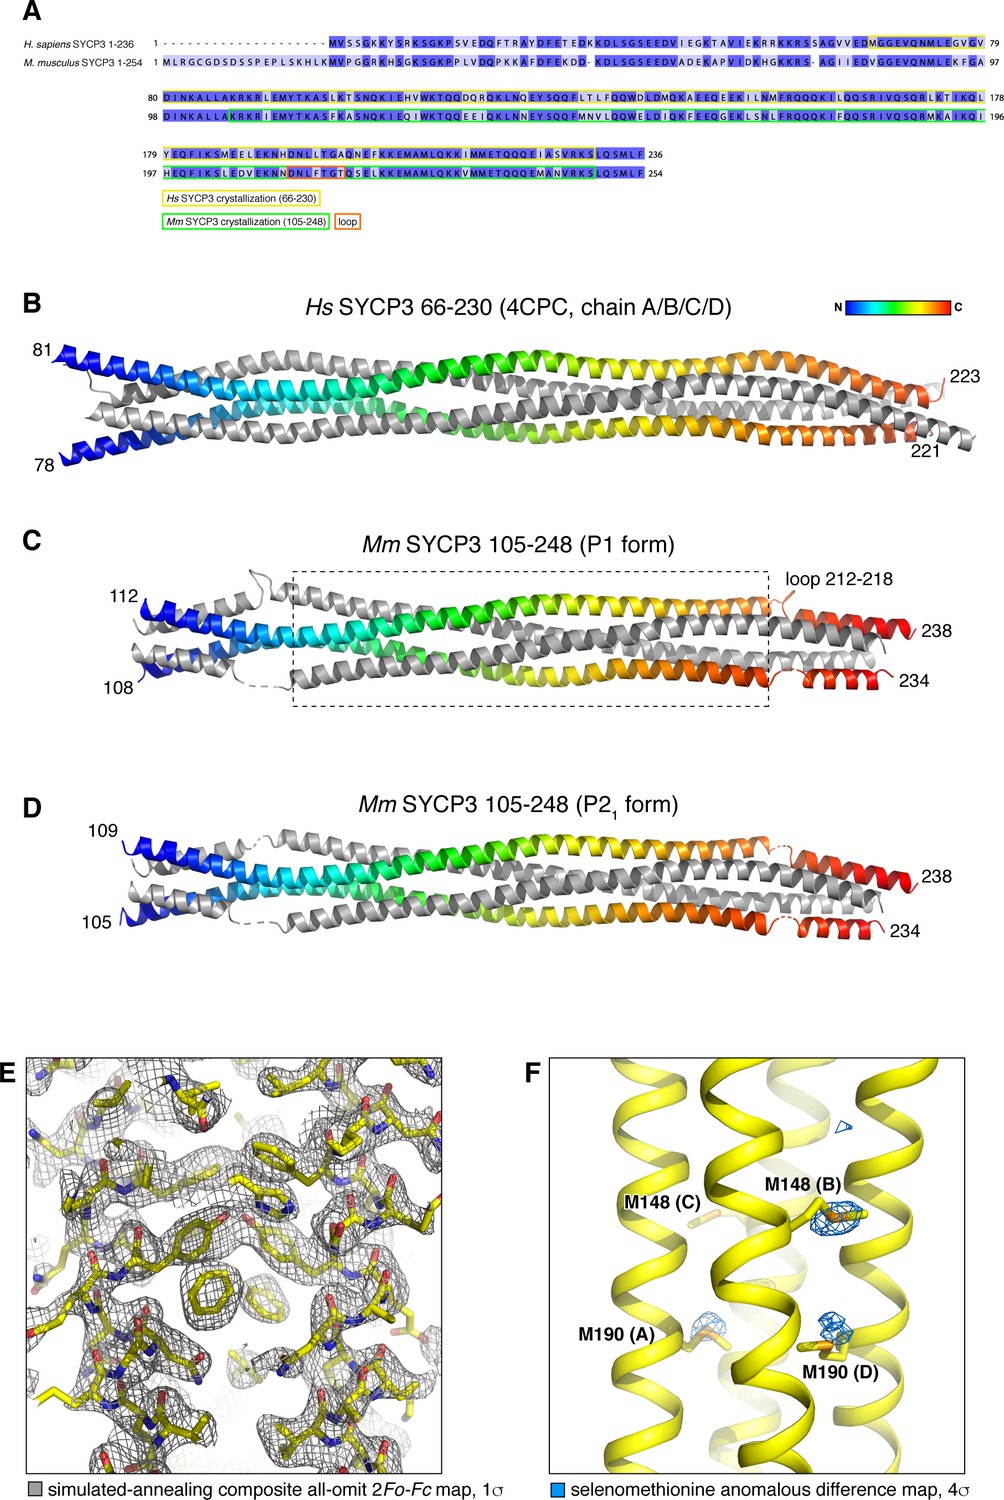
(A) Sequence alignment of H. sapiens and M. musculus SYCP3, with fragments crystallized as homotetramers highlighted. (B) Homotetramer structure of H. sapiens SYCP366-230 (PDB ID 4CPC) (Syrjänen et al., 2014). Two parallel chains are shown as rainbows, with the two antiparallel chains colored gray. (C) and (D) Homotetramer structures of Mm SYCP3105-248 (SYCP3CC) in P1 and P21 crystal forms. Both structures are shown in the same orientation as Hs SYCP3, and are colored equivalently. The structures overlay closely with Hs SYCP3 in the central region (boxed in panel (C); Cα r.m.s.d. ~1.5 Å over residues of all four chains (residues 133–210 of Mm SYCP2; 115–192 of Hs SYCP2); but differ substantially near the ends, where Ms SYCP3 residues 212–218 loop out from the coiled-coil and interact with symmetry-related complexes, thereby altering the register of the antiparallel α-helices. See Supplementary file 1 for data collection and refinement statistics of the two Mm SYCP3CC structures. (E) Closeup view of the SYCP3CC P21 crystal form, with simulated-annealing composite all-omit 2Fo-Fc map at 1.0 σ shown in gray. (F) Closeup view of the SYCP3CC P1 crystal form, with selenomethionine anomalous difference map at 4.0 σ shown in blue. The majority of methionine locations show strong anomalous difference peaks.
Figure 4—figure supplement 2
SAXS analysis of Hs SYCP3CC-SYCP2CC fusion.
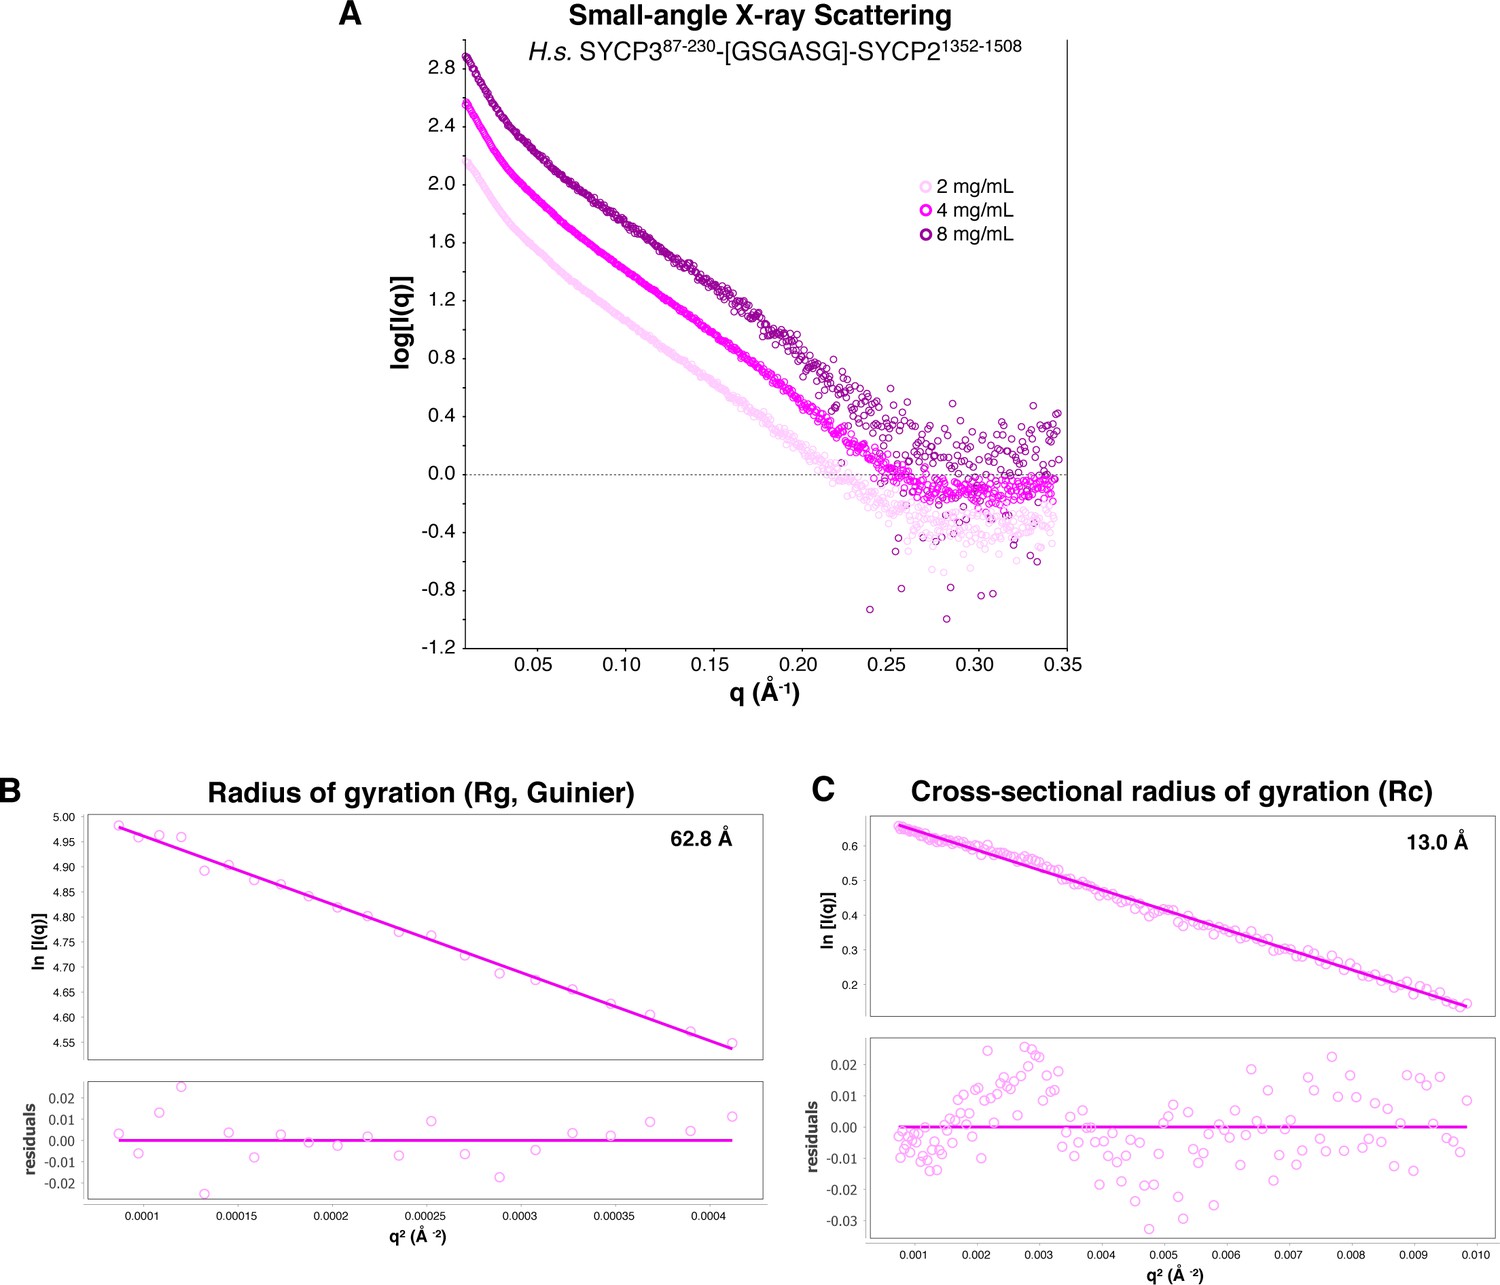
(A) Small-angle x-ray scattering (SAXS) curves on the Hs SYCP3CC-SYCP2CC fusion construct at three different protein concentrations. (B) Guinier analysis of the low-scattering-angle region to determine radius of gyration (Rg) (Feigin and Svergun, 1987). (C) Cross-sectional radius of gyration (Rc) analysis (Glatter and Kratky, 1982).
Figure 4—figure supplement 3
SAXS analysis of Hs His6-MBP-SYCP3CC-SYCP2CC fusion.
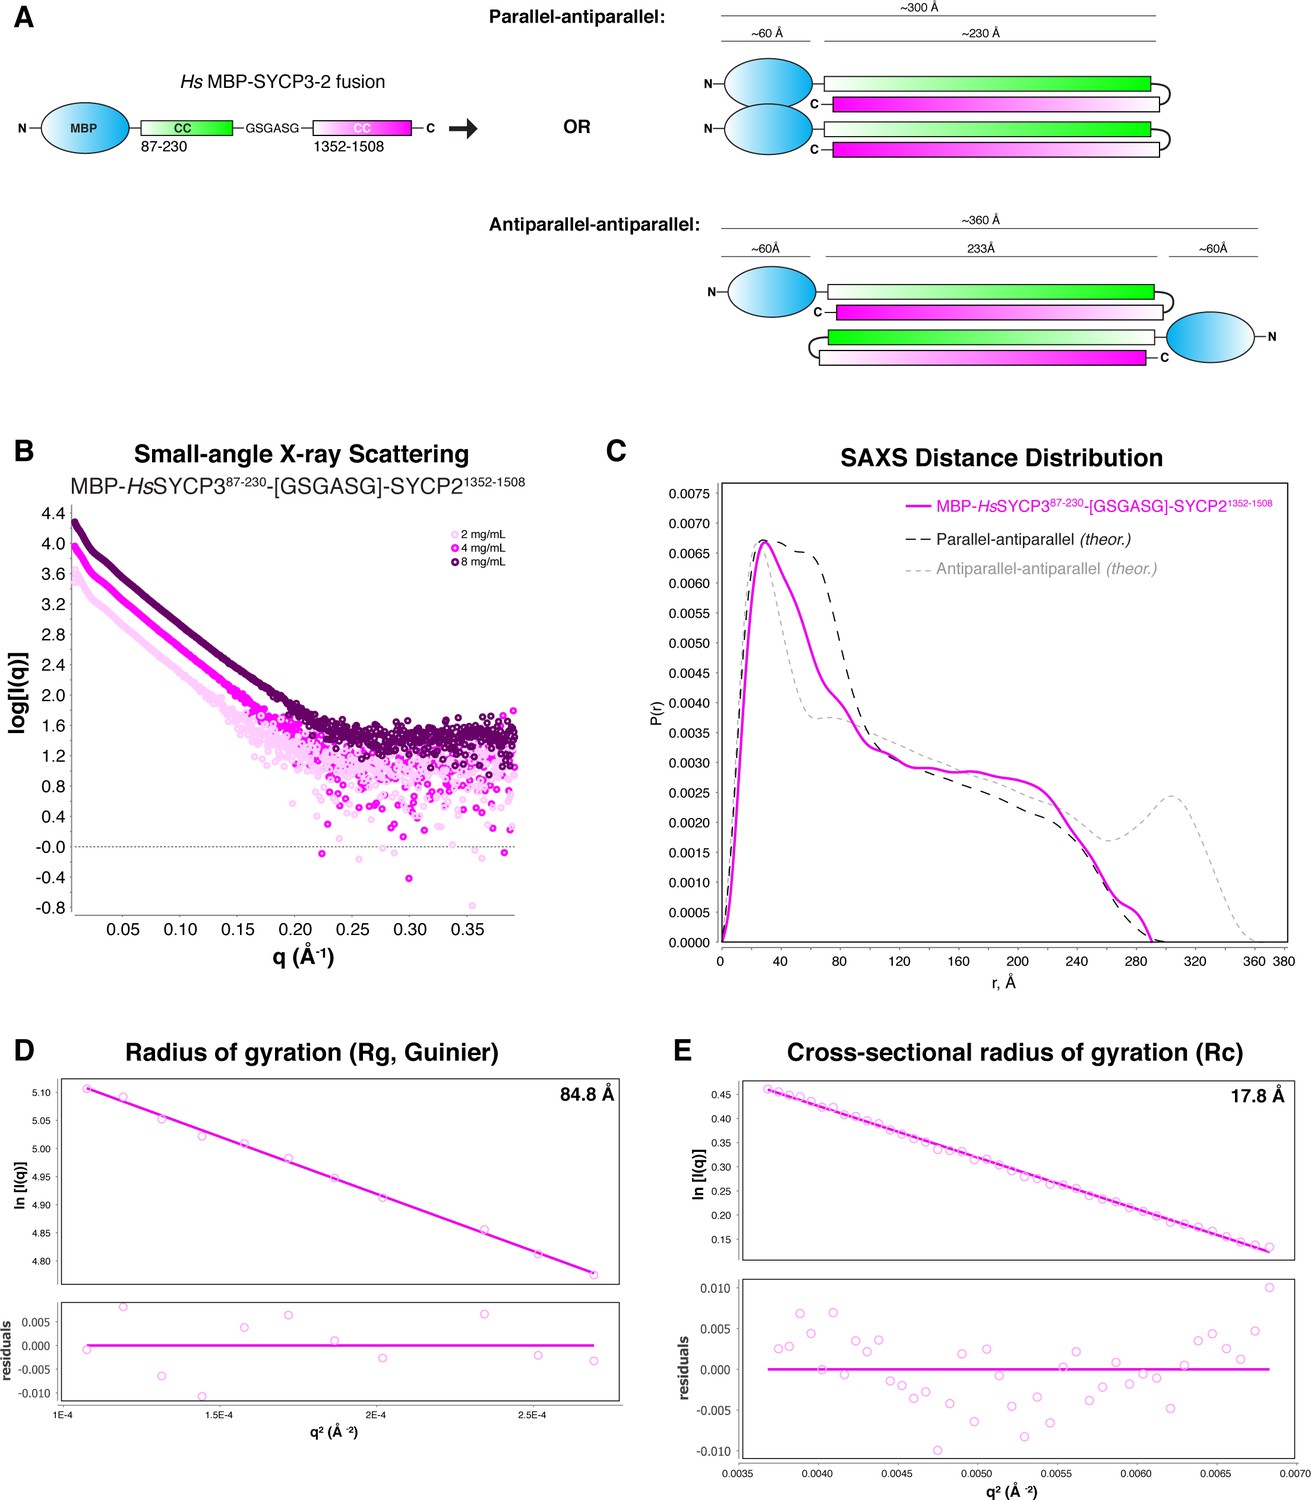
(A) Schematic models of two possible orientations of subunits in the His6-MBP-SYCP3CC-SYCP2CC fusion complex. In the ‘parallel-antiparallel’ model (top), the two His6-MBP tags are located on the same end of the complex. In the ‘antiparallel-antiparallel’ model, the two His6-MBP tags are located on opposite ends of the complex. (B) Small-angle x-ray scattering (SAXS) curves on the Hs His6-MBP-SYCP3CC-SYCP2CC fusion complex, at three different protein concentrations. (C) Intra-particle distance distribution of Hs His6-MBP-SYCP3CC-SYCP2CC fusion (magenta), compared to the calculated distance distribution for the ‘parallel-antiparallel’ (dark grey) and ‘antiparallel-antiparallel’ (light grey) models. (D) Guinier analysis of the low-scattering-angle region to determine radius of gyration (Rg) (Feigin and Svergun, 1987). (E) Cross-sectional radius of gyration (Rc) analysis (Glatter and Kratky, 1982).
Figure 4—figure supplement 4
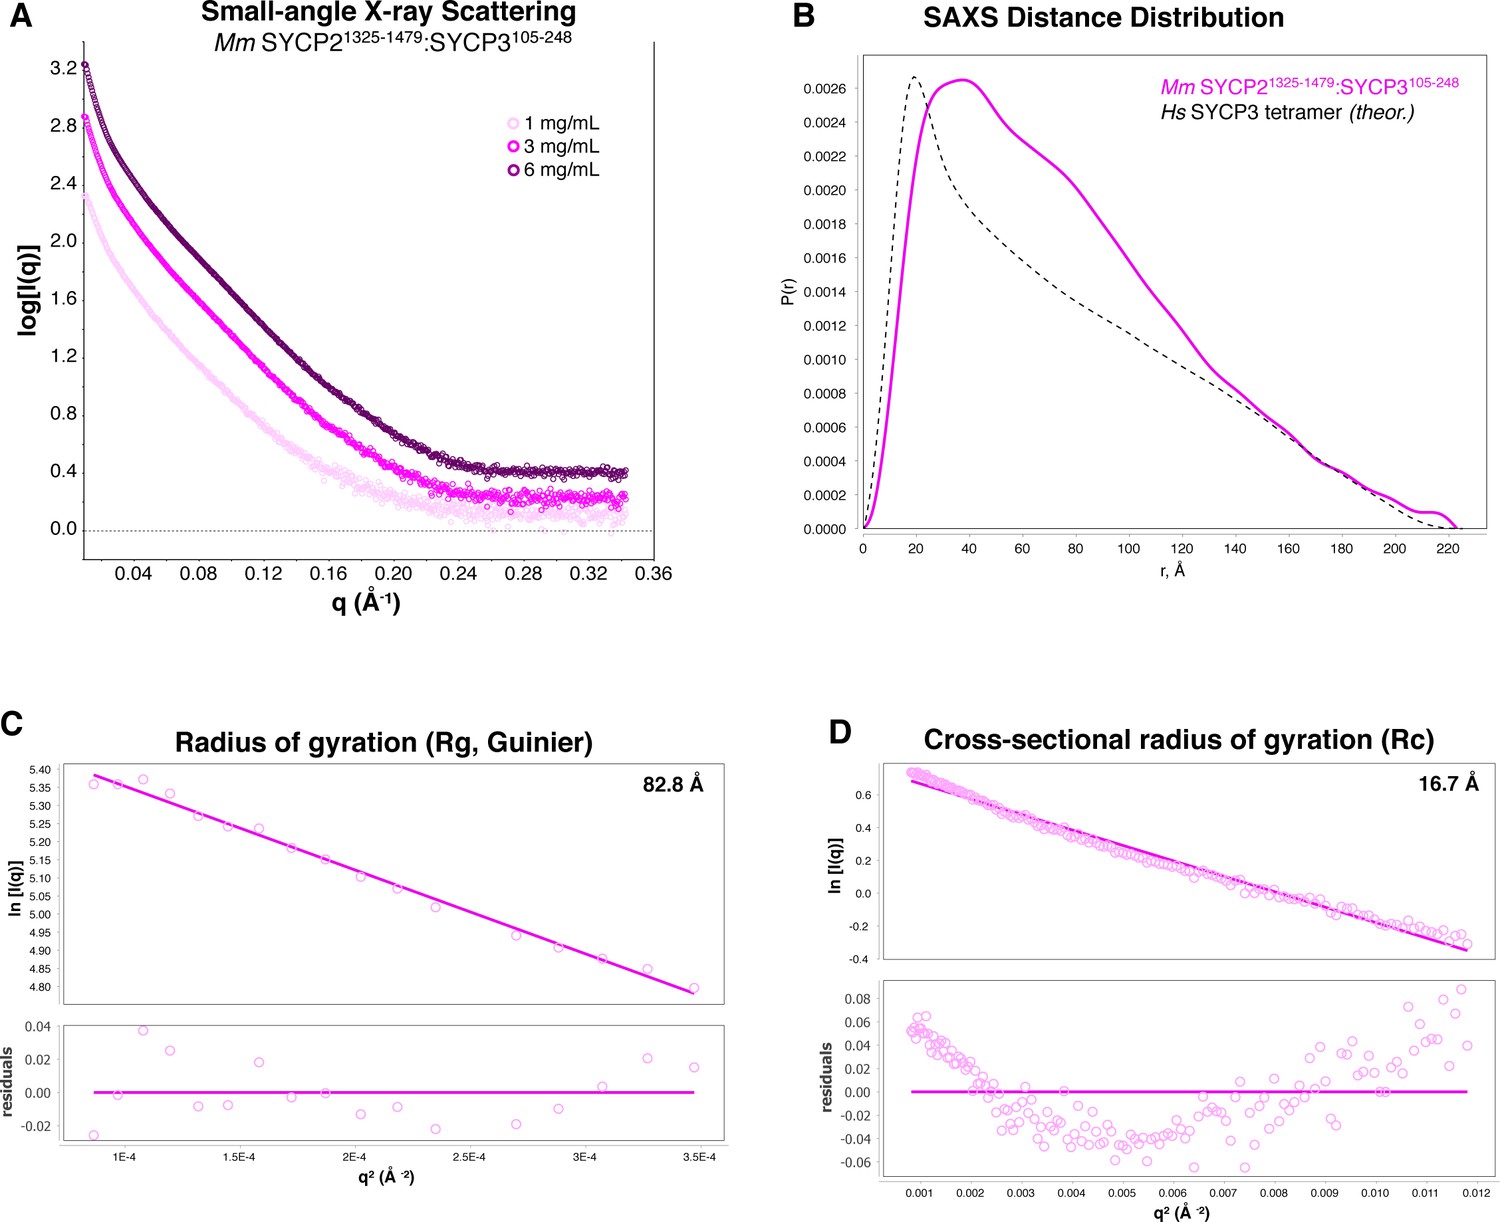
SAXS analysis of Mm SYCP2CC:SYCP3CC.
(A) Small-angle x-ray scattering (SAXS) curves on the Mm SYCP2CC:SYCP3CC complex, at three different protein concentrations. The high slope in the low-scattering-angle region of the scattering curves indicates aggregation in the sample cell. (B) Intra-particle distance distribution of Mm SYCP2CC:SYCP3CC (magenta), compared to the calculated distance distribution of the Hs SYCP3CC homotretramer crystal structure (Syrjänen et al., 2014). (C) Guinier analysis of the low-scattering-angle region to determine radius of gyration (Rg) (Feigin and Svergun, 1987). (D) Cross-sectional radius of gyration (Rc) analysis (Glatter and Kratky, 1982). The non-linearity evident in residual values, and the larger values of both Rg and Rc in Mm SYCP2CC:SYCP3CC compared to the Hs SYCP3CC-SYCP2CC fusion, are attributable to aggregation.
Figure 4—figure supplement 5
XLMS analysis of Hs SYCP3CC-SYCP2CC fusion.
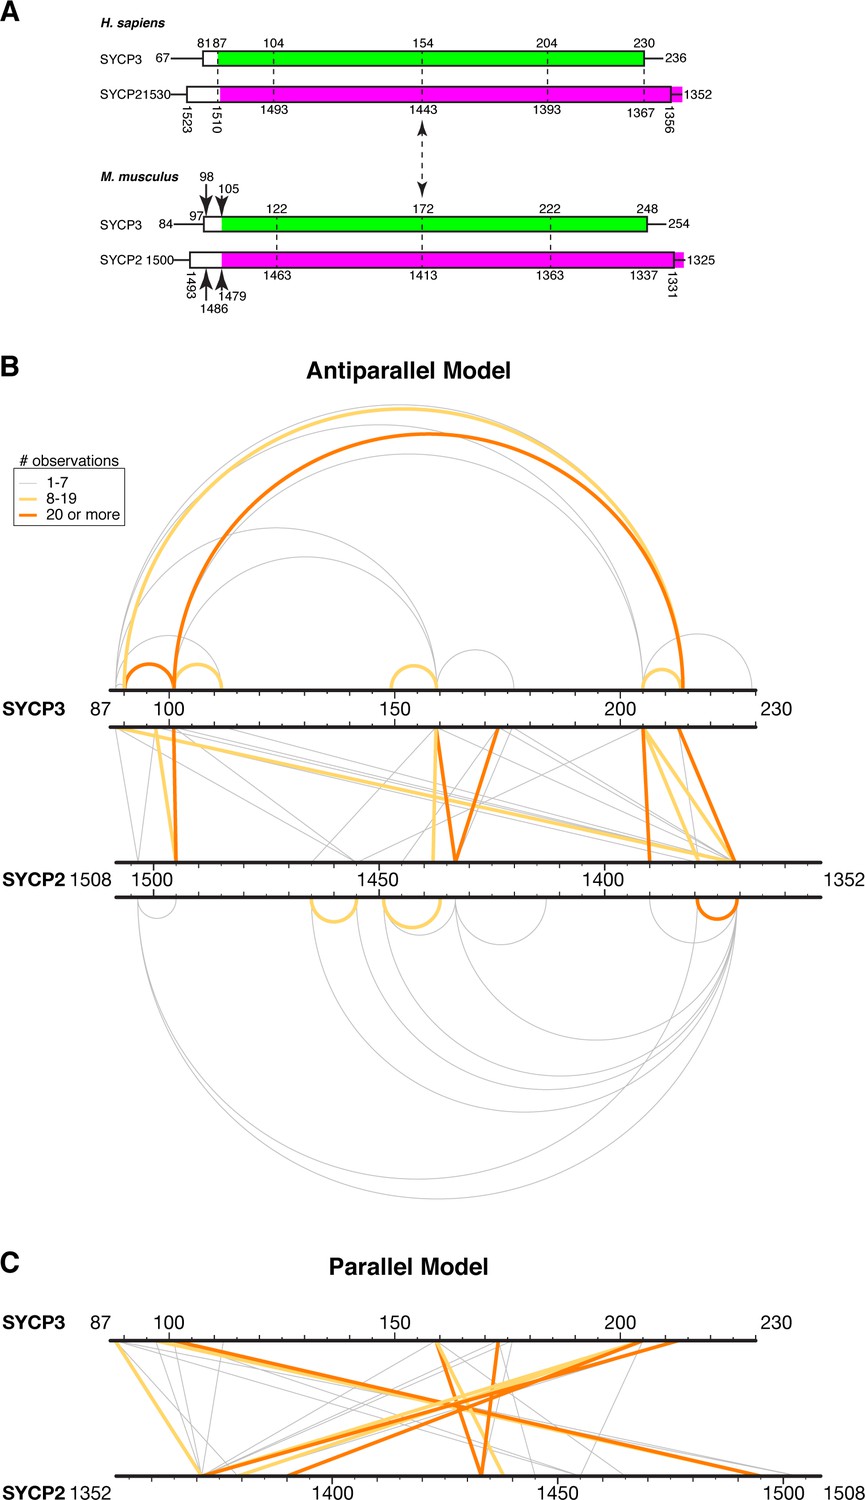
(A) Schematic model for the register of a hypothetical SYCP2:SYCP3 heterotetrameric complex, based on sequence alignments between the two proteins and the structure of Hs SYCP3CC (Syrjänen et al., 2014). (B) Schematic of 55 unique crosslinks (listed in Supplementary file 2–3) detected by crosslinking mass spectrometry (XLMS) mapped onto an antiparallel model of the SYCP2:SYCP3 complex. Top: 15 intra-SYCP3 crosslinks. Bottom: 13 intra-SYCP2 crosslinks. Middle: SYCP2-SYCP3 crosslinks. Crosslinks are colored by the number of times each was observed: 1–7 gray, 8–19 yellow, 20 or more orange. (C) Schematic of SYCP2-SYCP3 crosslinks mapped onto a parallel model of the complex.
Figure 5 with 3 supplements
Plant ASY3 and ASY4 share a conserved molecular architecture with mammalian and budding-yeast axis proteins.
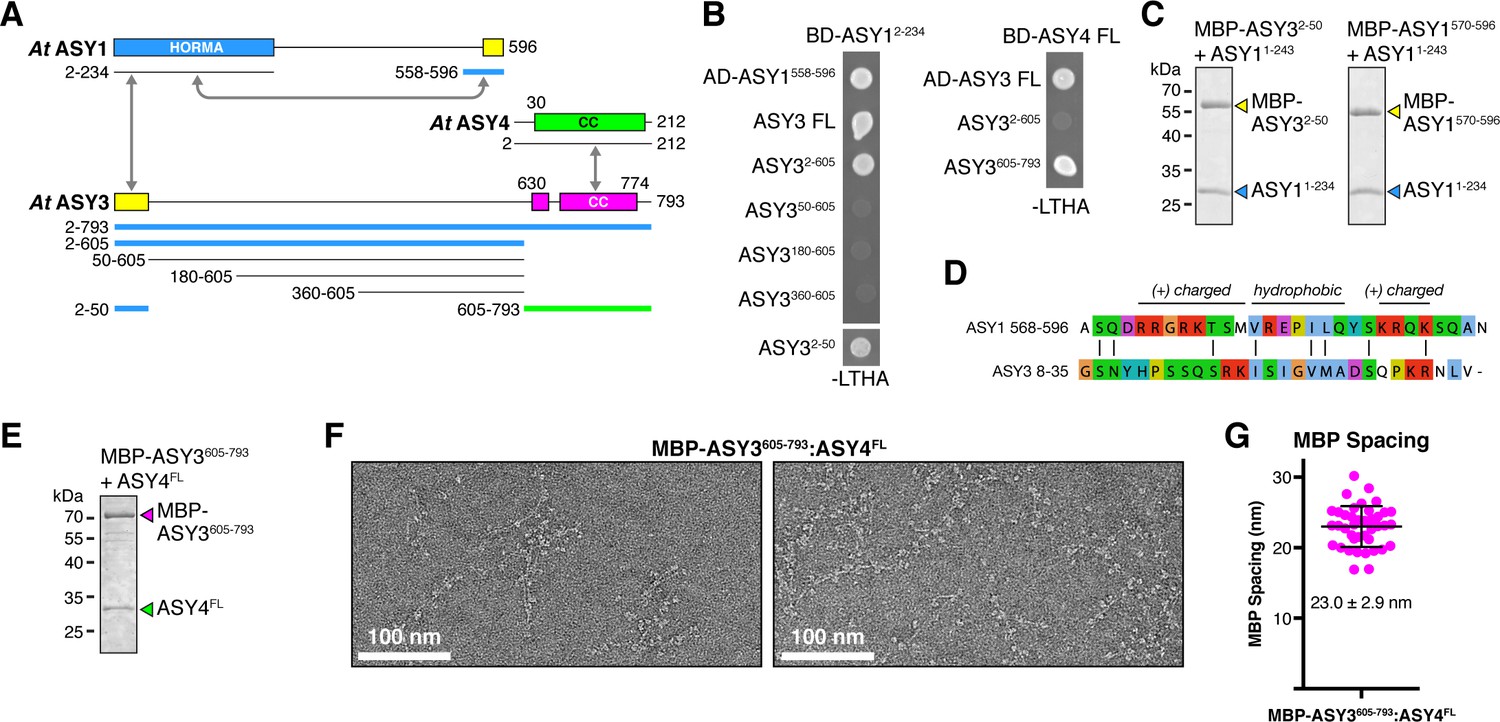
(A) Schematic of Arabidopsis thaliana chromosome axis proteins, with truncations used for yeast two-hybrid assays shown for ASY1, ASY3, and ASY4. Colored in blue and green are ASY3 constructs that interact with the ASY1 HORMA domain (blue) and ASY4 (green). (B) Yeast two-hybrid analysis of A. thaliana ASY1, ASY3, and ASY4. AD: Gal4 activation domain fusion; BD: Gal4 DNA-binding domain fusion. Stringent selection on -LEU-TRP-HIS-ADE (-LTHA) media is shown; see Figure 5—figure supplement 1 for complete results. (C) SDS-PAGE analysis of purified His6-MBP-tagged closure motifs in ASY3 (residues 2–50) and ASY1 (residues 570–596) in complex with untagged ASY1 HORMA domain (residues 1–234). Complexes were purified using Ni2+ affinity and size-exclusion chromatography. (D) Sequence alignment of the putative closure motif regions of At ASY1 (residues 568–596) and ASY3 (residues 8–35). The two regions show weak homology with a central region enriched in hydrophobic residues, bracketed on both sides by positively-charged residues. See Figure 5—figure supplement 2 for sequence alignments of both regions. (E) SDS-PAGE analysis of purified His6-MBP-ASY3605-793:ASY4FL complexes used for negative-stain EM analysis (panel F). (F) Representative negative-stain electron micrographs of purified His6-MBP-ASY3605-793:ASY4FL filaments. See Figure 5—figure supplement 3 for additional full micrographs. (G) Quantification of inter-MBP spacing in micrographs of His6-MBP-Mm SYCP21325-1500:SYCP384-248 filaments. The measured spacing of 23.0 ± 2.9 nm (mean ±standard deviation from 41 measured intervals) is equivalent to the length of a ~160 residue coiled-coil (0.146 nm rise per residue). Predicted coiled-coil regions of ASY3 and ASY4 are ~145 and ~180 residues, respectively.
Figure 5—figure supplement 1

Yeast two-hybrid analysis of plant ASY1, ASY3, and ASY4.
(A) Yeast two-hybrid analysis of A. thaliana ASY1 HORMA domain, ASY1 C-terminal domain, and ASY3. AD: indicated proteins were cloned into pGADT7 (Gal4 activation domain fusion); BD: indicated proteins were cloned into pBridge (Gal4 DNA-binding domain fusion). -LEU-TRP: non-selective; -LEU-TRP-HIS: weak selection; -LEU-TRP-HIS-ADE: stringent selection. (B) Yeast two-hybrid analysis of A. thaliana ASY4 and ASY3.
Figure 5—figure supplement 2
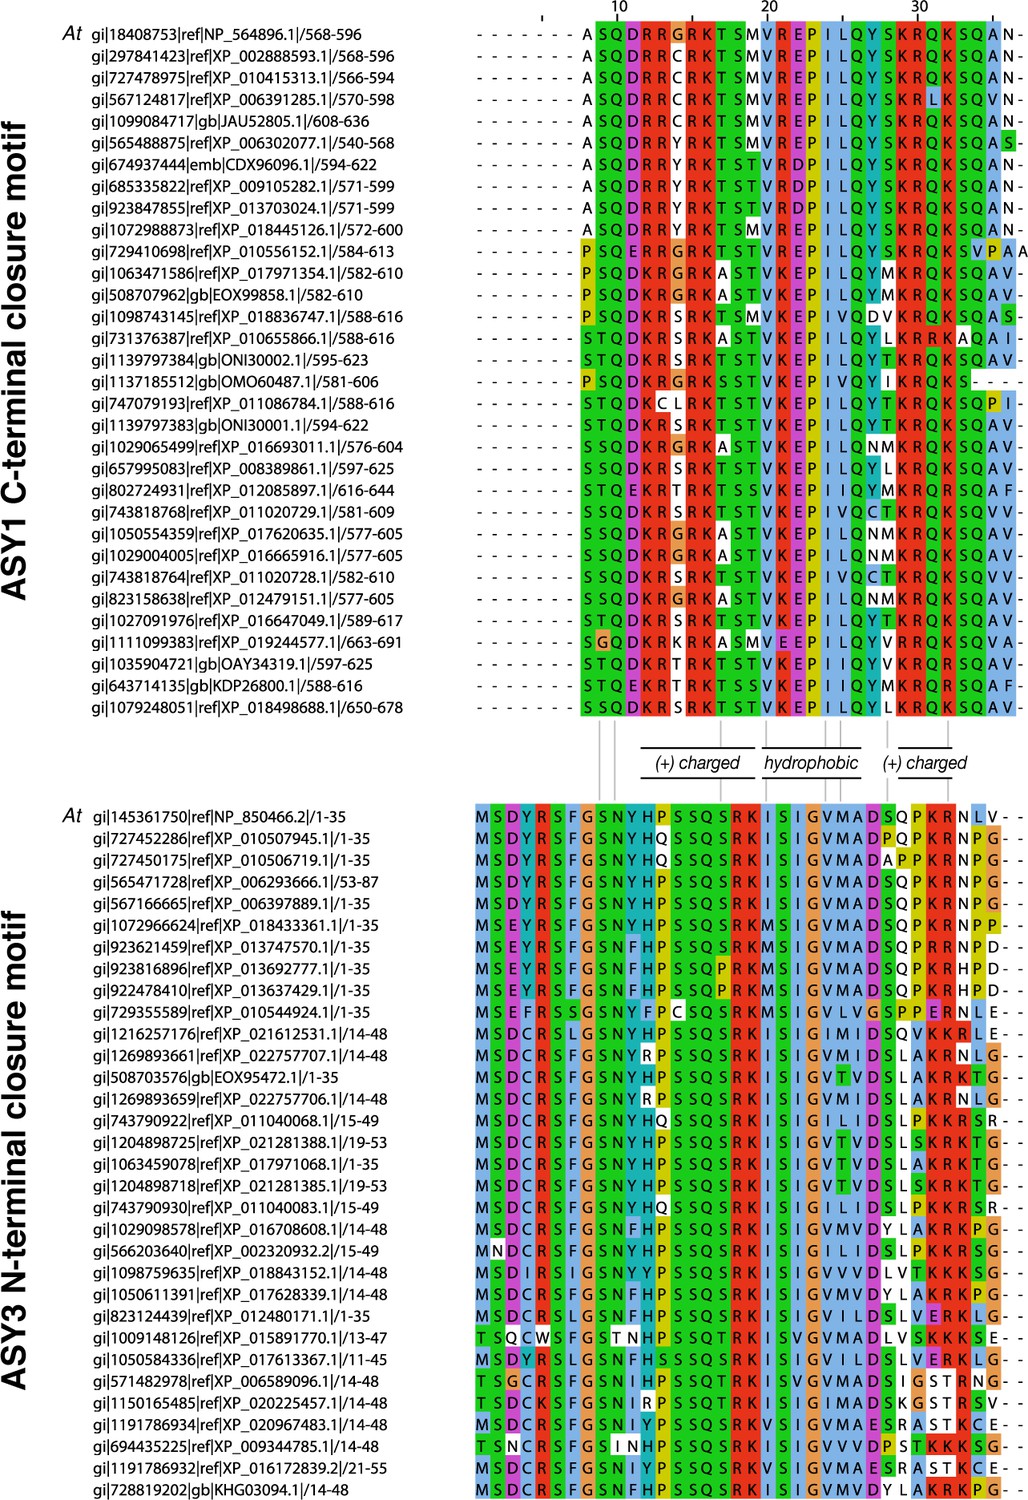
Sequence alignments of putative closure motifs in plant ASY1 and ASY3.
(A) Sequence alignment of 32 plant ASY1 C-terminal domains. (B) Sequence alignment of 32 plant ASY3 N-terminal domains.
Figure 5—figure supplement 3
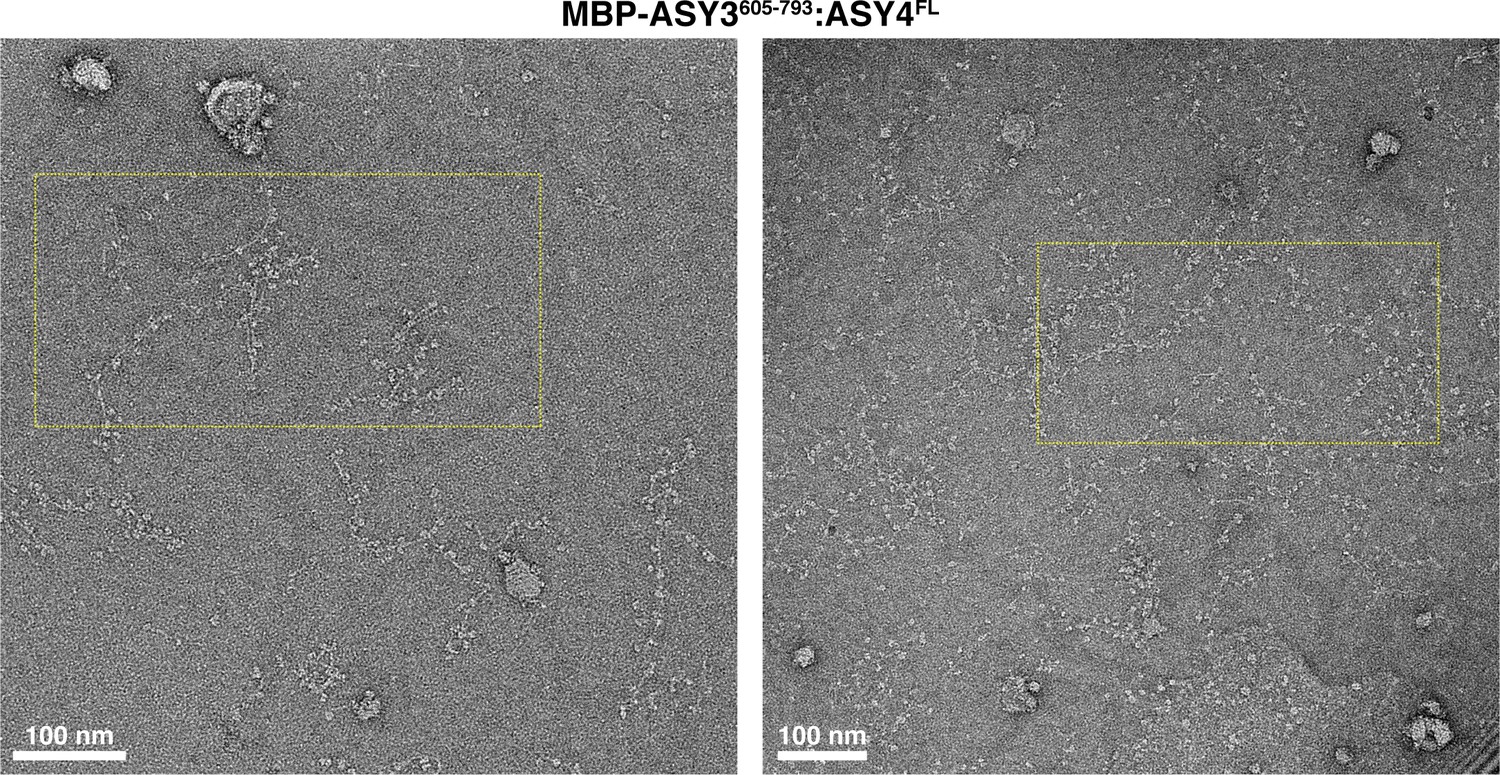
Electron micrographs of At ASY3:ASY4 filaments.
Negative-stain electron micrographs of A. thaliana His6-MBP-ASY3605-793:ASY4FL filaments. Yellow dotted boxes indicate the area of micrographs shown in Figure 5F.
Figure 6

The conserved molecular architecture of the meiotic chromosome axis.
(A) Model for assembly of the meiotic chromosome axis in fungi, plants, and mammals. Related axis core proteins (fungal Red1, plant ASY3:ASY4, mammalian SYCP2:SYCP3) form filaments from coiled-coil homo- or heterotetrameric units, which flexibly associate with chromosome-associated cohesin complexes. Chromatin loop extrusion by cohesin complexes and bundling of axis-core filaments leads to formation of the chromosome axis, which is flexible and able to axially compress or expand if needed. (B) List of homologous chromosome axis proteins in different eukaryotic groups.
Tables
Key resources table
| Reagent type or resource | Designation | Source or reference | Identifiers | Additional information |
|---|---|---|---|---|
| Strain, strain background (S. cerevisiae) | strain AH109 | Clontech | ||
| Strain, strain background (S. cerevisiae) | strain Y187 | Clontech | ||
| Strain, strain background (E. coli) | Rosetta2 (DE3) pLysS | Novagen | ||
| Genetic reagent (S. cerevisiae) | S288c genomic DNA | Invitrogen | cat. # 69240 | |
| Genetic reagent (Z. rouxii) | NRRL Y-229 genomic DNA | ATCC | cat. # 2623D-5 | |
| Genetic reagent (M. musculus) | HORMAD1 cDNA | TransOMIC Technologies | BC051129 | |
| Genetic reagent (M. musculus) | HORMAD2 cDNA | TransOMIC Technologies | BC120781 | |
| Genetic reagent (M. musculus) | SYCP2 cDNA | Harvard PlasmID | MmCD0083242 | |
| Genetic reagent (M. musculus) | SYCP3 | GeneArt | Synthesized gene fragment | |
| Genetic reagent (H. sapiens) | SYCP2 | GeneArt | Synthesized gene fragment | |
| Genetic reagent (H. sapiens) | SYCP3 | GeneArt | Synthesized gene fragment | |
| Genetic reagent (A. thaliana) | ASY1 | GeneArt | Synthesized gene fragment | |
| Genetic reagent (A. thaliana) | ASY3 | GeneArt | Synthesized gene fragment | |
| Genetic reagent (A. thaliana) | ASY4 | GeneArt | Synthesized gene fragment | |
| Antibody | Rabbit polyclonal Anti-Red1 antibody (1) | Gift from G. S. Roeder | used for immunofluorescence | |
| Antibody | Rabbit polyclonal Anti-Red1 antibody (2) | Gift from N. Hollingsworth | used for Western blotting | |
| Antibody | Mouse polyclonal Anti-Gmc2 antibody | Prosci Inc. | used for immunofluorescence | |
| Antibody | Goat polyclonal anti-rabbit HRP antibody | Jackson Immunoresearch | 111-035-003 | used for Western blotting |
| Recombinant DNA reagent | Plasmid pGADT7 | Clontech | ||
| Recombinant DNA reagent | Plasmid pBridge | Clontech | ||
| Recombinant DNA reagent | Macrolab vector 2CT | UC Berkeley Macrolab | ||
| Recombinant DNA reagent | Macrolab vector 13S-A | UC Berkeley Macrolab | ||
| Recombinant DNA reagent | Macrolab vector 2 ST | UC Berkeley Macrolab | ||
| Peptide, recombinant protein | TEV protease | David Waugh, National Cancer Institute | Clone pRK793 | Purified in-house |
| Peptide, recombinant protein | Mm HORMAD2 closure motif peptide | Biomatik, Inc. | Sequence: FITC-Ahx-EPSFESSRKKKKVSEPVTVFIPNRK | |
| Commercial assay or kit | HisTrap HP column | GE Life Sciences | ||
| Commercial assay or kit | HiTrap Q HP column | GE Life Sciences | ||
| Commercial assay or kit | Superdex 200 column | GE Life Sciences | ||
| Chemical compound, drug | D0/D12 BS3 (bis-sulfosuccinimidylsuberate | Creative Biomolecules | cat. # BS3 | |
| Software, algorithm | RAPD | https://github.com/RAPD | ||
| Software, algorithm | AIMLESS | http://www.ccp4.ac.uk | ||
| Software, algorithm | TRUNCATE | http://www.ccp4.ac.uk | ||
| Software, algorithm | autoxds | Stanford Synchrotron Radiation Lightsource | In-house script | |
| Software, algorithm | ARCIMBOLDO | http://chango.ibmb.csic.es | ||
| Software, algorithm | PHENIX | http://www.phenix-online.org/download/ | ||
| Software, algorithm | PHASER | http://www.phaser.cimr.cam.ac.uk/index.php/Phaser_Crystallographic_Software | ||
| Software, algorithm | RESOLVE | https://solve.lanl.gov | ||
| Software, algorithm | COOT | https://www2.mrc-lmb.cam.ac. uk/personal/pemsley/coot/ | ||
| Software, algorithm | ATSAS | https://www.embl-hamburg.de/biosaxs/software.html | SAXS analysis suite | |
| Software, algorithm | xQuest | http://prottools.ethz.ch/orinner/public/htdocs/xquest/ | ||
| Software, algorithm | Graphpad Prism | Graphpad software - https://www.graphpad.com | version 7 |
Additional files
-
Supplementary file 1
Data collection and refinement statistics.
- https://doi.org/10.7554/eLife.40372.024
-
Supplementary file 2
SYCP3-SYCP2 crosslinks.
- https://doi.org/10.7554/eLife.40372.025
-
Supplementary file 3
SYCP3-SYCP3 and SYCP2-SYCP2 crosslinks.
- https://doi.org/10.7554/eLife.40372.026
-
Supplementary File 4
Simulated versus experimental crosslinking in parallel vs. antiparallel models of tetramer assembly.
- https://doi.org/10.7554/eLife.40372.027
-
Supplementary file 5
Yeast strains.
- https://doi.org/10.7554/eLife.40372.028
-
Transparent reporting form
- https://doi.org/10.7554/eLife.40372.029
Download links
A two-part list of links to download the article, or parts of the article, in various formats.
Downloads (link to download the article as PDF)
Open citations (links to open the citations from this article in various online reference manager services)
Cite this article (links to download the citations from this article in formats compatible with various reference manager tools)
A conserved filamentous assembly underlies the structure of the meiotic chromosome axis
eLife 8:e40372.
https://doi.org/10.7554/eLife.40372


