Intergenerational epigenetic inheritance of cancer susceptibility in mammals
- Whitehead Institute, United States
- Brigham and Women’s Hospital, Harvard Medical School, United States
- Broad Institute of MIT and Harvard, United States
- Yale School of Medicine, United States
- Tufts University School of Medicine and Veterinary Medicine, United States
- Massachusetts Institute of Technology, United States
- Howard Hughes Medical Institute, Whitehead Institute, United States
Figures
Figure 1 with 10 supplements
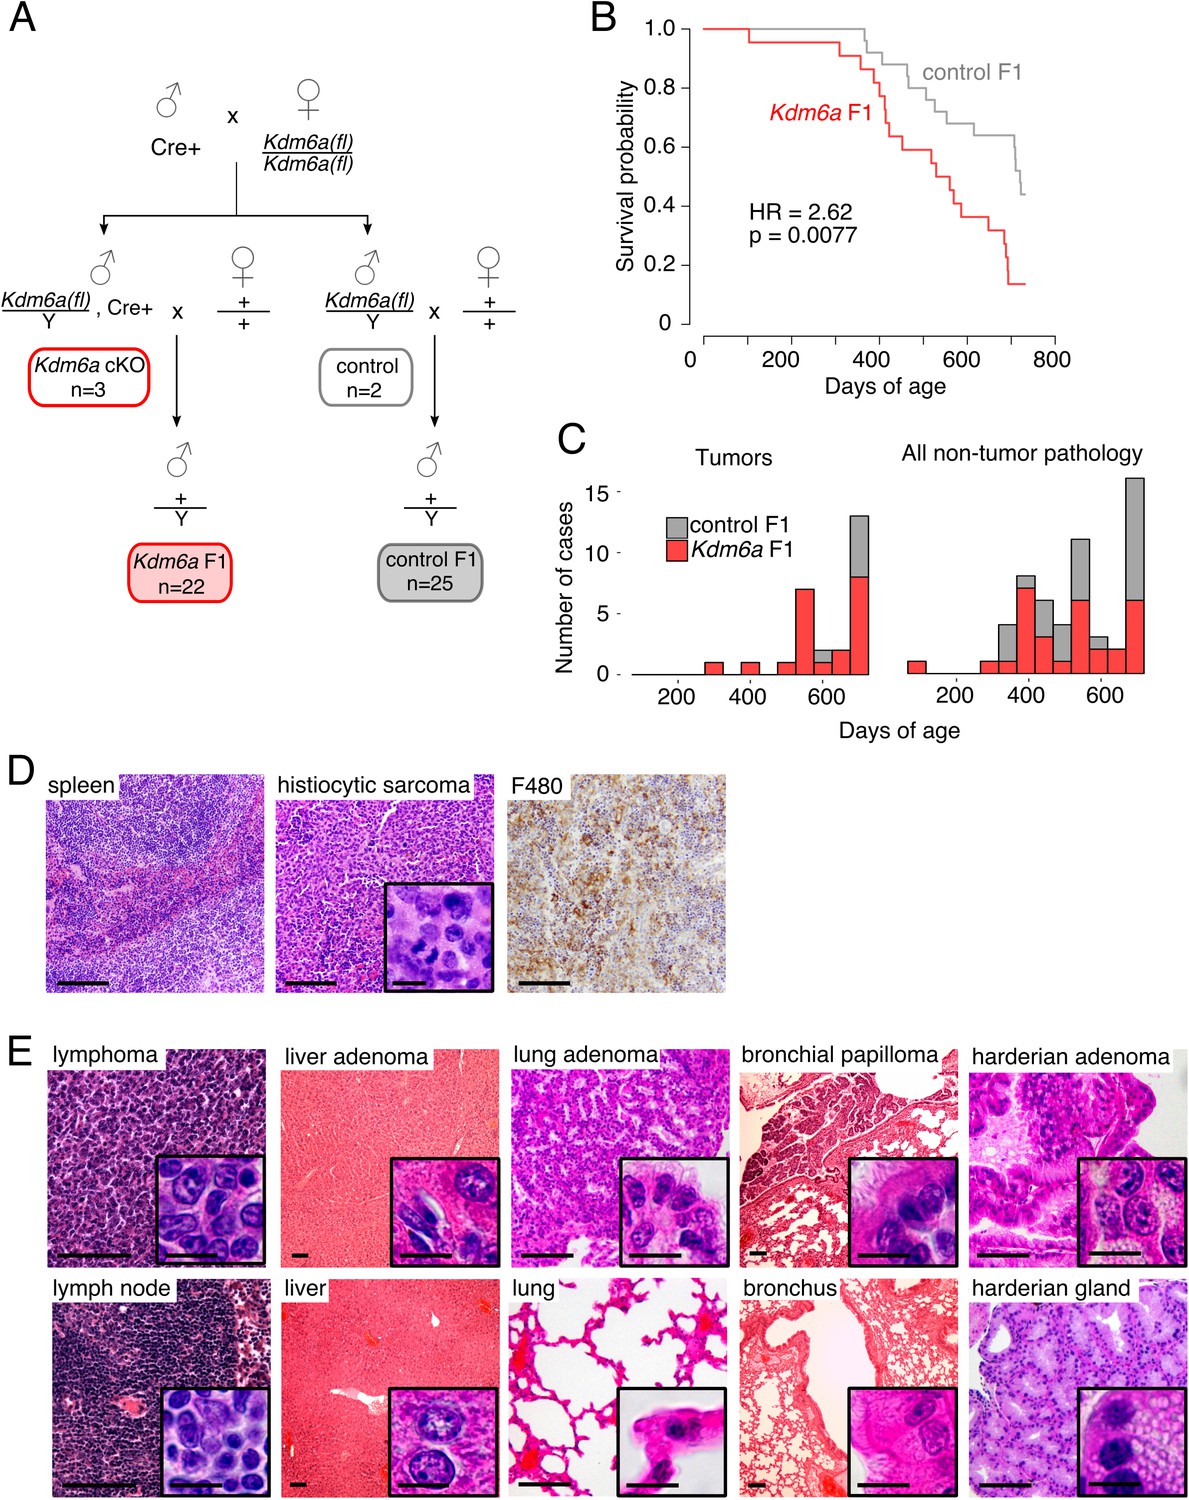
Reduced lifespan and increased tumor incidence in Kdm6a F1s.
(A) Cross for Kdm6a F1 and control F1 mice. All Kdm6a cKO (n = 3) and control (n = 2) mice were littermates. (B) Survival curve for Kdm6a F1 and control F1 males. Hazard ratio (HR) and p-value calculated by a Cox proportional hazards model. (C) Raw counts of tumors (p=0.0071) and non-tumor phenotypes (p=0.69) in Kdm6a F1 vs. control F1 males at necropsy (p-values, one-sample test of proportions). (D) Left to right, hematoxylin and eosin (H&E) staining of normal spleen in control F1; H&E of histiocytic sarcoma in spleen of Kdm6a F1, showing diffuse infiltration of red pulp with nuclear pleomorphism and frequent mitotic figures (inset); immunohistochemistry of monocyte-lineage marker F4/80 in spleen histiocytic sarcoma. (E) H&E of representative tumors in Kdm6a F1s (top) and matched normal tissues from control F1s (bottom). Scale bars, 100 um (large images), 10 um (insets). See Figure 1—source data 1.
-
Figure 1—source data 1
Survival and phenotype of Kdm6a F1s.
- https://doi.org/10.7554/eLife.39380.014
Figure 1—figure supplement 1
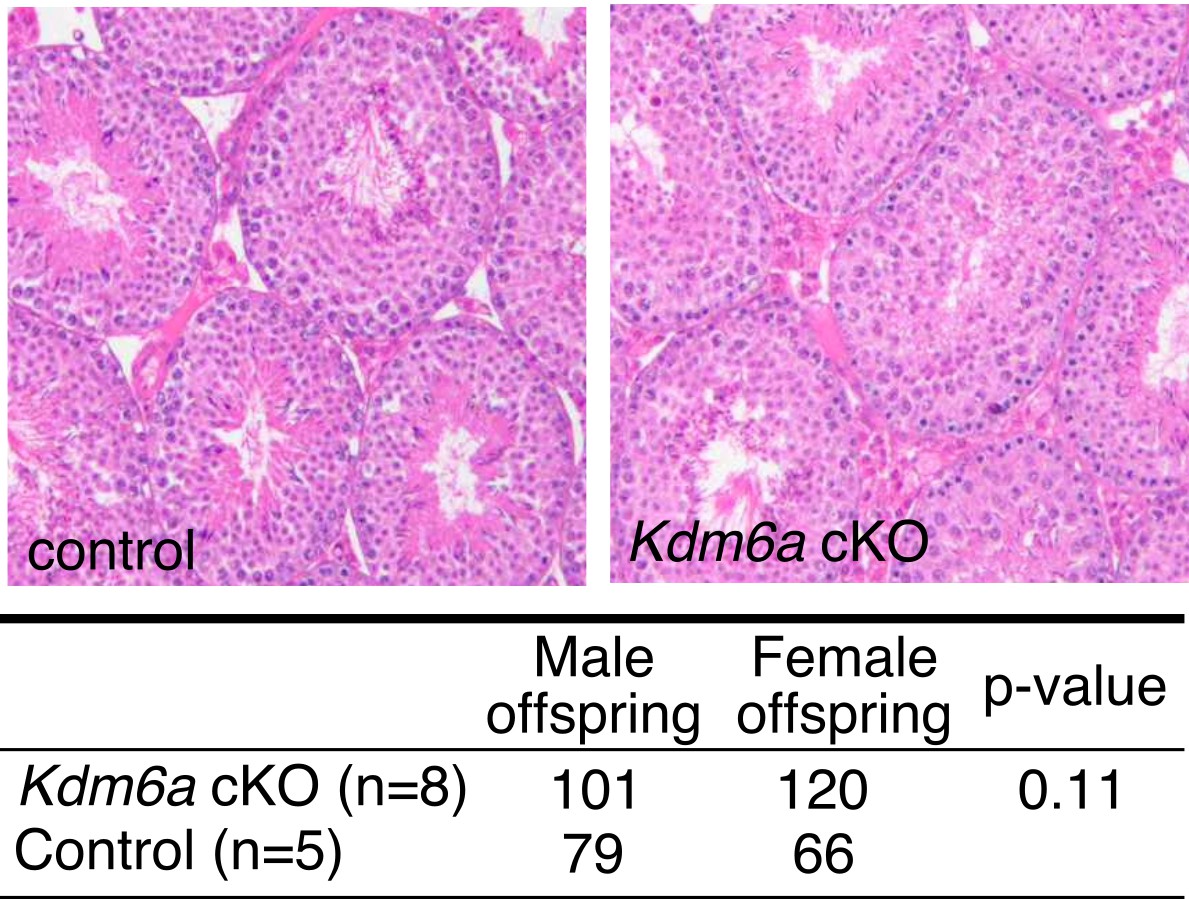
Normal spermatogenesis in Utx cKO males.
Top, hematoxylin and eosin (H&E) staining of Kdm6a cKO and control adult testes. Bottom, counts of male and female F1 offspring from Kdm6a cKO and control mice. p-value, Fisher's exact test.
Figure 1—figure supplement 2
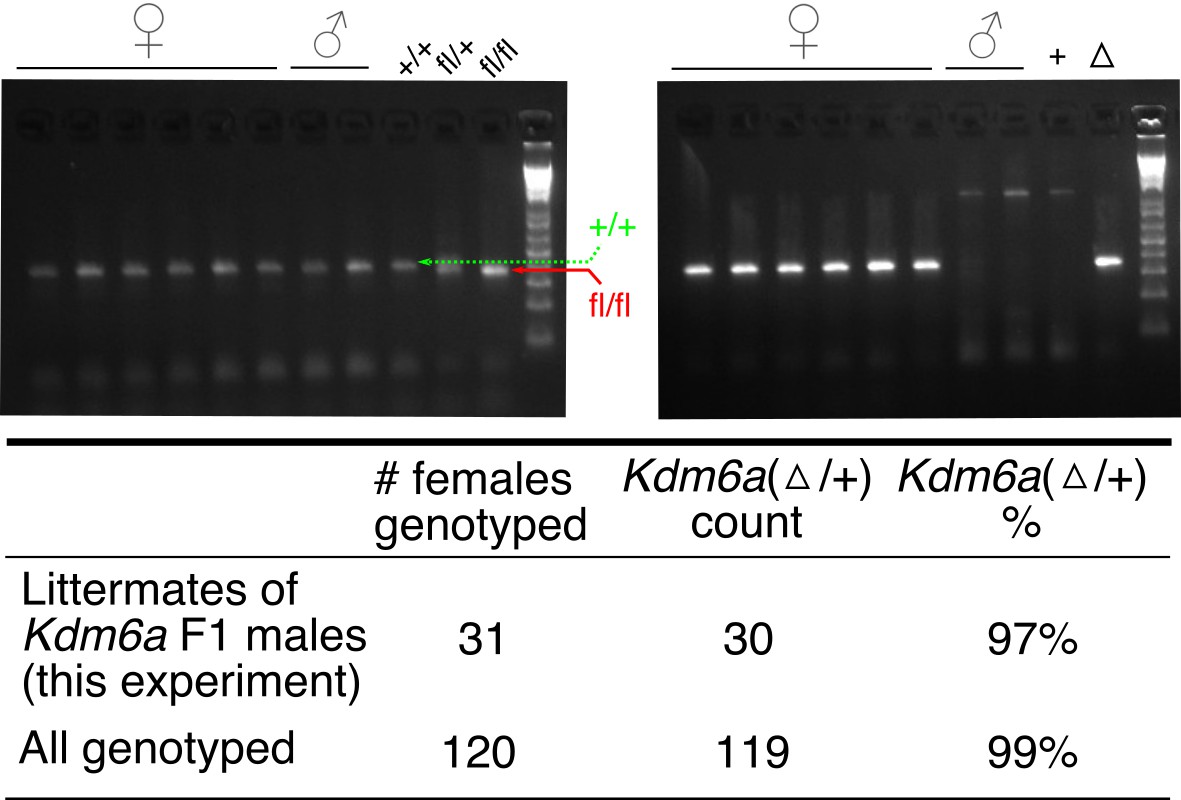
Efficiency of Ddx4-Cre in the male germ line.
Top, sample genotyping gel for one litter of Kdm6a F1s, showing bands discriminating Kdm6a(+) and Kdm6a(fl) alleles (left) and bands detecting the Kdm6a delta allele (right).
Figure 1—figure supplement 3

Survival of Kdm6a F1s from individual sires.
Top left shows F1s from the two control sires. Other plots show combined control data in grey and data from F1s of individual Kdm6a F1 sires in blue. HR, hazard ratio. p-values calculated using a Cox proportional hazards model.
Figure 1—figure supplement 4
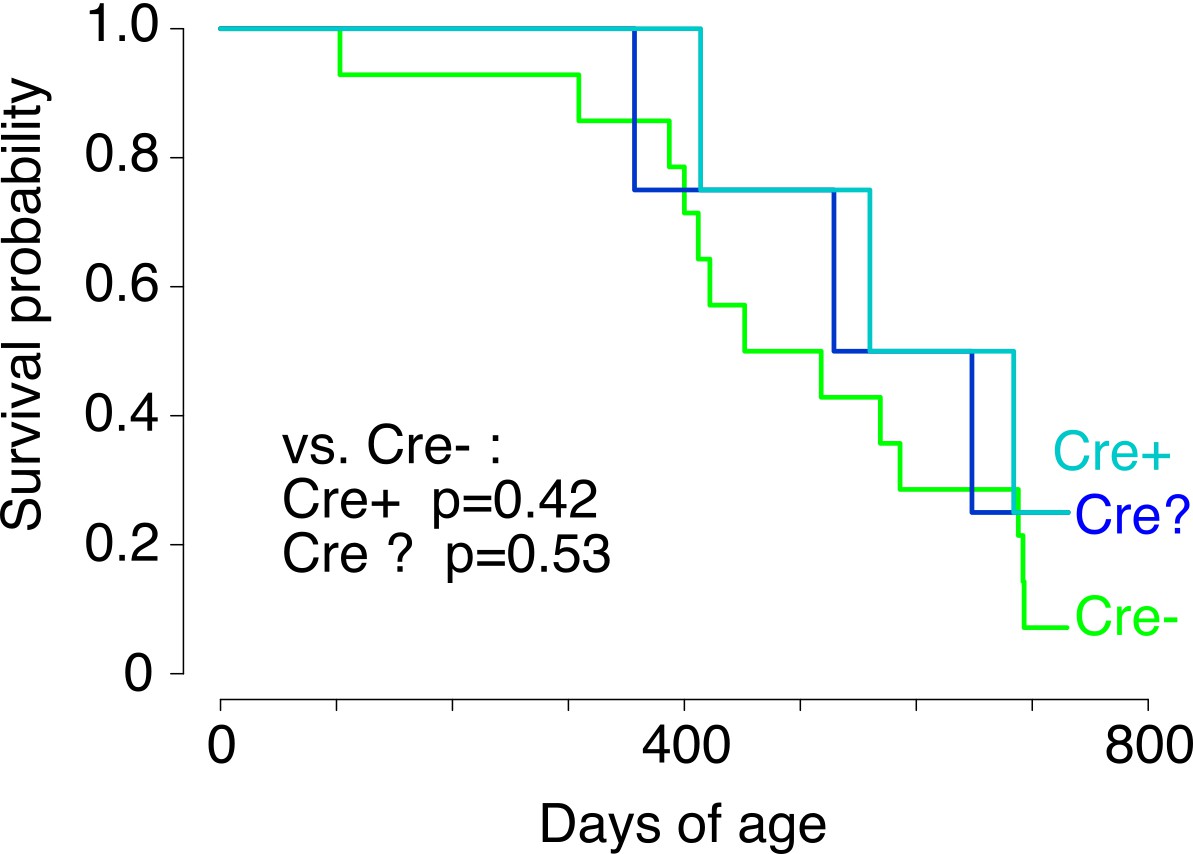
Survival of Kdm6a F1s grouped by presence or absence of the Cre transgene.
'Cre?' indicates failed or ambiguous genotyping. p-values calculated using a Cox proportional hazards model.
Figure 1—figure supplement 5
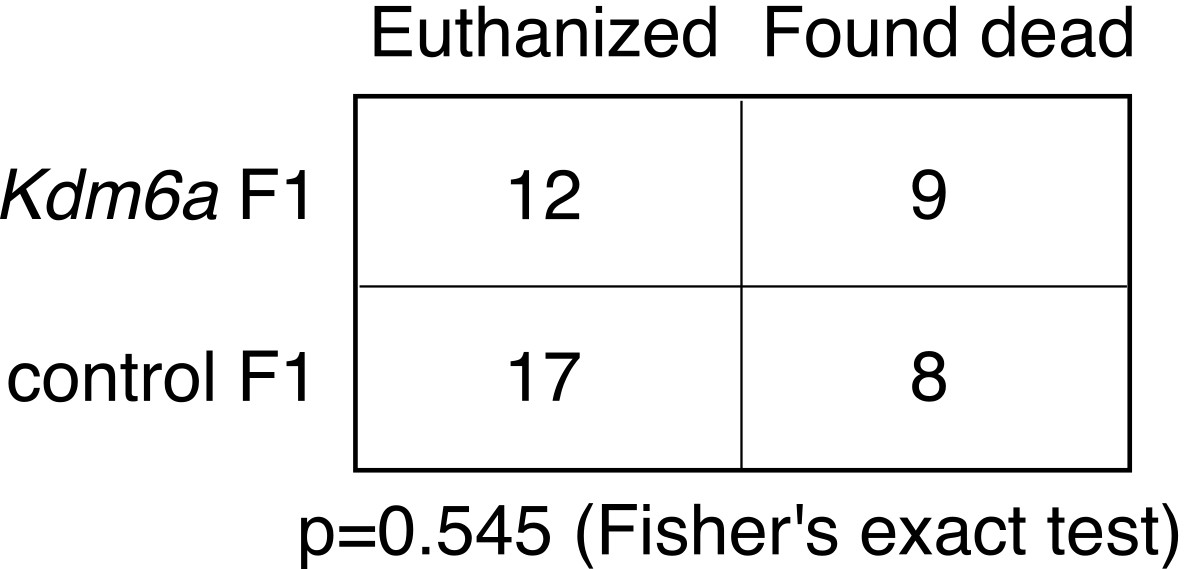
Contingency table for euthanasia vs.natural death in Kdm6a F1s and control F1s.
https://doi.org/10.7554/eLife.39380.008
Figure 1—figure supplement 6
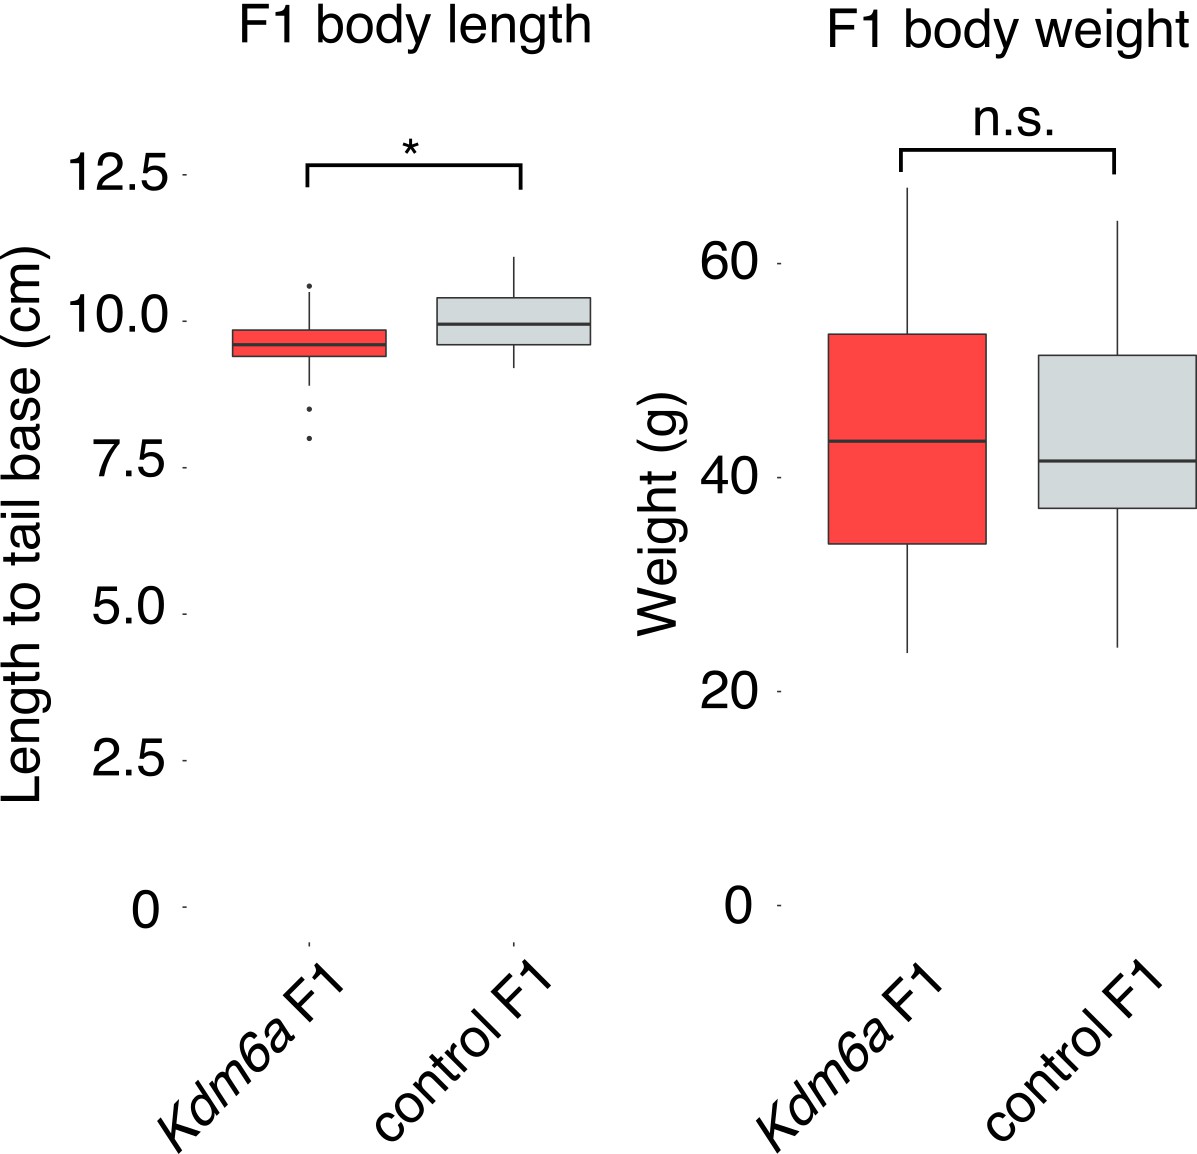
Utx F1 and control F1 weight and length.
Body weight (p=0.8775) and length (p=0.01578) of male Kdm6a F1s and control F1s at necropsy. p-values calculated by Welch’s t-test.
Figure 1—figure supplement 7
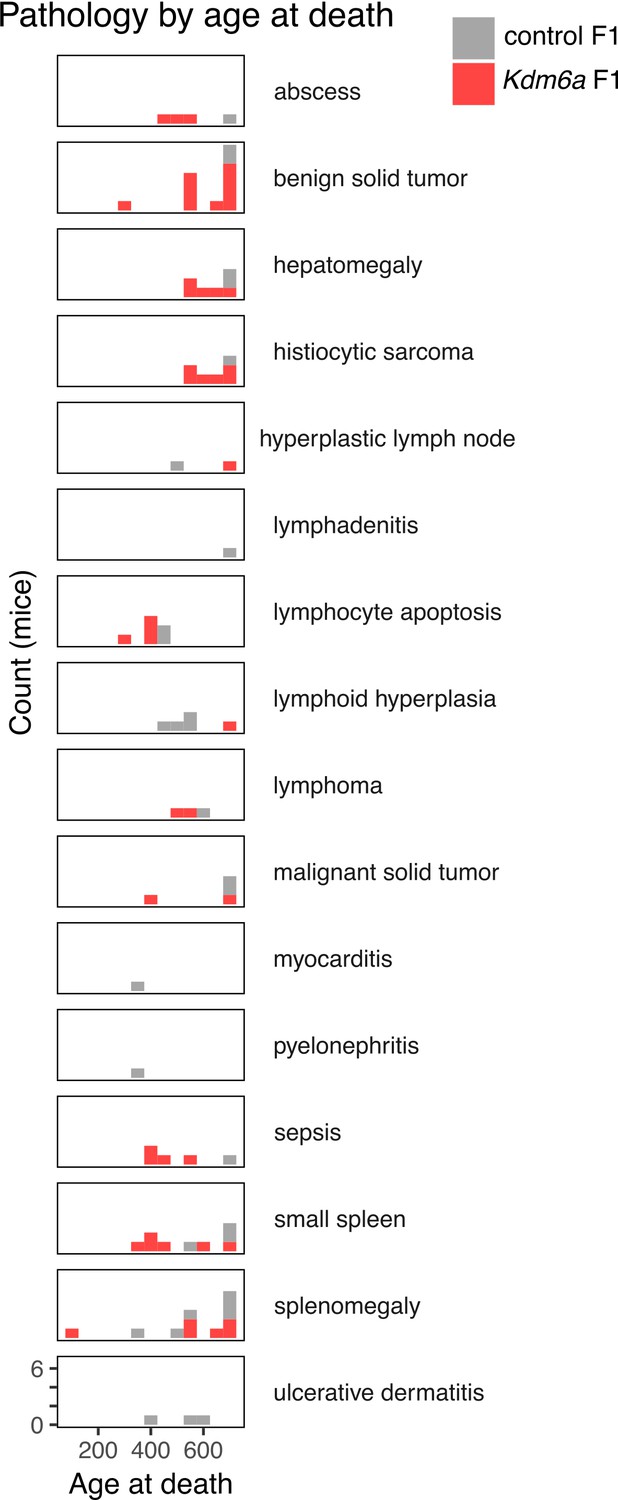
Counts of gross and histopathological diagnoses at necropsy for Kdm6a F1s and control F1s.
https://doi.org/10.7554/eLife.39380.010
Figure 1—figure supplement 8
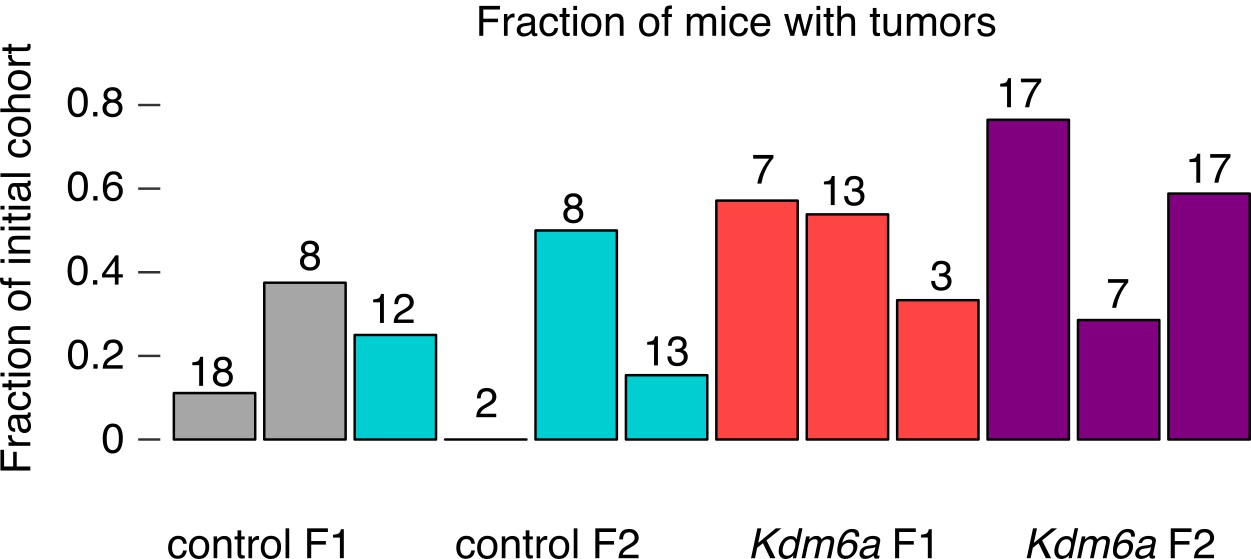
Tumor rates in control and Kdm6a F1s and F2s broken down by individual sire.
Numbers of F1 or F2 mice are shown above the bar.
Figure 1—figure supplement 9
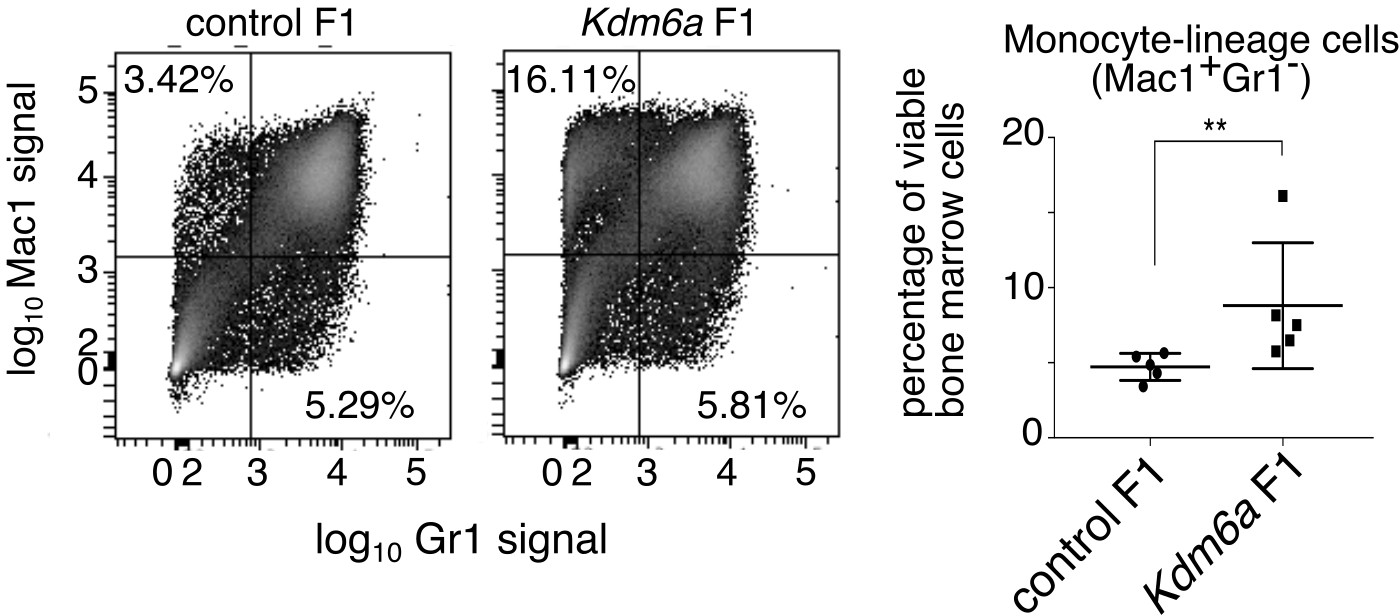
Characterization of myeloid lineages in F1 bone marrow.
Flow cytometry showing increased fraction of monocyte/macrophage lineage cells in Kdm6a F1 compared to control F1 bone marrow. **p=0.0079 (Mann-Whitney U test).
Figure 1—figure supplement 10
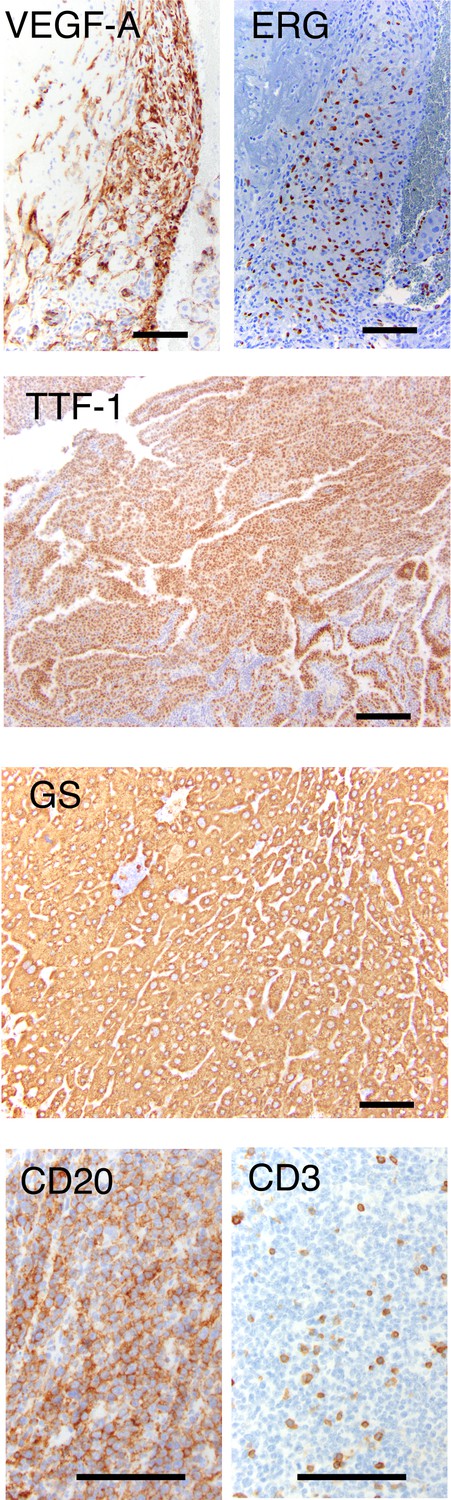
Validation of tumor types in Utx F1s.
Immunohistochemistry (IHC) for sample tumors: VEGF-A (left, cytoplasmic) and ERG (right, nuclear) in angiosarcoma (Figure 2D); TTF-1 in lung adenoma (Figure 1E); Glutamine synthetase in hepatocellular carcinoma (Figure 2D); CD20 (left, tumor cells positive) and CD3 (right, tumor cells negative) in B-cell lymphoma (Figure 2D). Scale bar, 100 um.
Figure 2 with 2 supplements
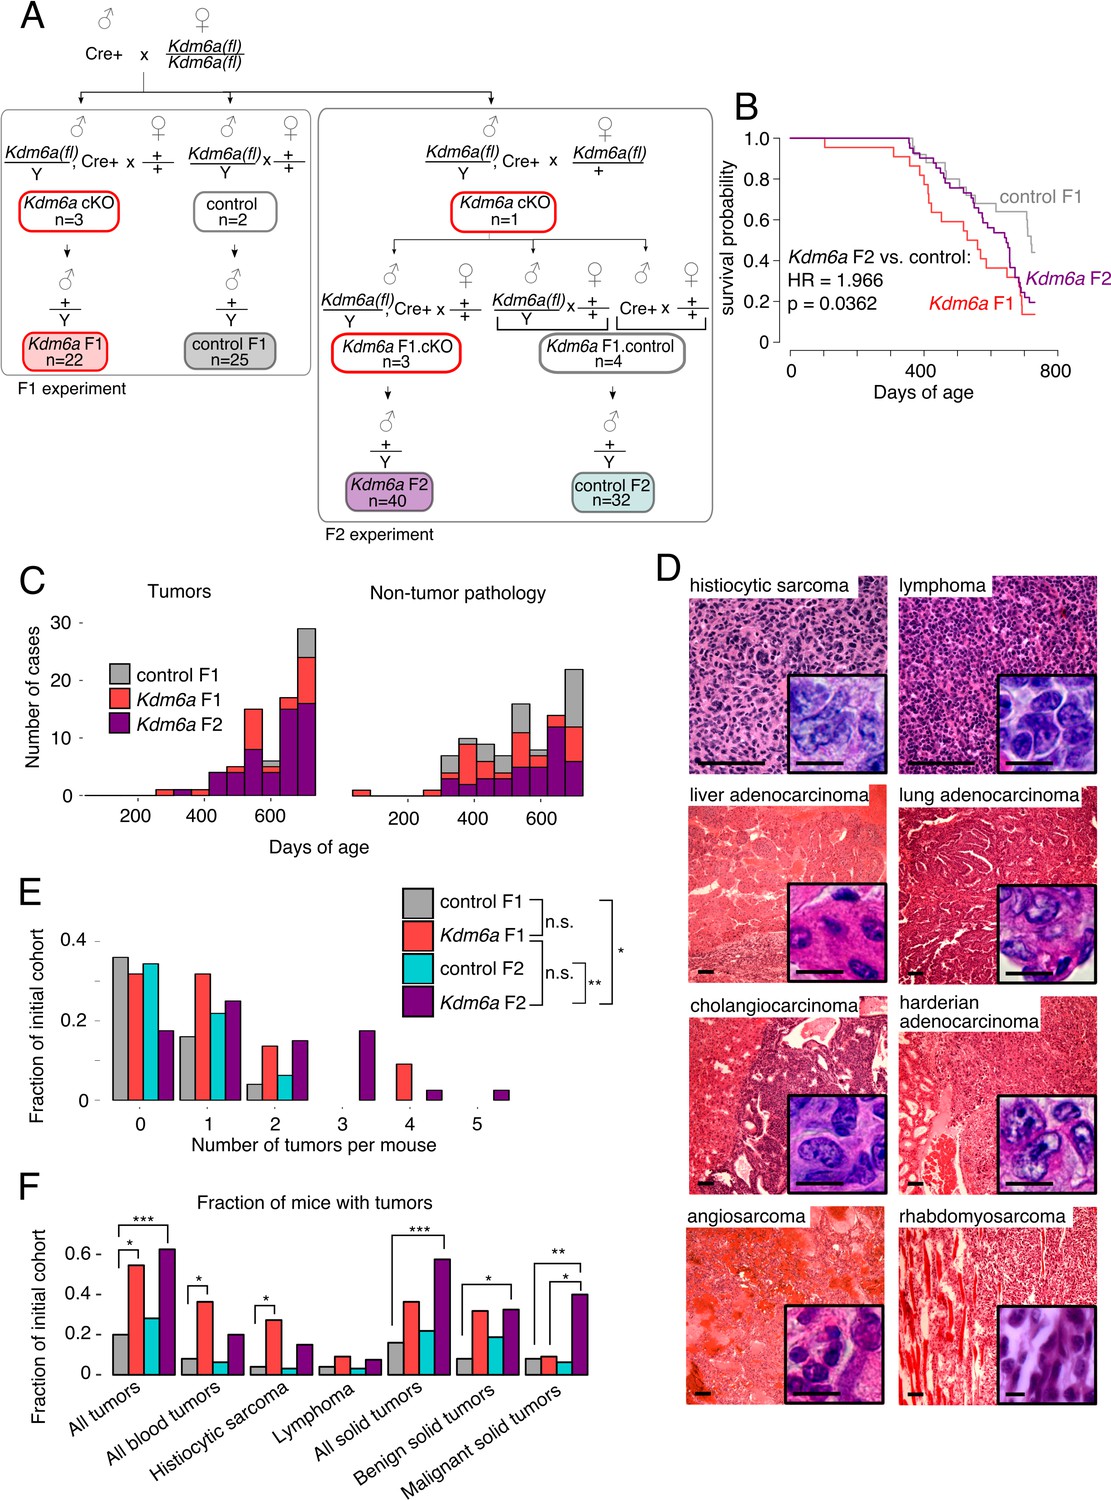
Reduced lifespan and increased tumor incidence in Kdm6a F2s.
(A) Cross for Kdm6a F2s and control F2s. The Kdm6a cKO male used in this experiment was littermate to the 3 Kdm6a cKO and two control males used in the F1 experiment. Control F2s, combined progeny of Cre-only or only Kdm6a(fl)-only F1s. (B) Survival curve for Kdm6a F1s, control F1s, and Kdm6a F2s. Hazard ratio and p-value calculated by a Cox proportional hazards model. (C) Raw counts of tumors (p=3.45e-9) and non-tumor phenotypes (p=0.13) in control F1s, Kdm6a F1s, and Kdm6a F2s at necropsy (p-values, Kdm6a F2s vs. control F1s, one-sample test of proportions). (D) H&E staining of representative tumors in Kdm6a F2s. Scale bar, 100 um (large images), 10 um (insets). (E) Tumor count per individual at necropsy. *p<0.05, **p<0.01, Fisher’s exact test. (F) Fraction of mice with tumors. *p<0.05, **p<0.01, ***p<0.001, Fisher’s exact test. See Figure 2—source data 1.
-
Figure 2—source data 1
Survival and cancer phenotype of Kdm6a F2s.
- https://doi.org/10.7554/eLife.39380.018
-
Figure 2—source data 2
All tumors identified in F1 and F2 cohorts.
Counts represent total tumors including multiple tumors per mouse. Tumor rate (tumors/mouse) in parentheses. Kdm6a F2.controlA mice generated from a Cre-only sire; Kdm6a F2.controlB mice generated from a Kdm6a(fl)-only sire.
- https://doi.org/10.7554/eLife.39380.019
Figure 2—figure supplement 1
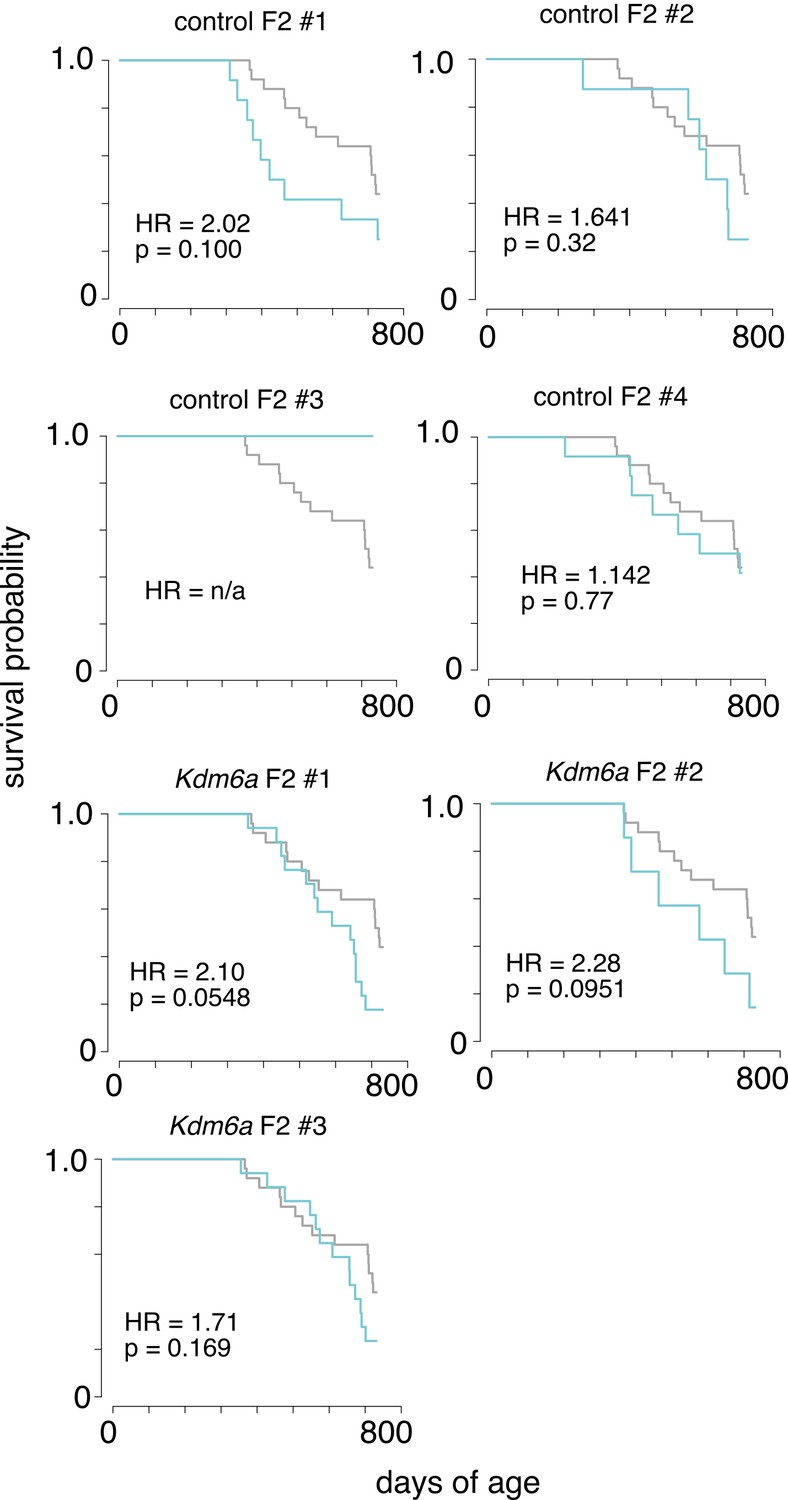
Survival of F2s from individual sires.
Each plot shows survival of F2 offspring from an individual Kdm6a F1 control or Kdm6a male (blue), as shown in Figure 3, plotted with survival data from control F1s (grey). Kdm6a F1 control male sires #1 and #2 carried the Kdm6a(fl) allele without the Ddx4-Cre transgene. Kdm6a F1 control male sires #3 and #4 carried the Ddx4-Cre transgene without the Kdm6a(fl) allele. HR, hazard ratio. p-values calculated using a Cox proportional hazards model.
Figure 2—figure supplement 2
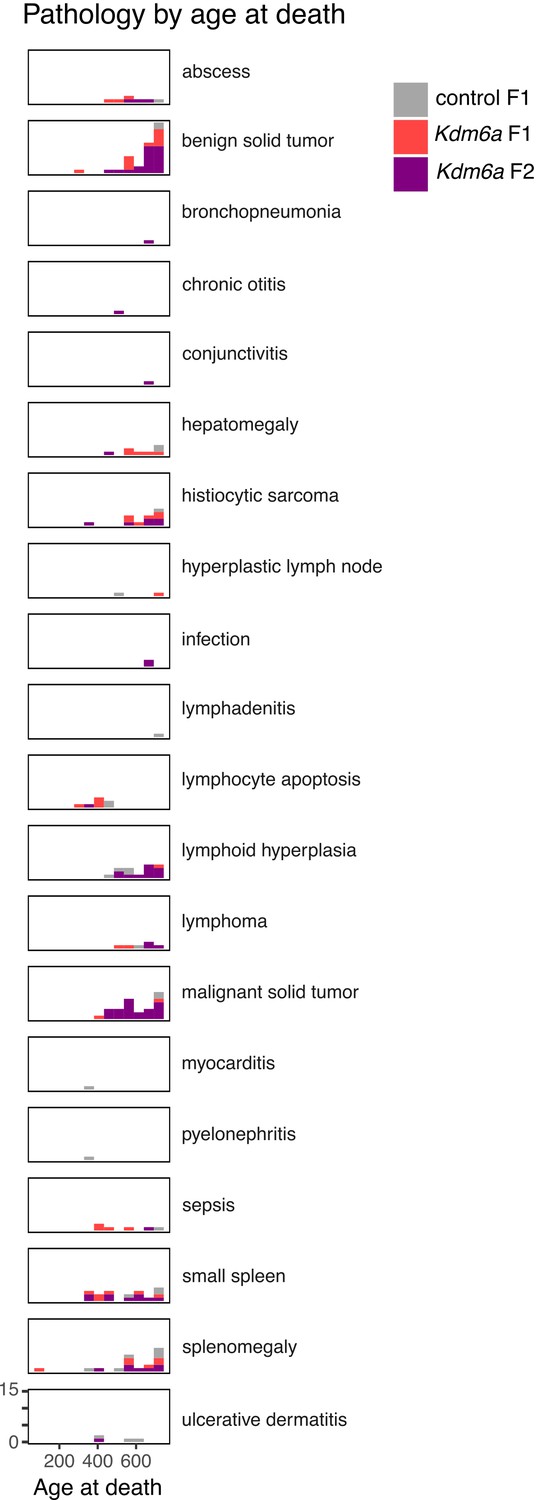
Counts of gross and histopathological diagnoses at necropsy for Kdm6a F1s, control F1s, and Kdm6a F2s.
https://doi.org/10.7554/eLife.39380.017
Figure 3 with 8 supplements
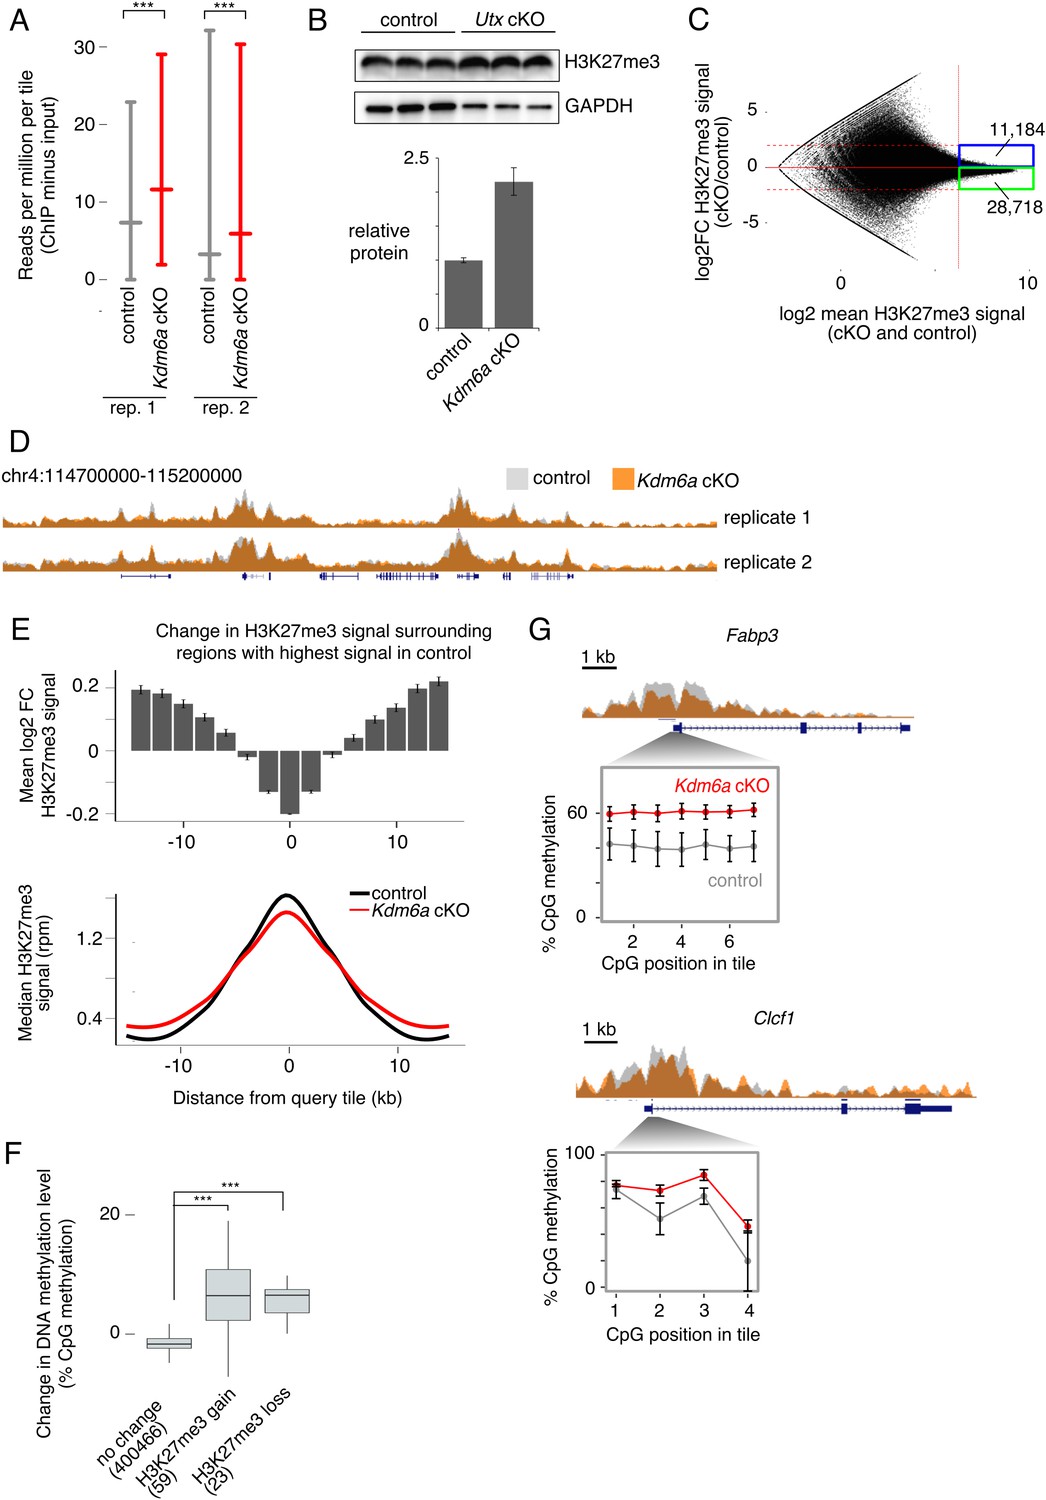
Redistribution of H3K27me3 in Kdm6a cKO germ cells.
(A) Median and interquartile range (IQR) for H3K27me3 signal in 2 kb tiles for each of two sperm ChIP-seq replicates. ***p<2.2×10⁻¹⁶, Mann-Whitney U test. (B) Western blot for H3K27me3 in germ cell-enriched testis samples from control and Kdm6a cKO mice. Bottom plot shows quantitation relative to GAPDH. Image is representative of two biological replicates. (C) MA plot of change in H3K27me3 signal vs. mean signal in Kdm6a cKO vs. control sperm, based on the mean of two biological replicates. Dashed horizontal lines, log2 fold change (log2FC) =±2. (D) Browser tracks of H3K27me3 signal in Kdm6a cKO and control sperm. (E) Top, mean log2FC in H3K27me3 signal for the 5% of tiles with greatest H3K27me3 signal in sperm and for surrounding tiles, based on mean values from two biological replicates. Error bars,±SE. Bottom, metagene of median H3K27me3 signal for the same set of tiles. (F) Change in DNA methylation level in Kdm6a cKO vs. control sperm for regions where log2FC H3K27me3 > 0.5 (‘H3K27me3 gain’), log2FC H3K27me3 < −0.5 (‘H3K27me3 loss’), or with no change in H3K27me3 (−0.5 < logFC < 0.5). Numbers of tiles in each category are shown. Horizontal bars, median; boxes, IQR. ***p<10−11, Mann-Whitney U test. (G) ChIP and RRBS data at two regions with altered H3K27me3 and DNA hypermethylation in sperm. Error bars, SEM of three replicates. See Figure 3—source data 2.
-
Figure 3—source data 1
ChIP-seq libraries.
- https://doi.org/10.7554/eLife.39380.029
-
Figure 3—source data 2
H3K27me3 in Kdm6a cKO sperm.
- https://doi.org/10.7554/eLife.39380.030
Figure 3—figure supplement 1
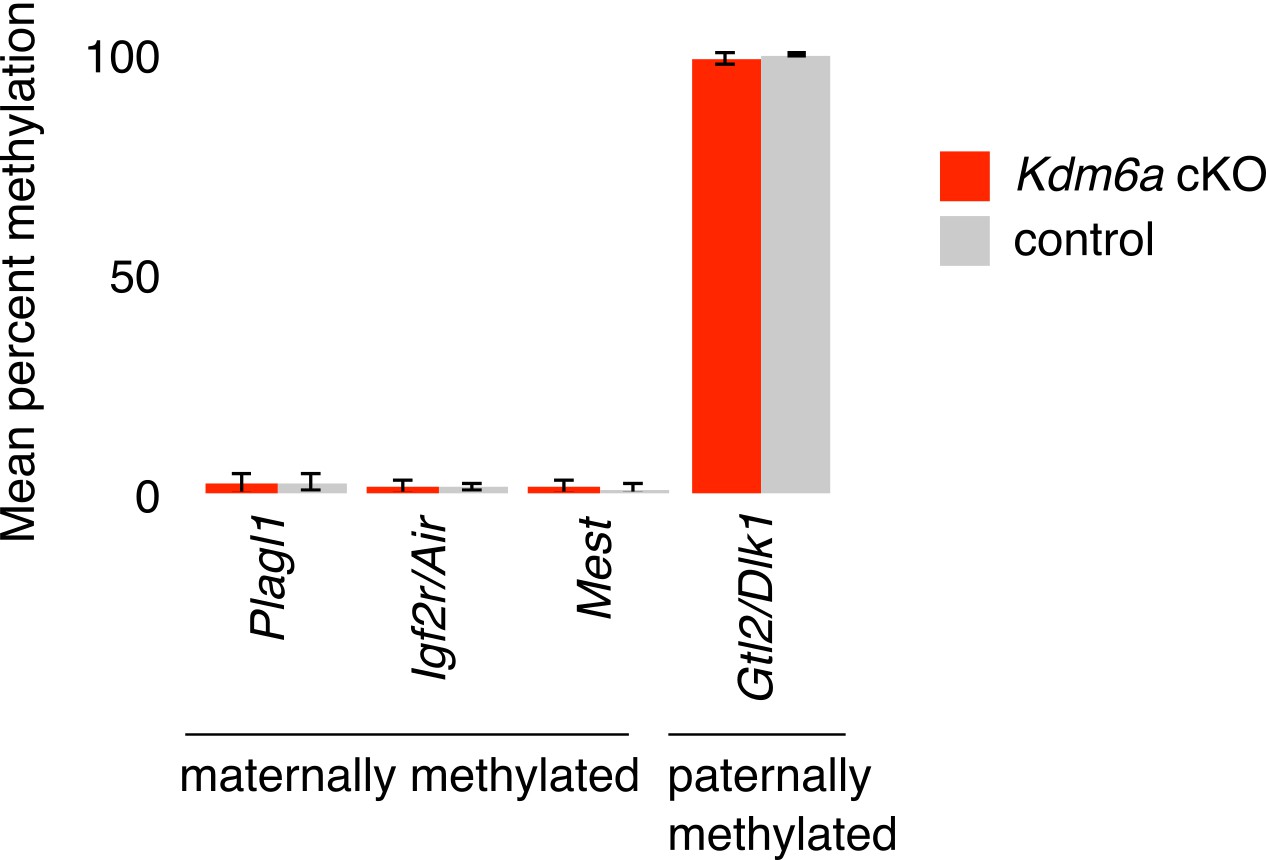
Assay for purity of isolated epididymal sperm populations.
Mean percent methylation in sperm at three maternally methylated and one paternally methylated imprinted region. N = 3 Kdm6a cKO and three control males. Error bars represent SD across individuals.
Figure 3—figure supplement 2

Correlations between individual datasets for genome-wide H3K27me3 ChIP-seq tiles.
https://doi.org/10.7554/eLife.39380.022
Figure 3—figure supplement 3
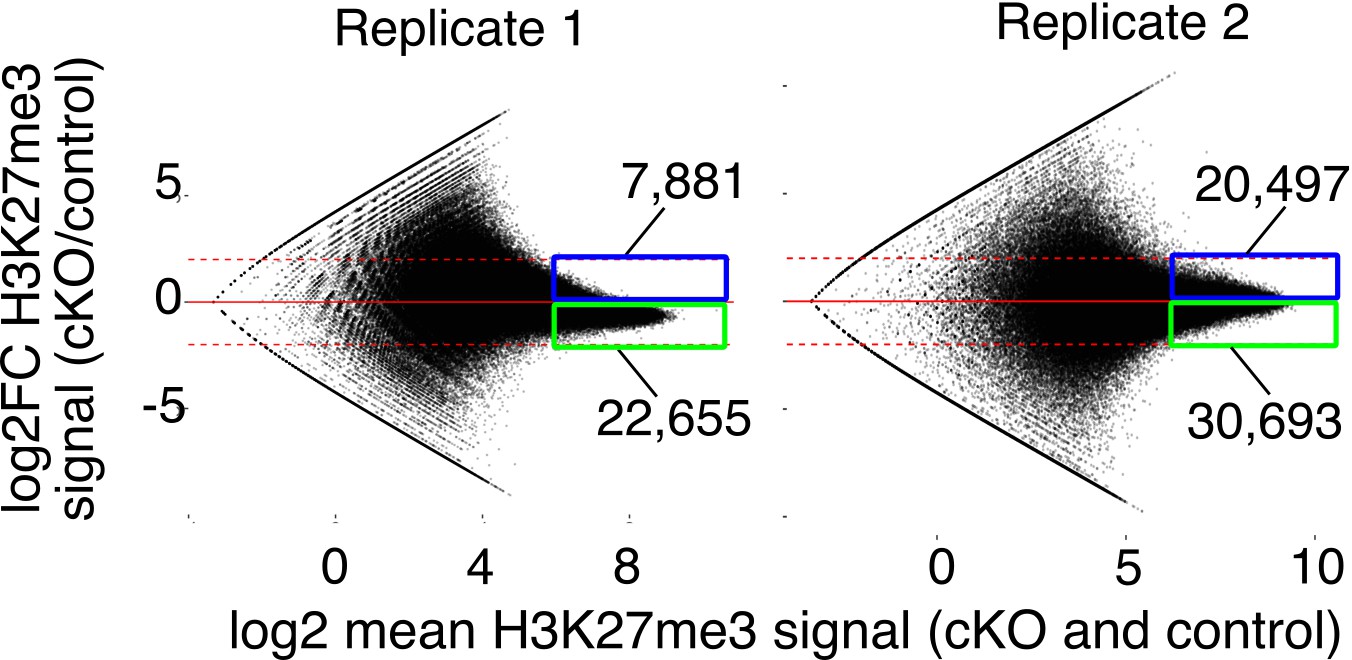
MA plots of change in H3K27me3 signal vs.mean signal in Kdm6a cKO vs. control for individual sperm replicates.
Dashed horizontal lines, log2FC ± 2.
Figure 3—figure supplement 4
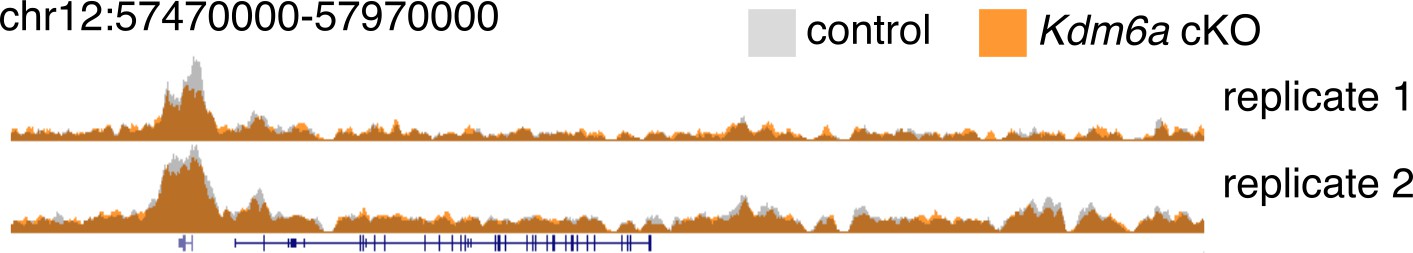
Representative ChIP-seq browser tracks for control and Kdm6a cKO sperm.
https://doi.org/10.7554/eLife.39380.024
Figure 3—figure supplement 5
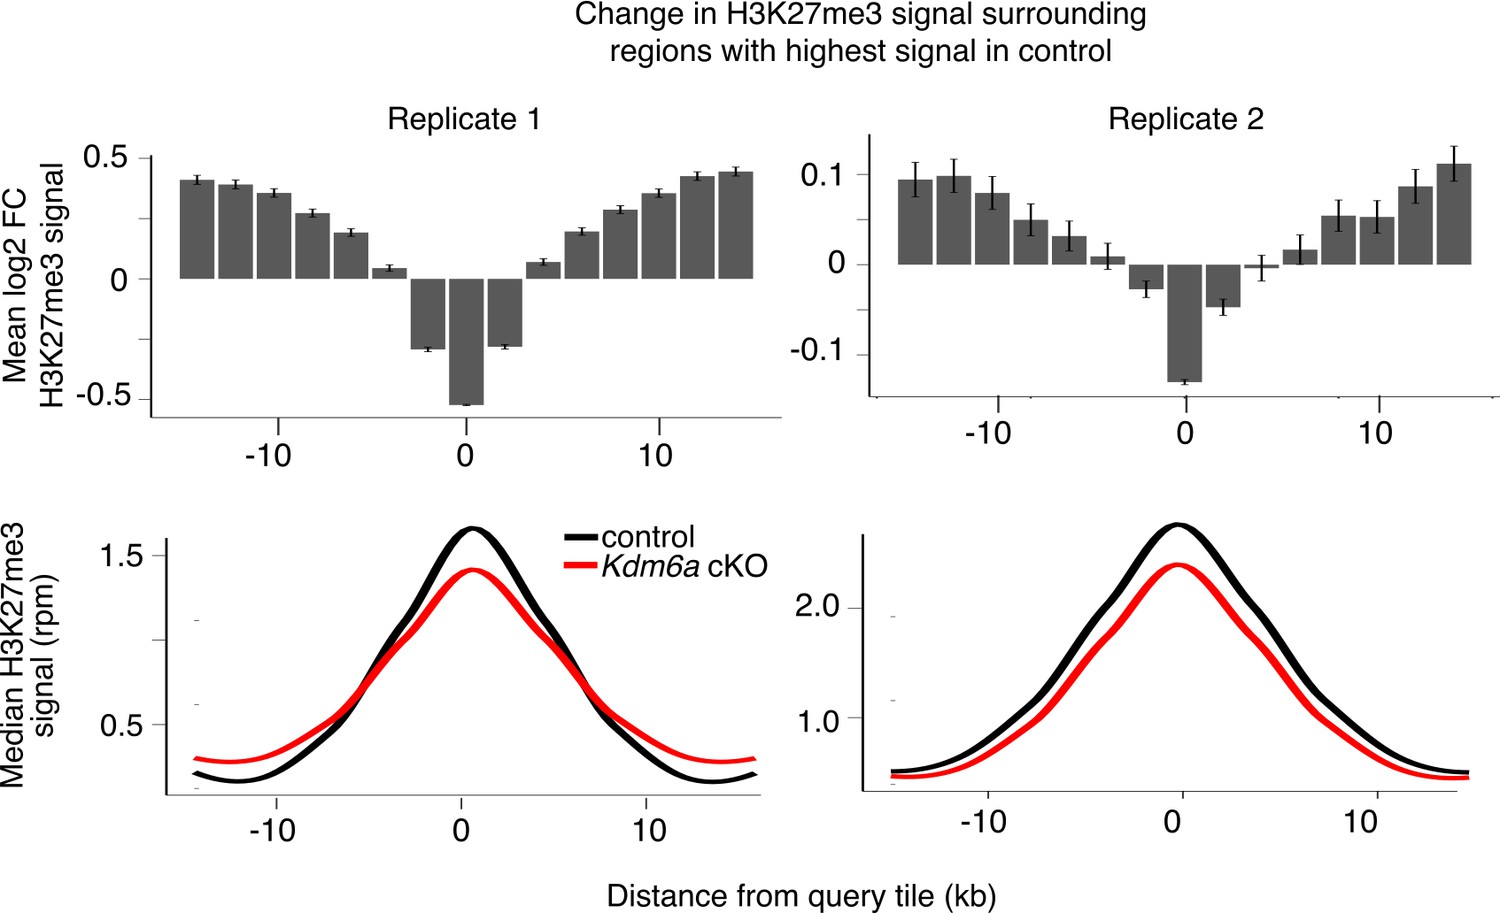
Analysis of H3K27me3 changes in each sperm replicate.
Top, mean log2FC in H3K27me3 signal for the 5% of tiles with greatest H3K27me3 signal and for surrounding tiles for individual sperm ChIP-seq replicates. Bottom, metagene of median H3K27me3 signal for the same set of tiles.
Figure 3—figure supplement 6
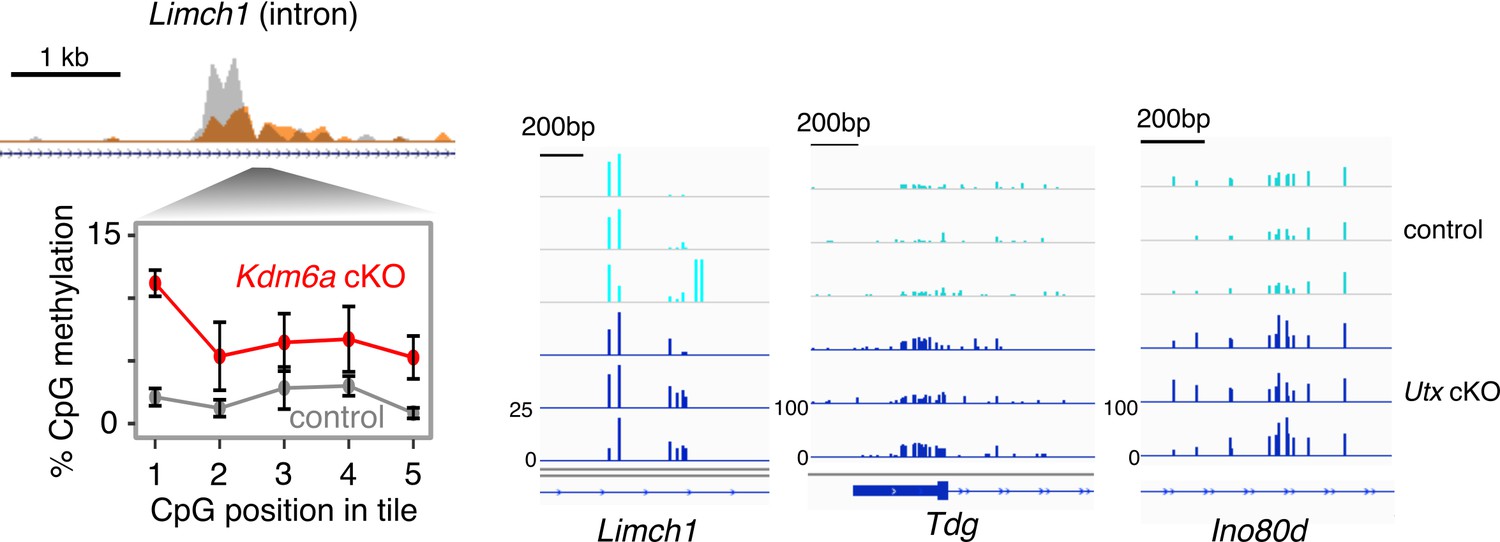
Sample loci showing gain of DNA methylation in Utx cKO sperm.
Left, representative ChIP-seq and RRBS data at a region with significant change in H3K27me3 and gain of DNA methylation. Error bars, SEM of three replicates. Right, genome browser tracks showing DNA methylation data for the same region (Limch1 intron) and two additional regions (Tdg promoter and Ino80d intron).
Figure 3—figure supplement 7

Reanalysis of DNA methylation changes after exchanging data between replicates.
Change in DNA methylation level in Kdm6a cKO vs.control sperm for regions where log2FC H3K27me3 > 0.5 (‘H3K27me3 gain’), log2FC H3K27me3 < −0.5 (‘H3K27me3 loss’), or with no change in H3K27me3 (−0.5 < logFC < 0.5) when exchanging the cKO and control data between replicates. Numbers of tiles in each category are shown. 80% of regions with increased and 83% of regions with decreased H3K27me3 signal in our original analysis were also identified in this analysis. Horizontal bars, median; boxes, IQR. ***p<10−13, Mann-Whitney U test.
Figure 3—figure supplement 8
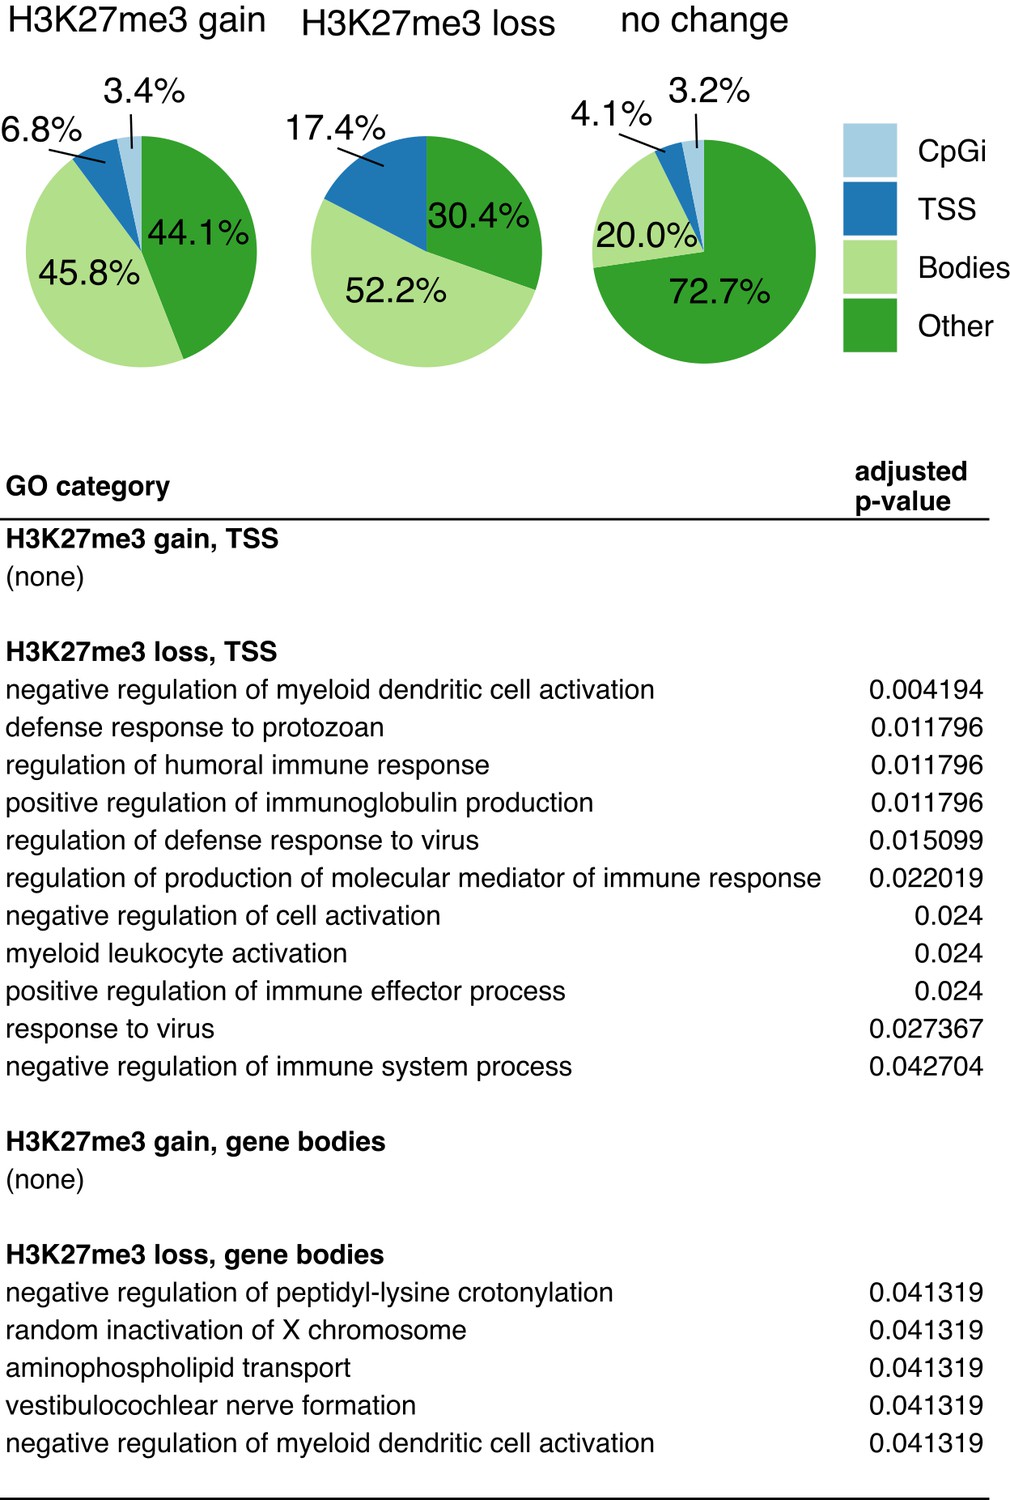
Characteristics of regions exhibiting reproducible changes in H3K27me3 in Utx cKO compared to control sperm.
Characterization of regions classified as ‘H3K27me3 gain’ (log2FC > 0.5), ‘H3K27me3 loss’ (log2FC < 0.5), or ‘no change’ (all other regions). Top, region distribution relative to CpG islands, TSS, and gene bodies. Bottom, all enriched gene ontology categories for regions associated with TSS or gene bodies.
Figure 4 with 5 supplements
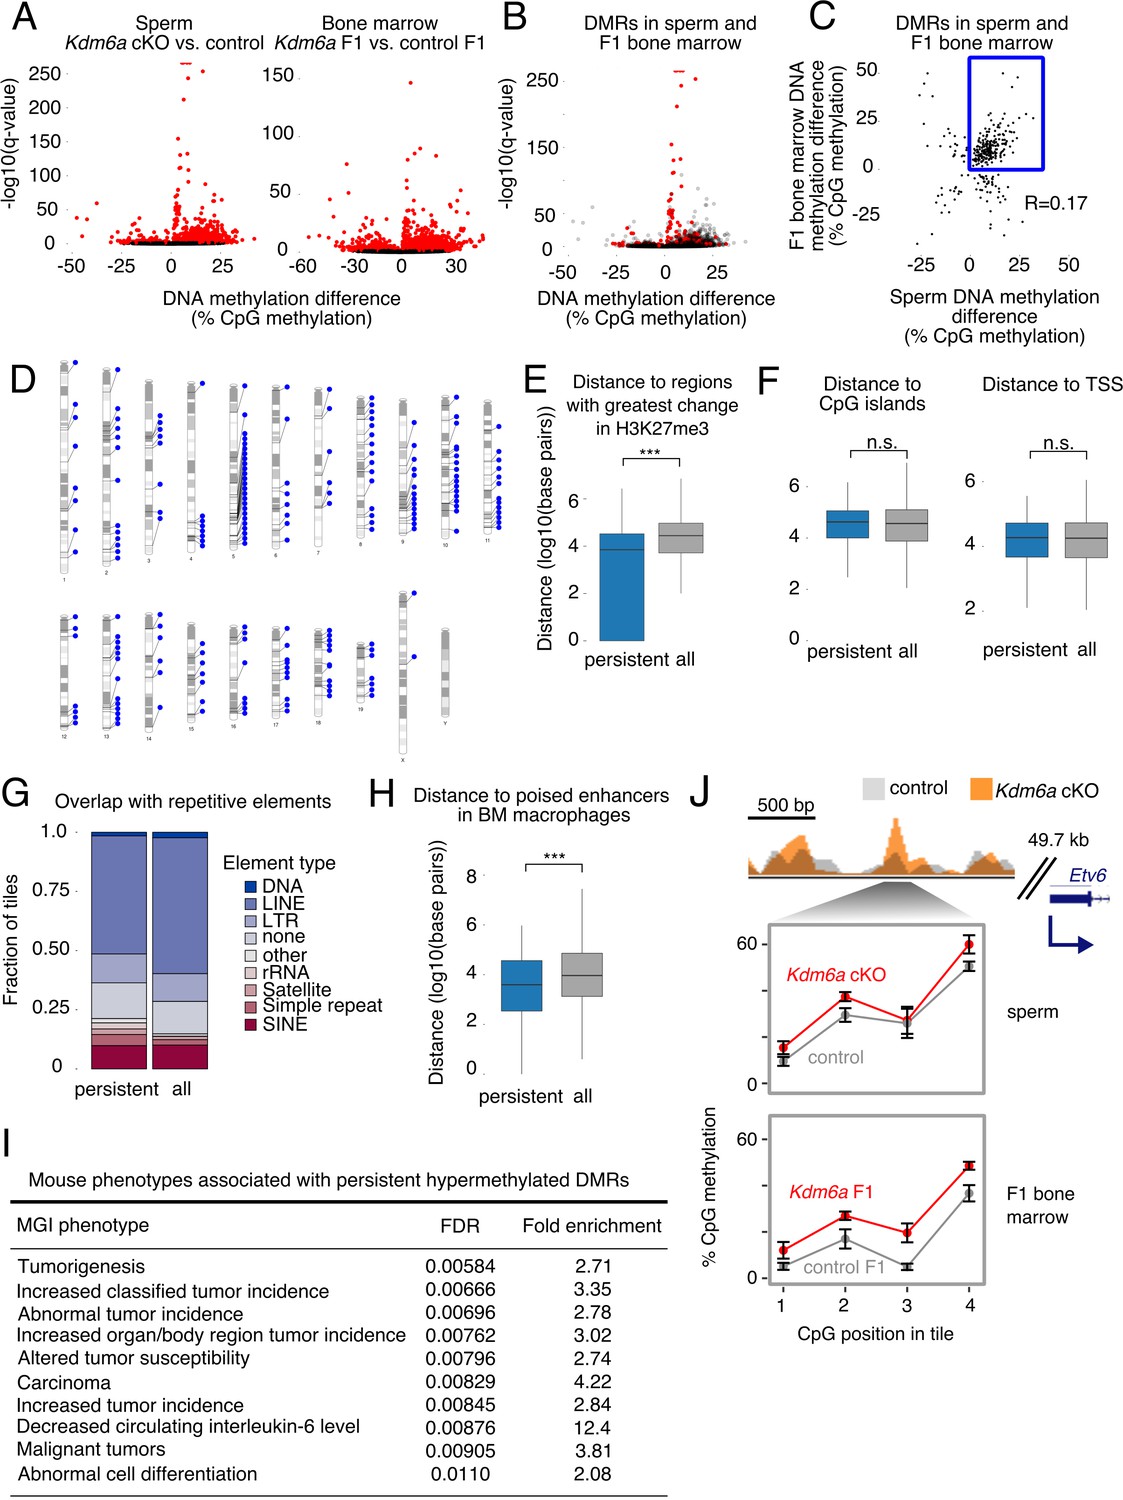
Persistent DMRs are associated with altered H3K27me3 and enhancer regions.
(A) Left, differentially methylated regions (DMRs) in sperm. Right, DMRs in F1 bone marrow. Red, false discovery rate (FDR) < 0.05. (B) Sperm volcano plot from (A); DMRs with FDR < 0.05 in both sperm and F1 bone marrow are in red. (C) Magnitude of DNA methylation difference (Kdm6a cKO vs. control or Kdm6a F1 vs. control F1) for the 299 DMRs shared between sperm and F1 bone marrow. Box, persistent DMRs. (D) Distribution of persistent DMRs in the mouse genome. (E) Distance from persistent DMRs to the 25% of regions with greatest change in H3K27me3 in sperm. ‘All’ refers to the complete set of tiles covered by RRBS. ***p<0.001, Mann-Whitney U test. (F) Left, distance to CpG islands. Right, distance to transcription start sites (TSS). (G) Fraction of DMRs overlapping repetitive elements. (H) Distance to poised enhancers in sorted bone marrow macrophages. ***p<0.001, Mann-Whitney U test. (I) Top 10 mouse phenotypes associated with persistent DMRs. (J) Representative persistent DMR in the enhancer of a cancer-associated gene (Etv6). Error bars, SEM of three replicates. See Figure 4—source data 1.
-
Figure 4—source data 1
DNA methylation in Kdm6a cKO sperm and Kdm6a F1 bone marrow.
- https://doi.org/10.7554/eLife.39380.037
-
Figure 4—source data 2
RRBS libraries.
- https://doi.org/10.7554/eLife.39380.038
-
Figure 4—source data 3
DMRs shared between Kdm6a cKO sperm and Kdm6a F1 bone marrow.
- https://doi.org/10.7554/eLife.39380.039
-
Figure 4—source data 4
Genes within 1 kilobase of persistent DMRs.
- https://doi.org/10.7554/eLife.39380.040
Figure 4—figure supplement 1
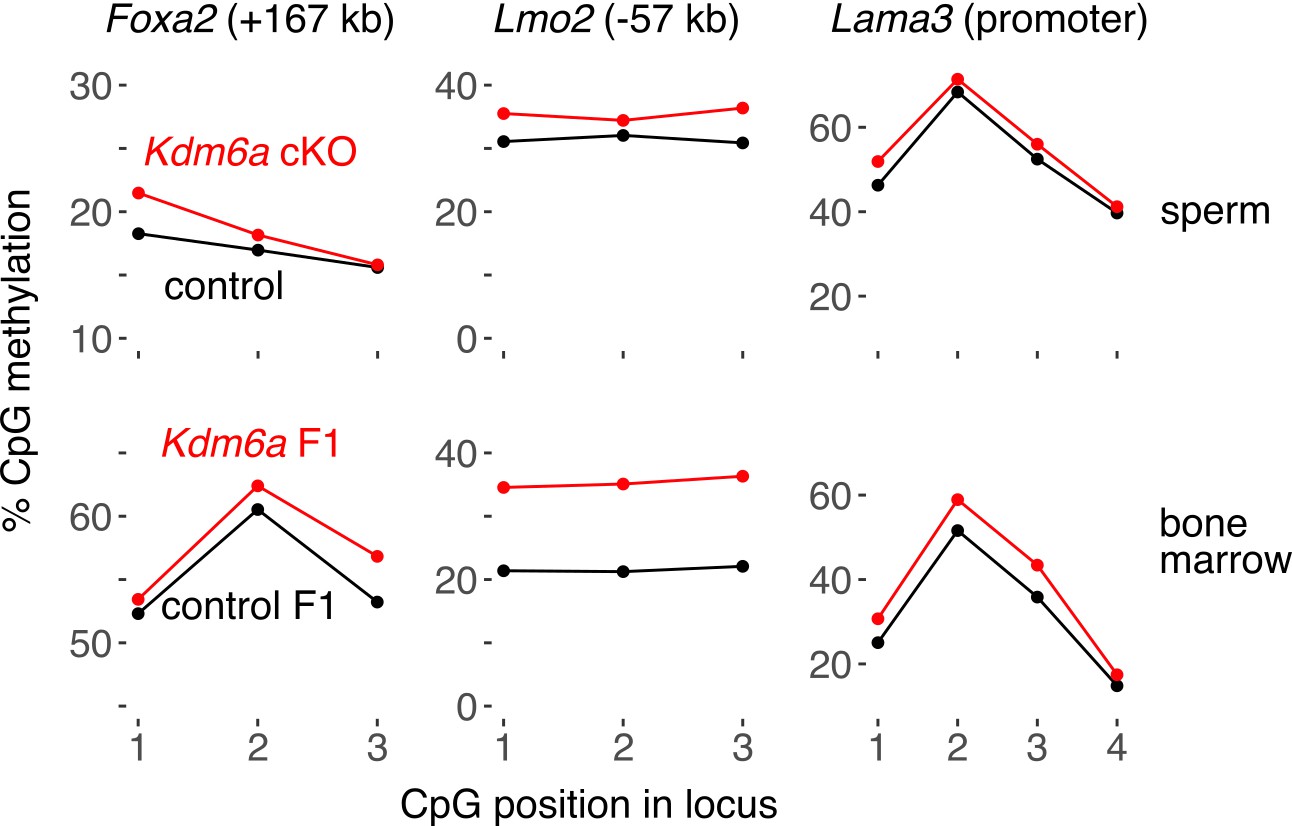
Representative pyrosequencing data at three persistent DMRs, including two tumor-associated enhancers (Foxa2 and Lmo2) and one promoter (Lama3).
https://doi.org/10.7554/eLife.39380.032
Figure 4—figure supplement 2

Distance relationships between persistent DMRs and various genomic features.
(A) Distance to maternally- or paternally-expressed imprinted regions, as defined in Babak et al. (2015). (B) Distance to nearest transcription start site (TSS) of genes expressed in wild type round spermatids (TPM >5) (left) or with transcripts present in sperm (TPM >5) (right). (C) Distance to nearest poised enhancer in wild type bone marrow (ENCODE data) and in spermatids. (D) Distance to nearest active enhancer in bone marrow macrophages, bone marrow, and spermatids. *p<0.05, **p<0.01, ***p<0.001, Mann-Whitney U test.
Figure 4—figure supplement 3
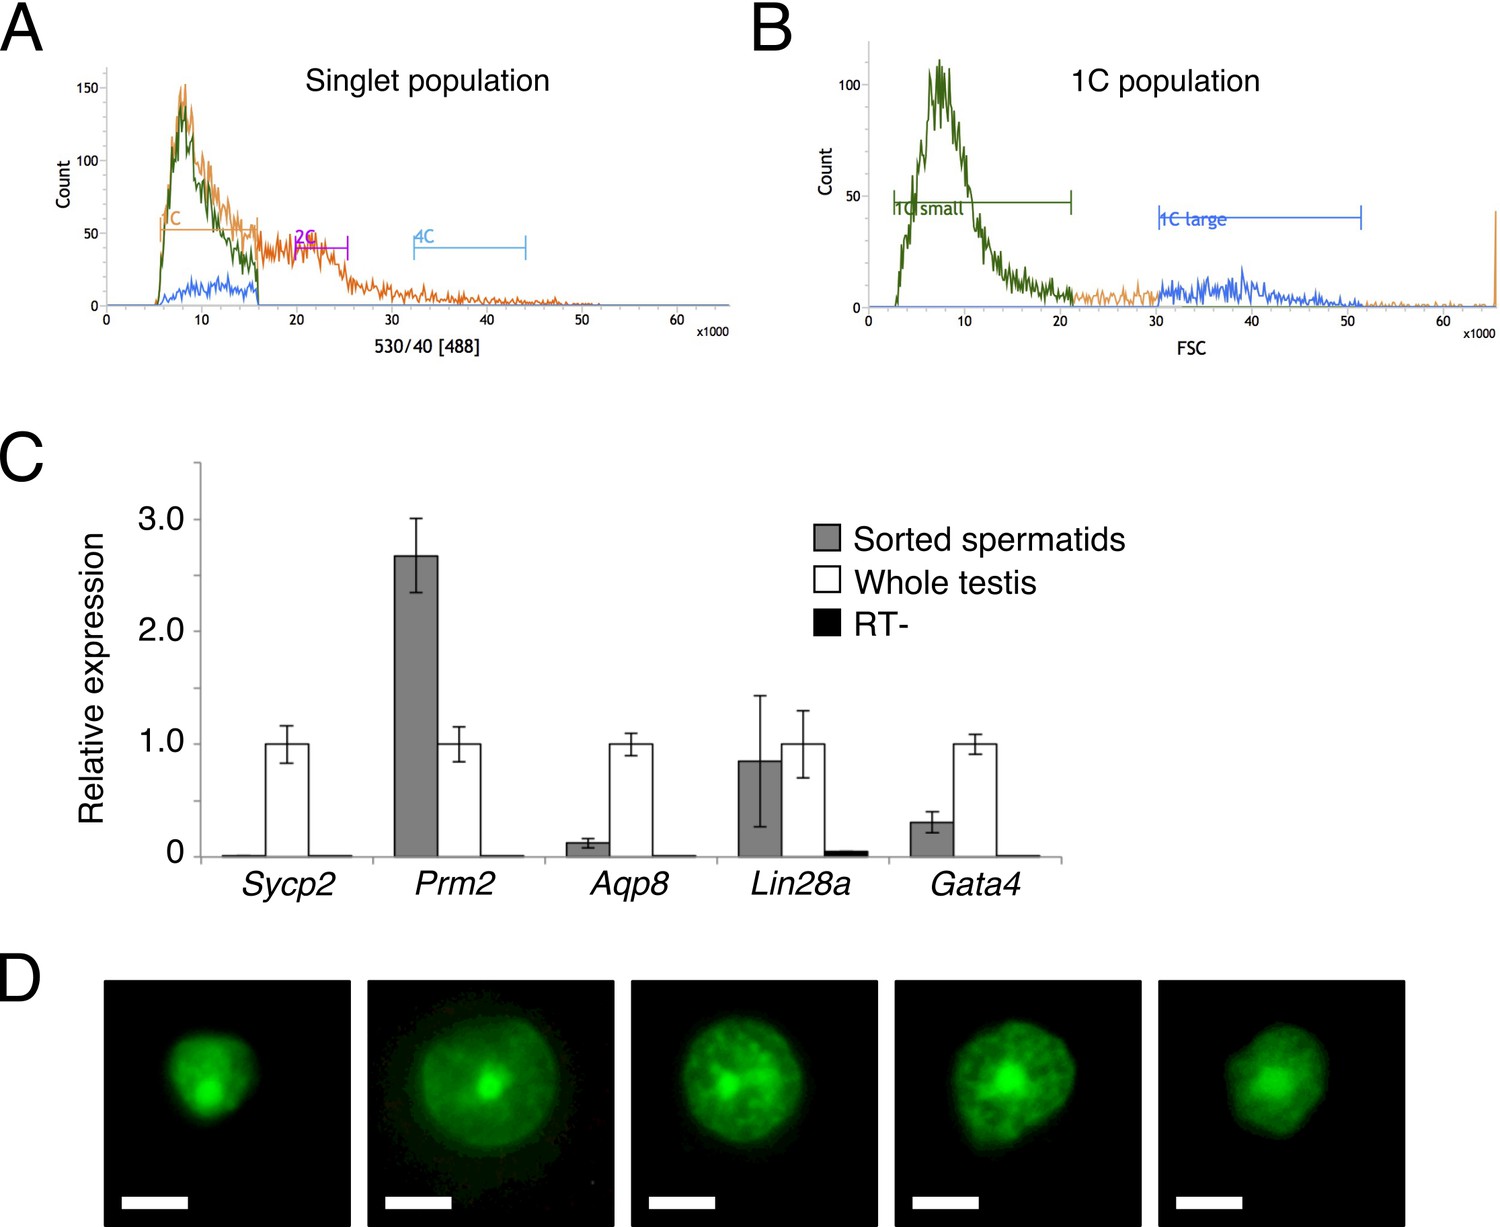
Sorting of round spermatids by flow cytometry.
(A) Green (530 nm) fluorescence profiles of dissociated testis cells stained with DyeCycle Green, a vital nucleic acid dye. 1C (haploid, spermatids), 2C (diploid, stem cells and secondary spermatocytes) and 4C (tetraploid, primary spermatocytes and mitotic stem cells) populations are marked. Profile for all cells is in orange, 1C 'small' (elongating spermatids, back-gated from plot in B) in green, and 1C 'large' (round spermatids, back-gated from plot in B) in blue. (B) Forward scatter profile for 1C cells gated in A. ‘1C large’ population represents round spermatids. (C) RT-qPCR for sorted round spermatids compared to whole testes. Sycp2 marks spermatocytes, Prm2 marks round and elongating spermatids, Aqp8 marks elongating spermatids only, Lin28a marks spermtogonial stem cells, and Gata4 marks testis somatic cells. Expression is shown relative to whole testis, with Actb as an internal control. Error bars represent SD for three technical replicates. (D) Representatitve 100x images of spermatids stained with DyeCycle Green and sorted directly onto a slide. Scale bars, 5 um.
Figure 4—figure supplement 4
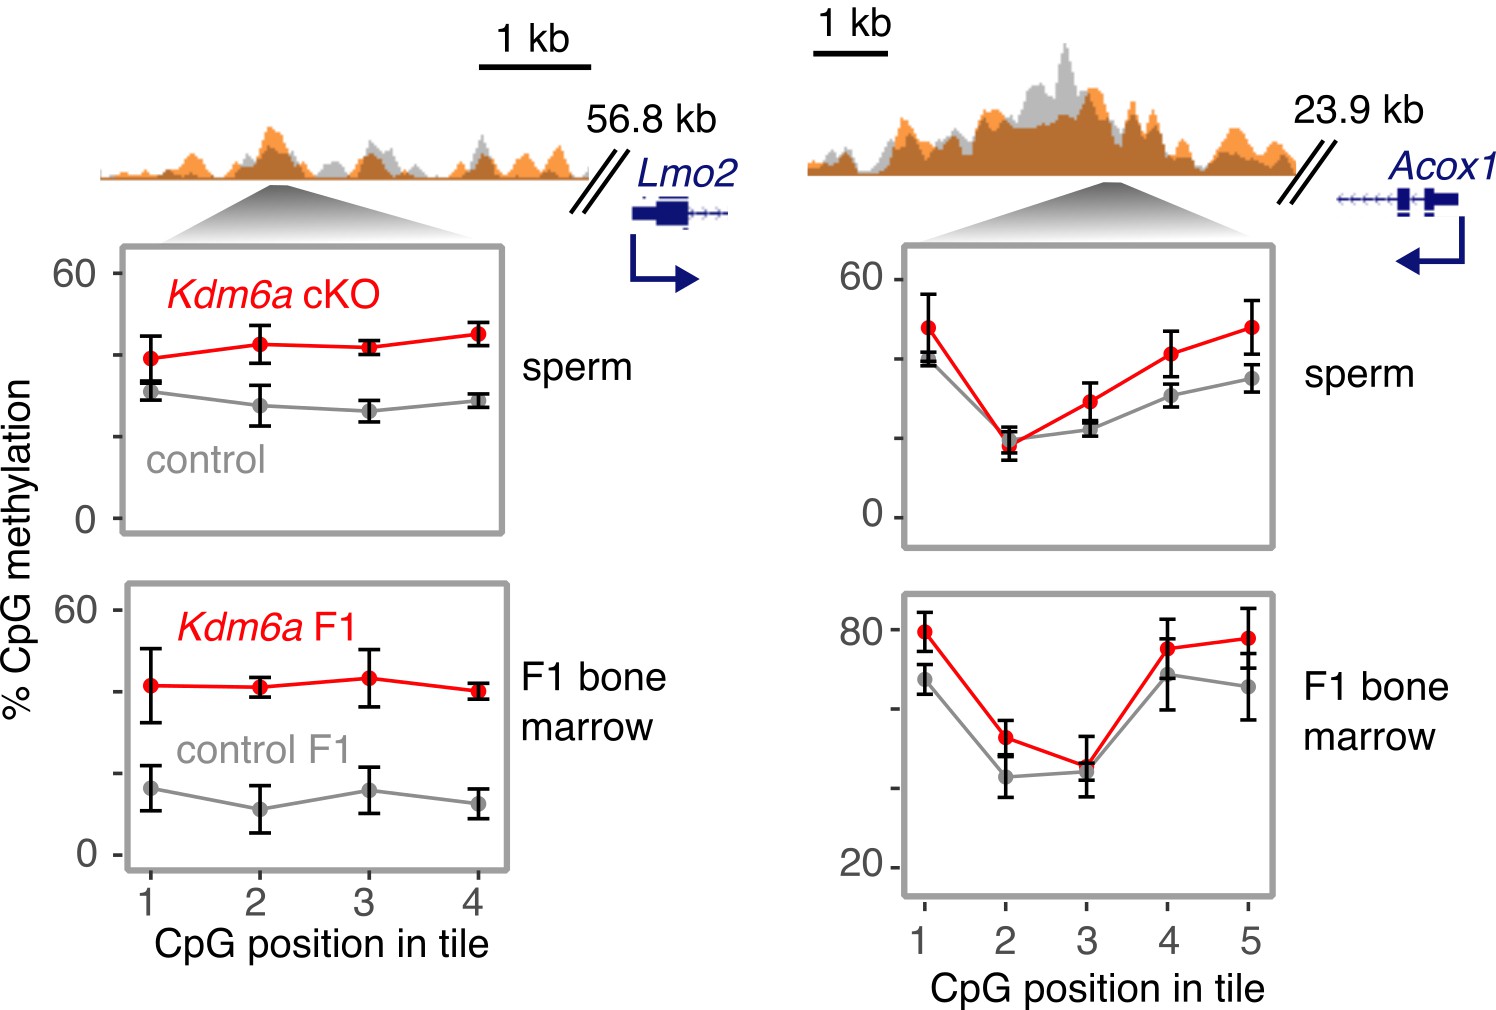
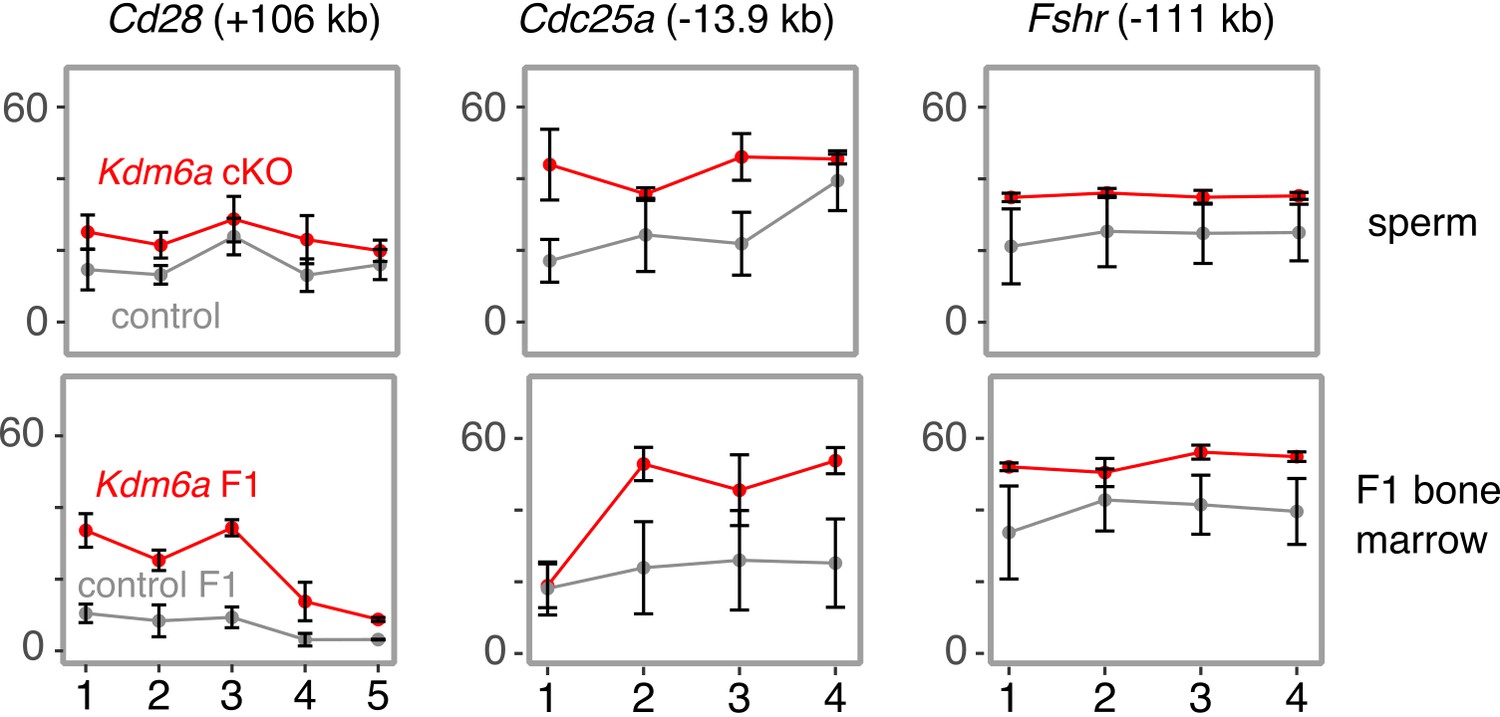
Additional examples of DNA methylation gains in sperm and F1 bone marrow.
H3K27me3 ChIP-seq and RRBS data at representative persistent DMRs overlapping enhancers of cancer-associated genes. Error bars, SEM of three replicates.
Figure 4—figure supplement 5
Additional examples of DNA methylation gains in sperm and F1 bone marrow in enhancers associated with tumorigenesis.
RRBS data at additional persistent DMRs overlapping enhancers of cancer-associated genes. Error bars, SEM of three replicates.
Figure 5
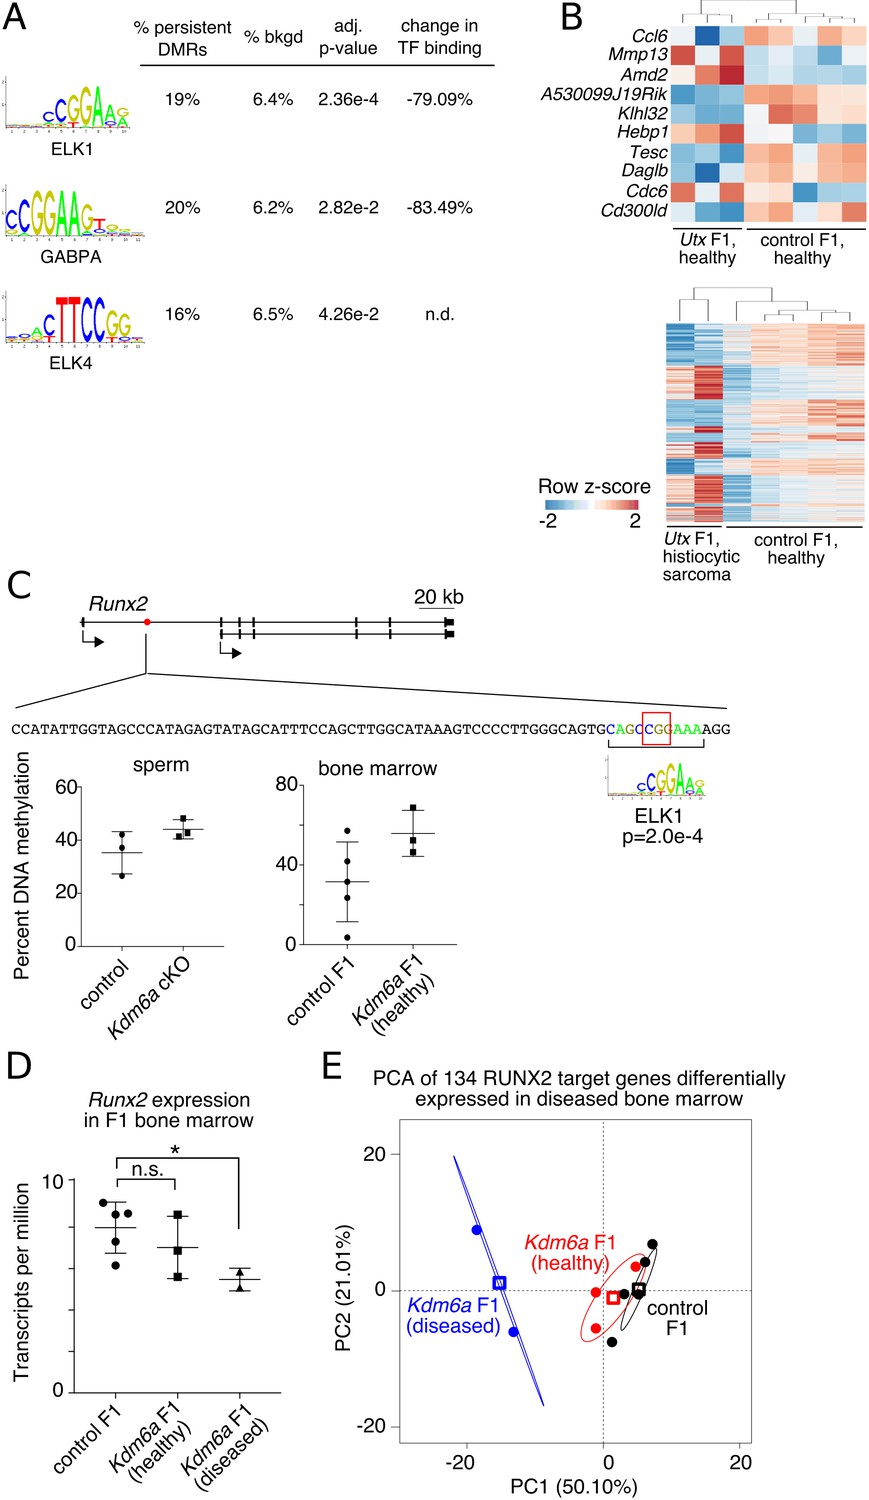
Persistent DMRs affect F1 bone marrow expression profiles.
(A) Transcription factor (TF) binding sites enriched in persistent DMRs. ‘Adjusted p-value’: Bonferroni-corrected AME p-value. ‘% persistent DMRs’, ‘% background’: percentage of tiles containing the TF binding site. ‘Change in binding’, relative enrichment of mCpGs in bisulfite-SELEX data from Yin et al. (2017). (B) Genes differentially expressed in healthy Kdm6a F1 (top) or diseased Kdm6a F1 (bottom) vs. control F1 bone marrow. (C) Top, gene model of Runx2 with location of a persistent DMR in the first intron (red circle). Middle, sequence of the DMR including ELK1 binding site and affected CpG (red box). Bottom, RRBS DNA methylation levels at the boxed CpG in sperm and F1 bone marrow. (D) Expression of Runx2 in F1 bone marrow. *p<0.05, Welch’s t-test. (E) Principal component analysis of 134 differentially expressed RUNX2 target genes. Circles, individual samples; open squares, centroid; ellipses, 95% confidence interval. See Figure 5—source data 1.
-
Figure 5—source data 1
Runx2 expression and regulation in Kdm6a F1 bone marrow.
- https://doi.org/10.7554/eLife.39380.042
Figure 6
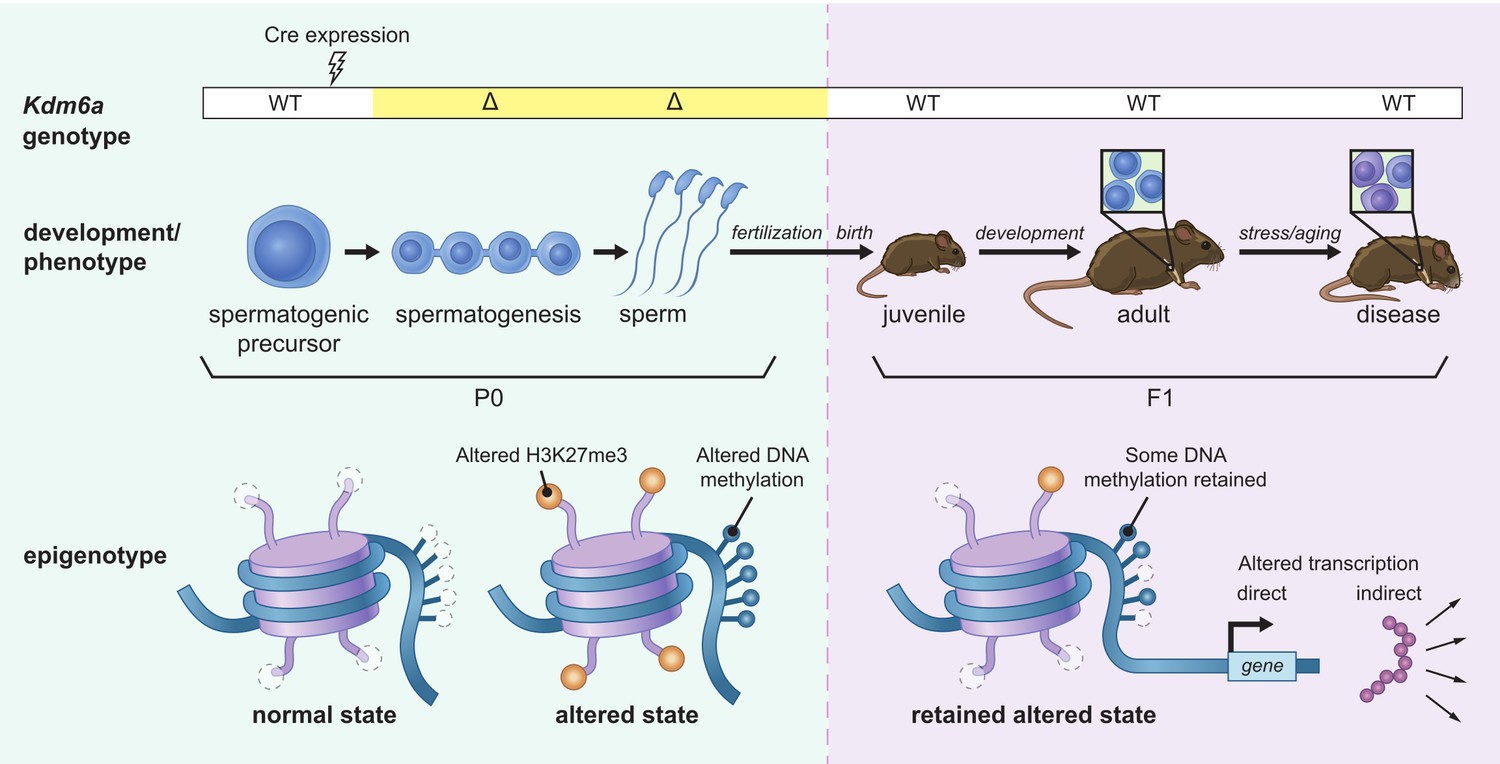
Model for intergenerational epigenetic inheritance following deletion of Kdm6a in the male germ line.
Kdm6a excision occurs in early spermatogenic precursors, resulting in genome-wide changes in H3K27me3 distribution. Altered H3K27me3 distribution biases nearby regions toward gain of DNA methylation. Both H3K27me3 and DNA methylation changes are retained in mature sperm. At fertilization, H3K27me3 and most DNA methylation changes are reset, but some DNA methylation gains persist. DNA methylation gains influence expression of nearby genes during development in genetically wild type F1 offspring. Effects on phenotype occur when downstream gene regulatory circuits are subjected to environmental or aging-associated stress.
Tables
Key resources table
| Reagent type (species) or resource | Designation | Source or reference | Identifiers | Additional information |
|---|---|---|---|---|
| Gene (Mus musculus) | Kdm6a | NA | MGI:1095419 | Also called Utx |
| Genetic reagent (Mus musculus) | Ddx4-Cre | Hu et al., 2013 | B6-Ddx4tm1.1(cre/mOrange)Dcp RRID:MGI:5554603 | Also called Mvh-Cre |
| Genetic reagent (Mus musculus) | Kdm6a(fl) | Welstead et al., 2012 | B6;129S4-Kdm6atm1c(EUCOMM)Jae/J RRID:IMSR_JAX:021926) | |
| Antibody | Mouse monoclonal anti-H3K27me3 | Abcam | ab6002 RRID:AB_305237 | 1:1000 |
| Antibody | Rabbit polyclonal anti-H3K27me3 | Millipore Sigma | 07–449 RRID:AB_310624 | 1:1000 |
| Antibody | Rabbit polyclonal anti-H3K4me1 | Abcam | ab8895 RRID:AB_306847 | 1:1000 |
| Antibody | Rabbit polyclonal anti-H3K27ac | Abcam | ab4729 RRID:AB_2118291 | 1:1000 |
| Antibody | Mouse monoclonal anti-Gapdh | Santa Cruz Biotechnology | sc-32233 RRID:AB_627679 | 1:1000 |
| Antibody | Rat monoclonal anti-F4/80 | Serotec | MCA497GA RRID:AB_323806 | clone CI:A3-1; 1:5000 |
| Antibody | Rabbit monoclonal anti-VEGF-A | Abcam | ab52917 RRID:AB_883427 | clone EP1176Y; 1:100 |
| Antibody | Rabbit monoclonal anti-ERG | Abcam | ab133264 RRID:AB_11156852 | 1:250 |
| Antibody | Rabbit monoclonal anti-TTF-1 | Abcam | ab76013 RRID:AB_1310784 | 1:250 |
| Antibody | Rabbit polyclonal anti-GS | Abcam | ab73593 RRID:AB_2247588 | 1:1000 |
| Antibody | Mouse monoclonal anti-CD20 | Dako | M0755 RRID:AB_2282030 | clone L26; 1:500 |
| Antibody | Rabbit polyclonal anti-CD3 | Dako | A0452 RRID:AB_2335677 | clone F7.2.38; 1:250 |
| Sequence-based reagent | RT-qPCR primer, Actb-F | this paper | AGAAGGACTCCTATGTGGGTGA | |
| Sequence-based reagent | RT-qPCR primer, Actb-R | this paper | CATGATCTGGGTCATCTTTTCA | |
| Sequence-based reagent | RT-qPCR primer, Sycp2-F | this paper | AGTCTGAGCTGATGTTATCATA | |
| Sequence-based reagent | RT-qPCR primer, Sycp2-R | this paper | GAAGCAGAAGTAGAAGAGGC | |
| Sequence-based reagent | RT-qPCR primer, Prm2-F | this paper | GCTGCTCTCGTAAGAGGCTACA | |
| Sequence-based reagent | RT-qPCR primer, Prm2-R | this paper | AGTGATGGTGCCTCCTACATTT | |
| Sequence-based reagent | RT-qPCR primer, Aqp8-F | this paper | GGATGTCTATCGGTCATTGAG | |
| Sequence-based reagent | RT-qPCR primer, Aqp8-R | this paper | GAATTAGCAGCATGGTCTTGA | |
| Sequence-based reagent | RT-qPCR primer, Lin28a-F | this paper | TGGTGTGTTCTGTATTGGGAGT | |
| Sequence-based reagent | RT-qPCR primer, Lin28a-R | this paper | AGTTGTAGCACCTGTCTCCTTT | |
| Commercial assay or kit | Zymo ChIP Clean and Concentrator kit | Zymo Research | D5201 | |
| Commercial assay or kit | Accel-NGS 2S plus DNA library kit | Swift Biosciences | 21024 | |
| Commercial assay or kit | DNEasy Blood andTissue kit | Qiagen | 69504 | |
| Commercial assay or kit | Ovation RRBS Methyl-Seq System | NuGen | 0353 | |
| Commercial assay or kit | RNEasy Plus Mini kit | Qiagen | 74134 | |
| Commercial assay or kit | TruSeq RNA library prep kit | Illumina | RS-122–2001 | |
| Software, algorithm | R | R Core Team | RRID:SCR_001905 | https://http://www.R-project.org/ |
| Software, algorithm | Fastx toolkit v0.0.14 | http://hannonlab.cshl.edu/fastx_toolkit/commandline.html | RRID:SCR_005534 | |
| Software, algorithm | MACS v1.4 | Zhang et al., 2008 | RRID:SCR_013291 | |
| Software, algorithm | MACS v2.1 | Zhang et al., 2008 | RRID:SCR_013291 | |
| Software, algorithm | bowtie v1.2 | Langmead et al., 2009 | RRID:SCR_005476 | |
| Software, algorithm | bowtie v2.0 | Langmead and Salzberg, 2012 | RRID:SCR_016368 | |
| Software, algorithm | trim-galore v0.4.2 | https://www.bioinformatics.babraham.ac.uk/projects/trim_galore/ | RRID:SCR_011847 | |
| Software, algorithm | bismark v0.16.3 | Krueger and Andrews, 2011 | RRID:SCR_005604 | |
| Software, algorithm | phenogram | http://visualization.ritchielab.psu.edu/phenograms/document | ||
| Software, algorithm | DESeq2 (R package) | Love et al., 2014 | RRID:SCR_015687 | |
| Software, algorithm | kallisto v0.43.0 | Bray et al., 2016 | RRID:SCR_016582 | |
| Software, algorithm | AME | McLeay and Bailey, 2010 | RRID:SCR_001783 | |
| Software, algorithm | methylKit (R package) | Akalin et al., 2012 | RRID:SCR_005177 | |
| Software, algorithm | rms (R package) | https://cran.r-project.org/web/packages/rms/index.html | ||
| Software, algorithm | survival (R package) | https://CRAN.R-project.org/package=survival | ||
| Software, algorithm | FactoMineR (R package) | Le et al., 2008 | RRID:SCR_014602 |
Additional files
-
Transparent reporting form
- https://doi.org/10.7554/eLife.39380.044
Download links
A two-part list of links to download the article, or parts of the article, in various formats.
Downloads (link to download the article as PDF)
Open citations (links to open the citations from this article in various online reference manager services)
Cite this article (links to download the citations from this article in formats compatible with various reference manager tools)
Intergenerational epigenetic inheritance of cancer susceptibility in mammals
eLife 8:e39380.
https://doi.org/10.7554/eLife.39380


