Rapid changes in tissue mechanics regulate cell behaviour in the developing embryonic brain
- University of Cambridge, United Kingdom
Figures
Figure 1 with 1 supplement
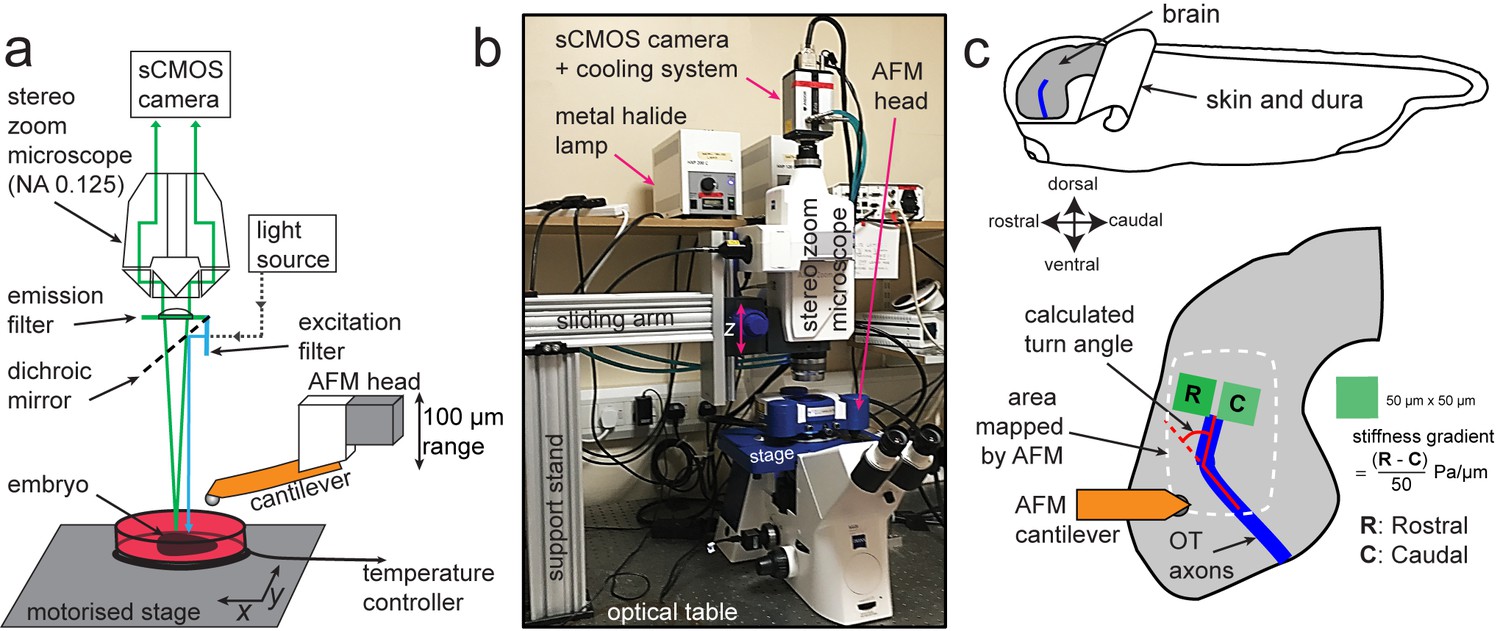
Experimental set-up for combined time-lapse in vivo AFM (tiv-AFM).
(a) Schematic (not to scale) and (b) photograph of the experimental setup. An AFM with 100 µm z-piezo range is positioned above a temperature-controlled sample chamber containing the specimen. A custom-fit fluorescence zoom stereomicroscope with a long (114 mm) working distance and NA 0.125 objective, connected to a high quantum-efficiency sCMOS camera, is mounted on a custom-built support stand above the AFM head optimised for trans-illumination. The specimen is moved by a motorised x/y stage to allow AFM-based mapping of large areas. (c) (Top) Schematic of a Xenopus embryo, showing both how the brain is prepared for tiv-AFM and rostral-caudal (R/C) and dorsal-ventral (D/V) embryonic axes. All following images of embryonic brains in vivo will have the same orientation. (Bottom) Close-up diagram of the brain, showing the approximate region mapped by AFM (white dashed line), within which optic tract (OT) axons (blue) turn caudally. Also shown are the regions of interest (green boxes) used to calculate brain stiffness rostral and caudal of the OT, and hence the developing stiffness gradient. Red overlaid lines show calculation of the angle through which OT axons turn (turn angle).
Figure 1—figure supplement 1
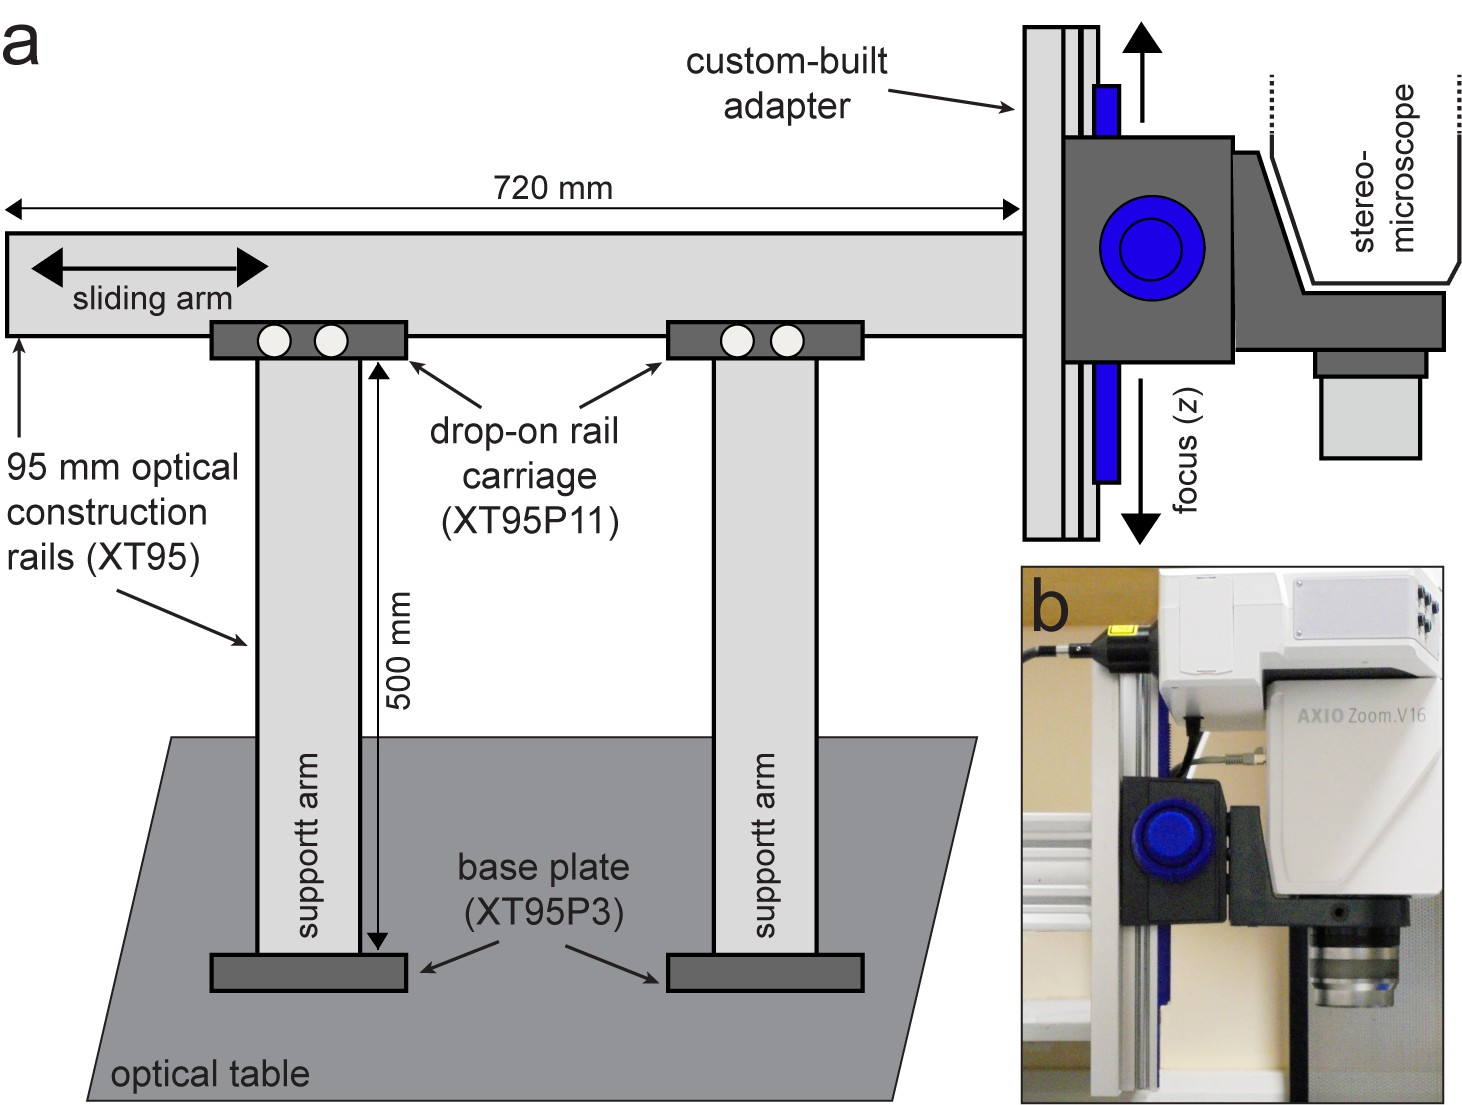
Custom-built support stand for the upright optical imaging set-up.
(a) Schematic (not to scale) of support stand and the adapter used to mount the upright fluorescence stereomicroscope to the stand. Codes denote part numbers (Thorlabs) where applicable. (b) Close-up photograph of the custom-built adapter shown in (a), with fluorescence stereomicroscope in place.
Figure 2 with 3 supplements
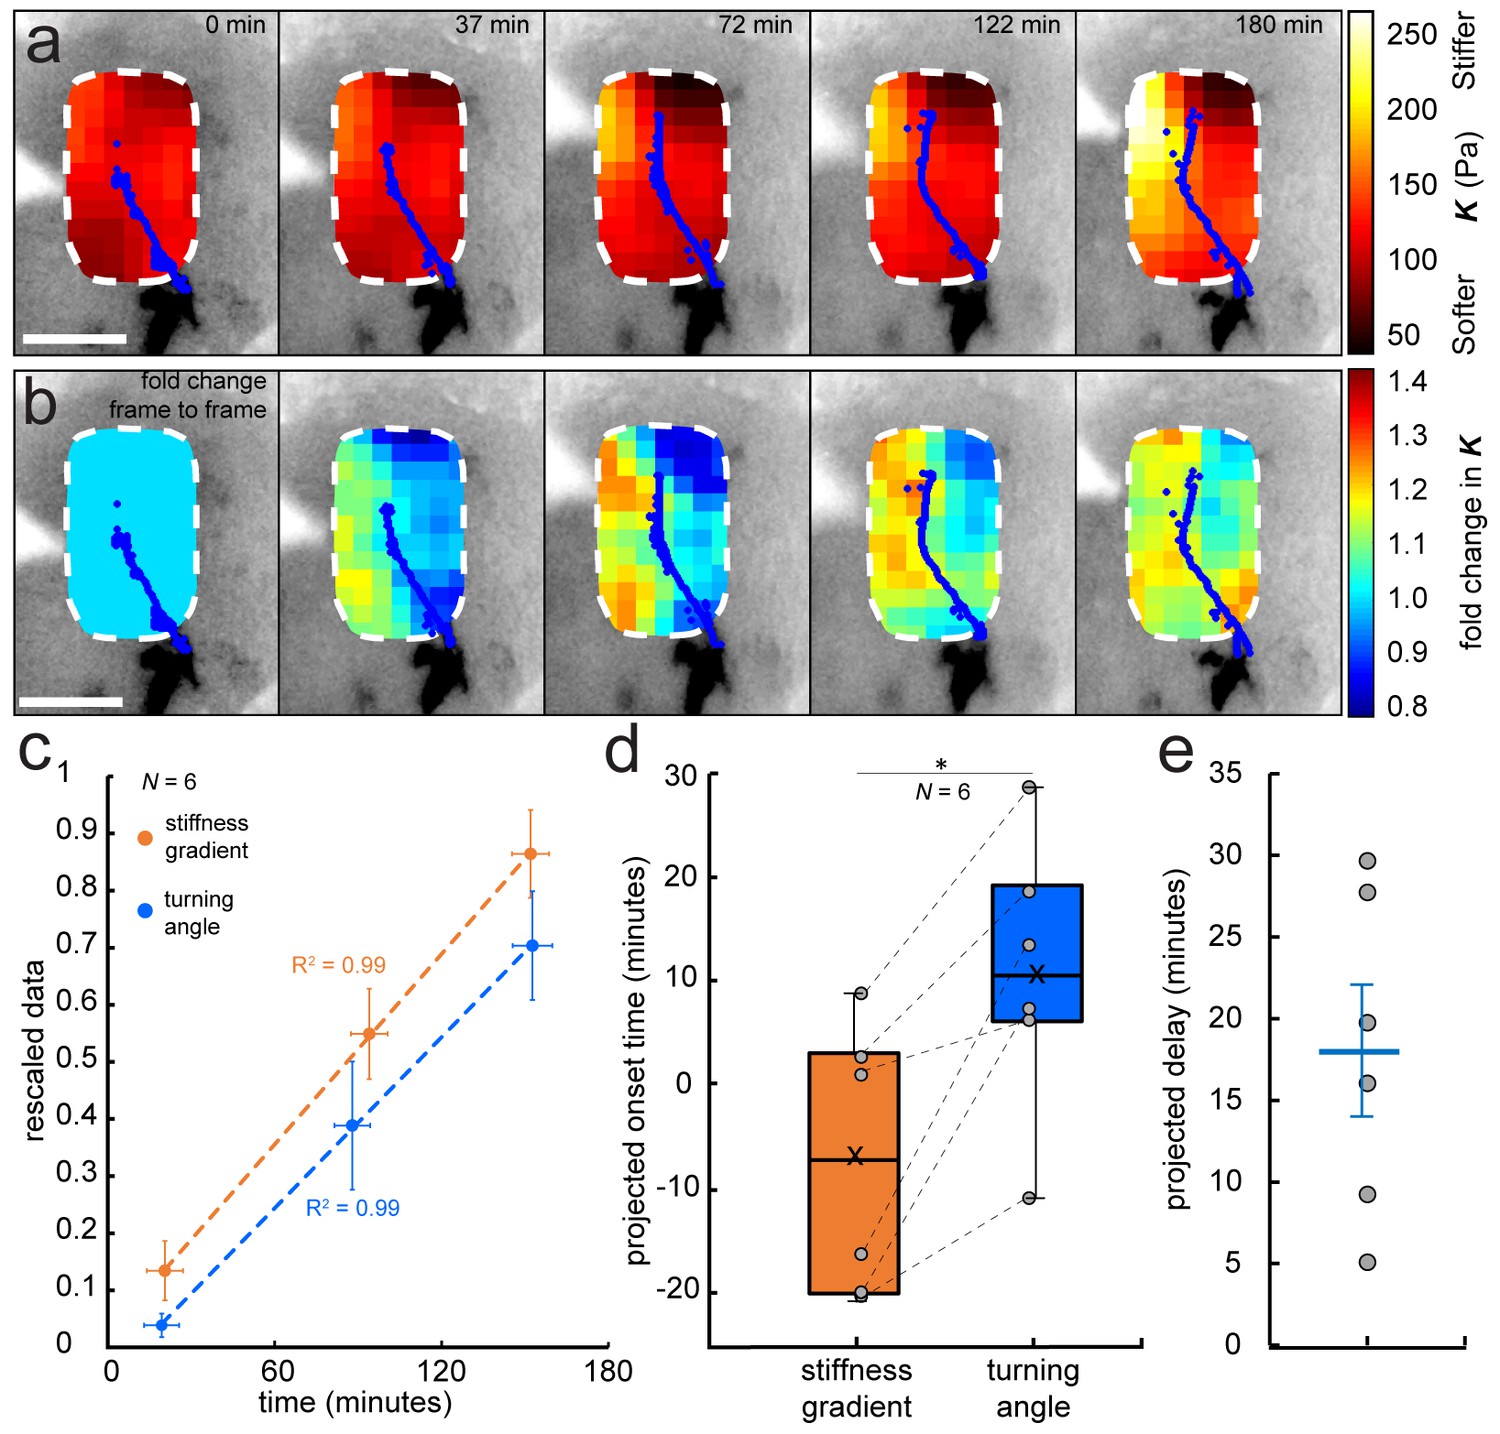
Development of a stiffness gradient in the Xenopus embryo brain precedes axon turning.
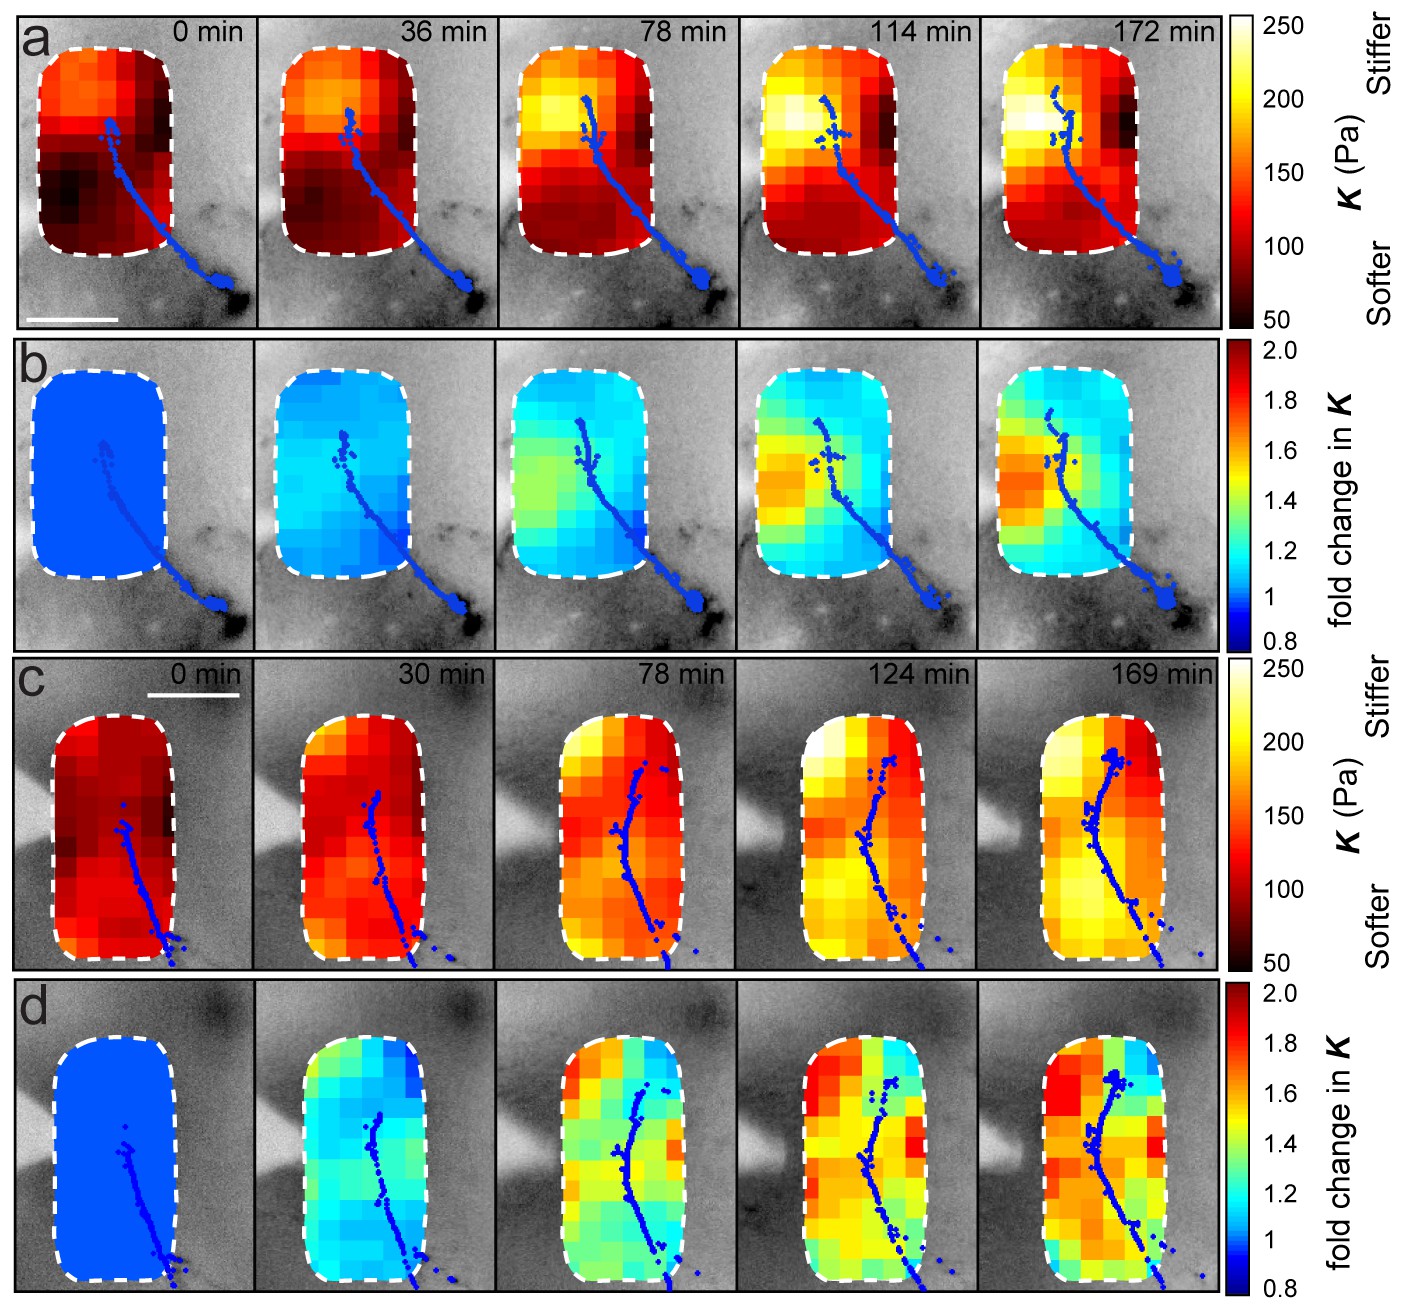
(a) Time-lapse stiffness maps obtained from a tiv-AFM experiment, showing outlines of fluorescently labelled OT axons (blue) and processed AFM-based stiffness maps (colour maps) overlaid on images of the brain. Colour maps encode the apparent elastic modulus K, a measure of tissue stiffness, assessed at an indentation force F = 10 nN. The time in minutes on each frame is taken from the timestamp of the first measurement in each successive stiffness map; the corresponding overlaid fluorescence images were obtained simultaneously. (b) Visualisation of fold-changes in brain tissue stiffness from one time point to the next, based on the interpolated and smoothed data shown in Figure 2a. Colour scale encodes the fold-change in K at each location on the stiffness map, expressed relative to the values at the previous time point, with the exception of t = 0 min, where all values were set to 1.Tissue stiffness changes throughout the time course, with large changes already occurring between ~40–80 min after the start of the experiment. (c) Plot of mean re-scaled values for the stiffness gradient (orange) and OT turn angle (blue). Stiffness values were binned to match the time points of the developmental stages at which cell body densities were assessed. Dashed lines denote linear fits (R2 = 0.99). (d) Boxplots of the extrapolated appearance times of the stiffness gradients and the onset of OT axon turning, relative to the start time of tiv-AFM measurements, with ladder plots for individual embryos overlaid (grey circles/dashed lines). Extrapolations are based on linear fits to the re-scaled data for individual animals (Figure 2c). Stiffness gradients appear significantly earlier than the onset of axon turning (p=0.03, paired Wilcoxon signed-rank test). (e) Scatterplot showing the time delay between extrapolated onsets of stiffness gradients and axon turning, calculated for individual animals. The average delay of 18 min is indicated by the blue line. Boxplots show median, first, and third quartiles; whiskers show the spread of the data; ‘×’ indicates the mean. Error bars denote standard error of the mean. *p<0.05. AFM measurement resolution, 20 µm; all scale bars, 100 µm. N denotes number of animals.
Figure 2—figure supplement 1
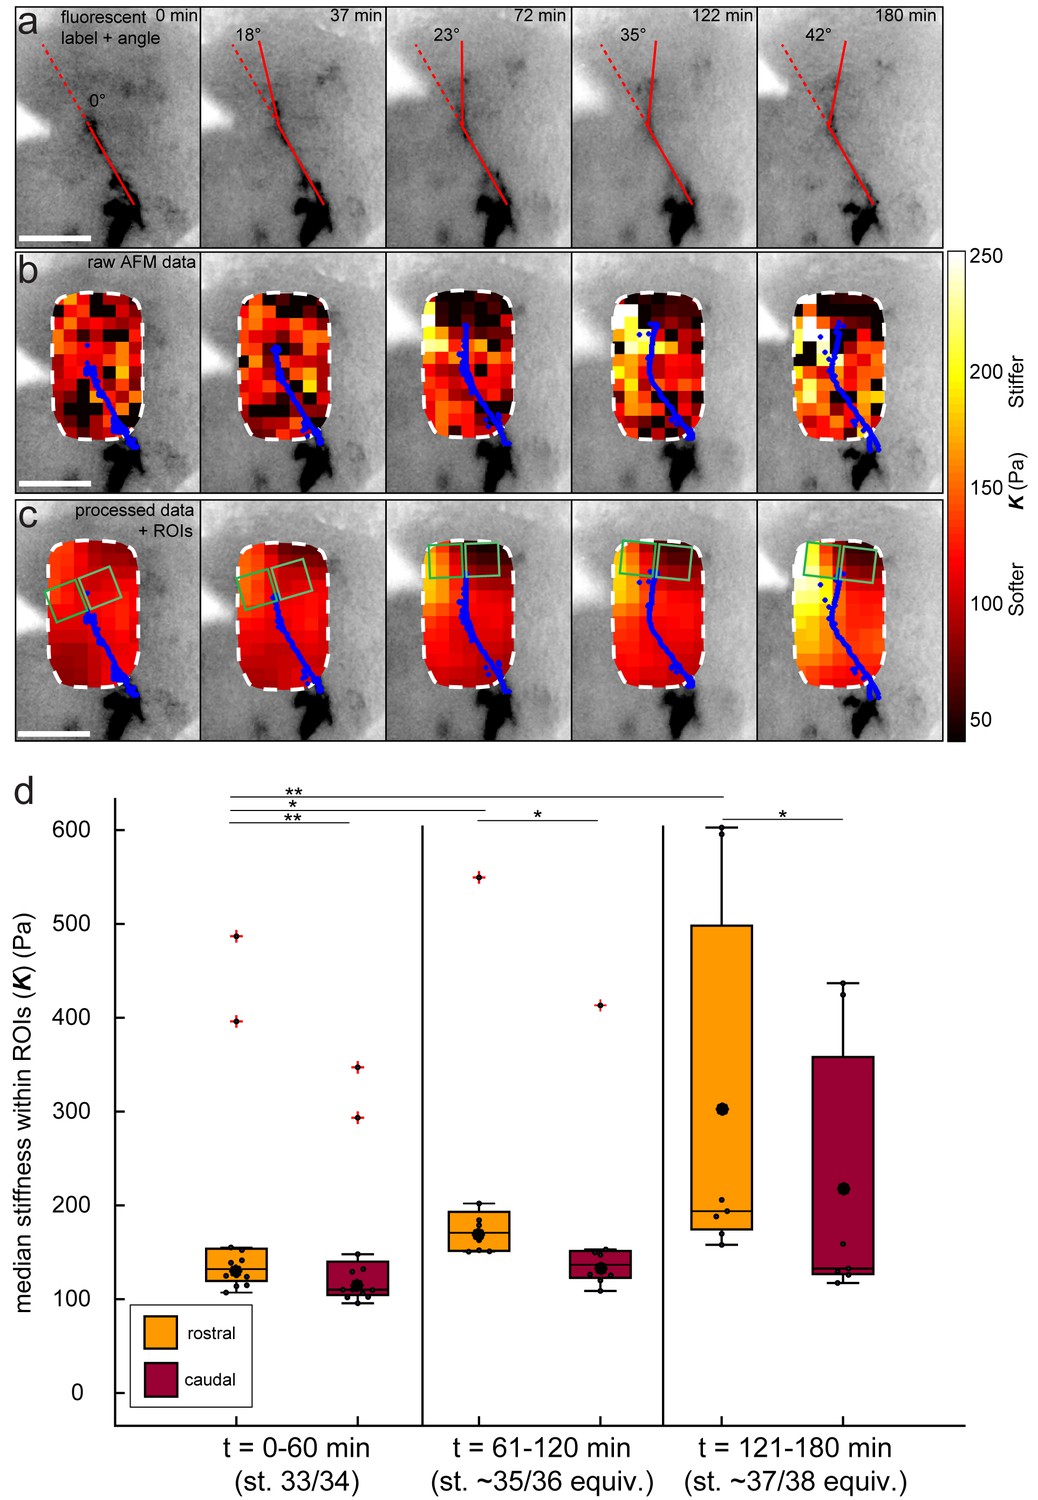
Data processing for tiv-AFM experiments.
(a–c) Same Xenopus embryo shown in Figure 2a–b. (a) Inverted epifluorescence raw images of OT axons (black) acquired during tiv-AFM measurements, labelled with membrane-bound GFP under the control of the cell type-specific ath5 promoter, showing turn angles (overlaid red lines). (b) Overlaid tiv-AFM-based colourmaps (‘stiffness maps’), encoding raw values of apparent elastic moduli K, with OT axons outlined in blue. Black squares denote points where AFM data were not analysable. (c) Final stiffness maps used for mechanical gradient quantification. To generate these maps, missing K values were interpolated and data were smoothed in x-, y-, and t-dimensions using an algorithm based on the discrete cosine transform (cf. Figure 1d; for more details see Materials and methods). Regions of interest used to calculate stiffness gradients immediately in front of the advancing OT axons are overlaid on the stiffness maps (green squares). (d) Boxplot of absolute K values obtained in rostral and caudal ROIs (pooled for all N = 6 embryos at all time points), binned over the same time ranges shown in Figure 2c (i.e. 0–60 min – stage 33/34 equivalent; 60–120 min – stage 35/36 equivalent; 120–180 min – stage 37/38 equivalent). Rostral stiffness is already significantly higher than caudal at 0–90 min (p=0.002, Mann-Whitney test), and continues to increase rapidly over the time course, along with the consequent stiffness difference between the two ROIs. Boxplots show median, 1 st, and third quartiles; whiskers show the spread of the data; red crosses denote outliers; ‘o’ indicates the mean. *p<0.05; **p<0.01; AFM measurement resolution, 20 µm; all scale bars, 100 µm.
Figure 2—figure supplement 2
Iterated AFM measurements of brain in vivo do not affect OT outgrowth.
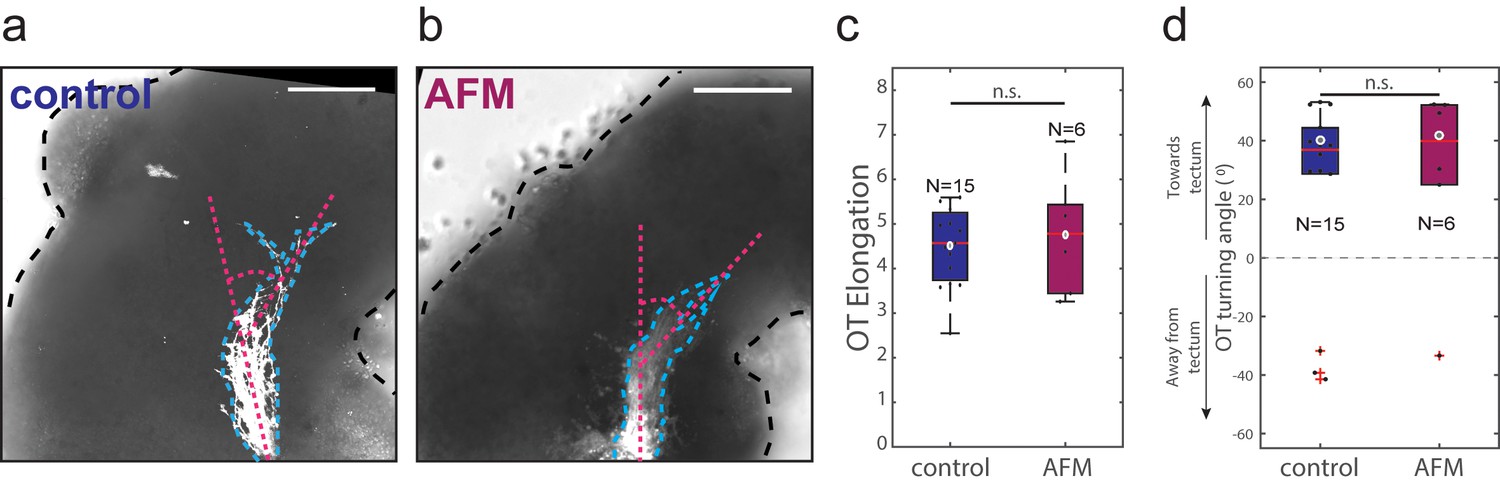
(a, b) Representative images of control (a) and AFM-manipulated (b) embryo brains (outlined with black dashed lines), with OTs labelled using DiI (white, outlined with blue dashed lines). Overall OT morphology appears similar in both conditions. Magenta dashed lines indicate turn angle. (c, d) Quantification of OT elongation (c) and turn angle (d) in control and AFM-manipulated brains. There is no significant difference between the two conditions for either metric (Wilcoxon rank-sum test; p=0.97 and 0.84 respectively). All scale bars: 100 µm. Boxplots show median, first, and third quartiles; whiskers show the spread of the data; ‘o’ indicates the mean (excluding outliers); red crosses denote outliers where applicable. N denotes number of animals.
Figure 2—figure supplement 3
Stereotypy of brain stiffness changes relative to OT development.
Montages from time-lapse AFM measurements in two additional embryos. (a, c) Overlaid tiv-AFM-based stiffness maps for each embryo, encoding interpolated and smoothed values of apparent elastic moduli K. OT axon outlines are shown in blue. In both animals, a similar mechanical gradient arose in the region where OT axons would turn, again due mostly to increasing tissue stiffness of tissue rostral to the axons (cf. Figure 2a, b). (b, d) Time-lapse montages for the same embryos shown in (a) and (c) respectively, with colourmaps encoding fold-changes in K at each location on the stiffness map, expressed relative to the values obtained at t = 0 min. Brain tissue becomes stiffer over time, with largest changes rostral to the growing OT axons (cf. control embryo in Figure 4f). AFM measurement resolution: 20 µm; all scale bars, 100 µm.
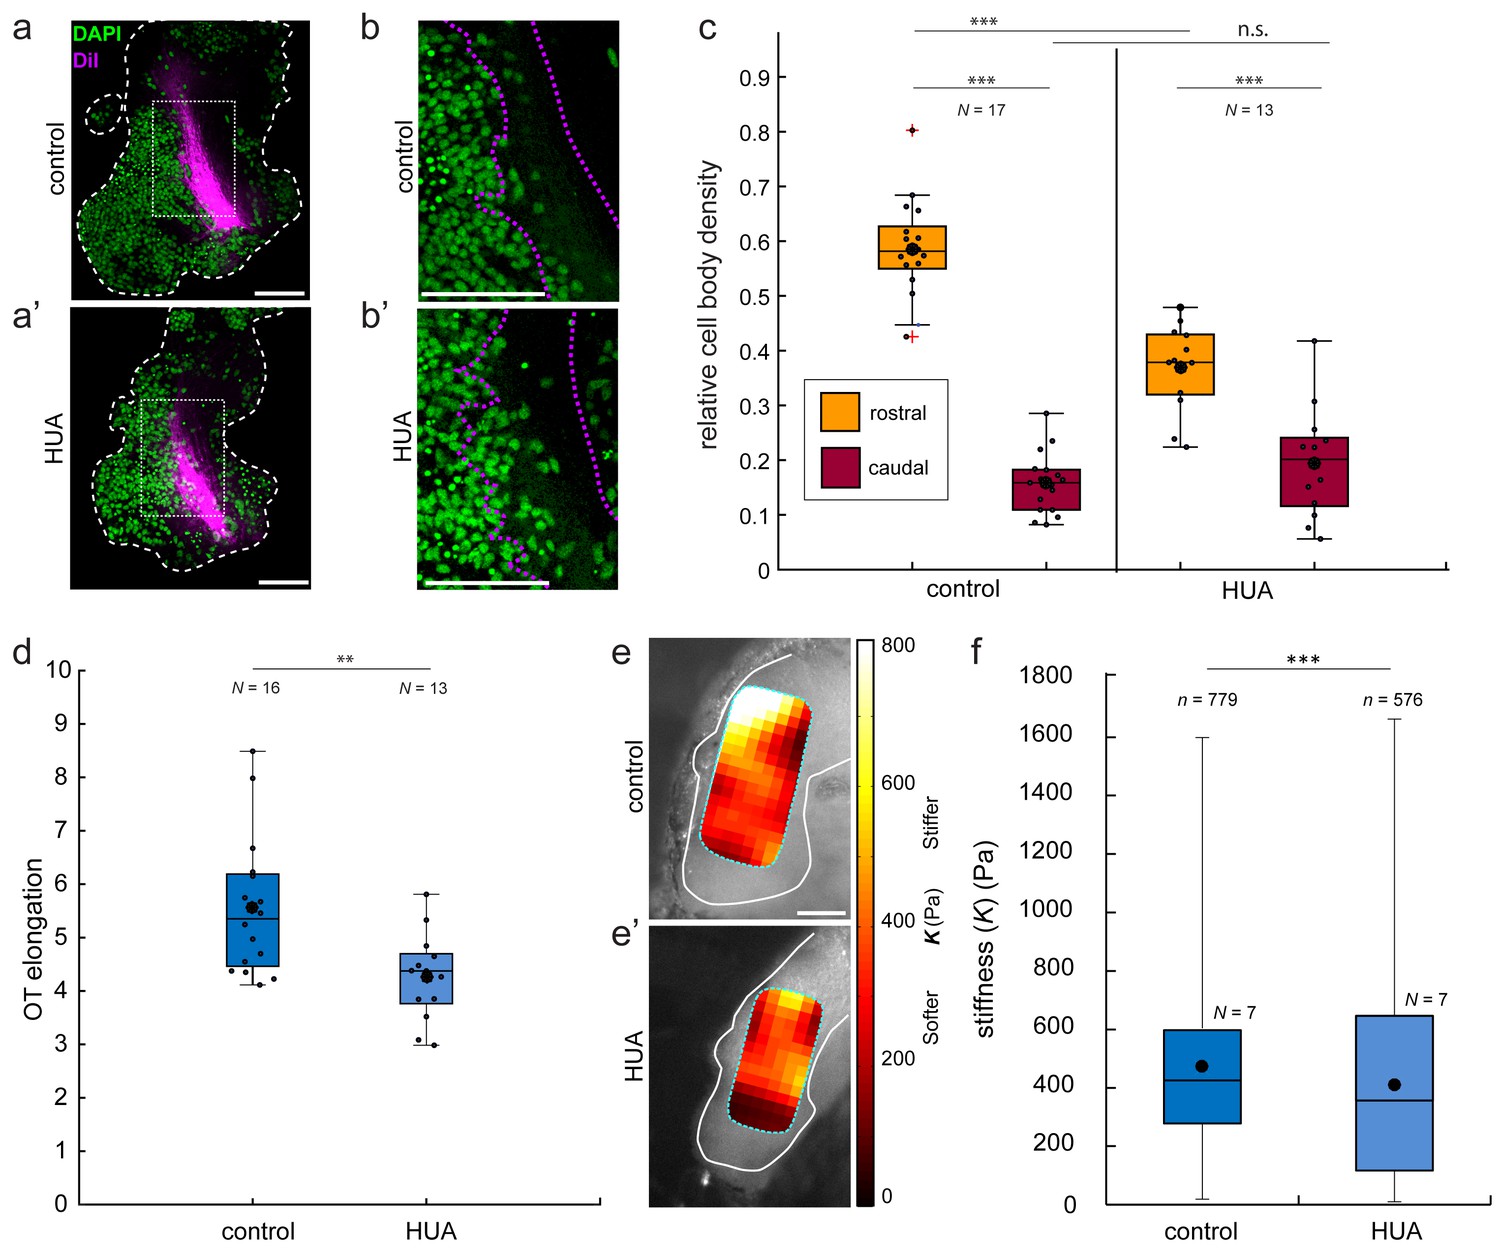
Figure 3
Changes in local cell body densities contribute to the emerging in vivo stiffness gradient in the Xenopus embryo brain.
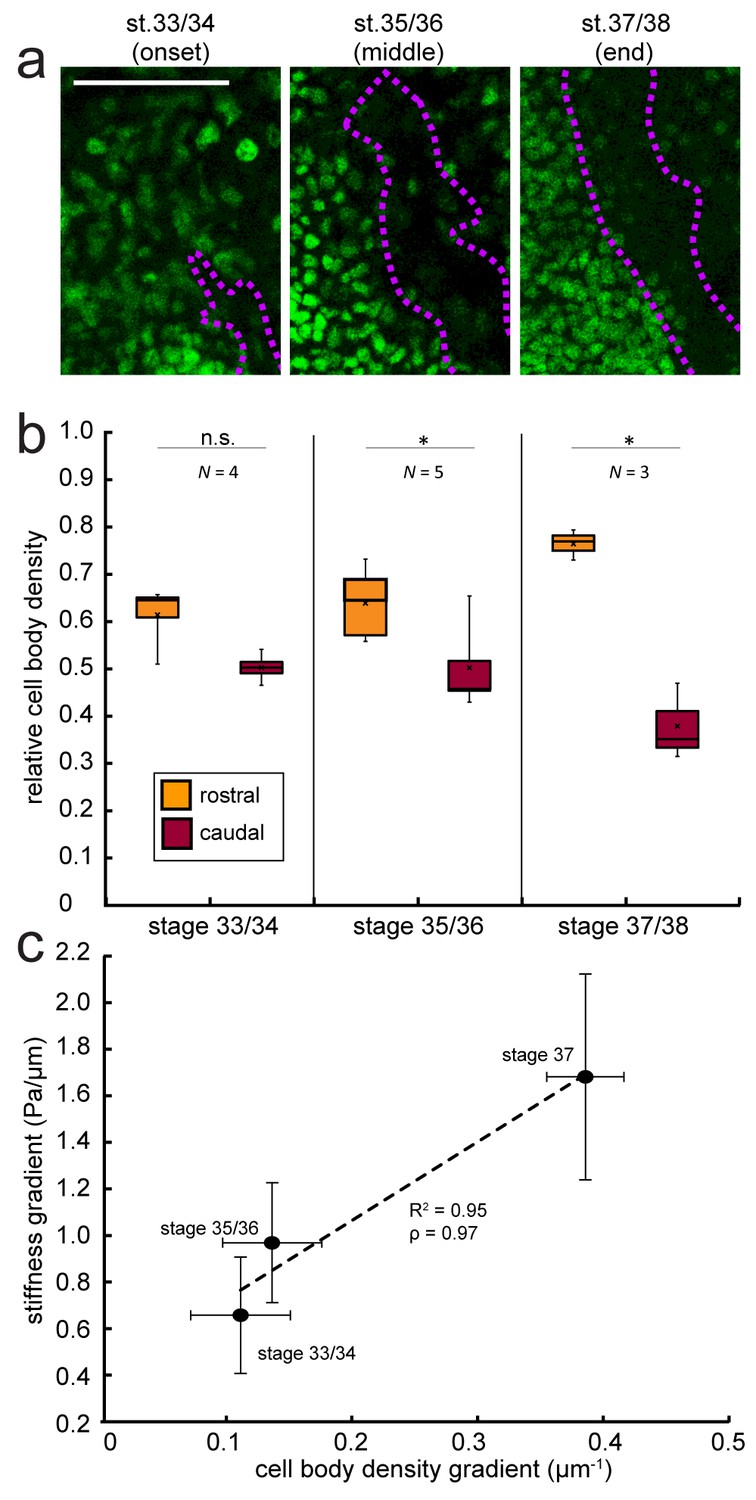
(a) Immunohistochemistry of nuclei (green) in whole-mount control Xenopus embryo brains at successive developmental stages. Stages shown correspond to the onset (stage 33/34), approximate middle (stage 35/36), and end (stage 37/38) of tiv-AFM measurements. OT axons are outlined in purple. (b) Local cell body densities were significantly higher rostral to the OT than caudal to it at both stage 35/36 (p=0.03, paired Wilcoxon signed-rank test) and stage 37/38 (p=0.04). (c) Gradients in local cell body density and tissue stiffness strongly correlate with each other (Pearson’s correlation coefficient ρ = 0.97). Binned absolute values for the stiffness gradient (in Pa/µm) are plotted against the mean cell density gradient at each developmental stage. Dashed line denotes linear fit (R2 = 0.95). Boxplots show median, first, and third quartiles; whiskers show the spread of the data; ‘×’ indicates the mean. Error bars denote standard error of the mean. *p<0.05. AFM measurement resolution, 20 µm; all scale bars, 100 µm. N denotes number of animals.
Figure 4 with 3 supplements
Blocking mitosis in vivo reduces local cell density, decreases mechanical gradients, and attenuates both RGC axon turning and overall OT elongation.
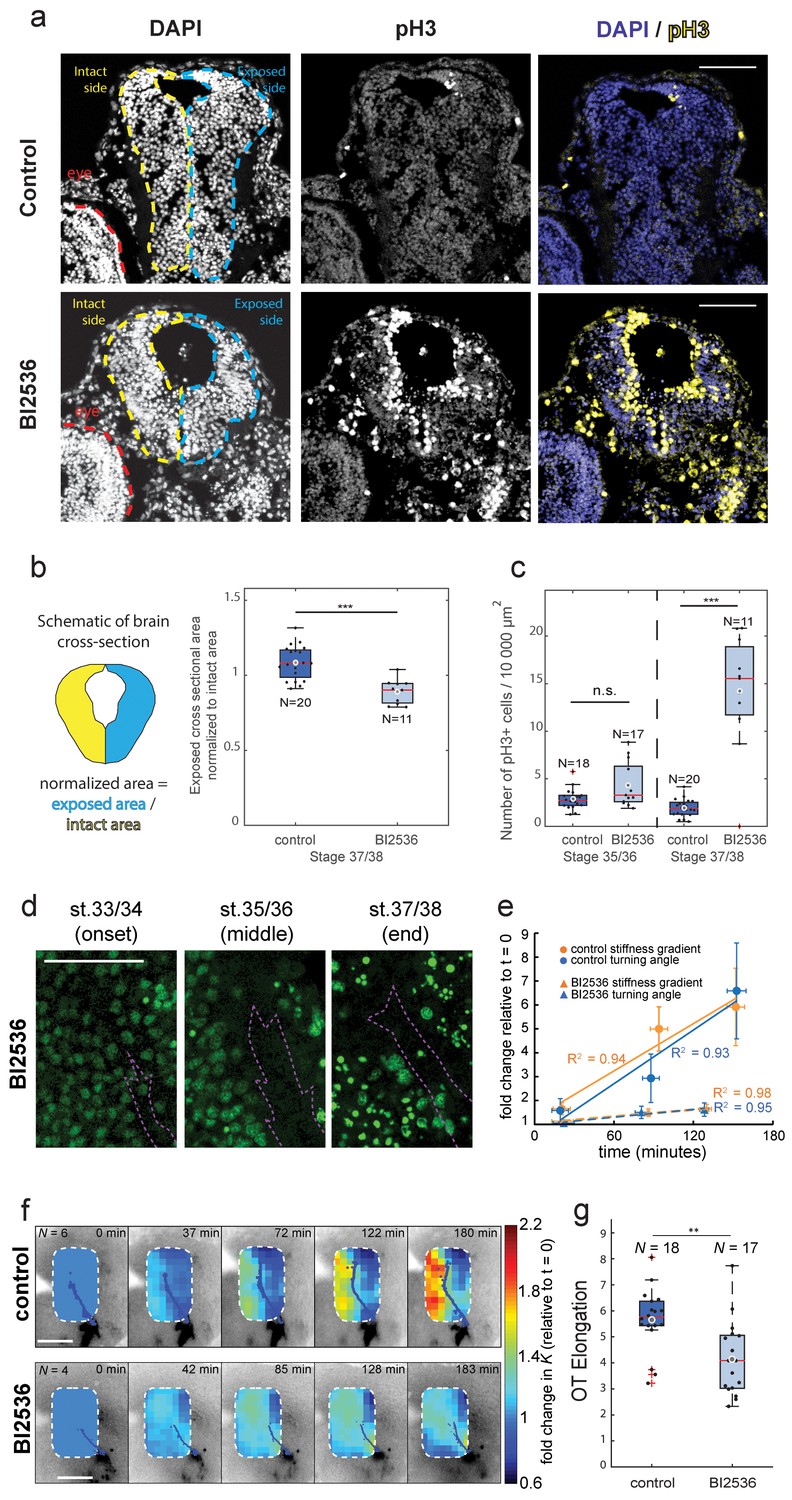
(a) Coronal sections of stage 37/38 control and BI2536-treated embryos stained for DAPI and phospho-histone3 (pH3). (b) Boxplot of normalized exposed brain area. The schematic demonstrates how regions were normalized. Normalized brain area is significantly lower in the BI2536-treated embryos compared with controls (p=5.7e-05, Wilcoxon rank-sum test), indicating a decrease in total cell number. (c) The number of pH3+ cells per 10 000 µm2 brain area in BI2536-treated embryos increased significantly over time if compared to controls (p=2.2e-04 at stage 37/38, Wilcoxon rank-sum test). (d) Immunohistochemistry of nuclei (green) in whole-mount mitotic inhibitor-treated Xenopus embryo brains at successive developmental stages. Stages shown correspond approximately to the onset (stage 33/34), middle (stage 35/36), and end (stage 37/38) of tiv-AFM measurements. OT axons are outlined in purple. (e) Plots of the fold-change over time in stiffness gradient (orange) and OT turn angle (blue) for both control and mitotic inhibitor-treated embryos. Blocking mitosis significantly attenuated the rise in both stiffness gradient (p=0.01, linear regression analysis) and OT axon turning (p=0.02). Solid and dashed lines denote linear fits for control and inhibitor-treated embryos, respectively. (f) Time-lapse AFM montages showing fold-changes in brain stiffness in representative control (top; OT axons outlined in blue) and mitotic inhibitor-treated embryos (bottom; OT axons in magenta). The colour scale encodes the fold-change in K at each location on the stiffness map, expressed relative to the values obtained at t = 0 min. (g) Boxplot of OT elongation at stage 37/38. Treatment with BI2536 significantly reduced OT elongation compared to controls (p=0.001, Wilcoxon rank-sum test). Boxplots show median, first, and third quartiles; whiskers show the spread of the data; ‘o’ indicates the mean. Error bars denote standard error of the mean. *p<0.05, **p<0.01, ***p<10−3. AFM measurement resolution, 20 µm; all scale bars, 100 µm. N denotes number of animals except in (b) and (c) where it denotes number of sections.
Figure 4—figure supplement 1
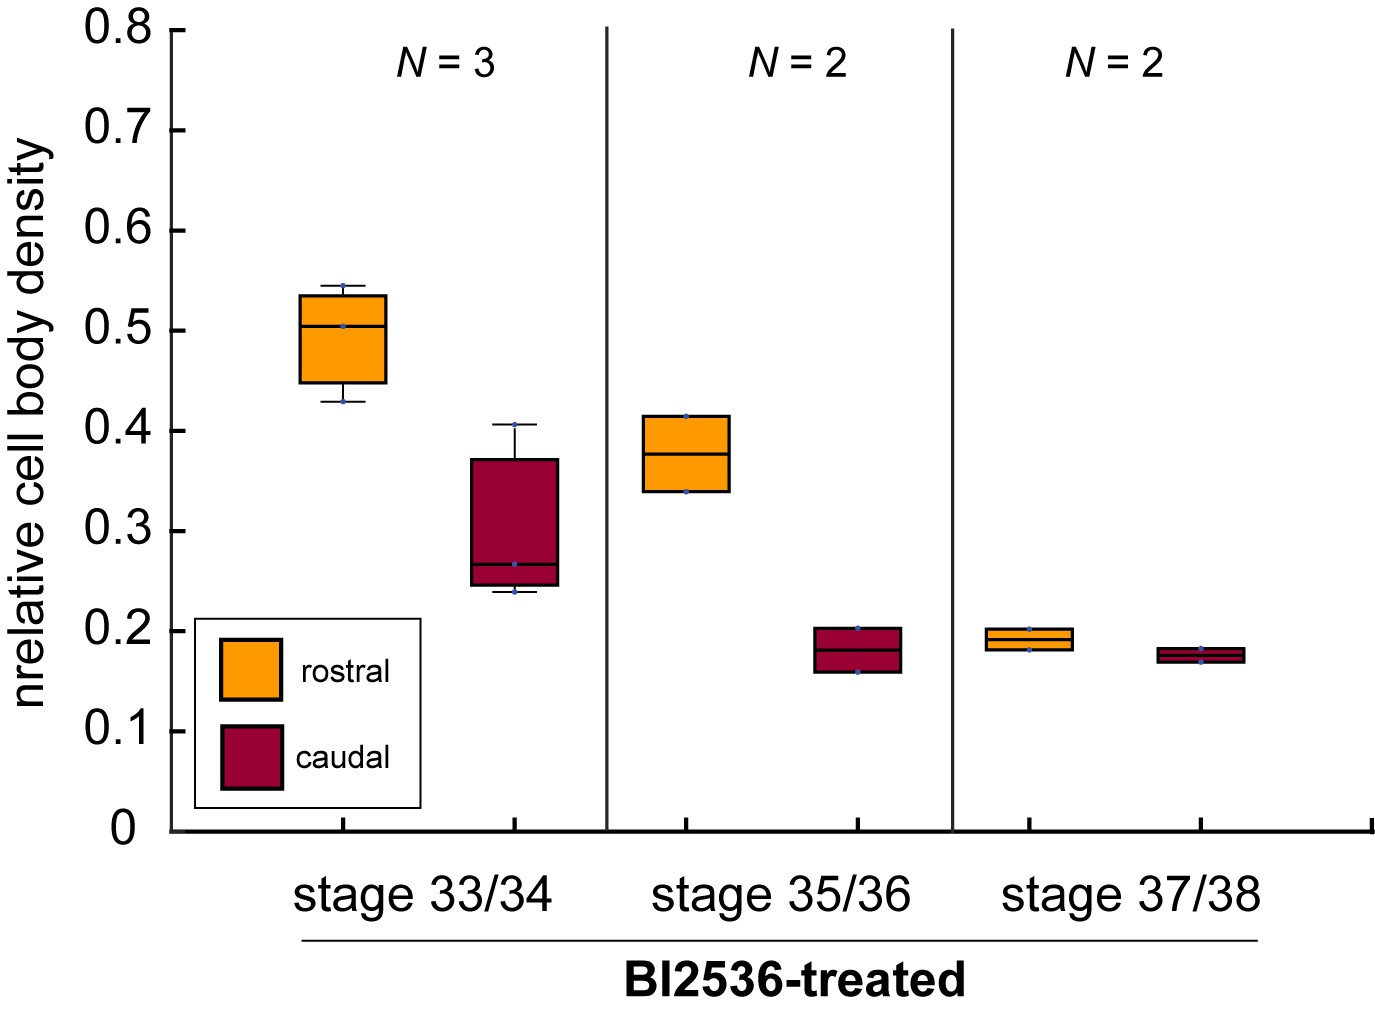
The mitotic inhibitor BI2536 decreases nuclear density in Xenopus brains in vivo.
Boxplots of relative cell body densities in 50 × 50 µm regions rostral (yellow) and caudal (red) to the growing OT in embryos incubated in BI2536 (treatment commencing at stage 33/34 in all cases). Cell body densities decreased with increasing time exposed to BI2536, especially in the region rostral to the OT. Boxplots show median, first, and third quartiles; whiskers show the spread of the data. N denotes number of animals.
Figure 4—figure supplement 2
In vivo treatment with hydroxyurea/aphidicolin (HUA) reduces cell body density, OT elongation, and brain stiffness.
(a) Lateral mount of representative stage 37/38 control (a) and HUA-treated (a’) Xenopus embryo brains (white dashed outline), showing nuclei (DAPI; green) and OT (DiI; magenta). (b) Close-up of boxed areas shown in (a). Nuclei rostral to the OT are packed less densely in HUA-treated brains (b’) than in controls (b). (c) Quantification of relative cell body densities in stage 37/38 embryos, in 50 × 50 µm regions rostral (yellow) and caudal (red) of OT axons. HUA treatment significantly decreased the cell body density rostral to the OT (p=1.35 × 10⁻⁵, Wilcoxon rank-sum test). (d) Similarly, OT elongation was significantly reduced in HUA-treated animals (p=0.009, Wilcoxon rank-sum test). (e) AFM stiffness maps overlaid on control (e) and HUA-treated (e’) brains (outlined in white). HUA treatment significantly reduced brain tissue stiffness (p=1.87 × 10⁻⁵, Mann-Whitney test). **p<0.01; ***p<10−3. AFM colourmap resolution: 20 µm (control) and 25 µm (HUA). Boxplots show median, first, and third quartiles; whiskers show the spread of the data; ‘o’ indicates the mean. N denotes number of animals; n, number of individual measurements where applicable. All scale bars, 100 µm.
Figure 4—figure supplement 3
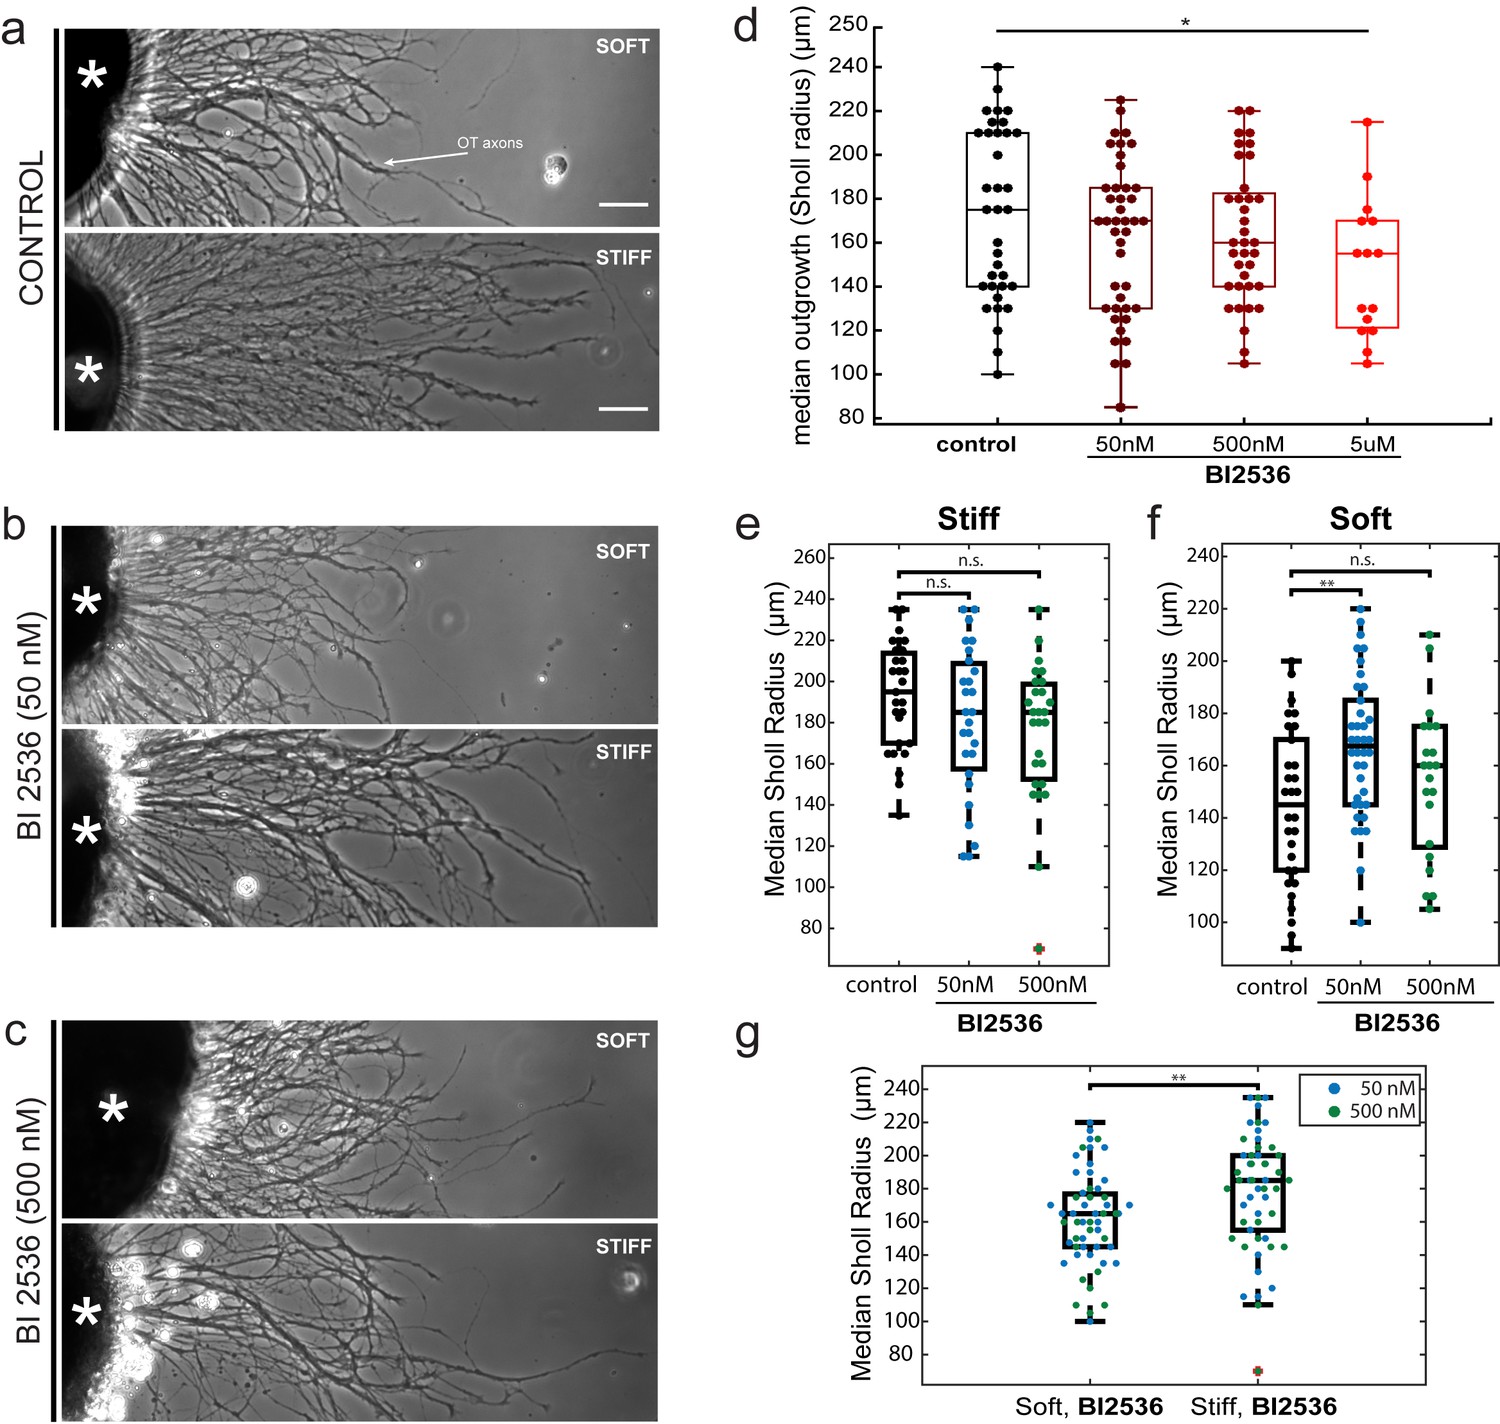
The impact of the mitotic inhibitor BI2536 on in vitro axon mechanosensing.
(a–c) Representative phase contrast images of Xenopus eye primordia explants (asterisks) grown on polyacrylamide gel substrates with defined stiffnesses (‘soft’: shear modulus G’~200 Pa; ‘stiff’: G’~5,500 Pa), in the presence of control treatment (a), 50 nM BI2536 (b), or 500 nM BI2536 (c). RGC axons are indicated by the white arrow. (d) Titration of BI2536 concentrations using gels of stiffness G’~300 Pa. Shown are boxplots of axon outgrowth (expressed as median Sholl radii). A small but significant reduction in outgrowth compared to control only occurred at 5 µM (p=0.03, N = 5 biological replicates, Wilcoxon rank-sum test). (e–g) Quantification of axon outgrowth on (e) stiff (G’~5,500 Pa) vs. (f) soft (G’~200 Pa) gels. (g) Axons grew significantly longer on stiffer gels even when treated with BI2536 (p=0.009, N = 4 biological replicates, two-sample t-test). Boxplots show median, 1 st, and third quartiles; whiskers show the spread of the data. *p<0.05; ***p<10–3; all scale bars, 50 µm.
Author response image 1
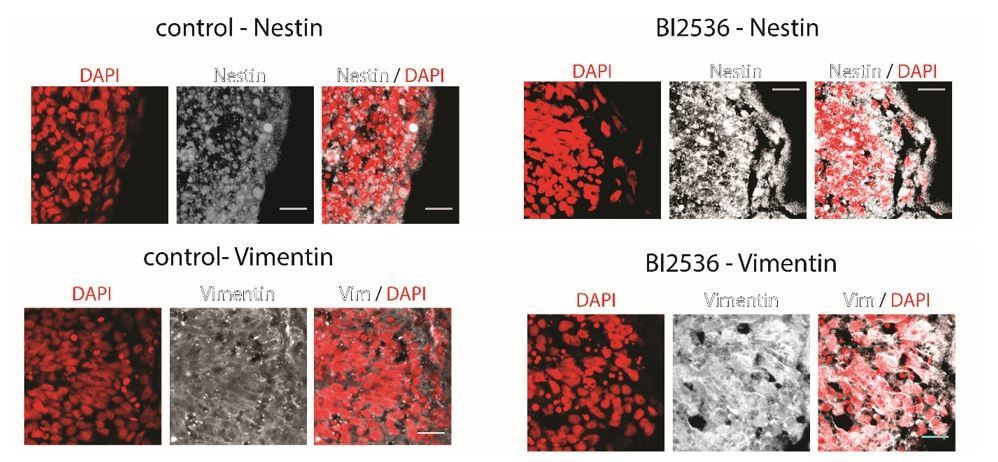
Coronal brain sections of stage 37/38 Xenopus embryos stained for DAPI (red) and Nestin (above) or Vimentin (below) (white).
Control animals (left) and BI2536-treated animals (right); the exposed side is on the right hand side of each image. All scale bars are 20 µm.
Author response image 2
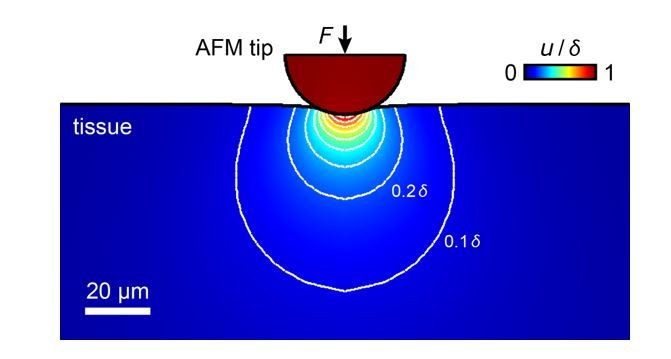
Simulation of the propagation of tissue deformation during an AFM measurement of a tissue with an elastic modulus of K = 300 Pa with an applied maximum force F = 10 nN and a 37 µm bead as probe.
The sample is indented by 3.4 µm, tissue deformation propagates into deeper layers. Most contributions to the measured elastic modulus come from structures within the top ~20-30 µm, within which RGC axons grow.
Tables
Key resources table
| Reagent type. | Designation. | Source (public). | Identifiers. | Additional information. |
|---|---|---|---|---|
| Transfected construct (Xenopus laevis) | ath5::GAP-eGFP | Das et al., 2003, PMID: 12597858; Zolessi et al., 2006, PMID: 17147778 | ZFIN ID: ZDB-TGCONSTRCT-070129–1 | Membrane-tagged GFP under control of ath5 (atoh7) promoter; pCS2 + vector |
| Biological sample (Xenopus laevis) | Xenopus laevis | National Xenopus Resource | Cat #: NXR_0.0031; RRID:SCR_013731 | Wild-type strain Xla. NXR-WTNXR |
| Antibody | Rabbit polyclonal anti-phospho-Histon H3 (sER10) | EMD Millipore | Cat #: 06–570; RRID:AB_310177 | IHC (1:1000) |
| Antibody | Goat anti-rabbit Alexa Fluor 594 | Abcam | Cat #: AB150084; RRID:AB_2734147 | IHC (1:500) |
| Chemical compound, drug | BI2536 | MedChem Express | Cat#: HY-50698 | 50 µM |
| Chemical compound, drug | Hydroxyurea | Sigma | Cat#: H8627-5G | 20 mM |
| Chemical compound, drug | Aphidicolin | Sigma | Cat#: A0781-5MG | 150 µM |
| Chemical compound, drug | 1M Sodium hydroxide | Sigma | fabrication of polyacrylamide substrates | |
| Chemical compound, drug | (3-aminopropyl) trimethoxysilane | Sigma-Aldrich | Cat#: 281778–100 ML | fabrication of polyacrylamide substrates |
| Chemical compound, drug | glutaraldehyde | Sigma-Aldrich | Cat#: G6257-1L | fabrication of polyacrylamide substrates |
| Chemical compound, drug | 40% w/v acrylamide solution | Sigma-Aldrich | Cat#: A4058-100ML | fabrication of polyacrylamide substrates |
| Chemical compound, drug | 2% bis-acrylamide | Fisher Scientific | Cat#: BP1404-250 | fabrication of polyacrylamide substrates |
| Chemical compound, drug | ammonium persulfate | Sigma | Cat#: 215589 | fabrication of polyacrylamide substrates |
| Chemical compound, drug | N,N,N',N'-tetramethylethylenediamine | ThermoFisher | Cat#: 15524–010 | fabrication of polyacrylamide substrates |
| Chemical compound, drug | hydrazine hydrate | Sigma-Aldrich | Cat#: 225819–500 mL | fabrication of polyacrylamide substrates |
| Chemical compound, drug | 5% acetic acid | ACROS Organics | Cat#: 10041250 | fabrication of polyacrylamide substrates |
| Chemical compound, drug | Poly-D-lysine | Sigma-Aldrich | Cat#: P6407-5MG | 10 µg/ml |
| Chemical compound, drug | laminin | Sigma-Aldrich | Cat#: L2020-1MG | 5 µg/ml |
| Software, algorithm | Fiji | Fiji is Just ImageJ (https://fiji.sc) | RRID:SCR_002285 | |
| Software, algorithm | Adobe Illustrator | Adobe Illustrator | RRID:SCR_010279 | |
| Software, algorithm | MATLAB | MATLAB | RRID:SCR_001622 | Codes used for Sholl analysis post-processing, OT elongation, motorized stage control, processing of AFM raw data, mapping of stiffness maps onto brains and OT and local tissue stiffness gradient calculations can be found at https://github.com/FranzeLab/AFM-data-analysis-and-processing (Franze, 2018a), https://github.com/FranzeLab/Image-processing-and-analysis (Franze, 2018b) and https://github.com/FranzeLab/Instrument-Control (Franze, 2018c; copies archived at https://github.com/elifesciences-publications/Image-processing-and-analysis,https://github.com/elifesciences-publications/Instrument-Control and https://github.com/elifesciences-publications/AFM-data-analysis-and-processing). |
| Other | 4,6-diamidino-2- phenylindole (DAPI) | Sigma-Aldrich | Cat#: D9542- 5 mg | 1 µg/ml |
| Other | Arrow-TL1 Tipless silicon cantilevers | NanoWorld Innovative technologies | Manufacturer's ID: ARROW-TL1-50 | Cantilevers for AFM-based stiffness measurements |
| Other | 37.28 µm spherical polysterene beads | microParticles GmbH | Cat#: PS-R-37.0 | Spherical probes attached to AFM cantilevers |
| Other | Rain-X | Shell Car Care International Ltd, UK | Model #: 800002250 | fabrication of polyacrylamide substrates |
| Other | CellHesion-200 AFM head | JPK Instruments | Atomic force microscope | |
| Other | PetriDish Heater | JPK Instruments | Maintaining constant temperature for time-lapse AFM experiments |
Additional files
-
Transparent reporting form
- https://doi.org/10.7554/eLife.39356.014
Download links
A two-part list of links to download the article, or parts of the article, in various formats.
Downloads (link to download the article as PDF)
Open citations (links to open the citations from this article in various online reference manager services)
Cite this article (links to download the citations from this article in formats compatible with various reference manager tools)
Rapid changes in tissue mechanics regulate cell behaviour in the developing embryonic brain
eLife 8:e39356.
https://doi.org/10.7554/eLife.39356


