Transition between fermentation and respiration determines history-dependent behavior in fluctuating carbon sources
- VIB-KU Leuven Center for Microbiology, Belgium
- CMPG Laboratory of Genetics and Genomics, Belgium
- University of Edinburgh, United Kingdom
- University of Washington, United States
- Ghent University, Belgium
- VIB Center for Plant Systems Biology, Belgium
Figures
Figure 1 with 6 supplements
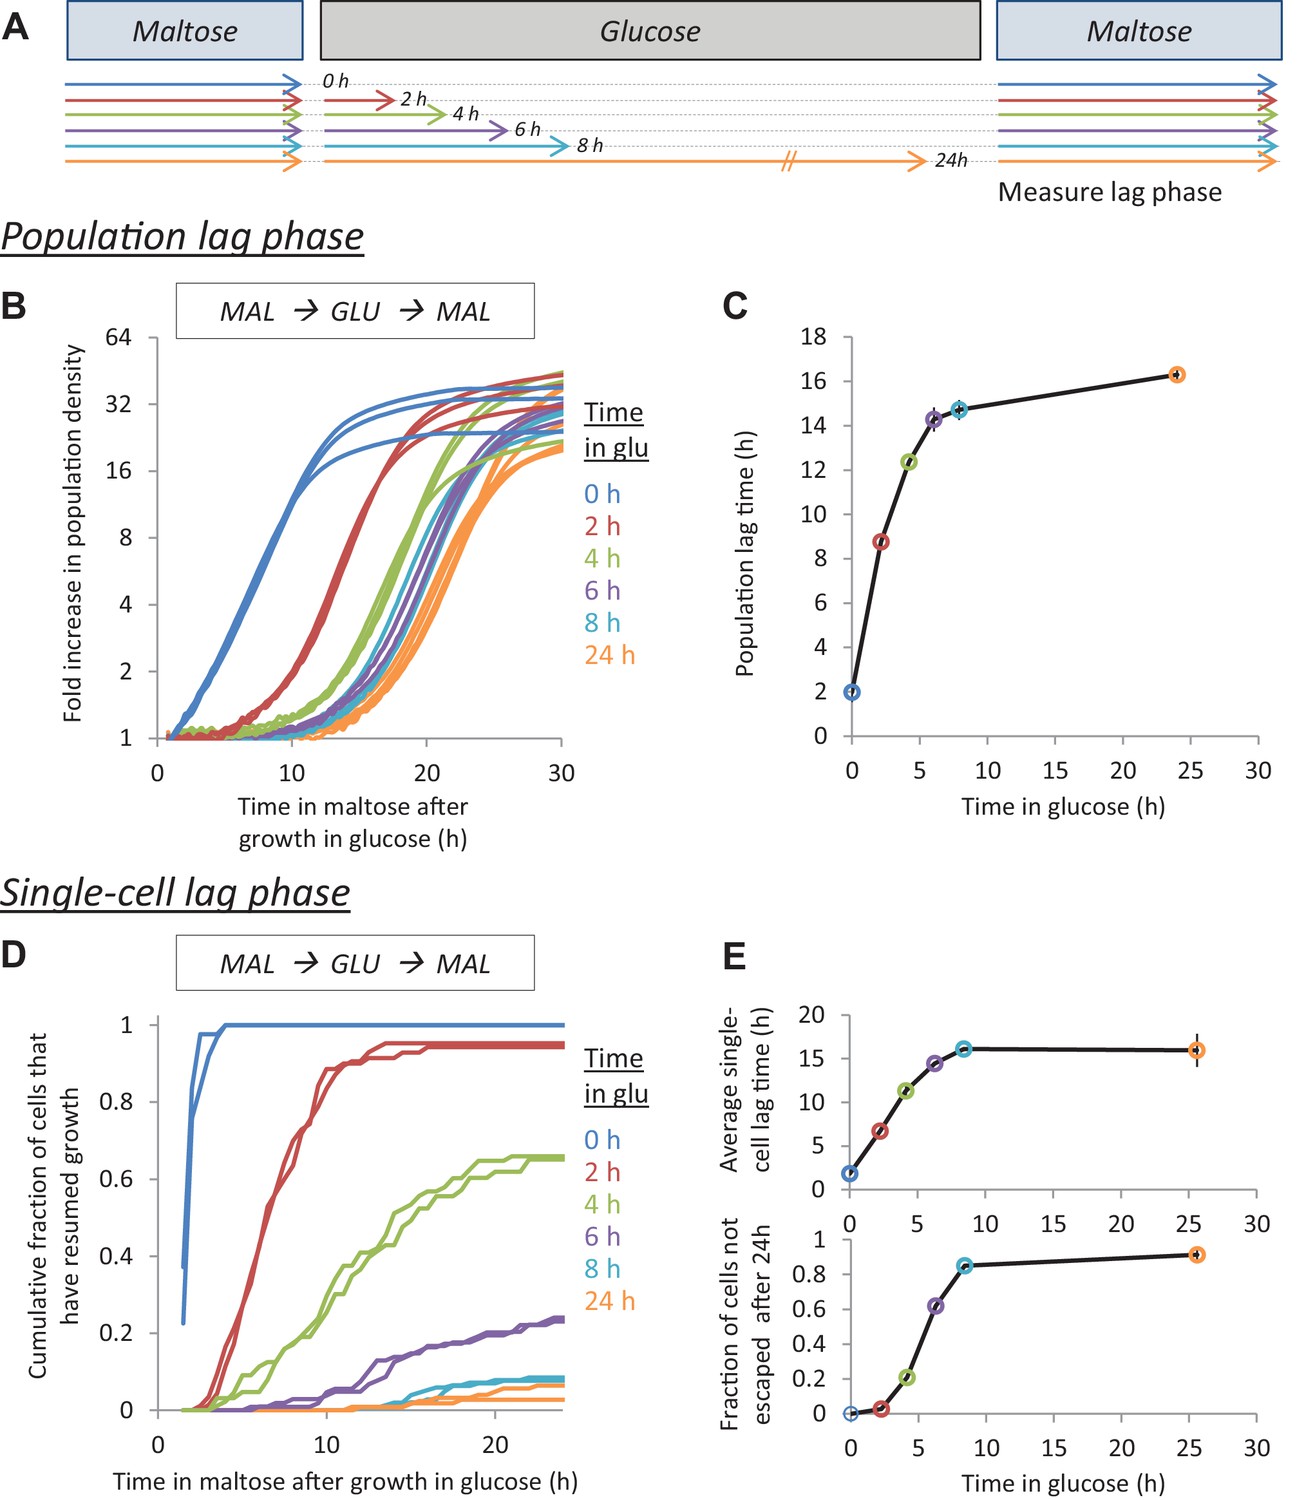
The lag time after glucose-maltose shifts depends on the time grown in glucose.
(A) Experimental set-up for measuring HDB. Cultures adapted to maltose growth are transferred to glucose for different times (0, 2, 4, 6, 8, 24 hr). Then, these cultures are transferred back to maltose where they experience a lag phase. The lag time is measured either on the population-level (B,C) or on the single-cell level (D,E). (B) Population lag times are measured by tracking population density (OD600) after the shift to maltose. The lag time is manifested by the delayed increase in cell density after glucose periods. (C) Quantification of the population lag time for the data shown in (B). (D) Single-cell lag times are measured using time-lapse microscopy. The cumulative fraction of cells initially present after the shift that have resumed growth is plotted against time in maltose. (E) Summary statistics of the single-cell lag time data shown in (D). We summarize these data by calculating (upper) the mean lag time of the cells resuming growth, (lower) the fraction of cells that did not resume growth before the end of the experiment. The error bars in (C) and (E) represent the range for two replicates.
Figure 1—figure supplement 1
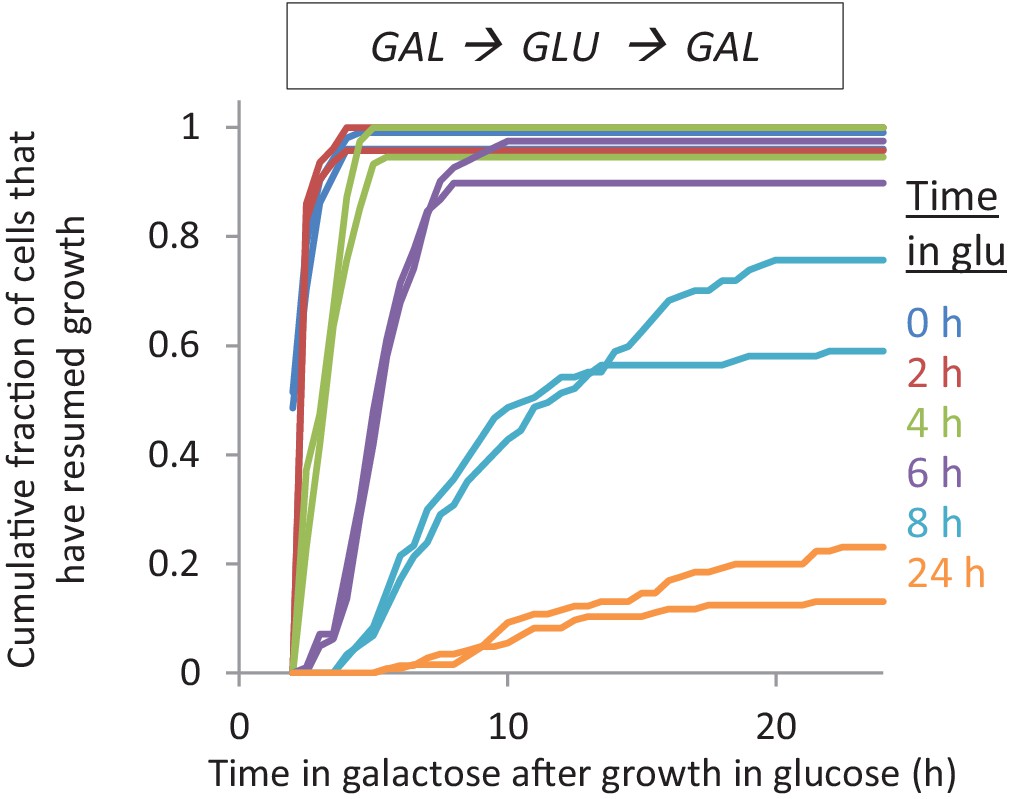
The lag time after shifts to galactose depends on the time grown in glucose.
Accumulative distribution of single-cell lag times for glucose-galactose shifts after pre-growth in galactose.
Figure 1—figure supplement 2
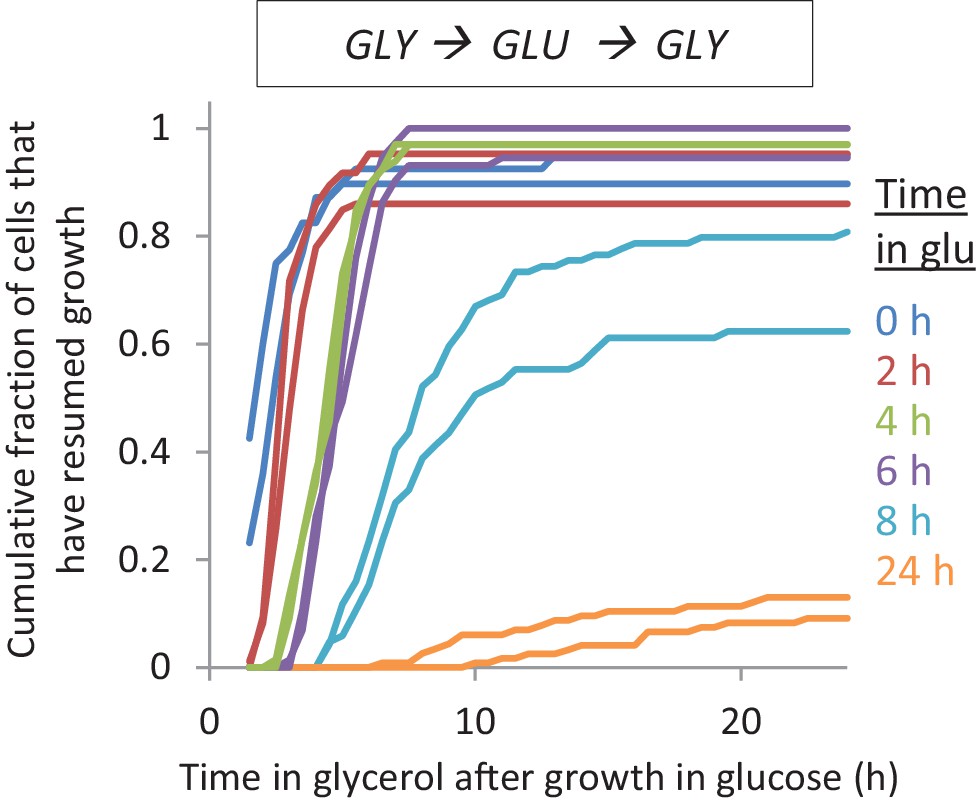
The lag time after shifts to glycerol depends on the time grown in glucose Accumulative distribution of single-cell lag times for glucose-glycerol shifts after pre-growth in glycerol.
https://doi.org/10.7554/eLife.39234.004
Figure 1—figure supplement 3
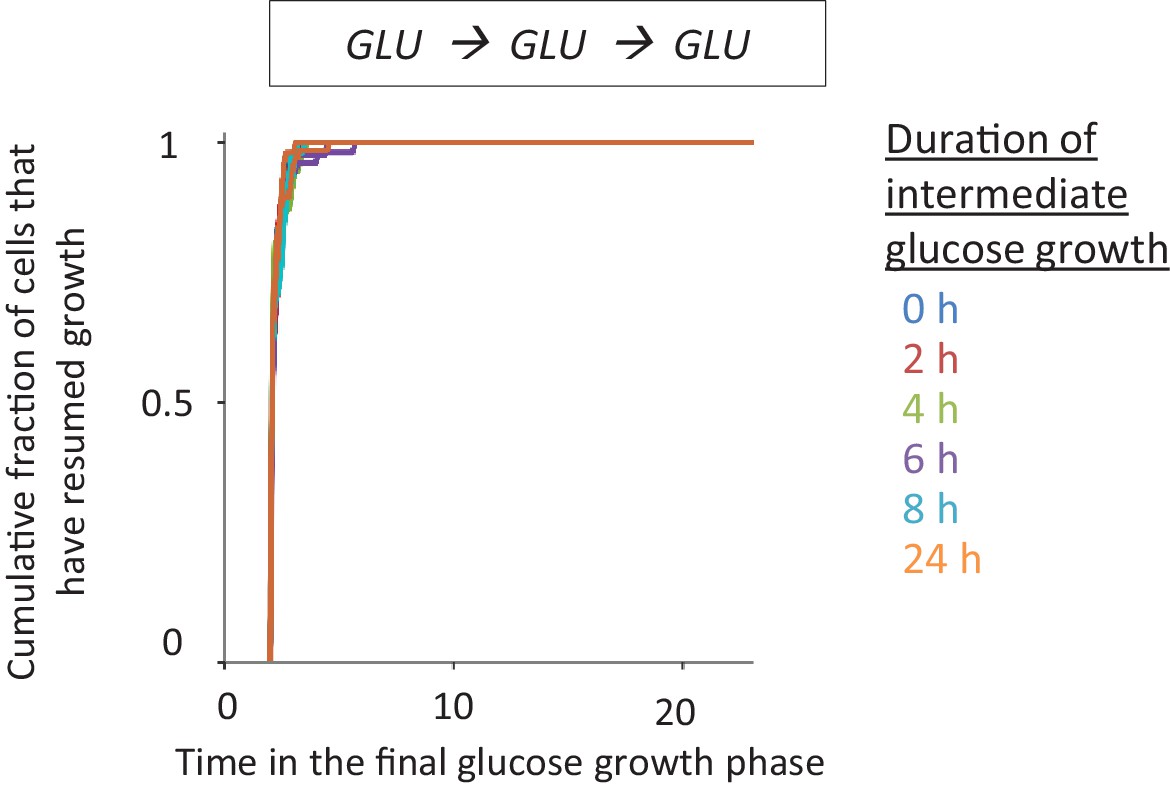
Different periods of growth on glucose does not alter growth resumption dynamics after shift to fresh glucose.
In order to control for the effect of media alterations during extended glucose growth times, the cells were pre-grown in glucose, then transferred to fresh glucose and grown there for different durations. The cells were then washed to fresh glucose media and single-cell lag times are measured using time-lapse microscopy.
Figure 1—figure supplement 4
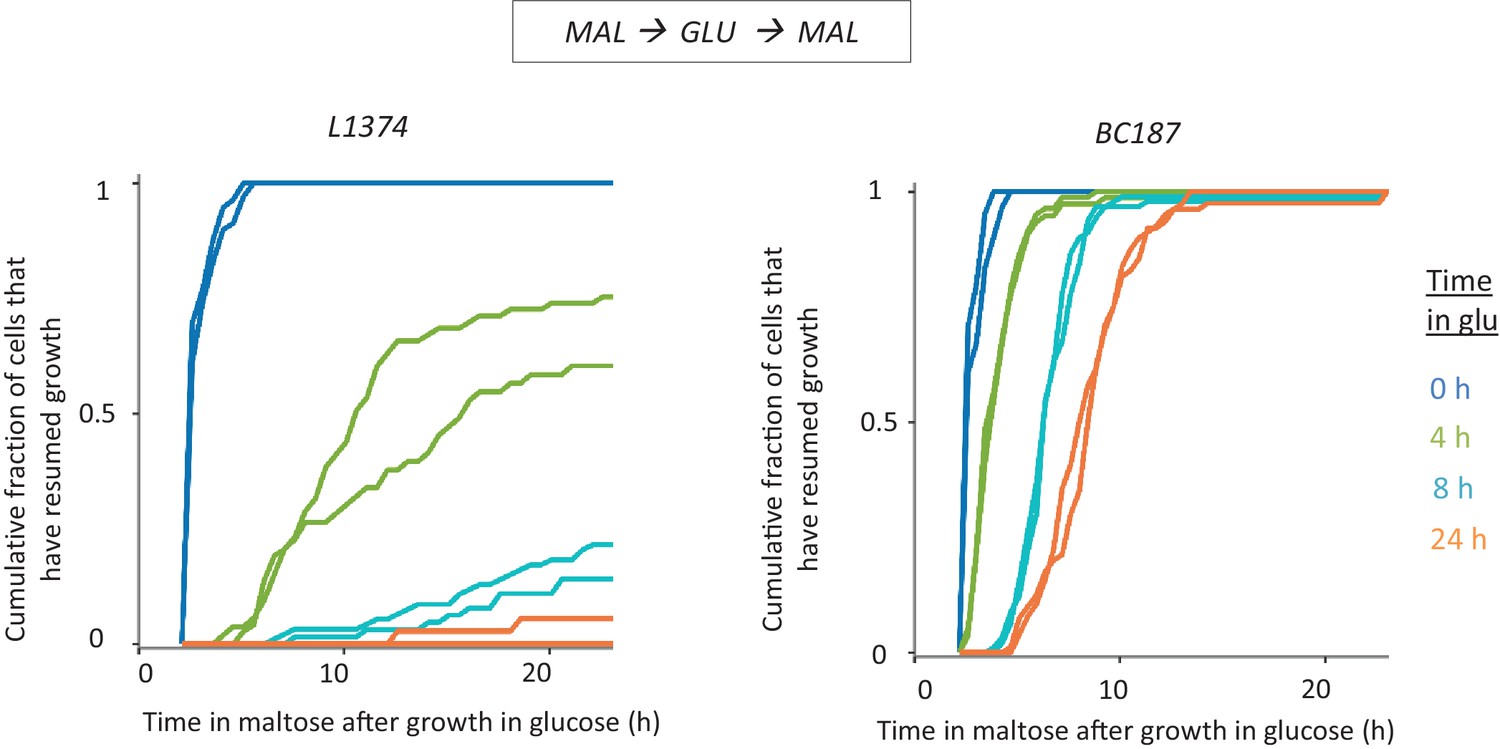
HDB in non-laboratory strains.
Cultures of L-1374 and BC187 strains were pre-grown in maltose, transferred to glucose and grown there for different durations, and then transferred back to maltose. The single-cell lag time accumulative distribution is demonstrated for two biological replicates.
Figure 1—figure supplement 5
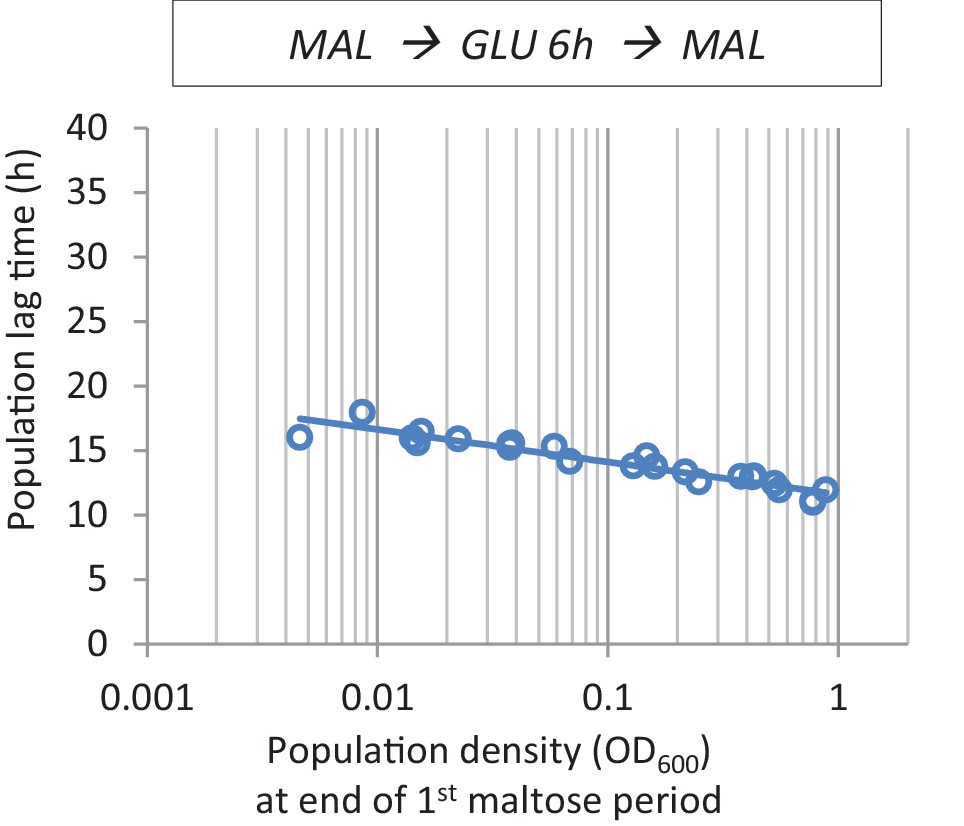
The effect of cell density before the shift to glucose on lag time.
At the end of maltose pre-growth, cultures with different population densities were transferred to glucose for 6 hr before the final shift back to maltose.
Figure 1—figure supplement 6
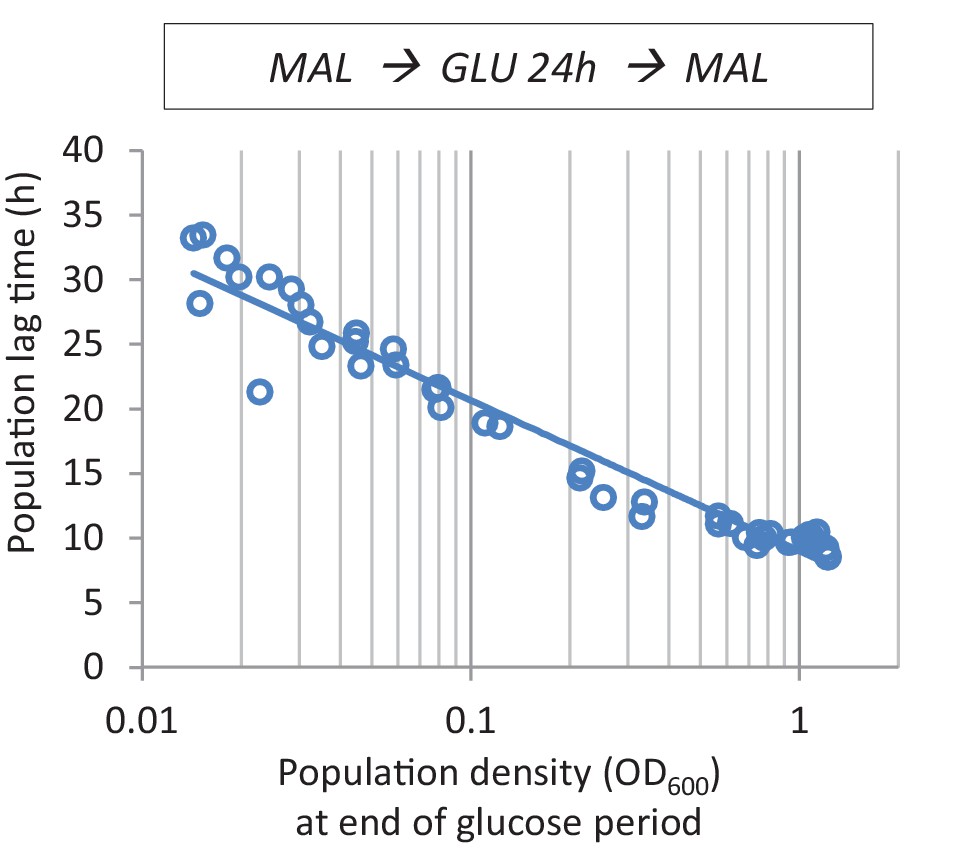
The effect of cell density before the shift to maltose on lag time.
After maltose pre-growth followed by 24 hr of glucose growth, cultures with different population densities were transferred back to maltose.
Figure 2 with 4 supplements
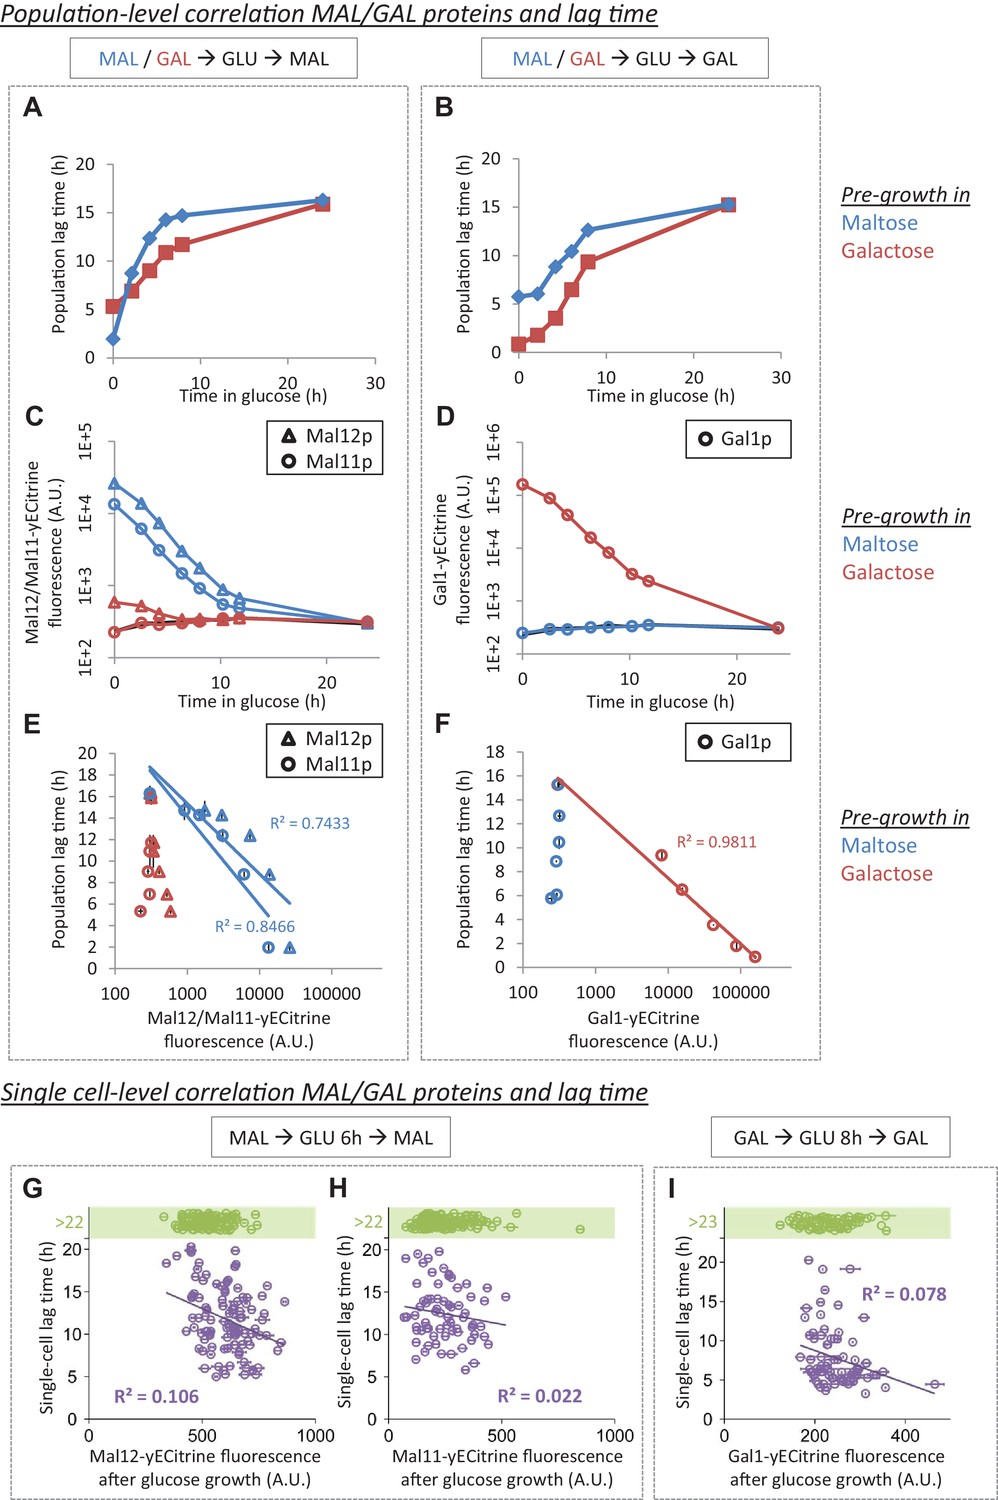
MAL/GAL protein levels are not always correlated with the lag time.
(A) The effect of pre-growth in maltose or galactose on HDB after glucose-maltose shifts. (B) The effect of pre-growth in maltose or galactose on HDB after glucose-galactose shifts. (C) Inheritance of MAL proteins during glucose after pre-growth in maltose or galactose. (D) Inheritance of GAL proteins during glucose after pre-growth in maltose or galactose. (E) Correlation between lag time and MAL protein level after pre-growth in maltose or galactose for glucose-maltose shifts. (F) Correlation between lag time and GAL protein level after pre-growth in maltose or galactose for glucose-galactose shifts. The error bars for lag time measurement in (A), (B), (E) and (F) represent SEM for three replicates. The error bars for fluorescence measurement in (C) to (F) represent the range for two replicates. (G) Single-cell correlation for lag time and Mal12 protein level after maltose pre-growth, followed by 6 hr of glucose growth. The graph represents the mean and SD of fluorescence measurements taken between 2 hr and 3 hr after the shift to maltose. (H) Same as (G), but for Mal11. (I) Single-cell correlation for lag time and Gal1 protein level inherited after galactose pre-growth, followed by 8 hr of glucose growth. The graph represents the mean and SD of fluorescence measurements taken between 2 hr and 3 hr after the shift to galactose.
Figure 2—figure supplement 1
Single-cell lag times for glucose-maltose shifts with pre-growth in maltose or galactose.
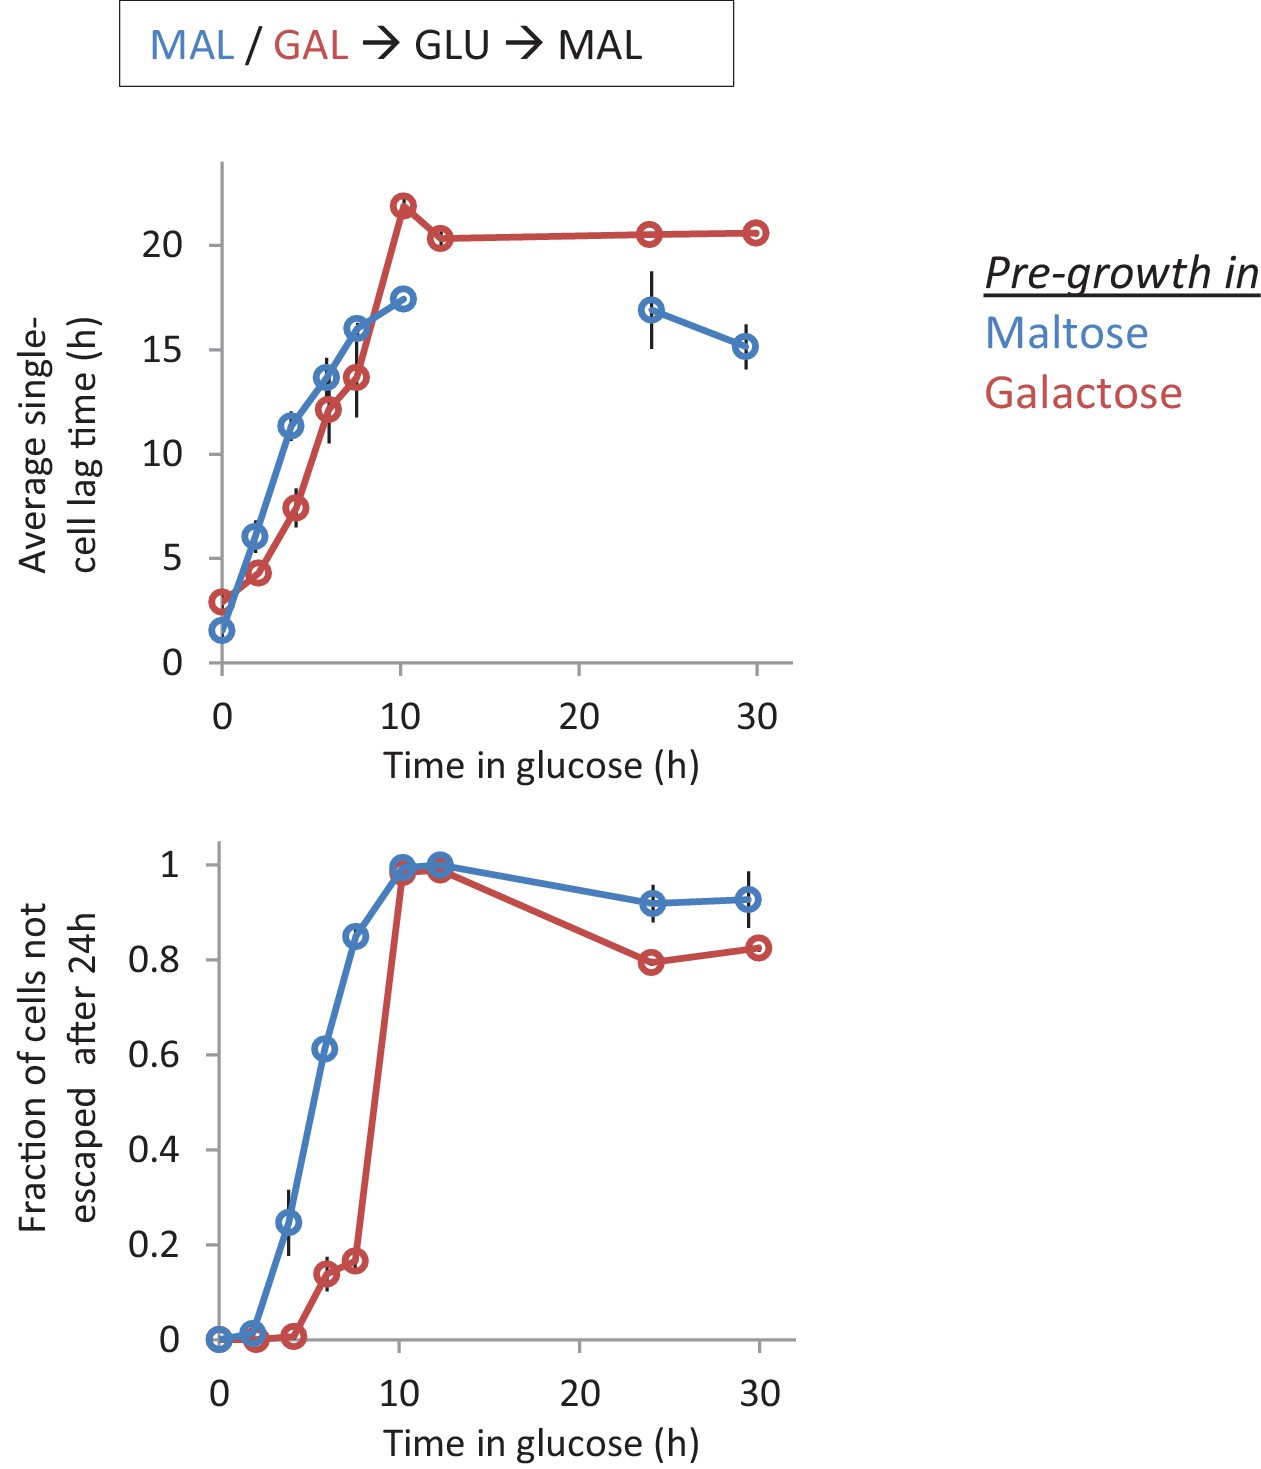
Average single-cell lag time (upper) and fraction of cells escaping (lower) is plotted against time for shifts to maltose with pre-growth in maltose (blue) or galactose (red). After maltose pre-growth followed by 12 hr glucose, none of the cells were found to escape the lag within the time frame of the experiment. This is indicated by the absence of a data point in the upper panel. The error bars represent the range for two replicates.
Figure 2—figure supplement 2
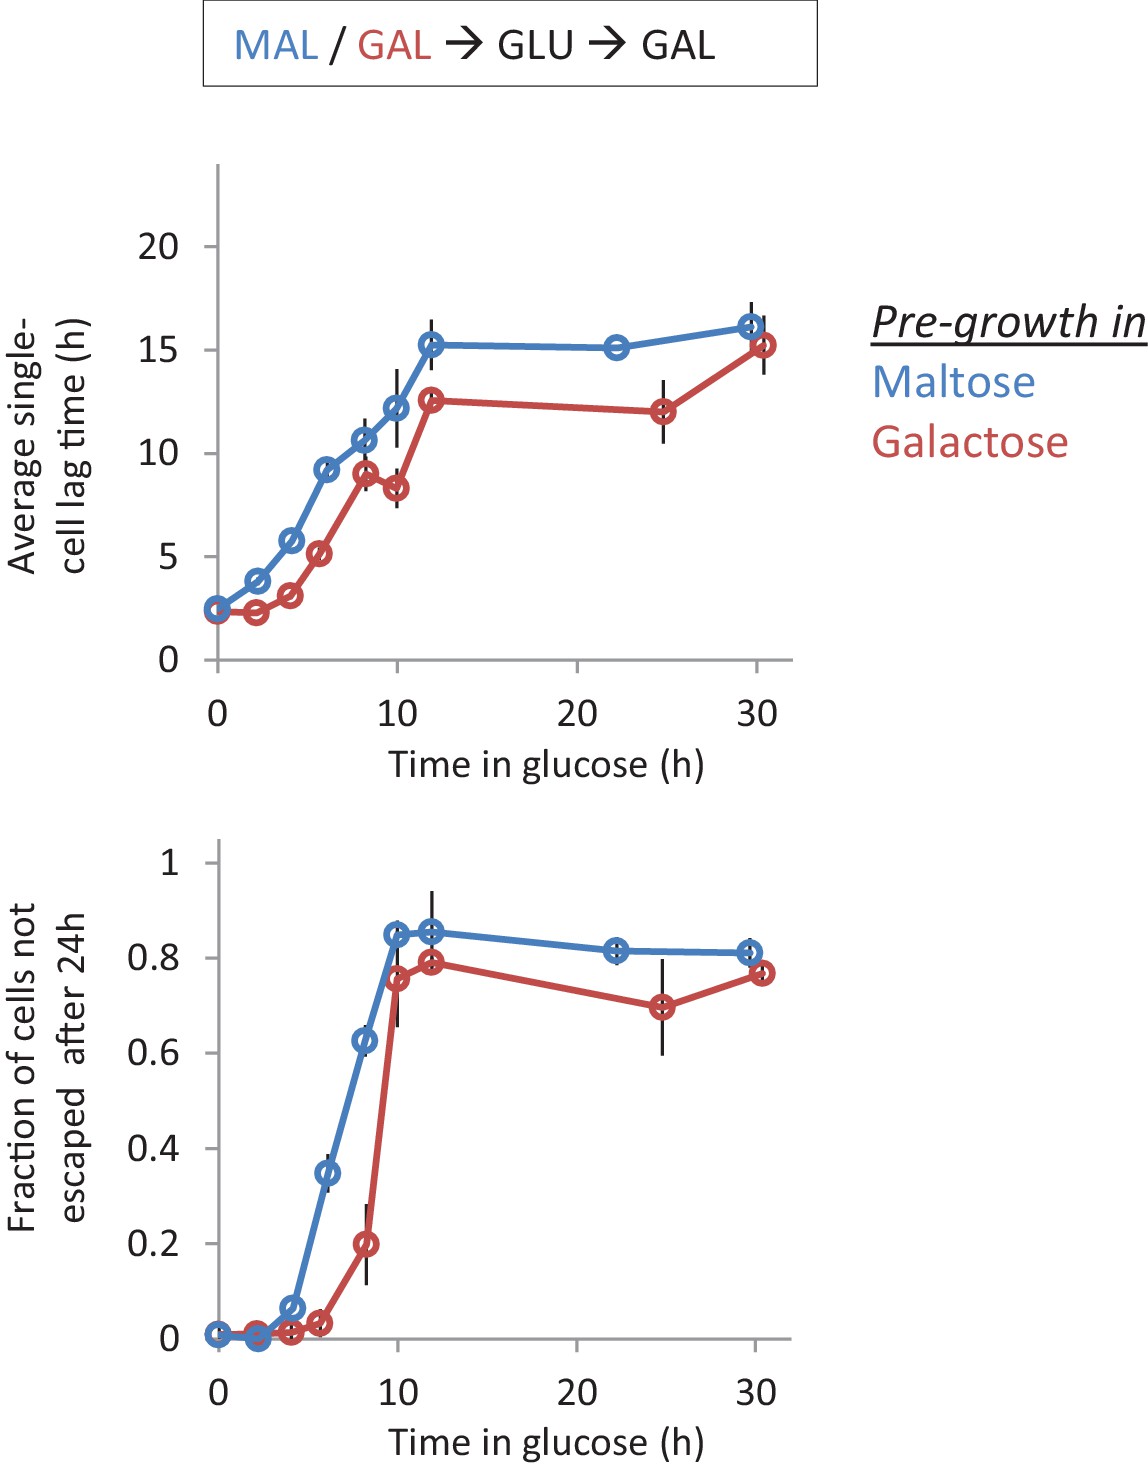
Single-cell lag times for glucose-galactose shifts with pre-growth in maltose or galactose.
Average single-cell lag time (upper) and fraction of cells escaping (lower) is plotted against time for shifts to galactose with pre-growth in maltose (blue) or galactose (red).
Figure 2—figure supplement 3
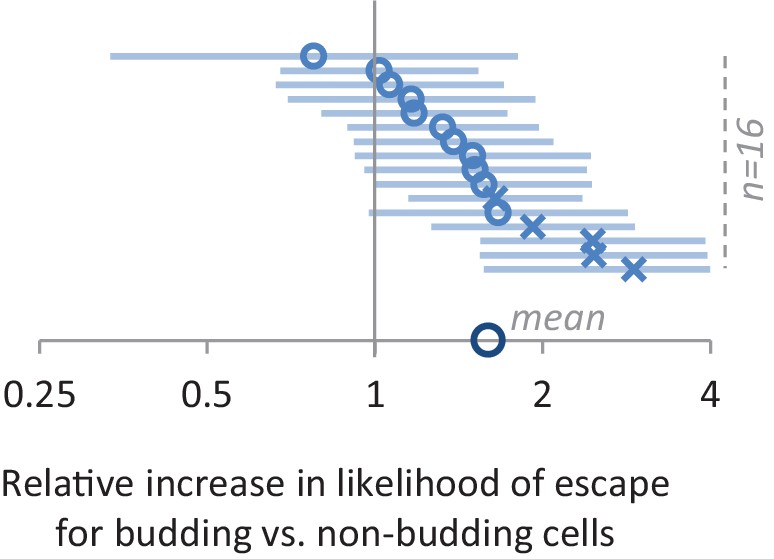
The effect of having or not having a bud on lag time.
Using the Cox proportional hazard model, we find that budding cells are on average 60% more likely to escape the lag at any given time point after the shift (data point on the x-axis). This value represents the mean across 16 different experiments (small circles and crosses represent respectively non-significant and significant results). Number of the cells in (C) and (D) is detailed in the methods section. Number of cells for each of the experiments from top to bottom is 159, 188, 184, 60, 163, 205, 206, 181, 176, 163, 146, 188, 146, 173, 173 and 169.
Figure 2—figure supplement 4
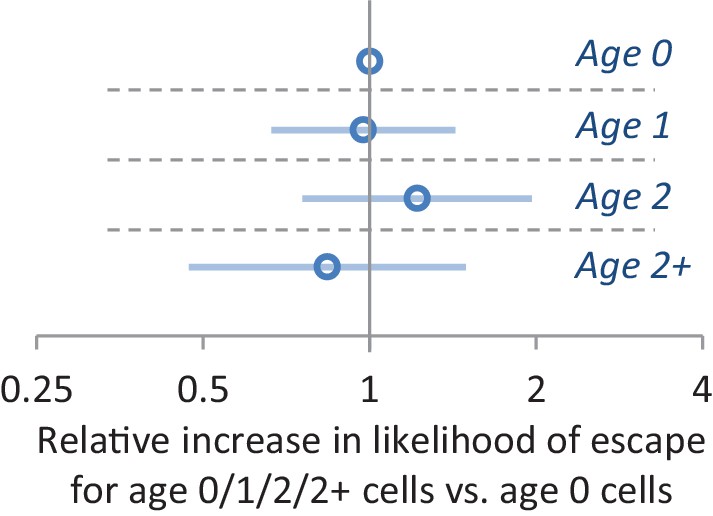
The effect of replicative age on the single-cell lag time.
The results from a Cox proportional hazard model which also takes into account budding/unbudding as a covariate is shown. After accounting for the latter variable, we find that replicate age is not predictive for lag time. In total 303 cells were scored.
Figure 3 with 7 supplements
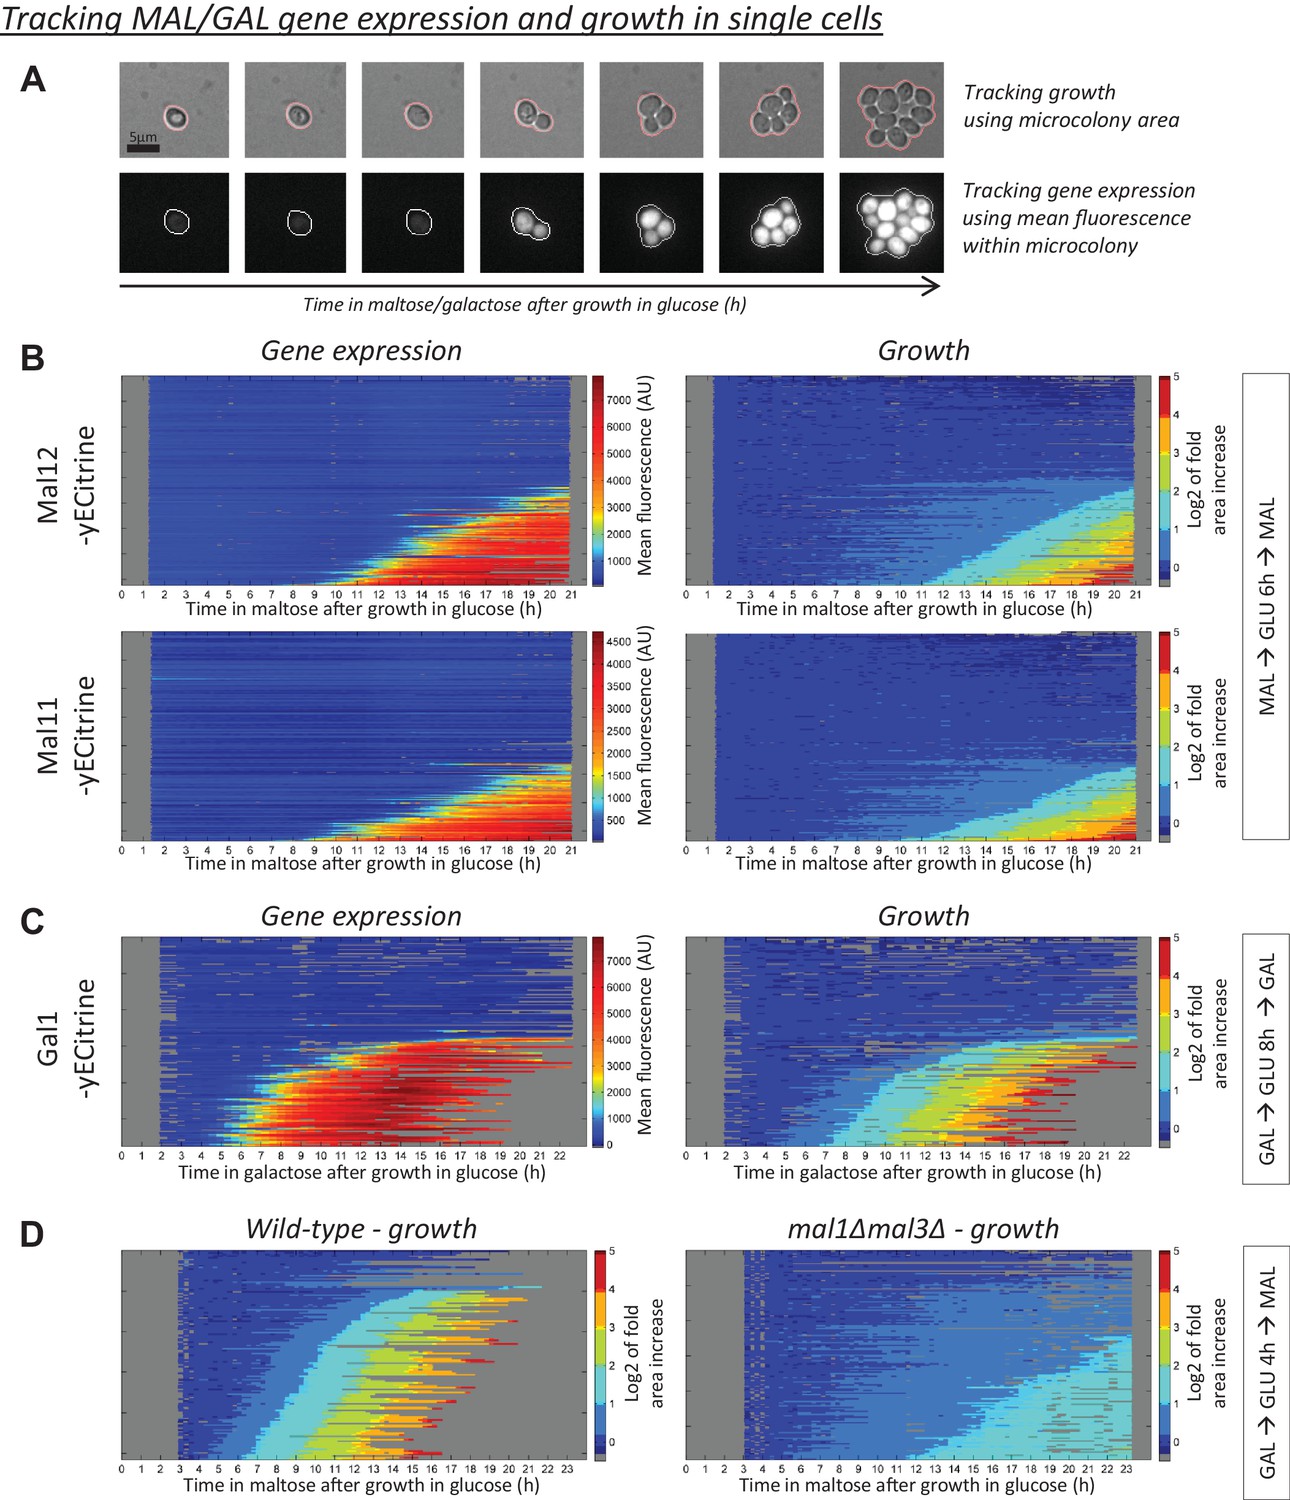
MAL(GAL) gene induction correlates with escape from the glucose-to-maltose(galactose) lag phase.
(A) Example of tracking of the area and mean fluorescence of a microcolony. All tracked microcolonies initially started out as a single (non-)budding cell. (B) Kymographs showing the evolution of (left) mean Mal12-, Mal11-yECitrine fluorescence and (right) the area of the tracked microcolonies. Cells were pre-grown in maltose, switched to glucose for 6 hr, and back to maltose. Each horizontal line represents one microcolony, with the x-axis representing time after the shift to maltose. The microcolony tracks were sorted by their area profiles. (C) Kymographs showing the evolution of (left) mean Gal1-yECitrine fluorescence and (right) the area of the tracked microcolonies. Cells were pre-grown in galactose, switched to glucose for 8 hr, and back to galactose. (D) Microcolony growth for the wild-type and a strain which has all MAL genes deleted. Cells were pre-grown in galactose, switched to glucose for 4 hr, and back to maltose.
Figure 3—figure supplement 1
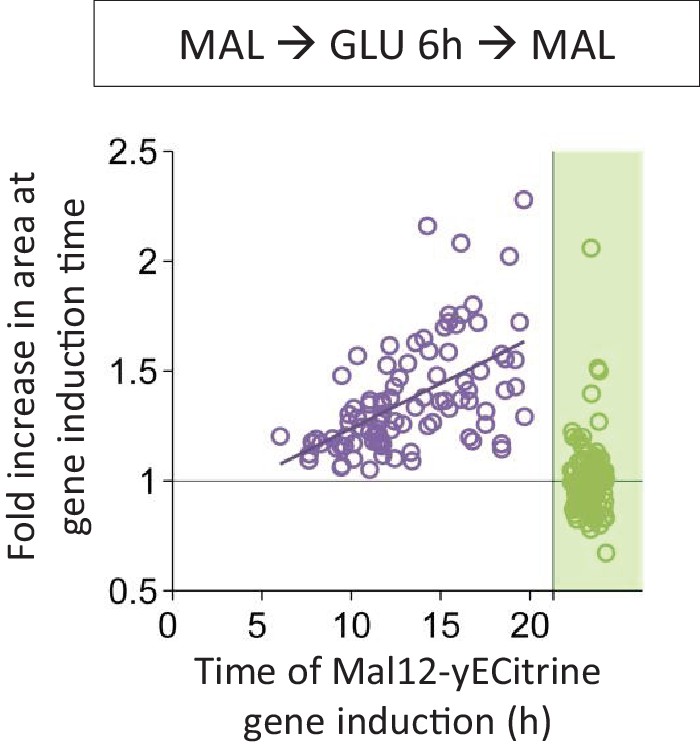
Correlation between the time of Mal12 induction and the fold area increase that occurred until this event.
Cells were pre-grown in maltose, switched to glucose for 6 hr, and back to maltose where the gene induction was tracked using a fluorescent protein fusion. Axes are broken to indicate events that could not be observed.
Figure 3—figure supplement 2
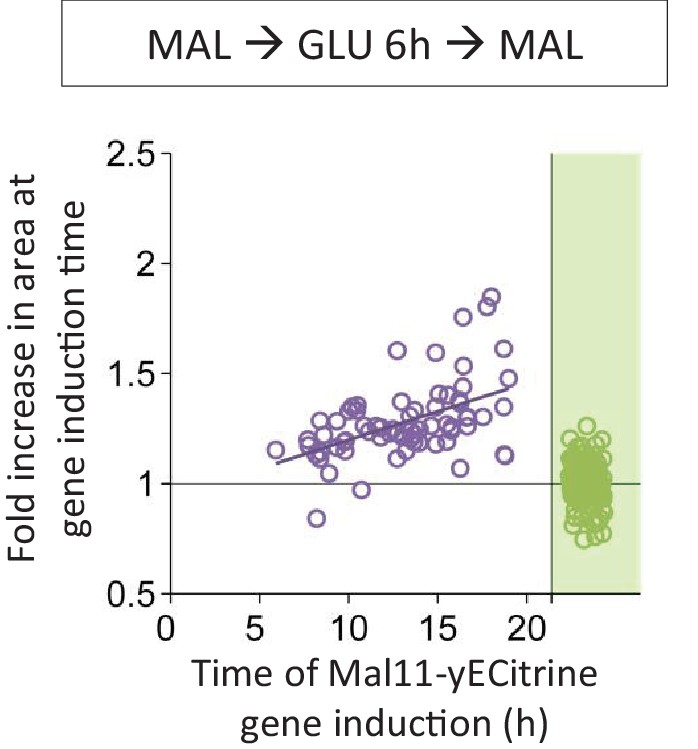
Correlation between the time of Mal11 induction and the fold area increase that occurred until this event.
Cells were pre-grown in maltose, switched to glucose for 6 hr, and back to maltose where the gene induction was tracked using a fluorescent protein fusion. Axes are broken to indicate events that could not be observed.
Figure 3—figure supplement 3
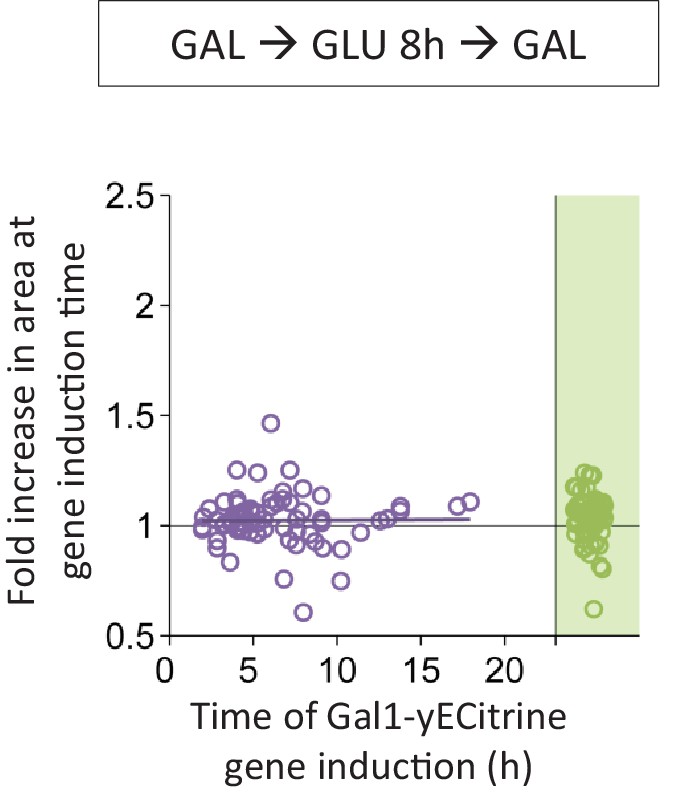
Correlation between the time of Gal1 induction and the fold area increase that occurred until this event.
Cells were pre-grown in galactose, switched to glucose for 8 hr, and back to galactose where the gene induction was tracked using a fluorescent protein fusion. Axes are broken to indicate events that could not be observed.
Figure 3—figure supplement 4
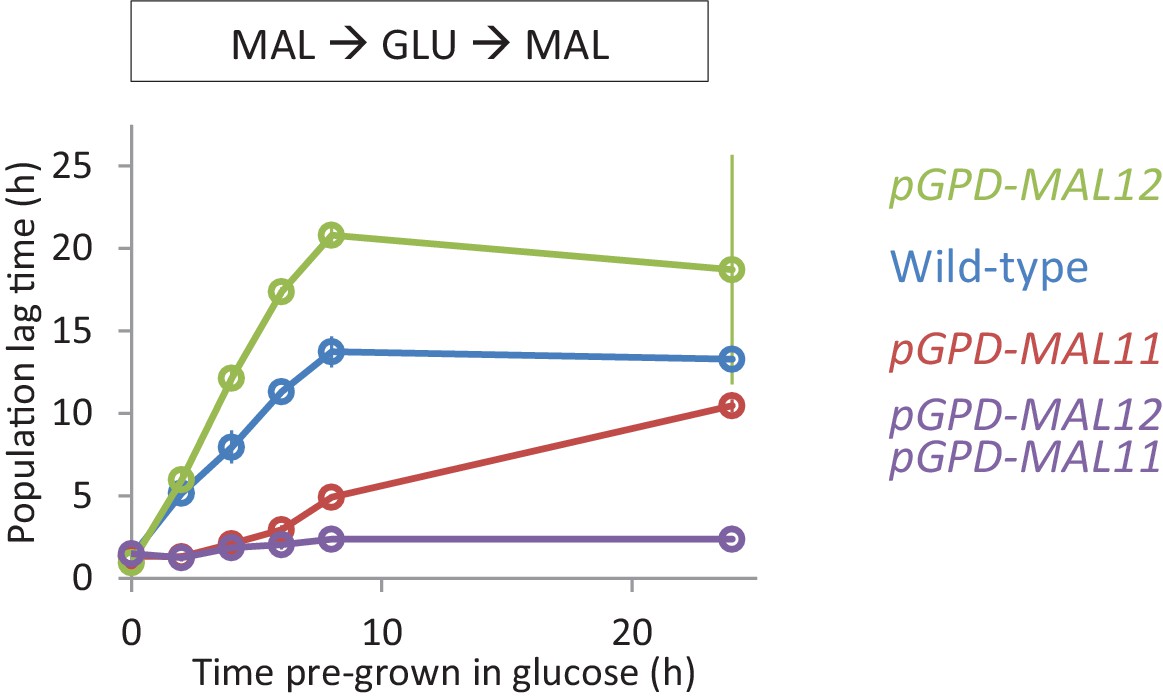
Effect of constitutive expression of the MAL genes on HDB with maltose pre-growth.
Lag time of single and dual overexpression strains of MAL11 and MAL12 is shown for glucose-maltose shifts with pre-growth in maltose.
Figure 3—figure supplement 5
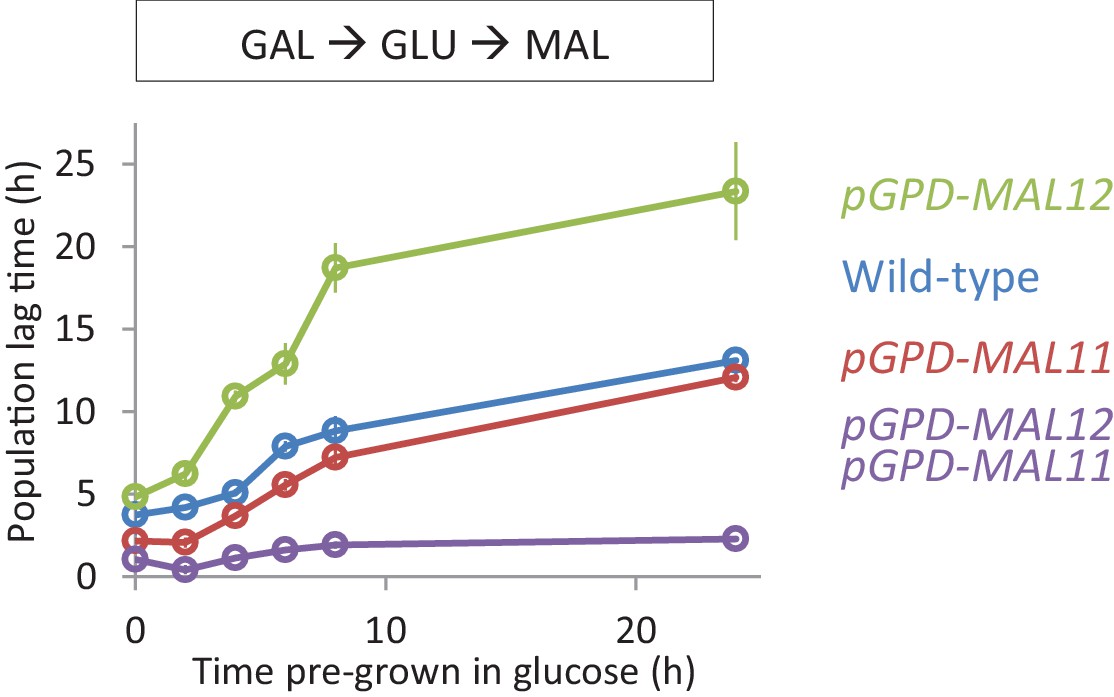
Effect of constitutive expression of the MAL genes on HDB with galactose pre-growth.
Lag time of single and dual overexpression strains of MAL11 and MAL12 is shown for glucose-maltose shifts with pre-growth in galactose.
Figure 3—figure supplement 6

A mating assay shows that, after short periods of glucose growth, cells contain factor(s) which promote rapid growth re-initiation.
Cells with opposite mating type are grown separately on either glucose or maltose. Next, these cultures are mixed and grown in glucose for 4 hr. During this time, some cells will mate and give rise to diploids. Finally, the mixed culture is transferred to maltose, and the lag times are measured. Constitutive fluorescent markers in the two parental strains allows differentiation between the three cell types (MATa, MATα and diploid).
Figure 3—figure supplement 7
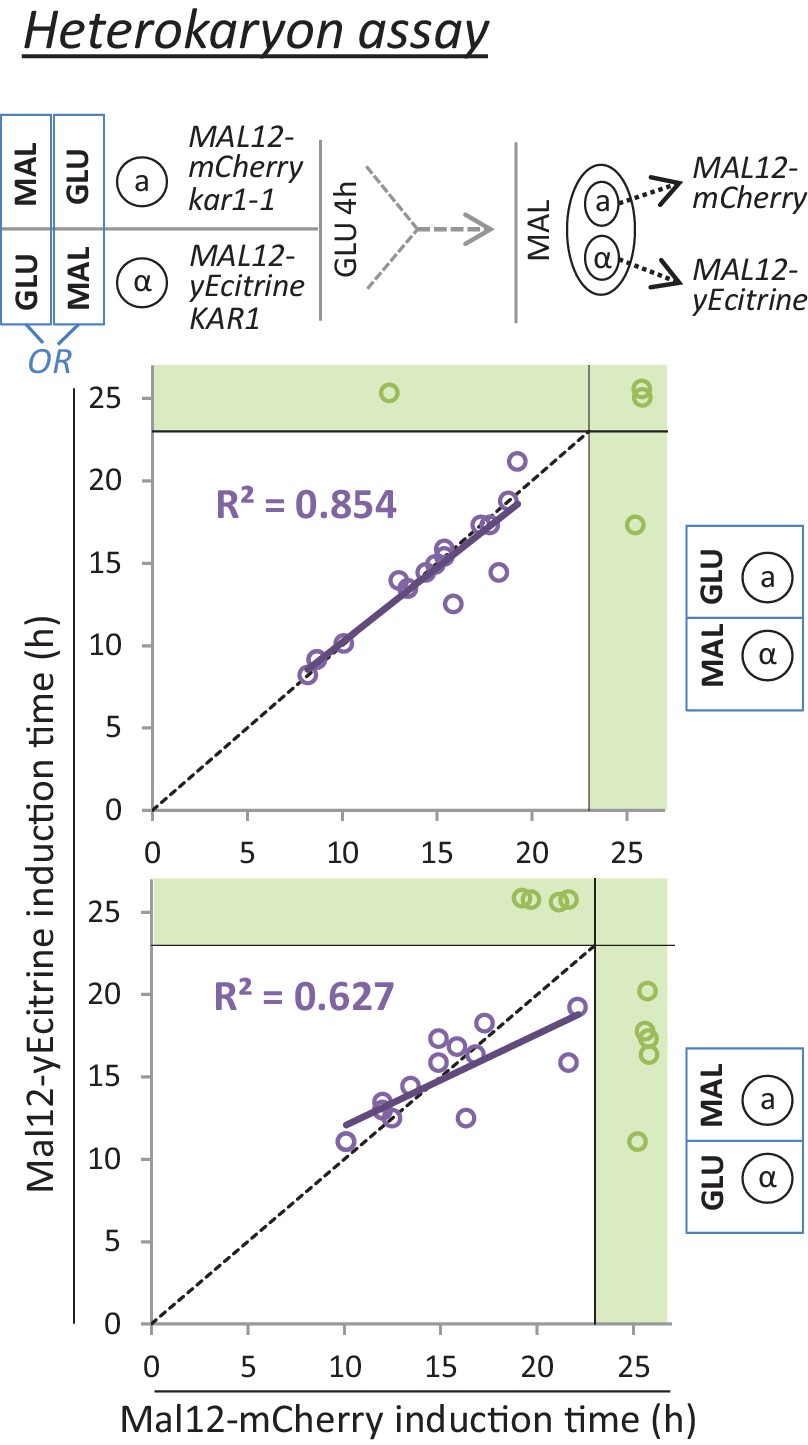
A mating assay indicates a cytoplasmic step which controls the rate of MAL gene induction.
Cells with opposite mating types and yellow or red fluorescent Mal12 protein fusions are grown separately on either glucose or maltose. Next, these cultures are mixed and grown in glucose for 4 hr. Due to kar1-1 mutation, mating involves cytoplasmic fusion but not nuclear fusion, giving rise to heterokaryons. Finally, the mixed culture containing the heterokaryons is transferred to maltose, and the induction times of the Mal12-yECitrine and Mal12-mCherry are measured for the heterokaryons.
Figure 4 with 6 supplements
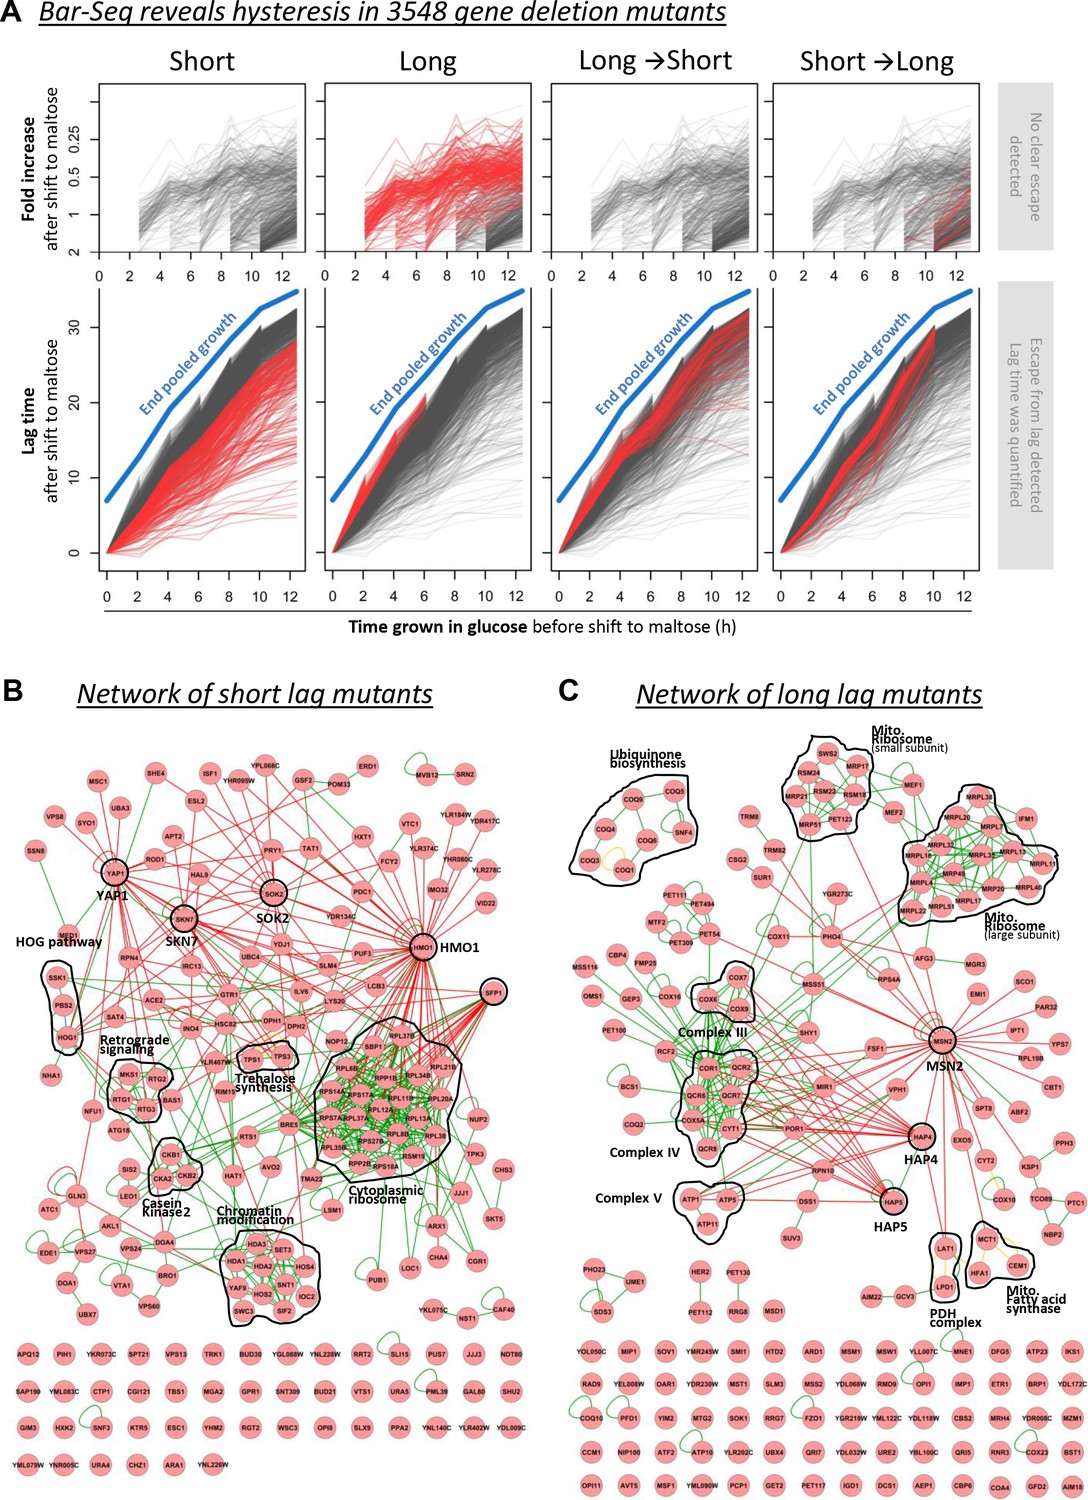
Barcode sequencing HDB dynamics in 3548 mutants.
(A) The black lines show the lag durations of all mutants for different times of pre-growth in glucose. The red lines indicate four types of mutants with (1) generally shorter lags, (2) generally longer lags, (3) relatively long lags after short glucose periods, and vice versa, (4) relatively short lags after short glucose periods, but long after long glucose periods. The quantification and visualization of these results are explained in more detail in Figure 4—figure supplement 2. (B) A physical interaction network for the genes identified as generally leading to shorter lags upon deletion. It includes DNA-protein (red lines), protein-protein (green lines) and phosphorylation (yellow lines) interactions. (C) Same as in (B), but for the genes identified as generally leading to longer lags upon deletion.
Figure 4—figure supplement 1
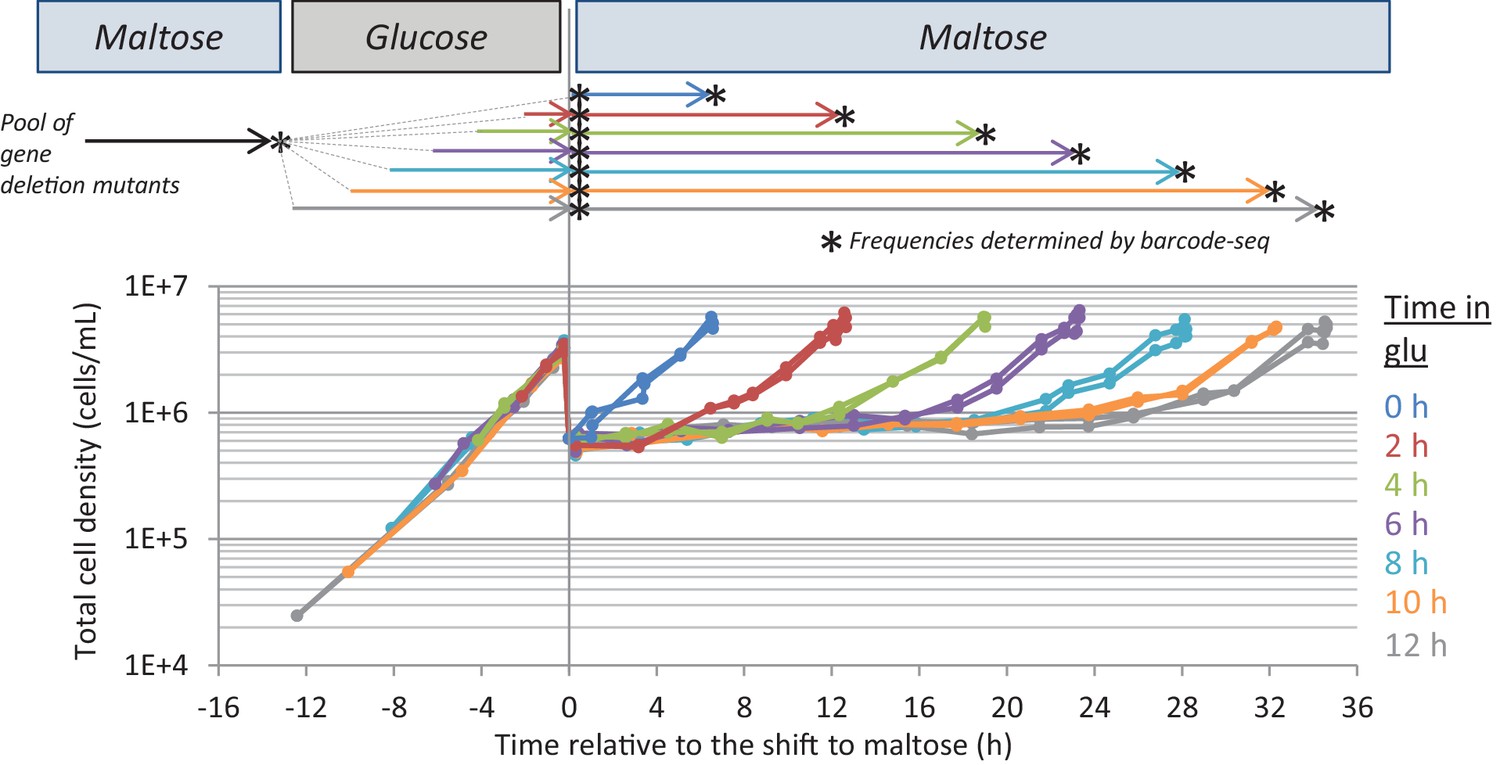
Experimental set-up of the Bar-Seq experiment.
The pool of gene deletion mutants adapted to maltose growth was transferred to glucose for different times (0, 2, 4, 6, 8, 10, 12 hr) before switching back to maltose. Samples were taken at the start and end of the different growth phases (indicated by stars) to analyze the change in proportion of each mutant in the pool. The final sample was taken when the cultures increased 8-fold after the shift to maltose. The graph shows the evolution of cell density during the experiment.
Figure 4—figure supplement 2
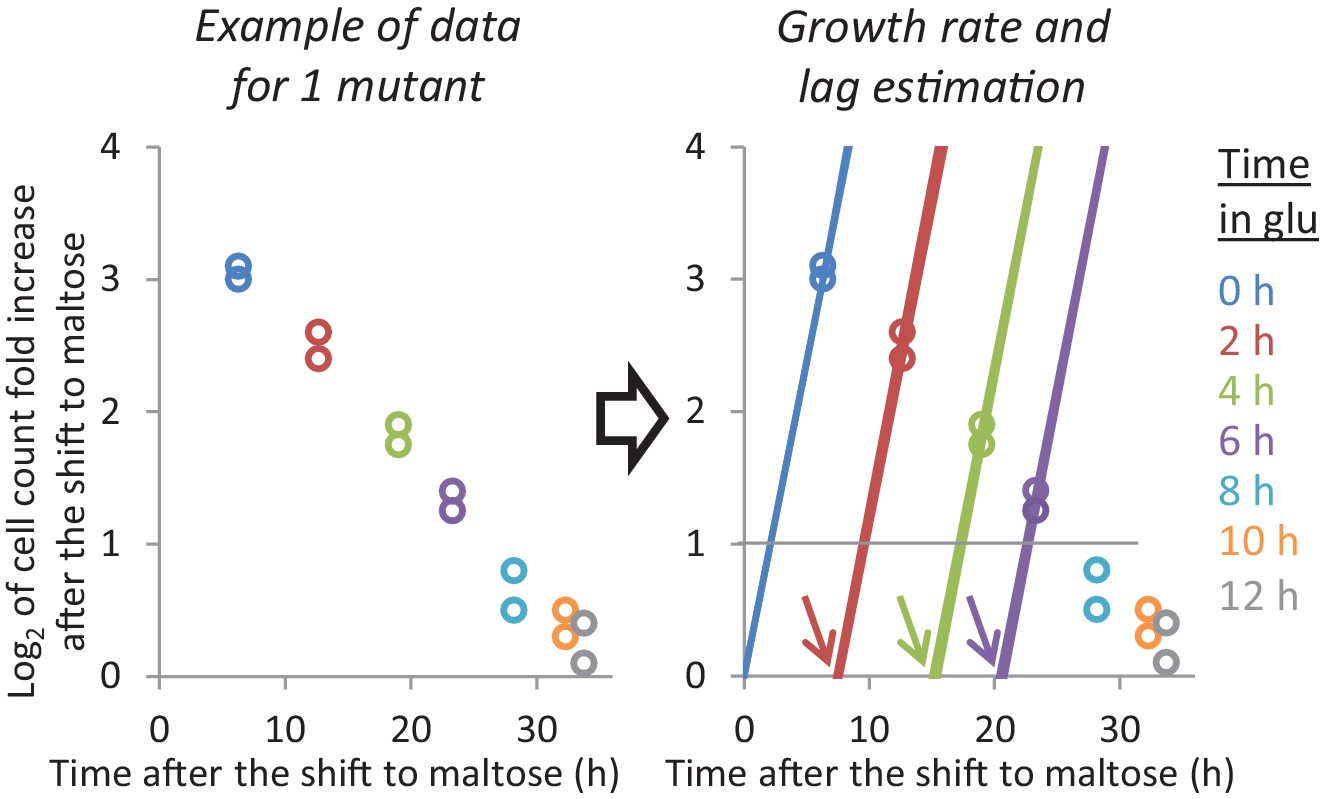
Example of the growth rate and lag time analysis for one mutant.
Given the population growth and the frequency of each mutant at the start and end of the maltose period, we can plot how much each mutant has grown when the final sample was taken. Since the ‘0h-glucose cultures’ are growing exponentially, we can estimate their maltose growth rate using just these data points. For the cultures that went through glucose, we assume that the mutants undergo a lag phase after which they grow at the same maltose growth rate. When a mutant increased 2-fold during the maltose period, we assume that it was growing exponentially at the end. In this case, we can estimate the lag time using single data points.
Figure 4—figure supplement 3

Example visualization of HDB for one mutant.
When the lag time could be determined we plot a data point in the lower panel. Otherwise, we plot the fold increase during the maltose period in the top panel. The blue line indicates the time each pool was grown in maltose, and is a measure for the maximum lag length that could be quantified for any deletion mutant.
Figure 4—figure supplement 4

A physical interaction network for the genes identified as having relatively long lags after short glucose periods, and vice versa.
The network includes DNA-protein (red lines), protein-protein (green lines) and phosphorylation (yellow lines) interactions.
Figure 4—figure supplement 5

A physical interaction network for the genes identified having relatively short lags after short glucose periods, but long after long glucose periods.
The network includes DNA-protein (red lines), protein-protein (green lines) and phosphorylation (yellow lines) interactions.
Figure 4—figure supplement 6
Validation of the BAR-Seq experiment.
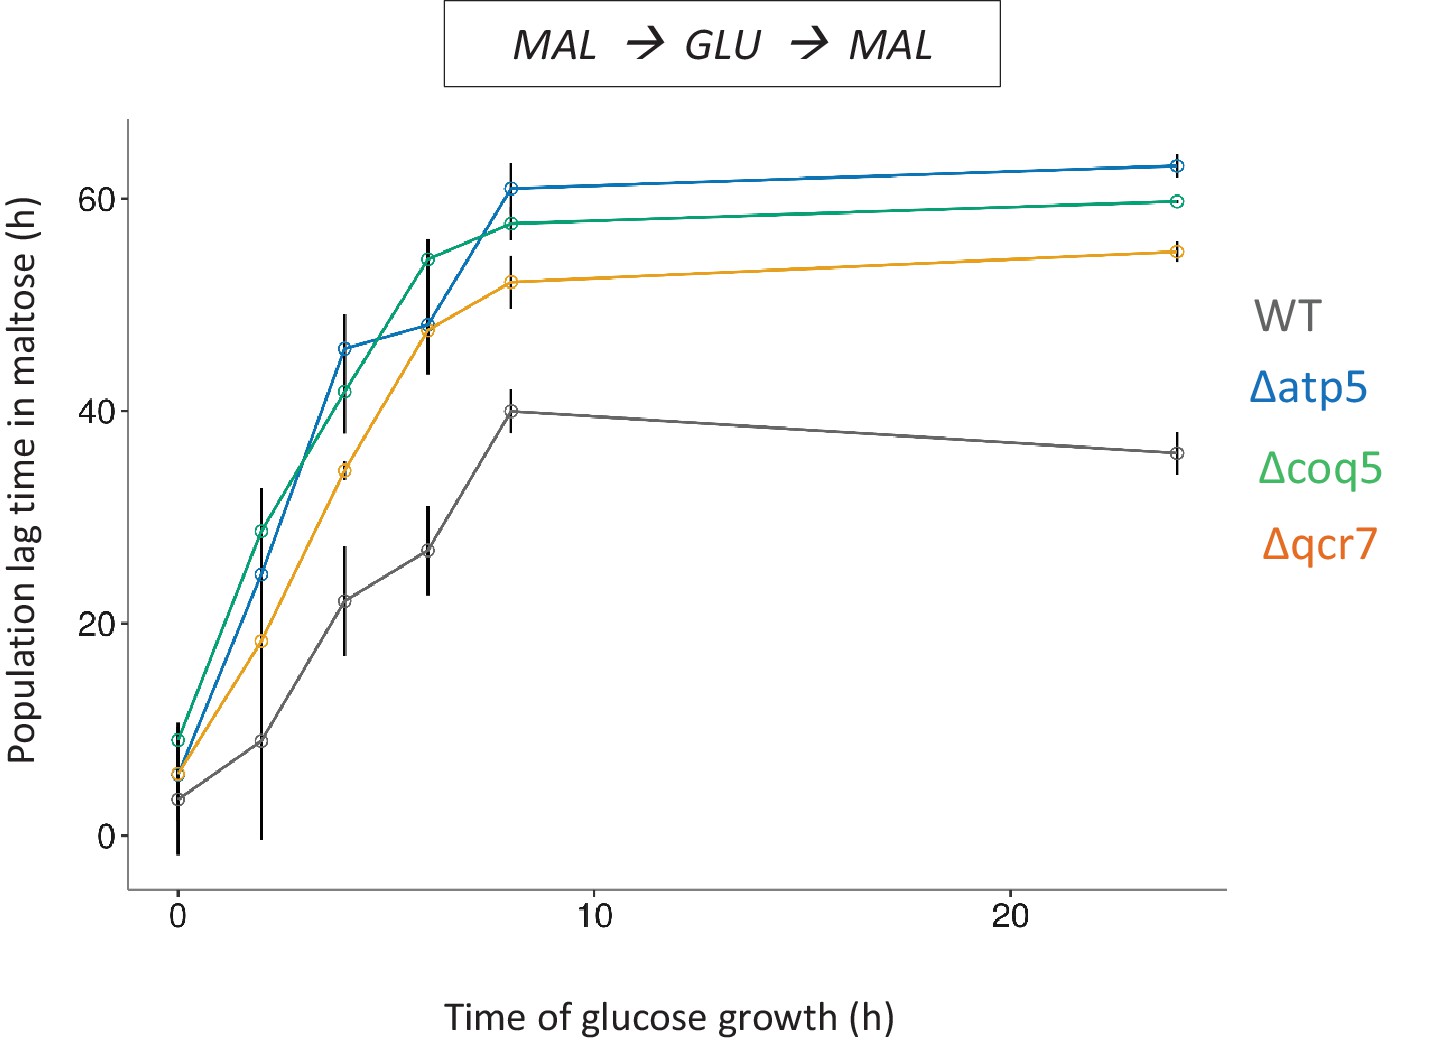
Three genes whose knock-out shows long lag in the Bar-Seq experiment, were knocked out and tested for HDB with pre-growth in maltose, growth for different durations in glucose and shift to maltose. The error bars represent standard error of the means for three biological replicates.
Figure 5 with 4 supplements
RNA-sequencing reveals cellular functions that are regulated during glucose and the lag phase.
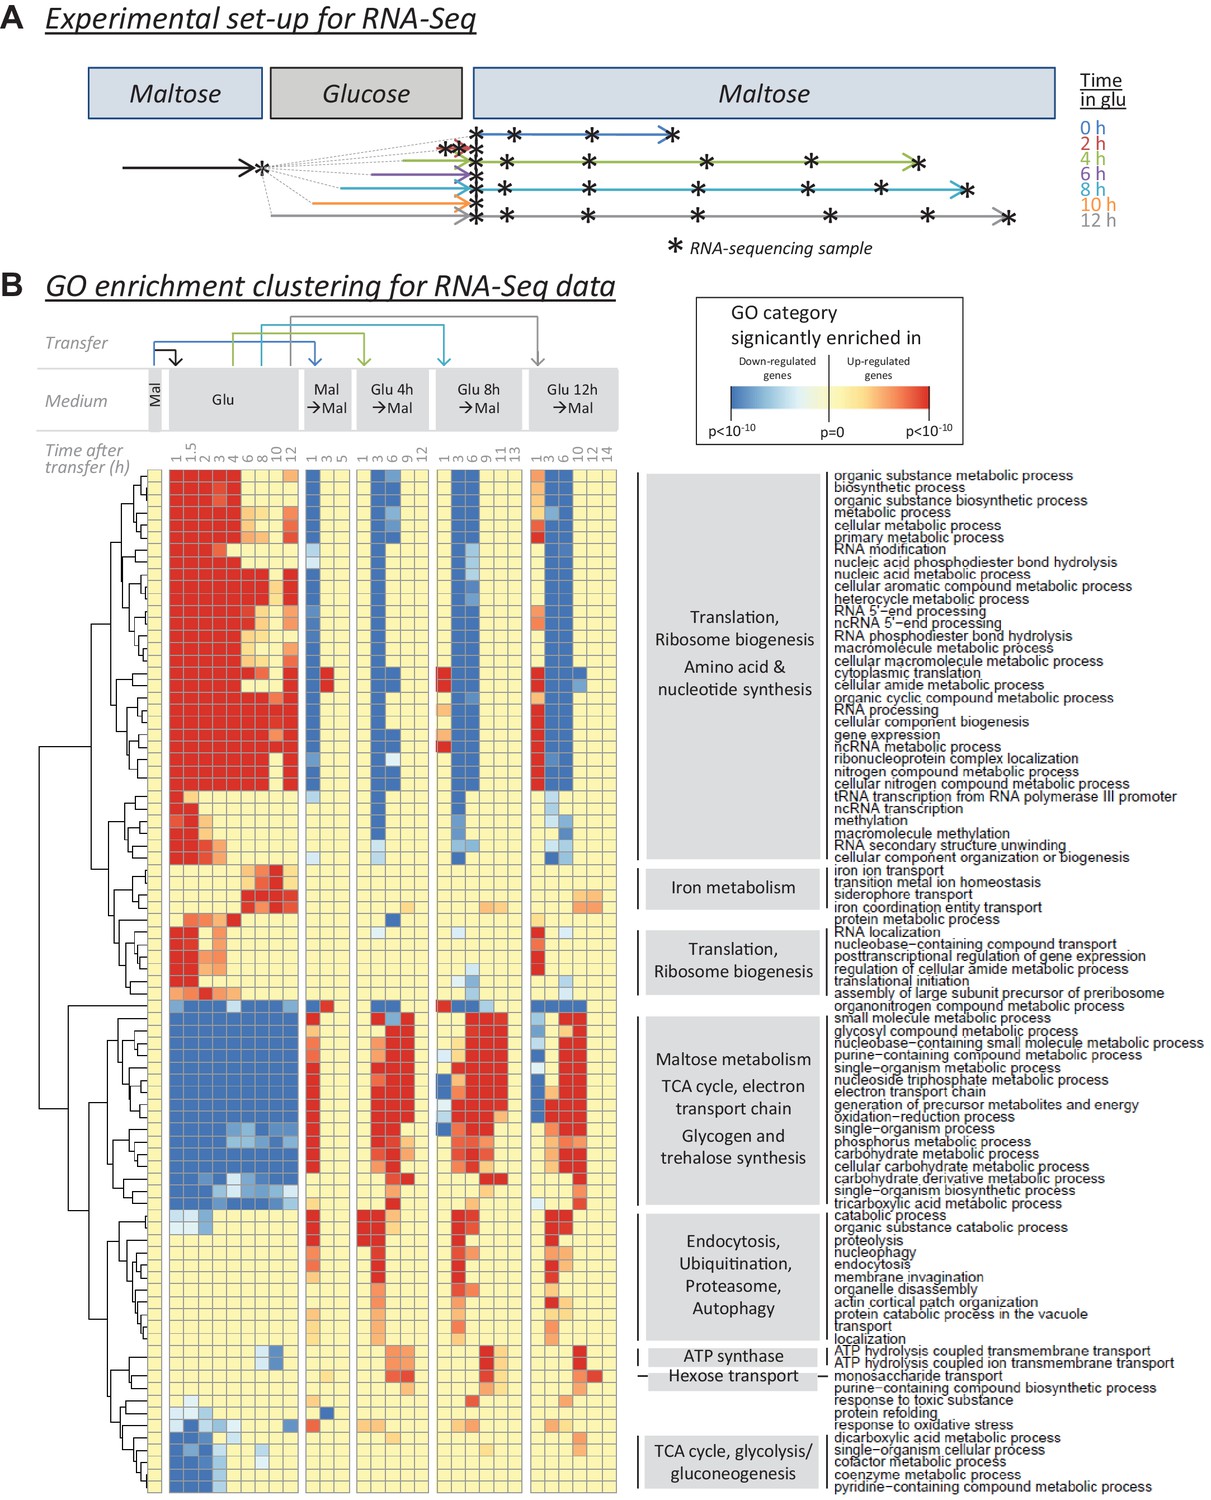
(A) Experimental set-up of the RNA-Seq experiment. The wild-type strain adapted to maltose growth was transferred to glucose for different times (0, 2, 4, 6, 8, 10, 12 hr) before switching it back to maltose. Multiple samples (indicated by stars) were taken during the different growth phases. The final sample was taken when the cultures increased 4-fold after the shift to maltose. (B) Heatmap representing a selection of non-redundant GO categories that were significantly enriched in the set of up- or downregulated genes of at least three samples throughout the experiment (Materials and Methods). The heatmap displays the GO category on the horizontal axis, the sample on the vertical axis, while the color scale indicates enrichment of the GO category. The clustering by rows reveals groups of related GO categories which are indicated on the right in grey boxes.
Figure 5—figure supplement 1
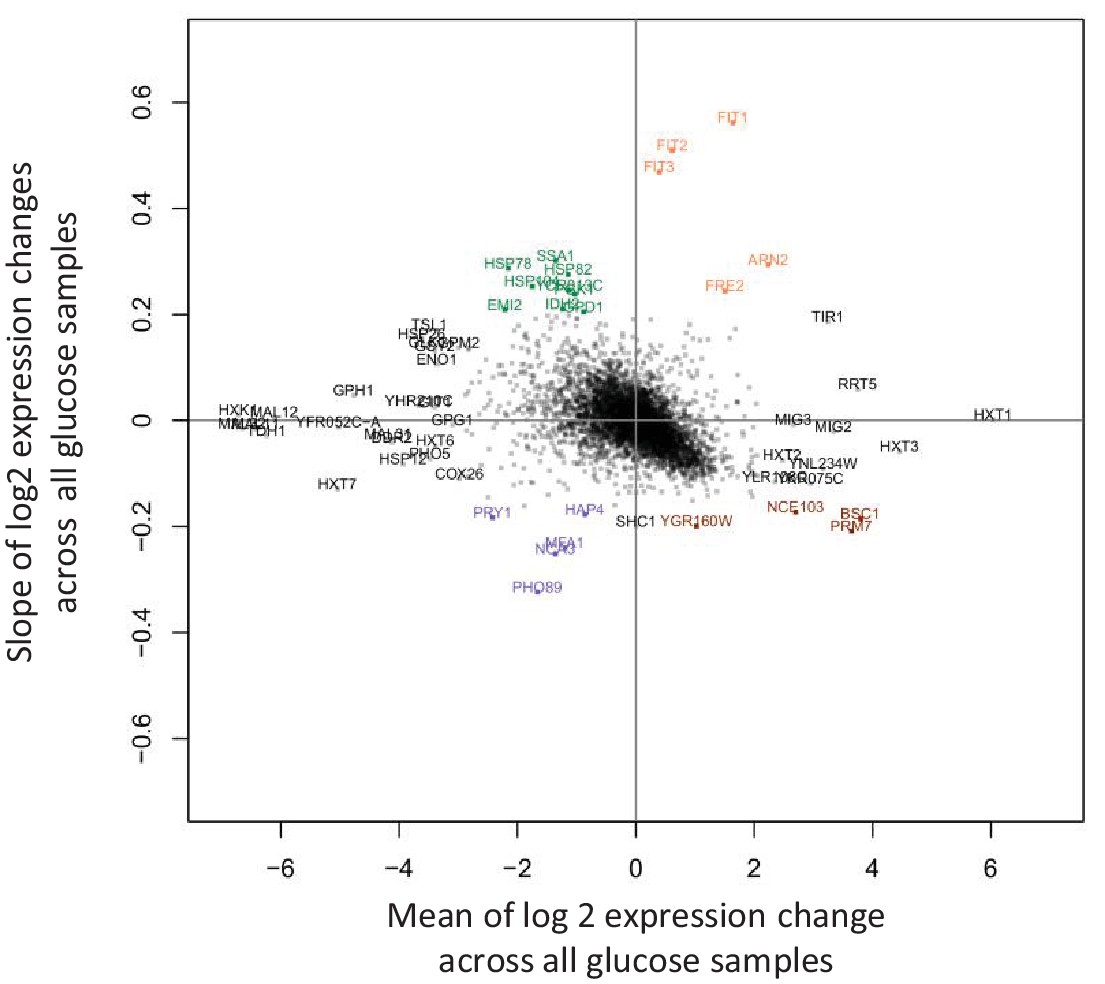
Detection of genes that show large transcriptional changes between 1 hr and 12 hr after the shift to glucose.
The slope of log2 gene expression changes versus time during glucose is plotted against the mean of these changes. All expression changes are relative to the initial sample taken during growth on maltose. Highlighted are upregulated genes with gradually increasing or decreasing expression levels during glucose (orange and brown respectively), and downregulated genes with gradually increasing or decreasing expression levels during glucose (green and blue respectively).
Figure 5—figure supplement 2
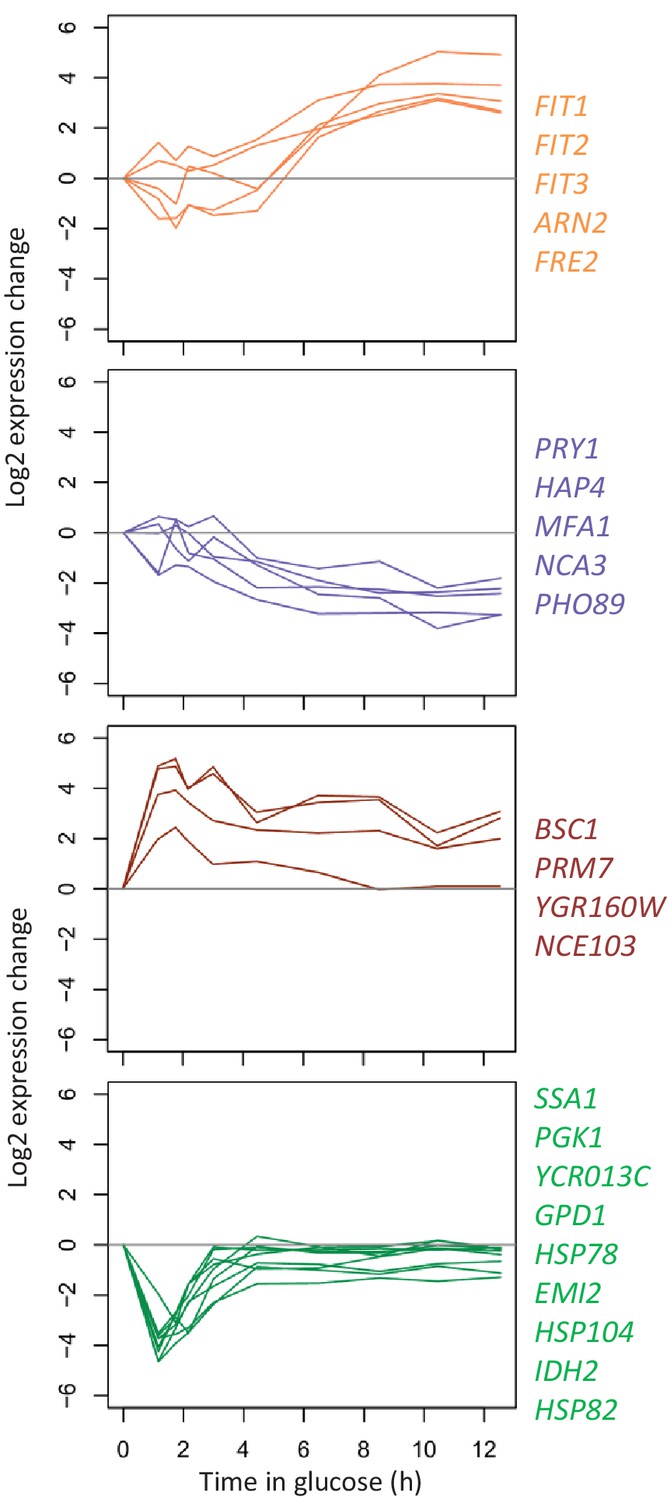
Log2 expression changes during glucose growth for the genes that show large transcriptional changes between 1 hr and 12 hr after the shift to glucose Log2 expression of the genes highlighted in Figure 5—figure supplement 1 is shown between 1 hr and 12 hr after the shift to glucose.
The color codes are the same as in Figure 5—figure supplement 1.
Figure 5—figure supplement 3
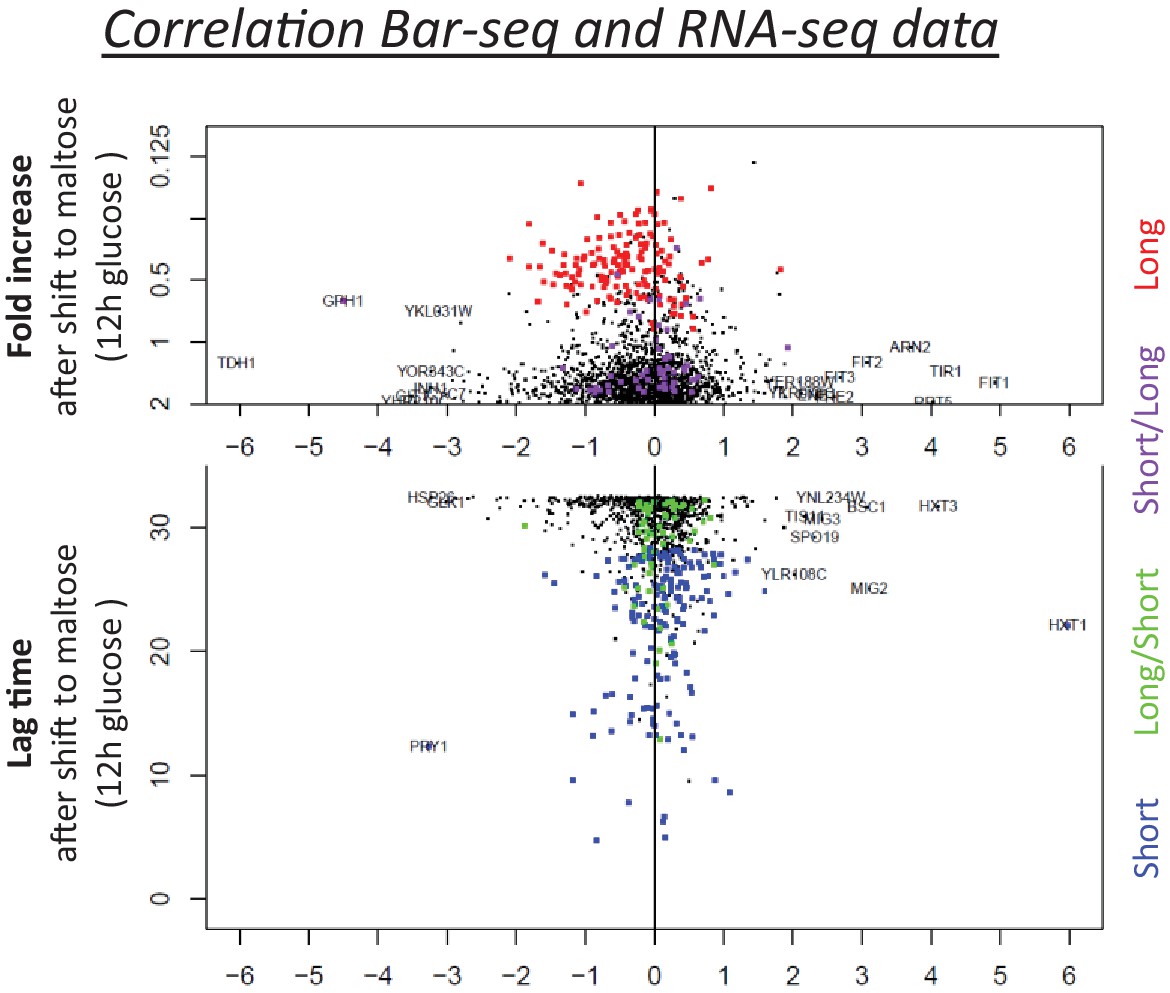
Correlation between the lag behavior upon gene deletion (Bar-Seq), and the expression change of the corresponding genes during glucose growth (RNA-Seq).
The vertical axis shows the lag time and the horizontal axis shows the expression change during glucose growth. Both measures in the two axes show the results from the samples that have been growing in glucose for 12 hr. The four types of gene deletion mutants shown in Figure 4A are highlighted (short = blue; long = red; long-then-short=green; short-then-long=purple).
Figure 5—figure supplement 4

Correlation between protein and mRNA level changes during glucose growth after pre-growth on maltose.
The protein levels are measured using flow cytometry in strains with fluorescent protein fusion constructs. The mRNA is quantified as the number of transcripts mapped to the target gene per one million reads (TPM). Cells are pre-grown in maltose media and afterwards shifted to glucose. At the shown time points in glucose the ratio of protein (or mRNA) level to the level at the end of maltose pre-growth is calculated.
Figure 6 with 3 supplements
Decrease of respiratory protein levels during glucose growth correlate with HDB.
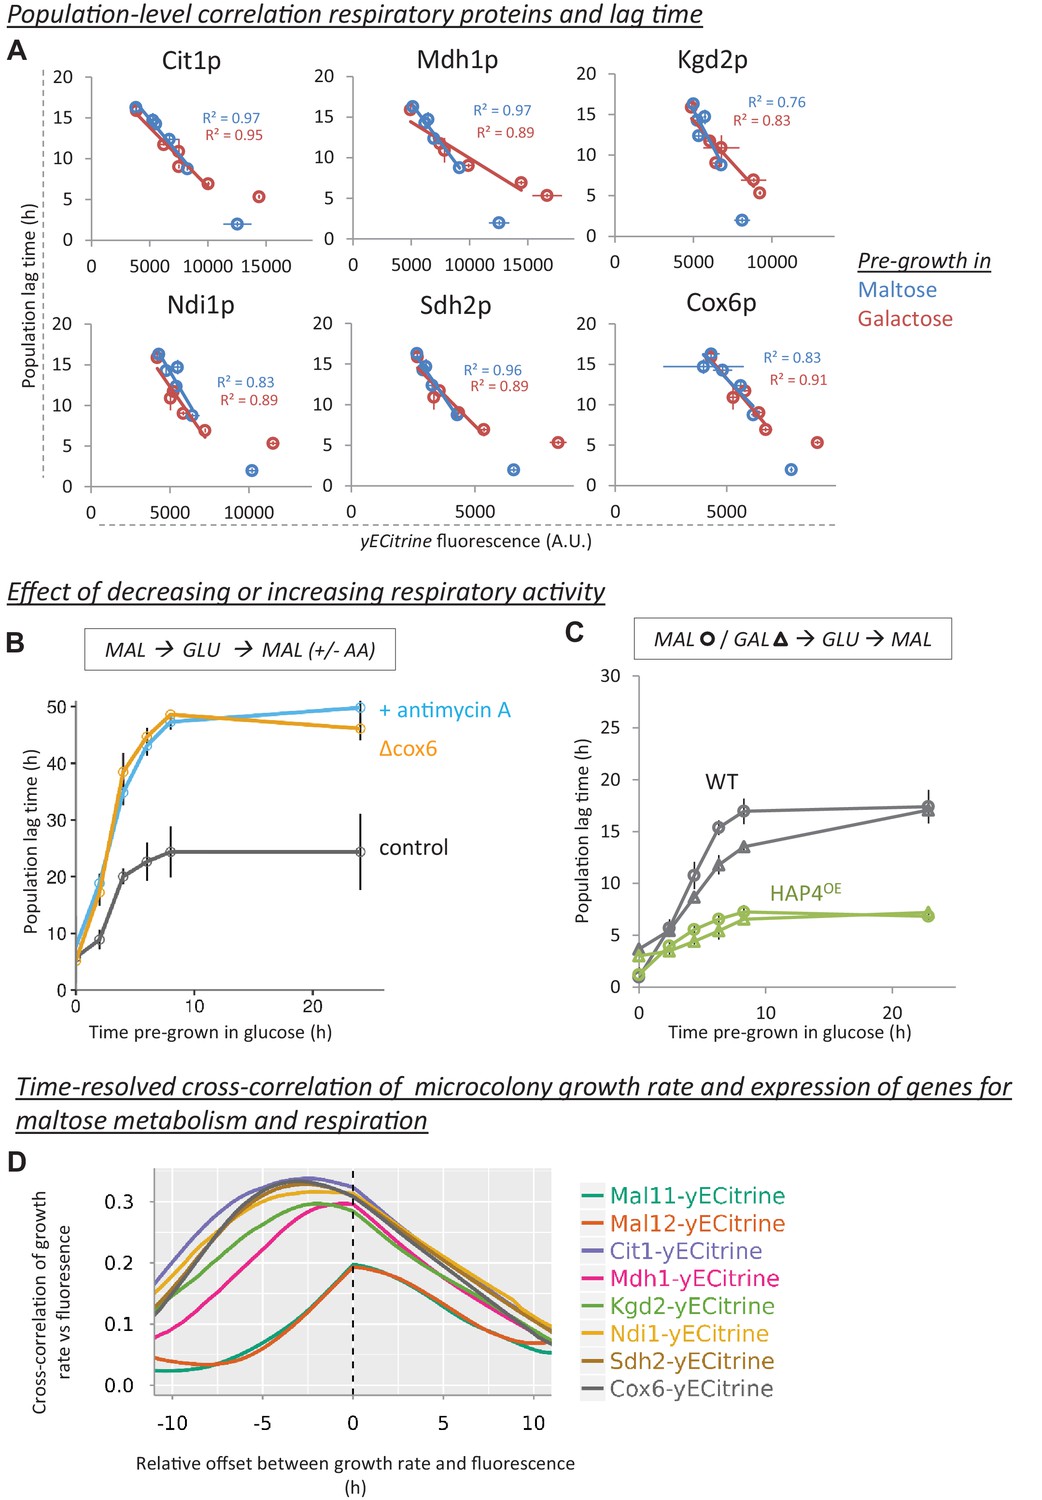
(A) Population-level correlation between respiratory protein levels of Cit1-, Mdh1-, Kgd2-, Ndi1-, Sdh2- and Cox6-yECitrine and the lag time. Lag times and respiratory protein levels are correlated after pre-growth in maltose or galactose. The cultures that did not experience glucose (steady-state maltose or galactose) were not included in the correlations. The error bars for flow cytometry represent the range for two replicates. (B) The effect of decreasing respiratory activity on HDB. Two methods were used to lower respiratory activity: chemical inhibition by antimycin A (µg/ml) added after shift to maltose and a respiratory mutant strain (cox6Δ). The error bars represent SEM for three replicates. (C) The effect of increasing respiratory activity on HDB. An overexpression strain of HAP4 showing increased respiratory capacity was compared to the wild-type. Both strains were pre-grown in either maltose (circles) or galactose (triangles) before the transfer to glucose, and finally maltose. The error bars represent the range for two replicates. (D) Induction of respiratory proteins, but not maltose genes, is an early predictor of escape from the lag phase. Expression of Mal11-, Mal12-, Cit1-, Mdh1-, Kgd2-, Ndi1-, Sdh2- and Cox6-yECitrine is quantified in single cells which will grow into microcolonies through the lag phase. The graphs show the time-resolved cross-correlation between microcolony growth rate and protein expression. For Cox6-yECtirine and Cit1-yECtirine, the cross-correlation shows a peak around 5 hr, meaning that in average, expression of these proteins anticipates growth resumption 5 hr later. However, for maltose genes the peak is located slightly around 0 hr, which implies that induction of these proteins coincides with growth resumption. Number of the cells is detailed in the methods section.
Figure 6—figure supplement 1
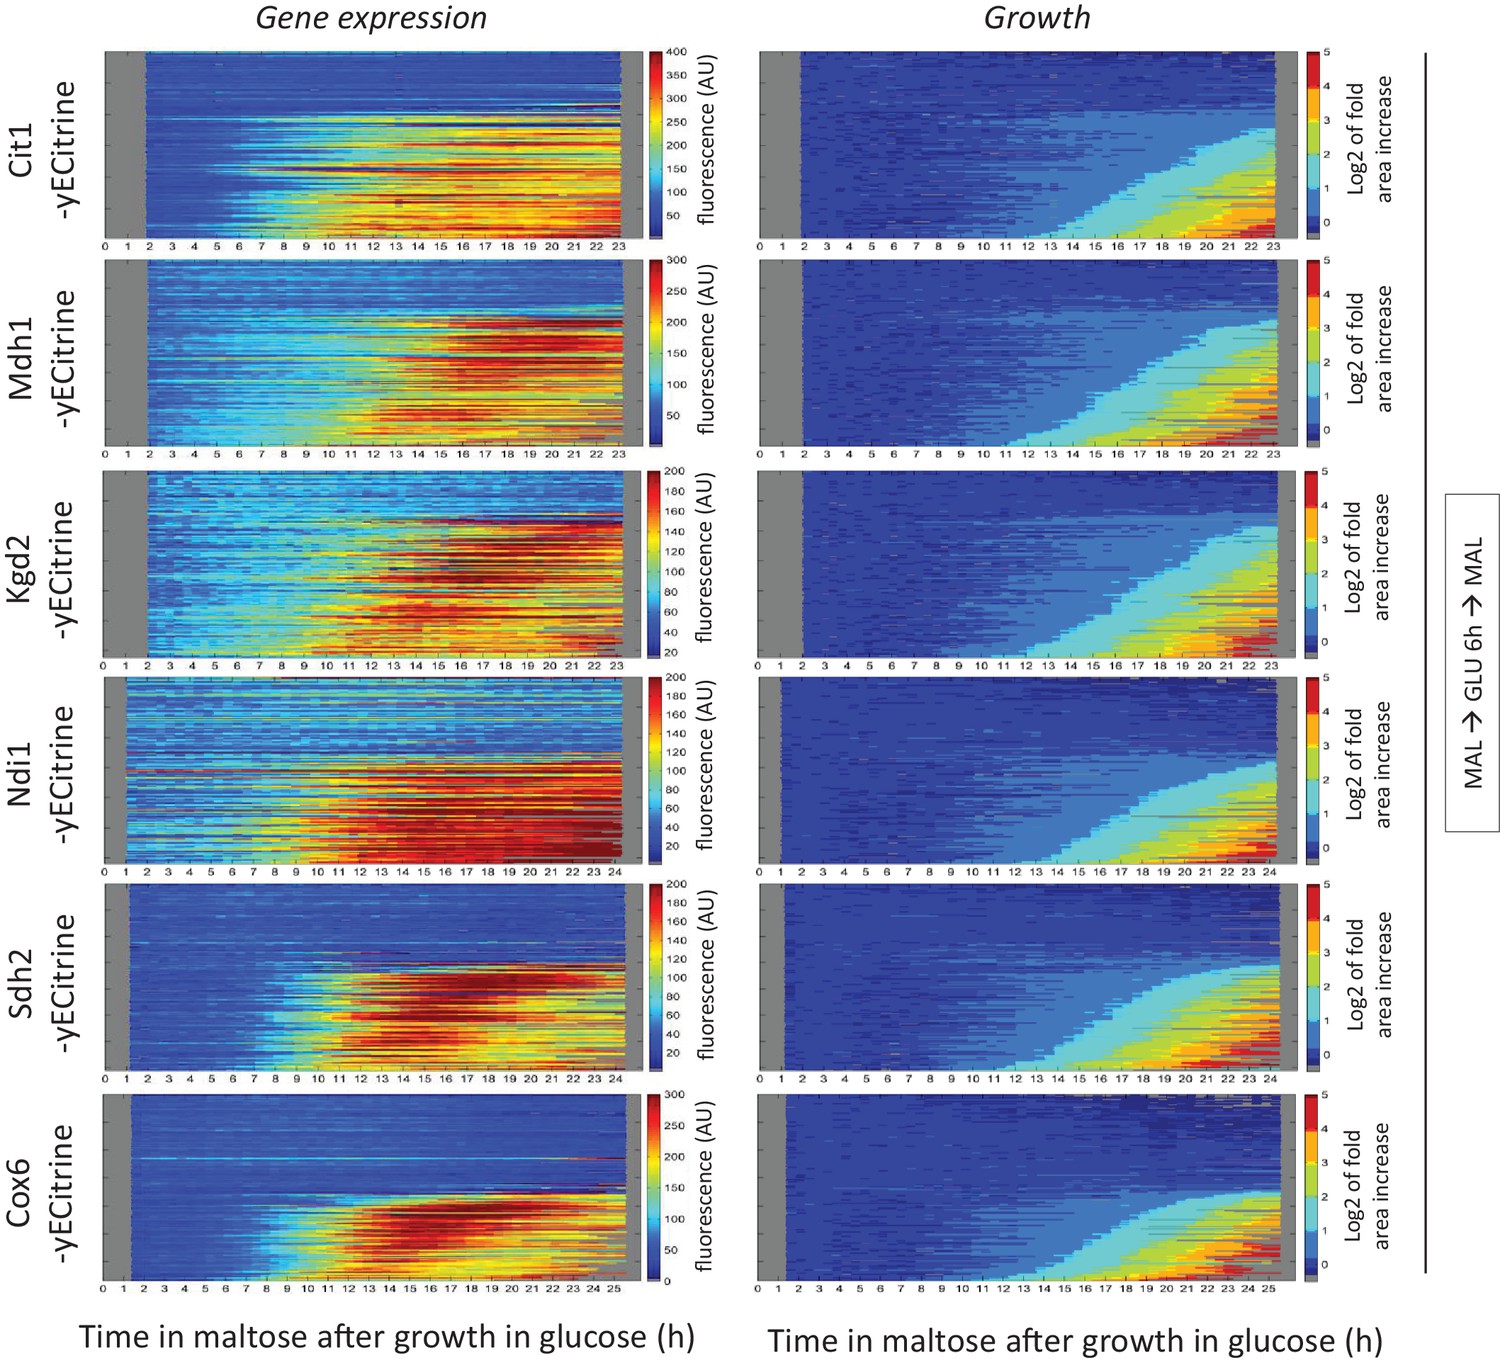
Tracking respiratory gene induction during the lag phase.
Kymographs showing the evolution of (left) Cit1-, Mdh1-, Kgd2-, Ndi1-, Sdh2- and Cox6-yECitrine fluorescence and (right) the area of these tracked microcolonies. Cells were pre-grown in maltose, switched to glucose for 6 hr, and back to maltose. The microcolony tracks were sorted by their area profiles.
Figure 6—figure supplement 2

Induction of respiratory genes for different glucose pre-growth times.
Cells were pre-grown in maltose, switched to glucose for 4, 8 and 12 hr, and switched back to maltose again. Level of transcripts for each gene was quantified as number of the reads mapped to the target gene, per one million reads. Transcript levels are shown at the end of glucose pre-growth and through the lag phase upon shift to maltose.
Figure 6—figure supplement 3
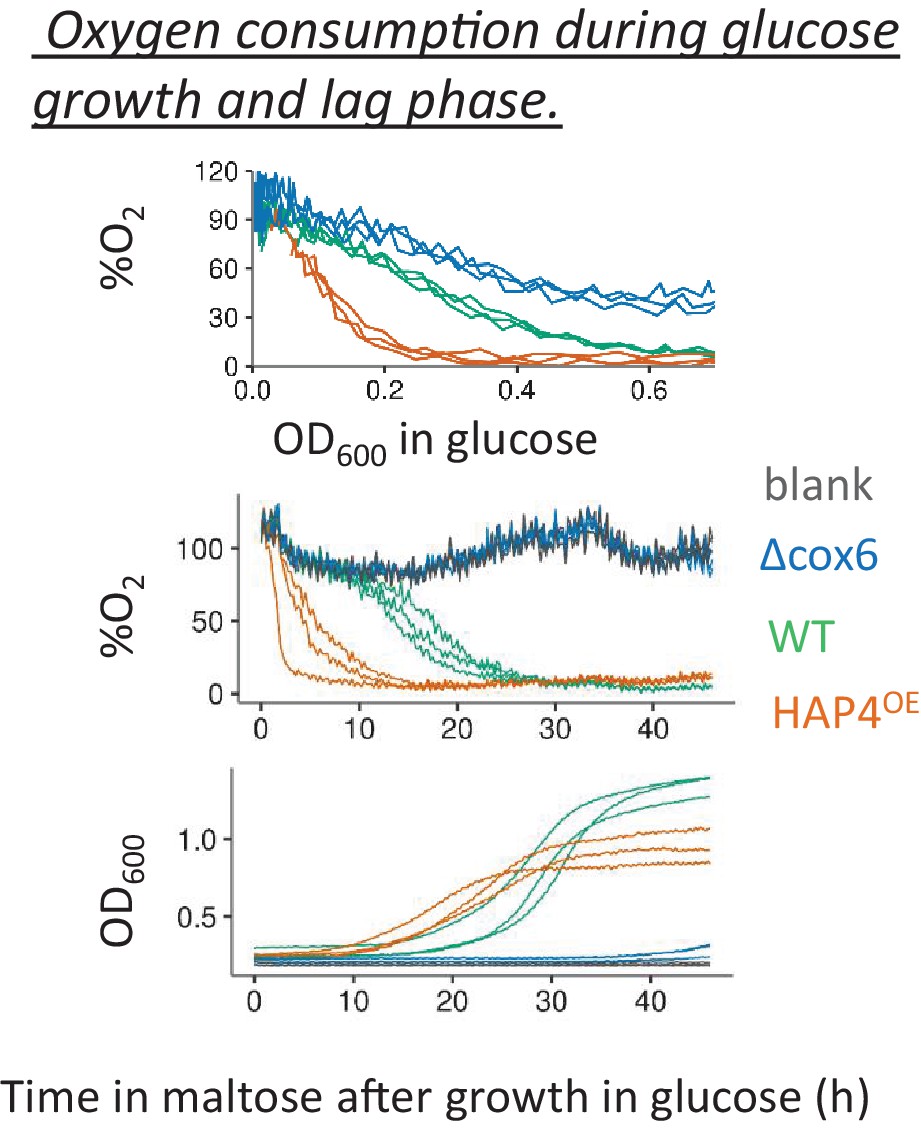
Oxygen consumption during glucose growth and lag phase.
Percentage of dissolved oxygen in the media inoculated with strains with lower (cox6 Δ) and higher (HAP4OE) respiratory activity was compared against that of wild-type during glucose growth (top panel) and during lag phase upon shift to maltose after pre-growth in glucose (middle panel). The population density during the lag phase is shown in the bottom panel.
Tables
Key resources table
| Reagent type (species) or resource | Designation | Source or reference | Identifiers | Additional information |
|---|---|---|---|---|
| Strain (S. cerevisiae) | BY4742 | PMID: 9483801 | S288c MATalpha; his3Δ1 leu2Δ0 lys2Δ0 ura3Δ0 | |
| Strain (S. cerevisiae) | BY4741 | PMID: 9483801 | S288c MATa his3Δ1 leu2Δ0 met15Δ0 ura3Δ0 | |
| Strain (S. cerevisiae) | KV1042 | PMID: 20471265 | BY4741 MAL13:: HygR-MAL63_c9 | |
| Strain (S. cerevisiae) | KV1156 | PMID: 20471265 | BY4742 MAL13:: HygR-MAL63_c9 | |
| Strain (S. cerevisiae) | AN62 | PMID: 24453942 | KV1156 SAL1+ | |
| Strain (S. cerevisiae) | AN63 | PMID: 24453942 | AN62 mating type switched to MATa | |
| Strain (S. cerevisiae) | KV2469 | This study | KV1042 kar1-1 | |
| Strain (S. cerevisiae) | MC4 | This study | AN63 CIT1-yECitrine | |
| Strain (S. cerevisiae) | MC19 | This study | AN63 MDH1-yECitrine | |
| Strain (S. cerevisiae) | BC55 | This study | AN63 NDI1-yECitrine | |
| Strain (S. cerevisiae) | BC56 | This study | AN63 SDH2-yECitrine | |
| Strain (S. cerevisiae) | BC60 | This study | AN63 COX6-yECitrine | |
| Strain (S. cerevisiae) | BC72 | This study | AN63 KGD2-yECitrine | |
| Strain (S. cerevisiae) | AN73 | PMID: 24453942 | AN63 MAL12-yECitrine | |
| Strain (S. cerevisiae) | AN77 | PMID: 24453942 | AN63 MAL11-yECitrine | |
| Strain (S. cerevisiae) | AN104 | PMID: 24453942 | AN63 pGPD-MAL11 | |
| Strain (S. cerevisiae) | AN105 | PMID: 24453942 | AN63 pGPD-MAL12 | |
| Strain (S. cerevisiae) | AN107 | PMID: 24453942 | AN63 pGPD-MAL11, pGPD-MAL12 | |
| Strain (S. cerevisiae) | JHH2 | This study | KV1156 YRO2_intergentic_loc:: pGPD-mCherry | |
| Strain (S. cerevisiae) | JHH3 | This study | KV1042 YRO2_ intergentic_loc:: pGPD-yECitrine | |
| Strain (S. cerevisiae) | JHH9 | This study | JHH2 x JHH 3 | |
| Strain (S. cerevisiae) | JHH19 | This study | KV2469 Htb2:CFP, MAL12:mCherry | |
| Strain (S. cerevisiae) | JHH22 | This study | KV1156 Htb2:CFP, MAL11:yECitrine | |
| Strain (S. cerevisiae) | KV1908 | This study | BY4741 MAL1x::KanMX, MAL3x::LEU2 | |
| Strain (S. cerevisiae) | GP77 | This study | AN63 ATP5::KanMX | |
| Strain (S. cerevisiae) | GP83 | This study | AN63 COQ5::KanMX | |
| Strain (S. cerevisiae) | GP107 | This study | AN63 QCR7::KanMX | |
| Strain (S. cerevisiae) | GP89 | This study | AN63 COX6::KanMX | |
| Strain (S. cerevisiae) | L-1374 | PMID: 19840116 | ||
| Strain (S. cerevisiae) | BC187 | PMID: 19840116 | ||
| Recombinant DNA reagent | pKT140 | Addgene | KanMX-yECitrine plasmid | |
| Recombinant DNA reagent | pSR101 | PMID: 21468987 | mCherry-pTEF- caURA3 | |
| Recombinant DNA reagent | pYM-N15 | Euroscarf | GPD promoter, natNT2 | |
| Other | Sigma Aldrich | 1397-94-0 | 1397-94-0 | |
| Other | Maltose | Sigma Aldrich | M5885-1KG | D-(+)-Maltose monohydrate,>99% |
| Other | Galactose | Fisher Scientific | 150610010 | D(+)-Galactose,>99% |
| Other | Glycerol | Sigma Aldrich | G5516 | Glycerol,>99% |
| Other | Yeast extract | Lab M | MC001 | |
| Other | Bacteriological Peptone | Lab M | MC024 |
Additional files
-
Supplementary file 1
Analysis of Bar-Seq data.
This file contains the data and procedure for obtaining lag times in the Bar-Seq experiment starting from read counts. The procedure is detailed in the Materials and Methods section.
- https://doi.org/10.7554/eLife.39234.038
-
Supplementary File 2
RNA-Seq count data.
This file contains expression values (fpm) for RNA-Seq samples. Each column represents one sample point. At each sampling point two biological replicates are sampled. These replicates are named 'A' or 'B'.
- https://doi.org/10.7554/eLife.39234.039
-
Supplementary File 3
Annotation of the sample numbers in RNA-Seq count data.
This file contains the description of time point, media and pre-growth conditions for each of the sample numbers in RNA-Seq count data from Supplementary File 1.
- https://doi.org/10.7554/eLife.39234.040
-
Transparent reporting form
- https://doi.org/10.7554/eLife.39234.041
Download links
A two-part list of links to download the article, or parts of the article, in various formats.
Downloads (link to download the article as PDF)
Open citations (links to open the citations from this article in various online reference manager services)
Cite this article (links to download the citations from this article in formats compatible with various reference manager tools)
Transition between fermentation and respiration determines history-dependent behavior in fluctuating carbon sources
eLife 7:e39234.
https://doi.org/10.7554/eLife.39234


