Targeting MYC dependency in ovarian cancer through inhibition of CDK7 and CDK12/13
- Dana-Farber Cancer Institute, United States
- Harvard Medical School, United States
- Baylor College of Medicine, United States
Figures
Figure 1 with 1 supplement

MYC is frequently amplified in ovarian cancer and required for cancer cell growth.
(A) Copy number plots of TCGA high-grade serous ovarian cancer samples for chromosome 8 (top) and part of the q24 arm (bottom). Red color indicates a high chromosomal copy number ratio, blue represents low (see color key on the right). Data were analyzed and plotted using UCSC Xena Functional Genomics Browser (xena.ucsc.edu). (B) Frequency of MYC amplification across cancer types. (C) Correlation between MYC copy number and its gene expression in ovarian cancer. The relative copy number value and normalized RNA-seq expression values of MYC were downloaded from cBioportal and plotted in GraphPad Prism. Pearson correlation coefficient was measured and the p-value<1×10⁻⁴. (D) CRISPR/Cas9-mediated gene editing in ovarian cancer cells. Immunoblotting of lysates from ovarian cancer cells that were infected with lentivirus encoding Cas9 and sgRNA targeting GFP or MYC, and then harvested 2 days after puromycin selection (top). Cells were fixed after 12 days and stained with crystal violet (bottom). (E) Effect of JQ1 in ovarian cancer cells (top) and in a multiple myeloma line MM1.S (bottom). Cells were treated with vehicle control (DMSO) or increasing concentrations of JQ1 for 6 hr before lysates were prepared for immunoblotting with the indicated antibodies. Also see Figure 1—figure supplement 1.
Figure 1—figure supplement 1
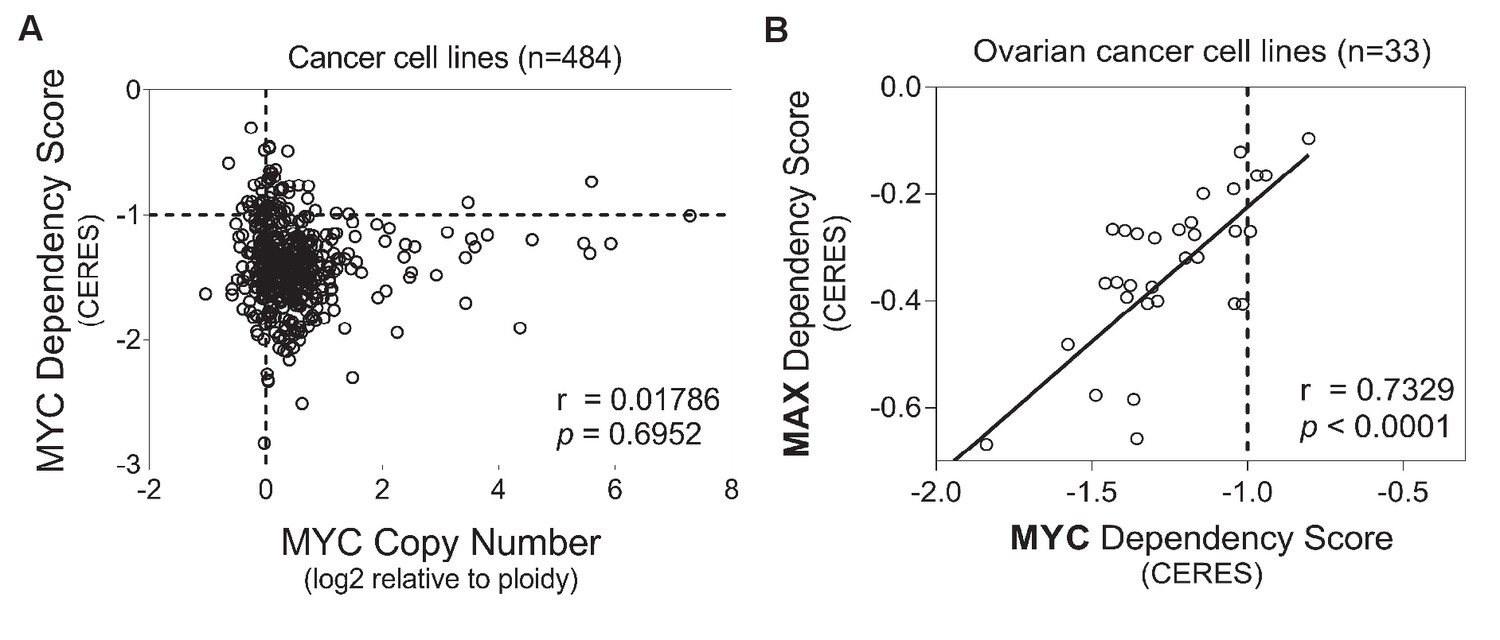
Analysis of MYC dependency in cancer cell lines.
Data were downloaded from https://depmap.org/portal/, and analyzed in GraphPad Prism 7. (A) Lack of correlation between MYC gene copy number and MYC dependency scores. (B) MYC dependency is highly correlated with MAX dependency in ovarian cancer cell lines. Each circle represents one cancer cell line. Pearson correlation coefficient (r) is indicated, with p values shown for the statistical significance test of Pearson correlation.
Figure 2 with 2 supplements

Targeted screen of transcriptional and epigenetic regulators identifies THZ1 as key transcriptional regulator of MYC.
(A) Schematic diagram of a screen for small molecules that inhibit MYC expression. Ovarian cancer cells were treated with selected epigenetic/transcriptional inhibitors for 6 hr at a final concentration of 1 μM. Whole cell lysates were subjected to fluorescent immunoblotting with anti-MYC and anti-α-tubulin (loading control) antibodies. (B) Normalized signals of MYC by immunoblotting in KURAMOCHI cells. THZ1 was the most potent inhibitor that reduces MYC expression. (C) The indicated cells were treated with increasing concentrations of THZ1 for 6 hr. Cell lysates were subjected to immunoblotting using the indicated antibodies. (D) qPCR analysis of MYC and MCL-1 in THZ1-treated ovarian cancer cells. Student’s t-test was performed and data were presented as mean values ± SD of technical triplicates. Also see Figure 2—figure supplement 1; Figure 2—figure supplement 2; Supplementary file 1 and Supplementary file 2.
Figure 2—figure supplement 1
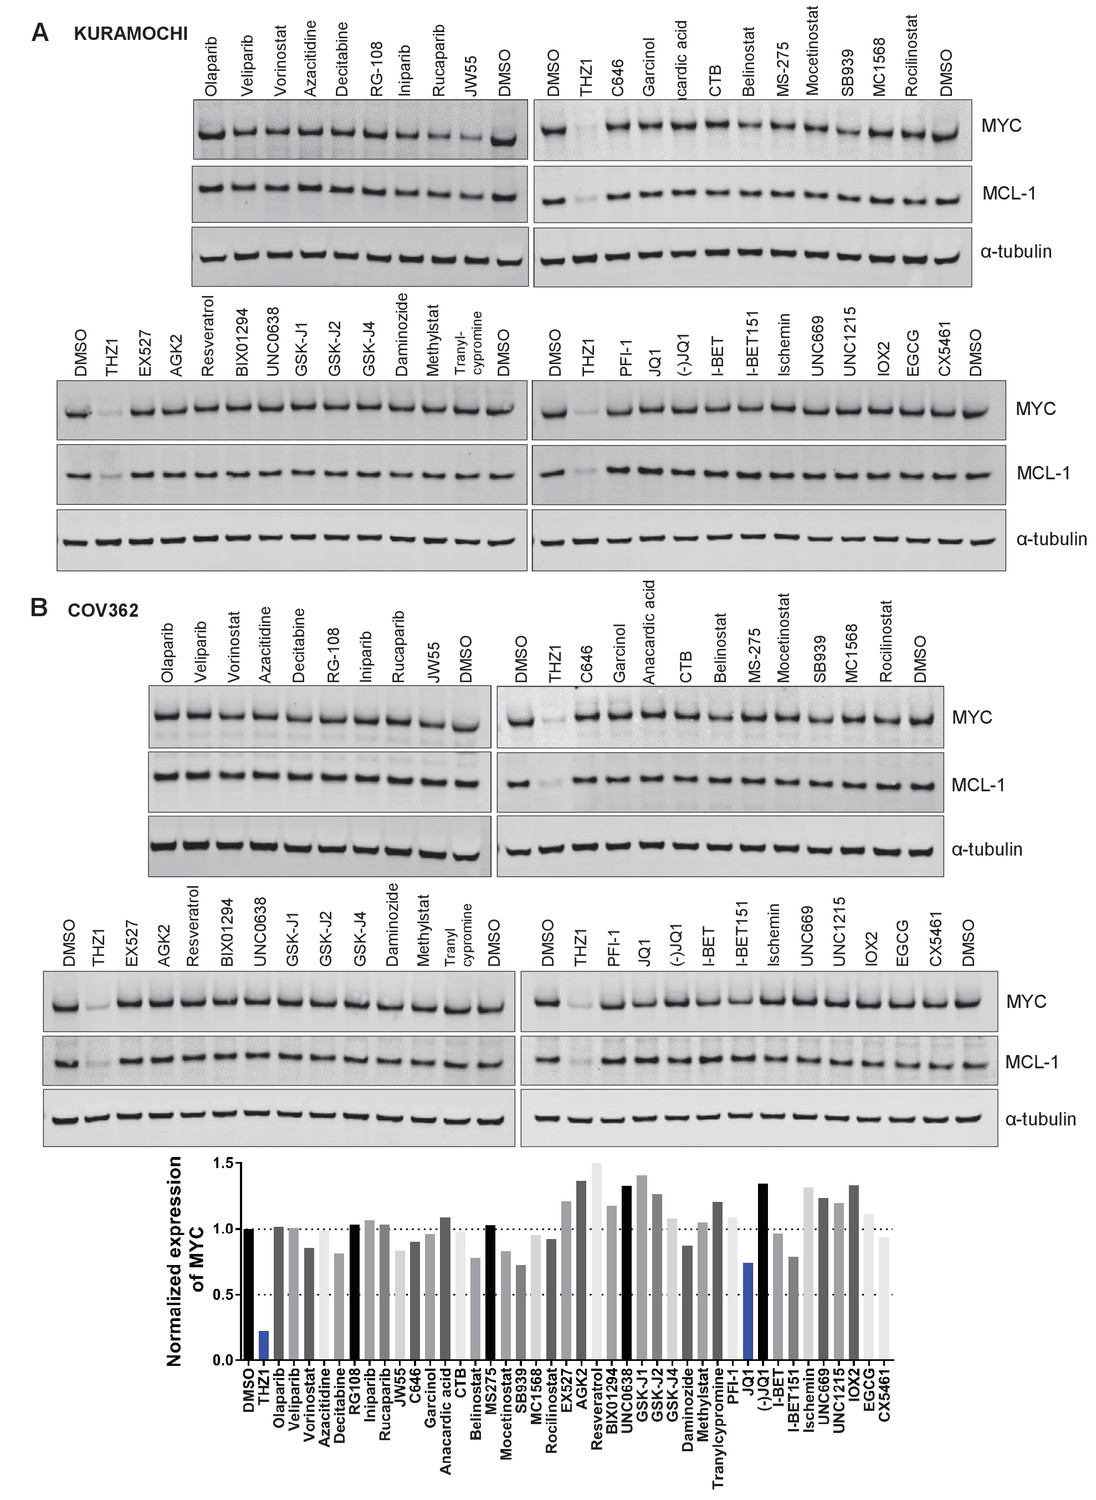
Small molecules screen for compounds inhibiting MYC expression.
(A-B) Ovarian cancer cell lines, KURAMOCHI (A) or COV362 (B), were treated with indicated inhibitors for 6 hr, followed by preparation of whole cell lysates and immunoblotting using the indicated antibodies.
Figure 2—figure supplement 2
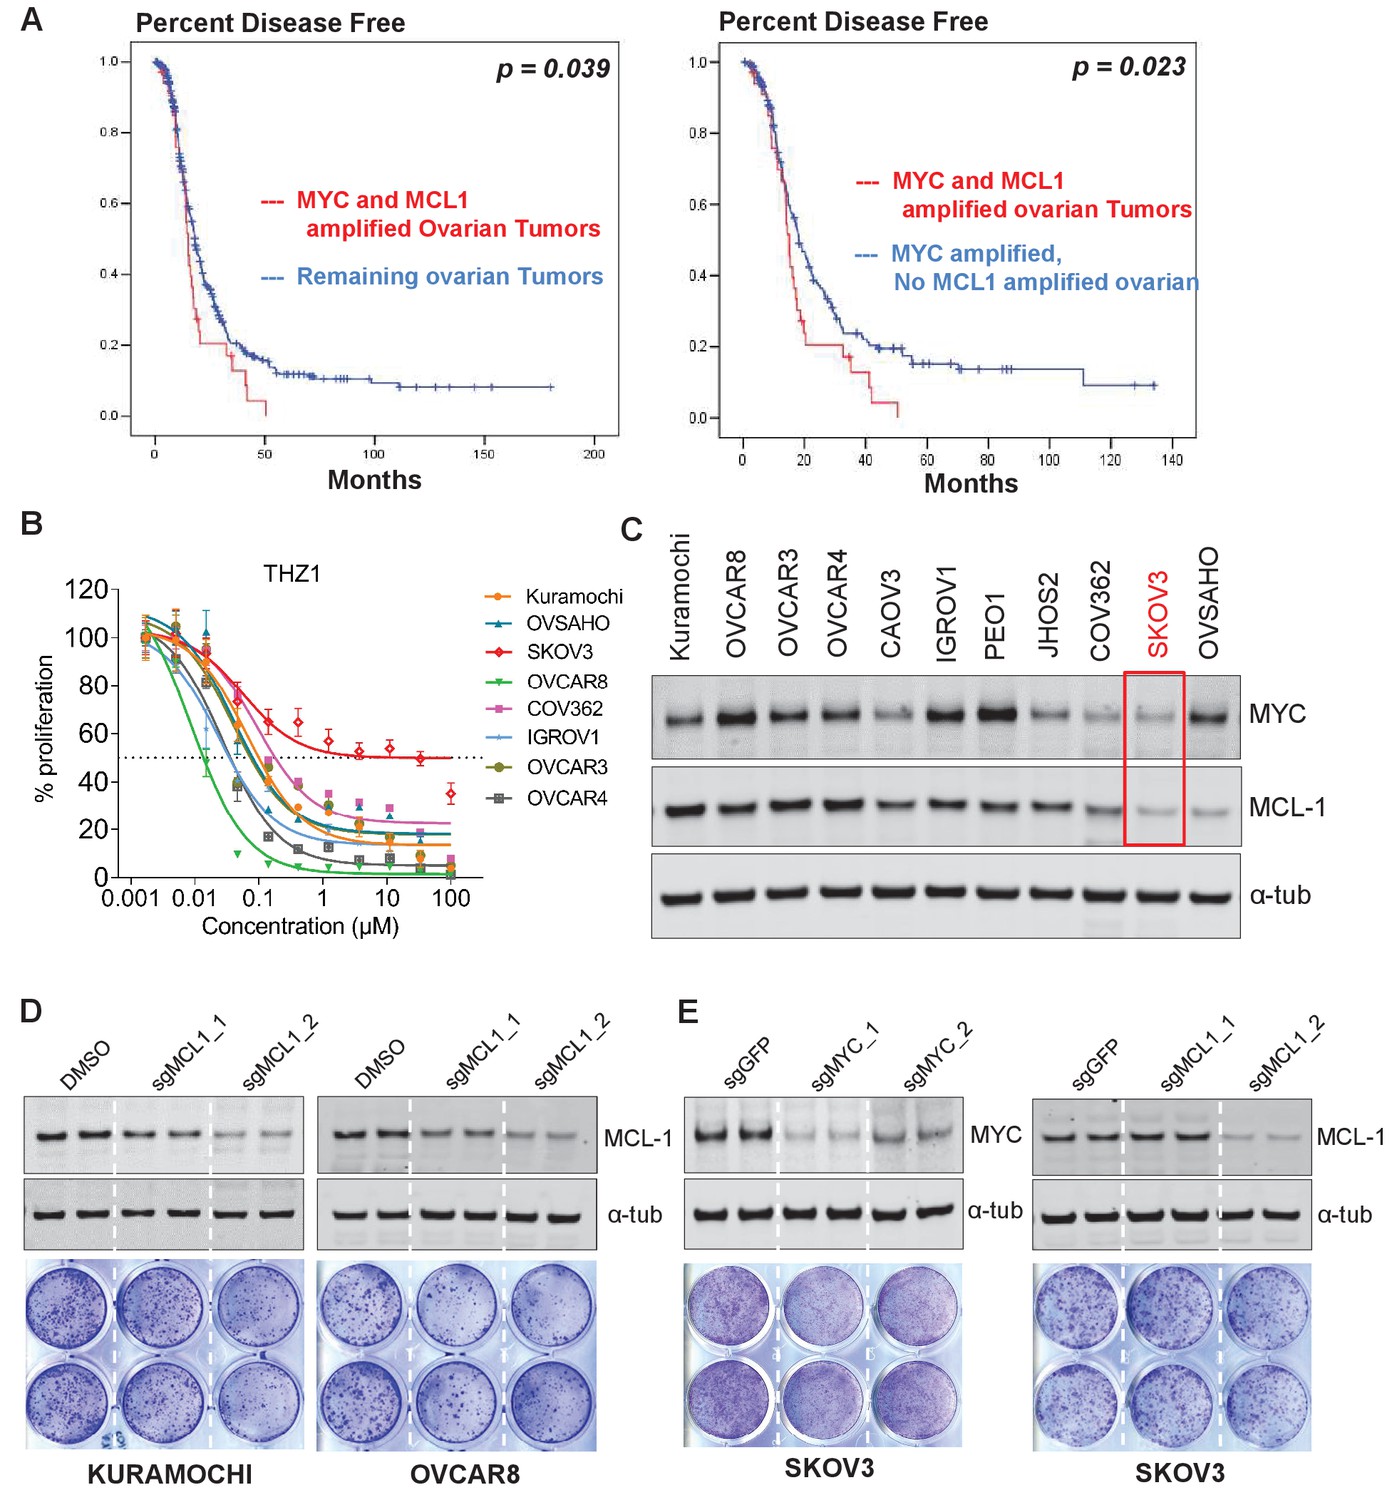
THZ1 inhibits the expression of both MYC and MCL1.
(A) Kaplan-Meier plot of disease-free survival in ovarian cancer patients with (red) or without (blue) co-amplification of MYC and MCL-1 (left panel). Kaplan-Meier plot of disease-free survival in ovarian cancer patients with co-amplification of MYC and MCL-1 (red) or with MYC amplification alone (blue) (right panel). Disease-free survival data and annotations of MCL1 and MYC amplification were downloaded from the TCGA provisional dataset at the cbioportal website. The statistical significance was calculated using the log rank test. (B) Ovarian cancer cells were treated with increasing concentrations of THZ1. Cells were subjected to CellTiter-Glow Luminescent Cell Viability Assay after 72 hr of treatment. Data were represented as mean ± SD of biological triplicates. (C) Basal expression of MYC and MCL-1 in OC cell lines. Note that SKOV3 cells (highlighted in red box) has the least abundance of MYC and MCL1. (D) (Top) Immunoblotting of lysates from indicated cells that were infected with lentivirus encoding Cas9 and sgRNA targeting GFP or MCL-1. (Bottom) Cells were infected with lenti-CRISPR, and following puromycin selection, subjected to clonogenic cell growth. Cells were fixed 12 days after seeding and stained with crystal violet. (E) Cells were treated and assayed as described in D, with either MYC or MCL-1-targeting sgRNAs was used.
Figure 3 with 2 supplements
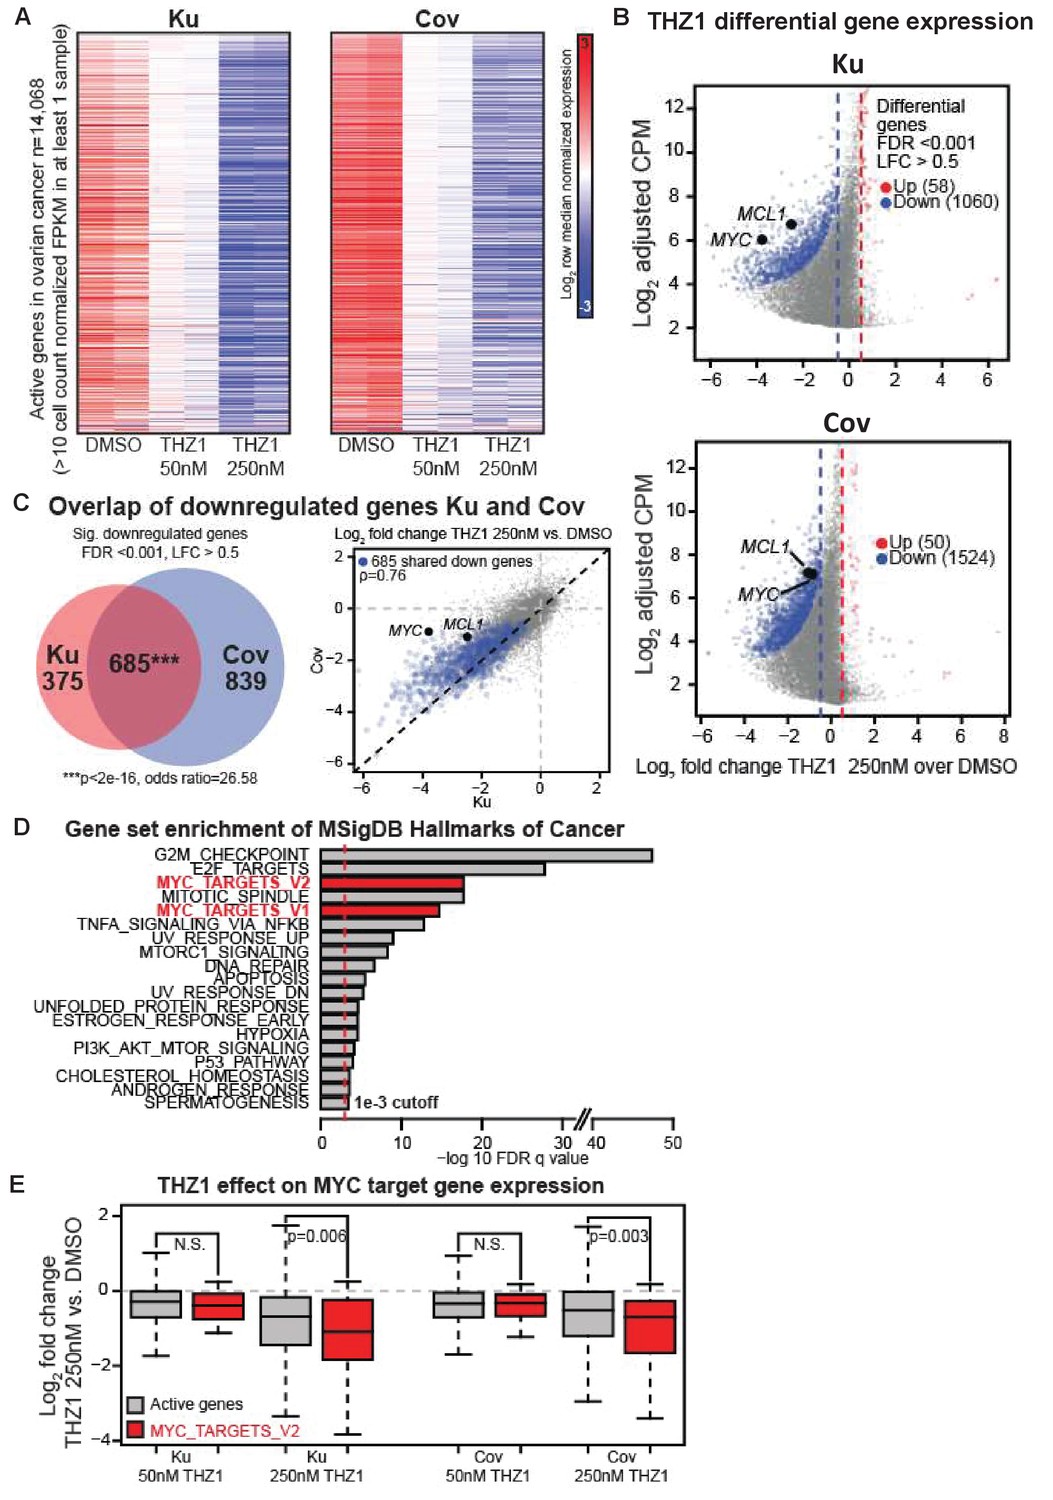
THZ1 represses MYC target genes in ovarian cancer cells.
(A) Heatmaps showing row normalized gene expression for all actively expressed genes (n = 14,068) (cell count normalized FPKM > 1 in at least one sample). (B) Scatter plots comparing change in gene expression upon THZ1 treatment to gene expression levels in DMSO. X-axis shows the Log2 fold change of expression (THZ1/DMSO). Y-axis shows the adjusted log2 counts per million (CPM) expression in DMSO. Differentially regulated genes as determined by edgeR are shown for downregulated (blue) and upregulated (red) genes. A FDR adjusted p-value cutoff of 1e-3 and a log fold change (LFC) cutoff of 0.5 are used as the threshold for significance. (C) Left - Venn diagram showing the intersection of differential downregulated genes between Ku and Cov cells upon THZ1 250 nM treatment. Significance of overlap is determined by a fisher's exact test. p-value and odds ratio are shown. Right - Scatter plots comparing the log2 fold change in gene expression upon THZ1 250 nM treatment between Ku and Cov cells. Differential downregulated genes that are shared between Ku and Cov are shown in blue. The pearson correlation of differential genes is shown (Rho = 0.76). (D) Bar plot showing gene sets from the MSigDB Hallmarks of Cancer that are significantly enriched (FDR q value < 1e-3) amongst the 685 genes shared as differentially downregulated between Ku and Cov upon 250 nM THZ1 treatment. MYC target gene sets are shown in red. (E) Box plots showing the log2 fold change in gene expression upon THZ1 treatment for MYC target genes (red, n = 58) and other active genes (grey, n = 14,010) in Ku and Cov cell lines. MYC target genes are drawn from the HALLMARKS_MYC_TARGETS_V2 signature. The statistical significance between MYC target genes and other active genes is shown from a Wilcoxson rank sum test (one-sided). Also see Figure 3—figure supplement 1; Figure 3—figure supplement 2.
Figure 3—figure supplement 1
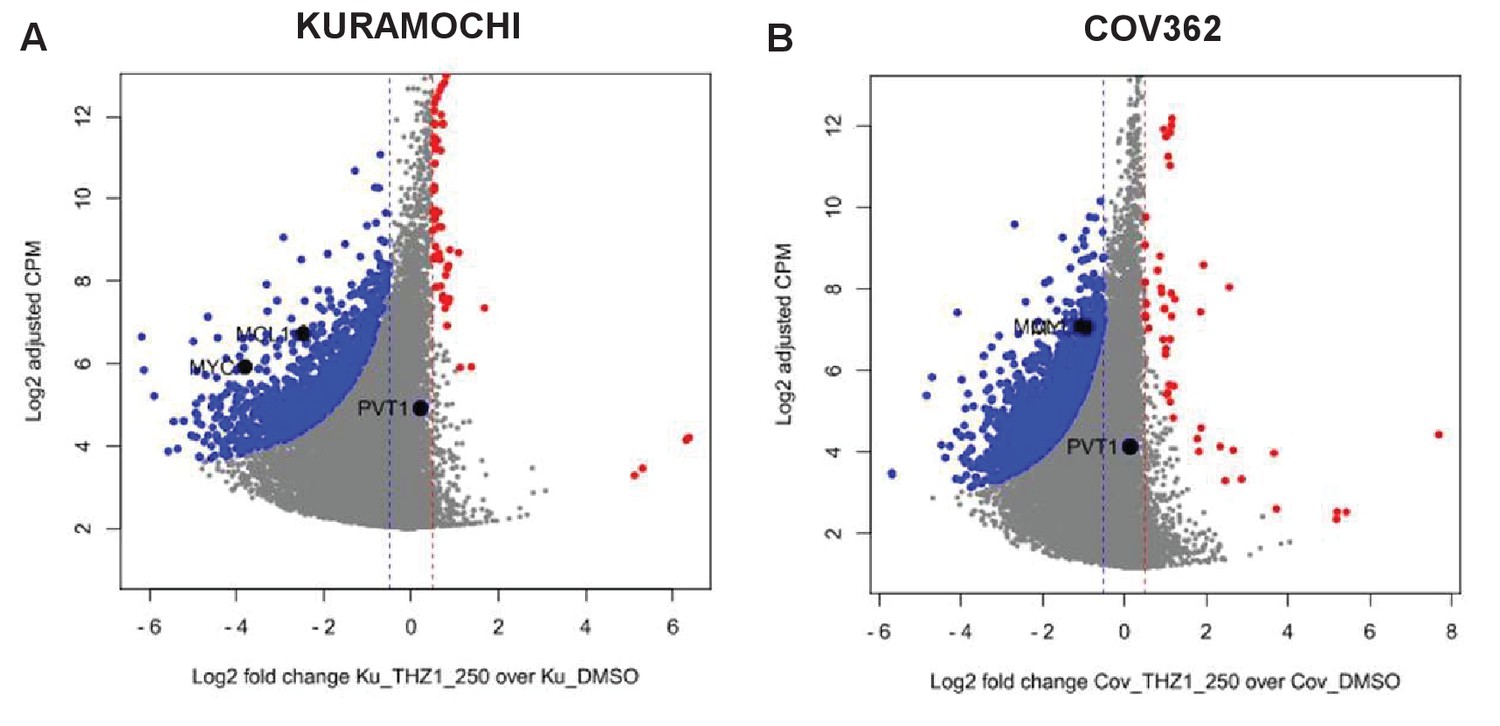
PVT1, a lncRNA gene co-amplified with MYC on 8q24, is not significantly downregulated by THZ1.
Scatter plots comparing change in gene expression upon THZ1 treatment to gene expression levels in DMSO, in KUROMOCHI (left) and COV362 cells (right). X-axis shows the Log2 fold change of expression (THZ1/DMSO). Y-axis shows the adjusted log2 counts per million (CPM) expression in control cells. Differentially regulated genes as determined by edgeR are shown for downregulated (blue) and upregulated (red) genes. A FDR adjusted p-value cutoff of 1e-3 and a log fold change cutoff of 0.5 are used as the threshold for significance. Note that MYC and MCL1 expression, but not PVT1, is significantly suppressed by THZ1.
Figure 3—figure supplement 2
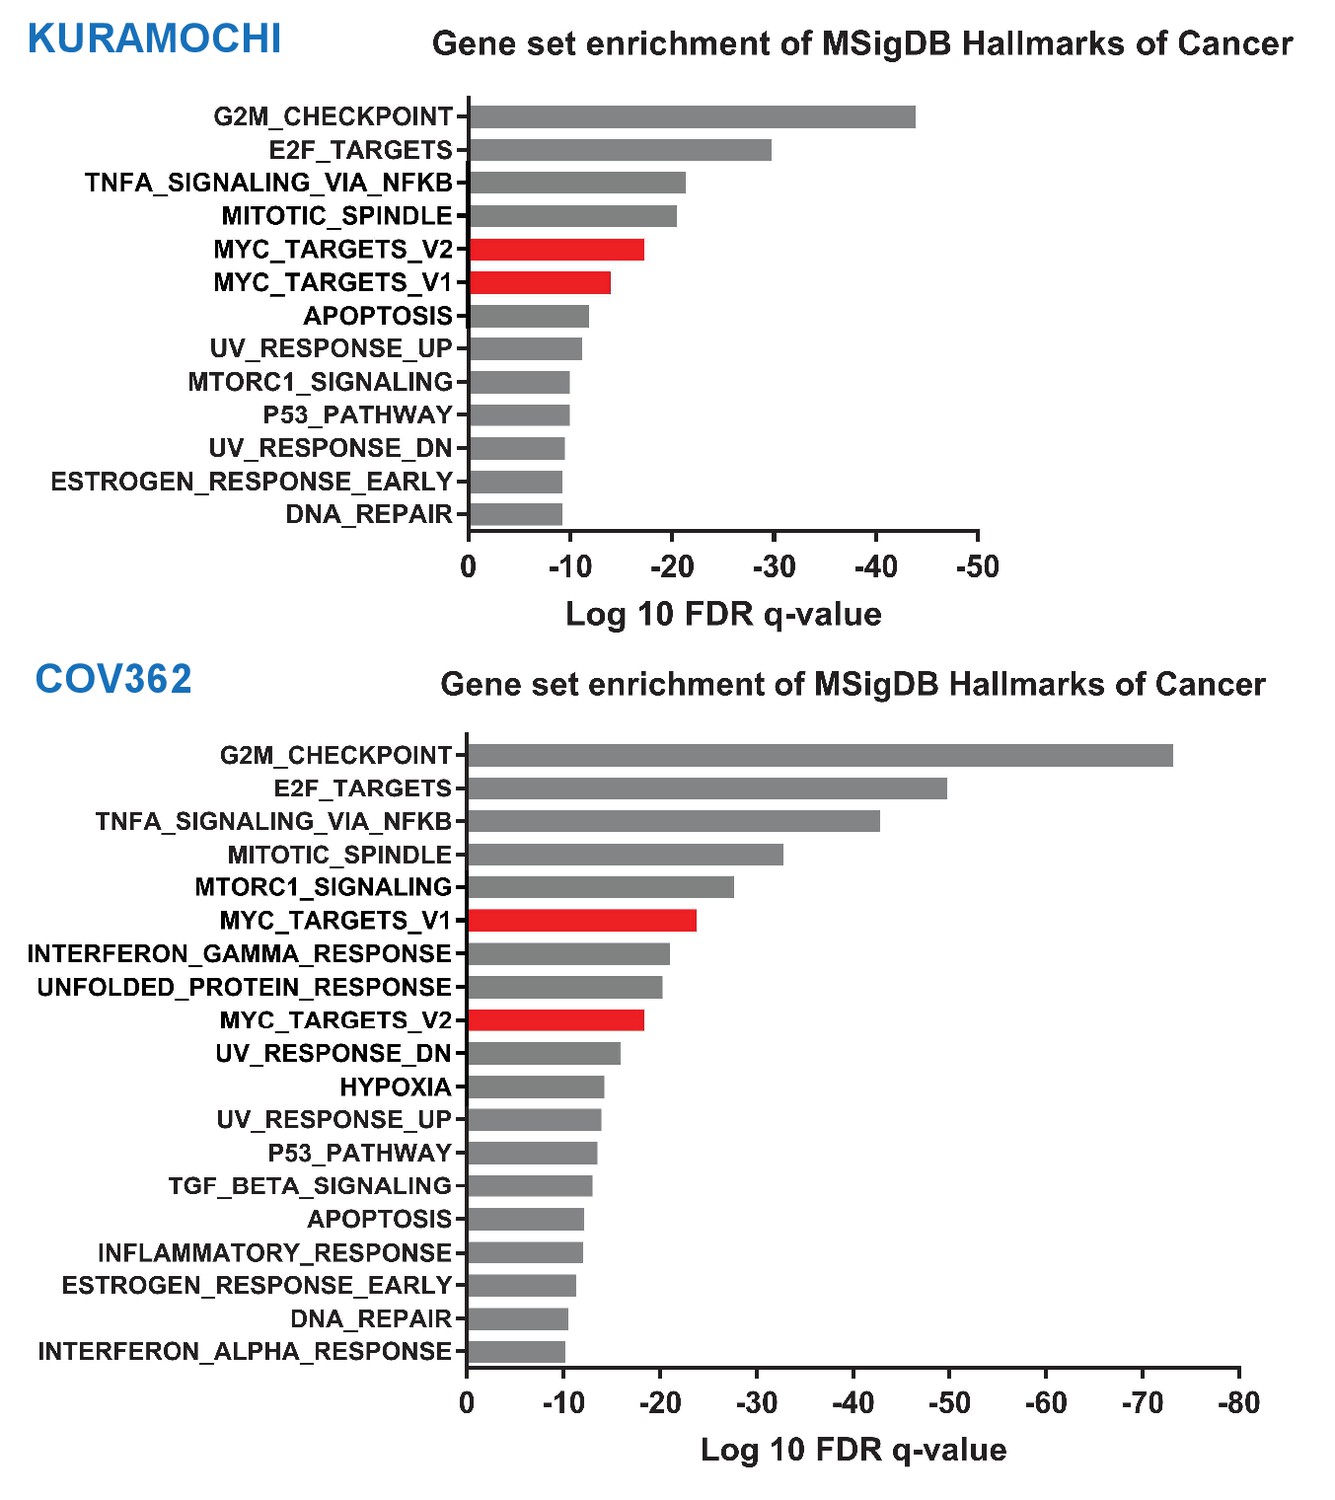
THZ1 selectively downregulates MYC target genes.
Bar plot showing gene sets from the MSigDB Hallmarks of Cancer that are significantly enriched as differentially downregulated upon 250 nM THZ1 treatment in Kuramochi and Cov362 cells (FDR q value cutoff 1e-9). MYC Targets gene sets (v1 and v2) are shown in red.
Figure 4 with 2 supplements

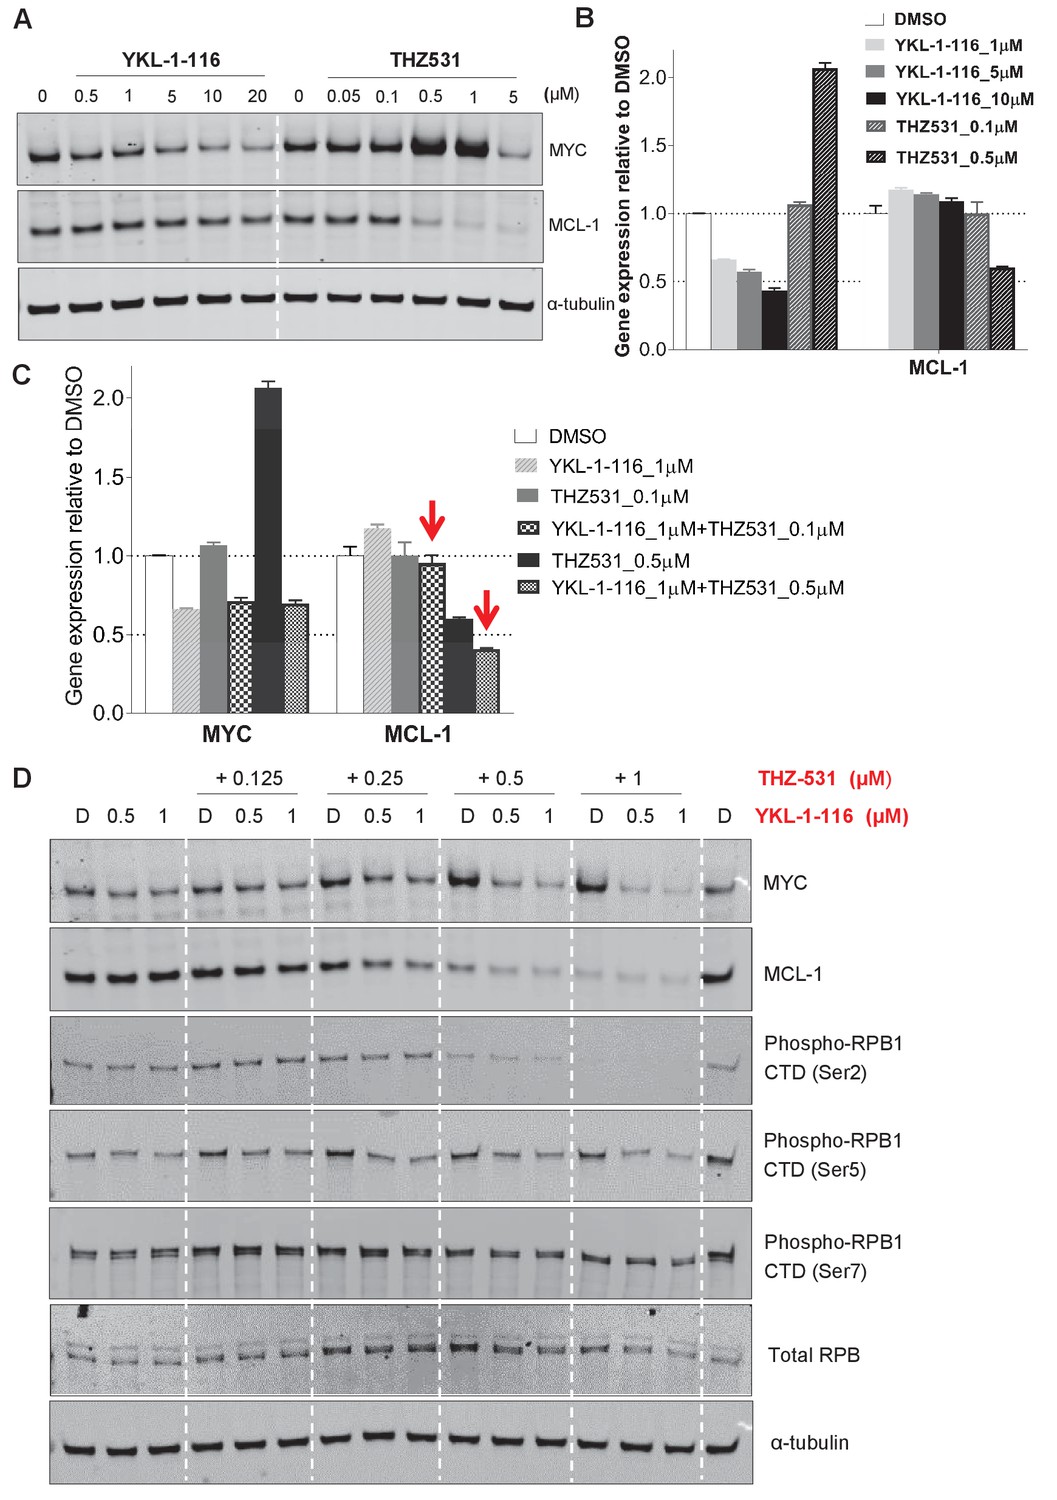
Downregulation of MYC and MCL-1 requires co-inhibition of CDK7 and CDK12/13 in KURAMOCHI cells.
(A) Chemical structures of inhibitors and their primary protein targets. (B) KURAMOCHI cells were treated with increasing concentrations of YKL-1–116 or THZ531, with cell lysates prepared following 6 hr of treatment. (C) qPCR analysis of MYC and MCL-1 in YKL-1–116 or THZ531-treated KURAMOCHI cells for 6 hr. Student’s t-test was performed and data were presented as mean values ± SD of technical triplicates. (D) qPCR analysis of MYC and MCL-1 in single or combination treatment with YKL-1–116 and THZ531 for 6 hr. Red arrows indicate an enhanced repression by the combination treatment. Student’s t-test was performed and data were presented as mean values ± SD of technical triplicates.(E) Combining YKL-1–116 and THZ531 efficiently downregulates MYC expression. KURAMOCHI cells were treated with increasing concentrations of YKL-1–116 (0.5 or 1 μM), in combination with increasing concentrations of THZ531 (0.0625, 0.125, 0.25, or 0.5 μM) for 6 hr before lysates were prepared for immunoblotting. Also see Figure 4—figure supplement 1; Figure 4—figure supplement 2.
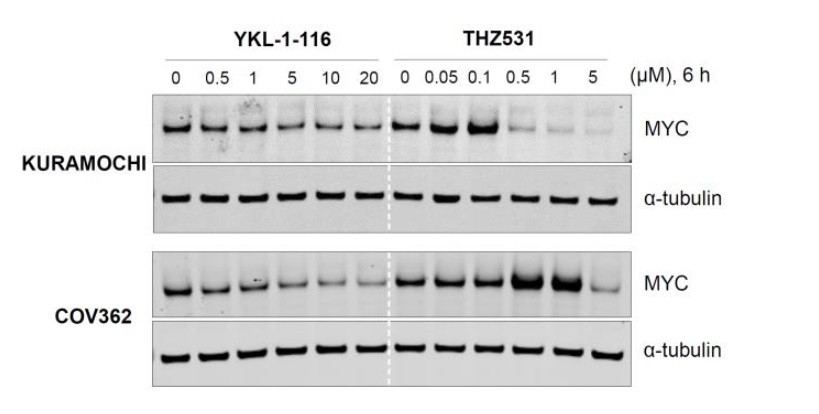
Figure 4—figure supplement 1
Downregulation of MYC and MCL-1 requires co-inhibition of CDK7 and CDK12/13 in COV362 cells.
(A) COV362 cells were treated with increasing concentrations of YKL-1–116 or THZ531, with cell lysates prepared following 6 hr of treatment. (B) qPCR analysis of MYC in ovarian cancer cells treated with YKL-1–116 or THZ531. Student’s t-test was performed and data were presented as mean values ± SD of technical triplicates. (C) qPCR analysis of MYC and MCL-1 in single or combination treatment with YKL-1–116 and/or THZ531 for 6 hr. Red arrows indicate an enrepression by the combination treatment. Student’s t-test was performed and data were presented as mean values ± SD of technical triplicates. (D) COV362 cells were treated with increasing concentrations of YKL-1–116 (0.5 or 1 μM), combined with increasing concentrations of THZ531 (0.125, 0.25, 0.5, or 1 μM). Cell lysates were harvested after 6 hr, and prepared for immunoblotting.
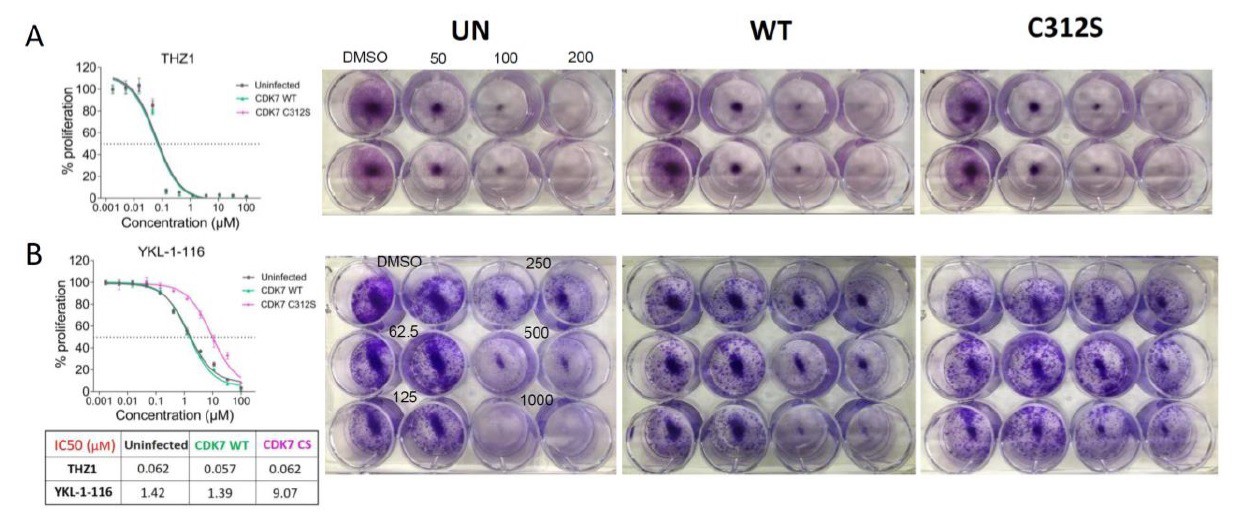
Figure 4—figure supplement 2

The mutant CDK7 (C312S) rescued THZ1-induced MYC downregulation and cell growth inhibition by YKL-1–116.
OVCAR8 cells were infected with or without HA-tagged wild-type CDK7 (WT) or C312S mutant (CS), followed by G418 selection to obtain stably transduced cells. The cells were pre-treated with doxycycline (200 ng/ml), and were then (A) seeded in 12 well plate and treated with THZ1 at 250 and 500 nM, with cell lysates prepared for immunoblotting after 6 hr of treatment. (B) seeded in 96-well plate and treated with increasing concentrations of THZ1 or YKL-1–116. Cells were subjected to CellTiter-Glow Luminescent Cell Viability Assay after 72 hr of treatment. Data were represented as mean ± SD of biological triplicates. (C) seeded in 12-well plate and treated with increasing concentrations of YKL-1–116 (0, 62.5, 125, 250, 500, 1000 nM) in duplicate, and subjected to clonogenic cell growth. Cells were fixed 7 days after seeding, and stained with crystal violet.
Figure 5 with 1 supplement
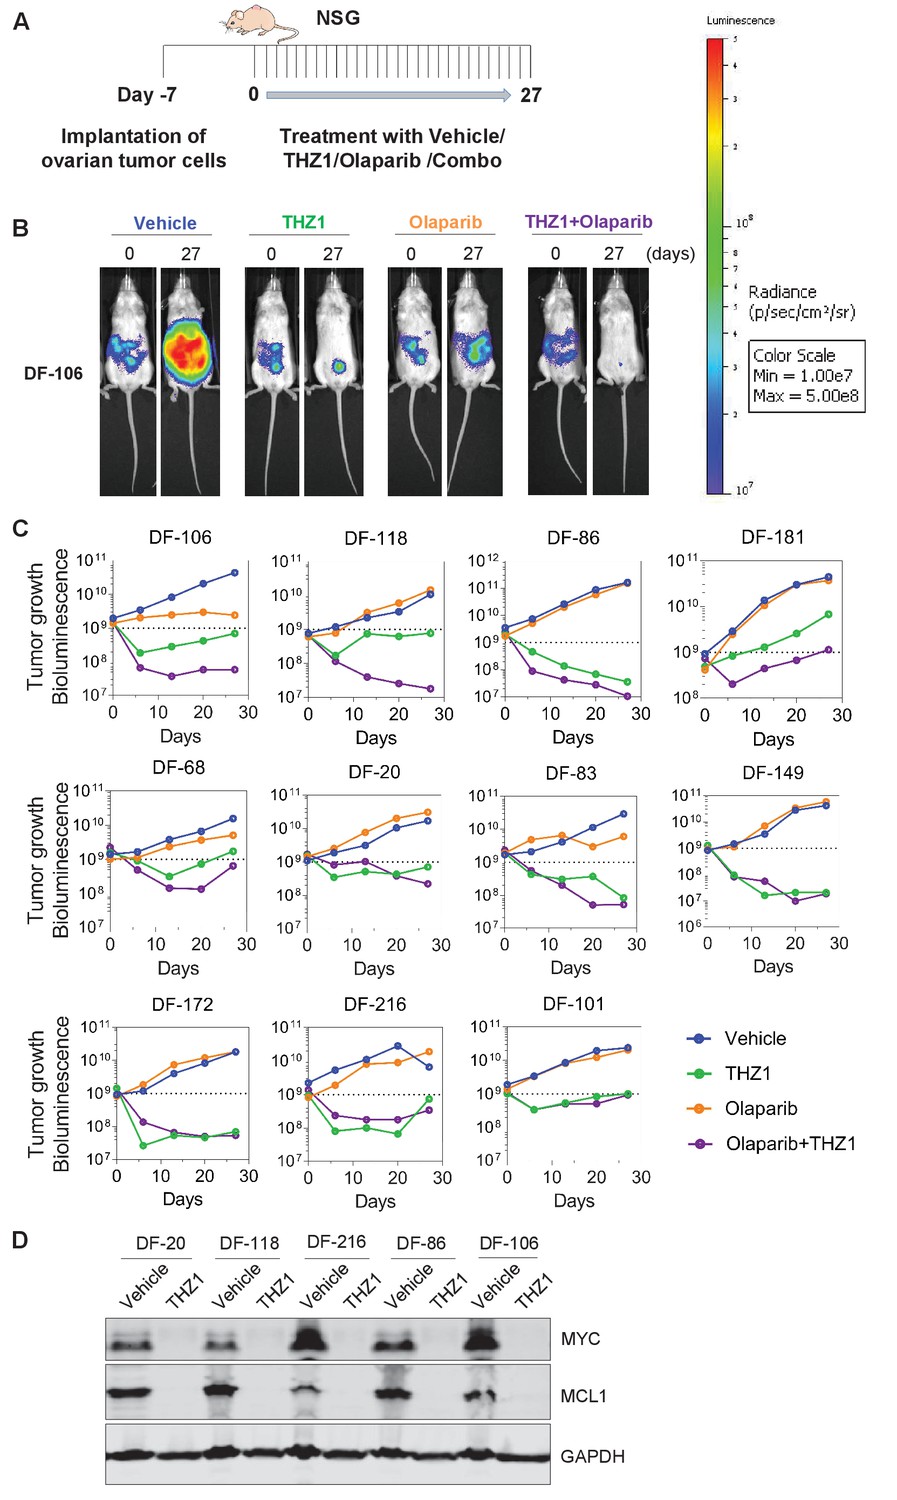
THZ1 abrogates the growth of patient-derived high-grade serous ovarian cancer cells in vivo.
(A) A schematic diagram of the experimental design. (B) Luminescence picture of luciferized PDX mice (eg. DF-106) at day 0 and day 27, treated with vehicle control (10 ml/kg, PO, QD) or THZ1 (10 mg/kg, IP, BID) or Olaparib (100 mg/kg, PO, QD) or Combo (THZ1 +Olaparib)., Luminescence scale bar was shown on the right. (C) Luminescence signal of the tumor in 11 PDX models (n = 44 mice) treated with vehicle control or THZ1 or Olaparib or Combo. (D) Following the last treatment on day 27, tumor ascites from 5 PDX models (n = 10 mice) were harvested for the preparation of whole cell lysates followed by immunoblotting using the indicated antibodies. Also see Figure 5—figure supplement 1.
Figure 5—figure supplement 1
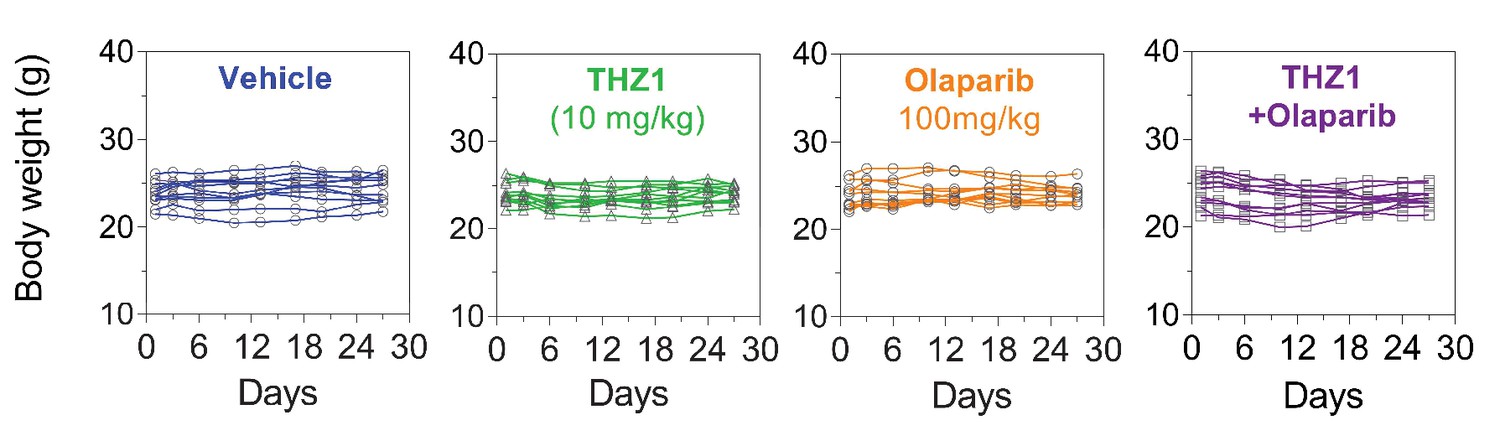
Body weight measurement of the 11 PDX models (n = 44 mice) treated with vehicle control (10 ml/kg, PO, QD) or THZ1 (10 mg/kg, IP, BID) or Olaparib (100 mg/kg, PO, QD) or Combo.
https://doi.org/10.7554/eLife.39030.014
Author response image 1
CDK7 inhibitor (YKL-1-116) and CDK12/13 inhibitor (THZ531) have different effects on MYC expression.
Indicated ovarian cancer cell lines were treated with increasing concentrations of YKL- 1-116 or THZ531, with cell lysates prepared following 6 hours of treatment.
Author response image 2
Overexpressing CDK7 C312S mutant rescued cell growth inhibition by YKL-1-116.
Author response image 3
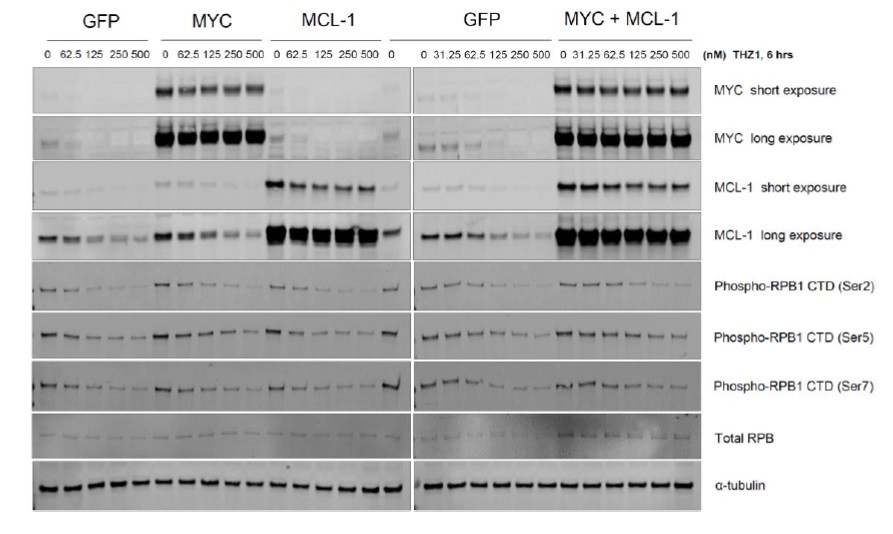
Overexpression of GFP/ MYC/ MYC-1/ MYC+MCL-1 in OVCAR8 cells.
Author response image 4
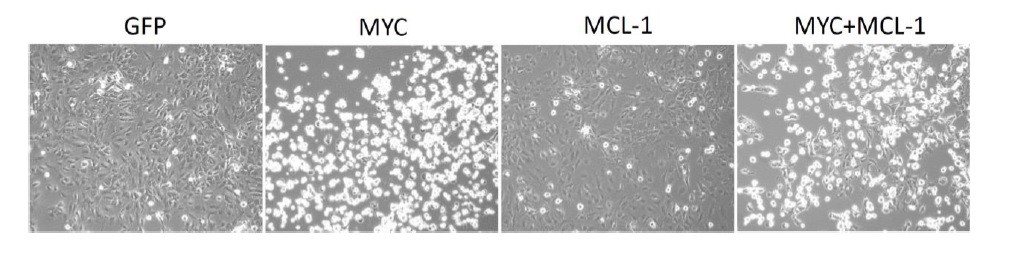
Overexpression of MYC inhibits cancer cell growth.
OVCAR8 cells were infected with pCDH-GFP/ MYC/ MYC-1/ MYC+MCL-1 twice, then selected with puromycin 1 ug/ml for 2 days. Cells were seeded at 5,000 per well in a 12-well plate, then treated with DMSO or increasing concentrations of THZ1 or YKL-1-116 the next day. Pictures were taken for cells treated with DMSO control for 6 days prior to cell fixation.
Additional files
-
Supplementary file 1
Table of epigenetic and transcriptional compound screen.
- https://doi.org/10.7554/eLife.39030.016
-
Supplementary file 2
Table of normalized MYC expression values.
- https://doi.org/10.7554/eLife.39030.017
-
Transparent reporting form
- https://doi.org/10.7554/eLife.39030.018
Download links
A two-part list of links to download the article, or parts of the article, in various formats.
Downloads (link to download the article as PDF)
Open citations (links to open the citations from this article in various online reference manager services)
Cite this article (links to download the citations from this article in formats compatible with various reference manager tools)
Targeting MYC dependency in ovarian cancer through inhibition of CDK7 and CDK12/13
eLife 7:e39030.
https://doi.org/10.7554/eLife.39030


