Loss of Atoh1 from neurons regulating hypoxic and hypercapnic chemoresponses causes neonatal respiratory failure in mice
- Baylor College of Medicine, United States
- Texas Children’s Hospital, United States
Figures
Figure 1 with 2 supplements
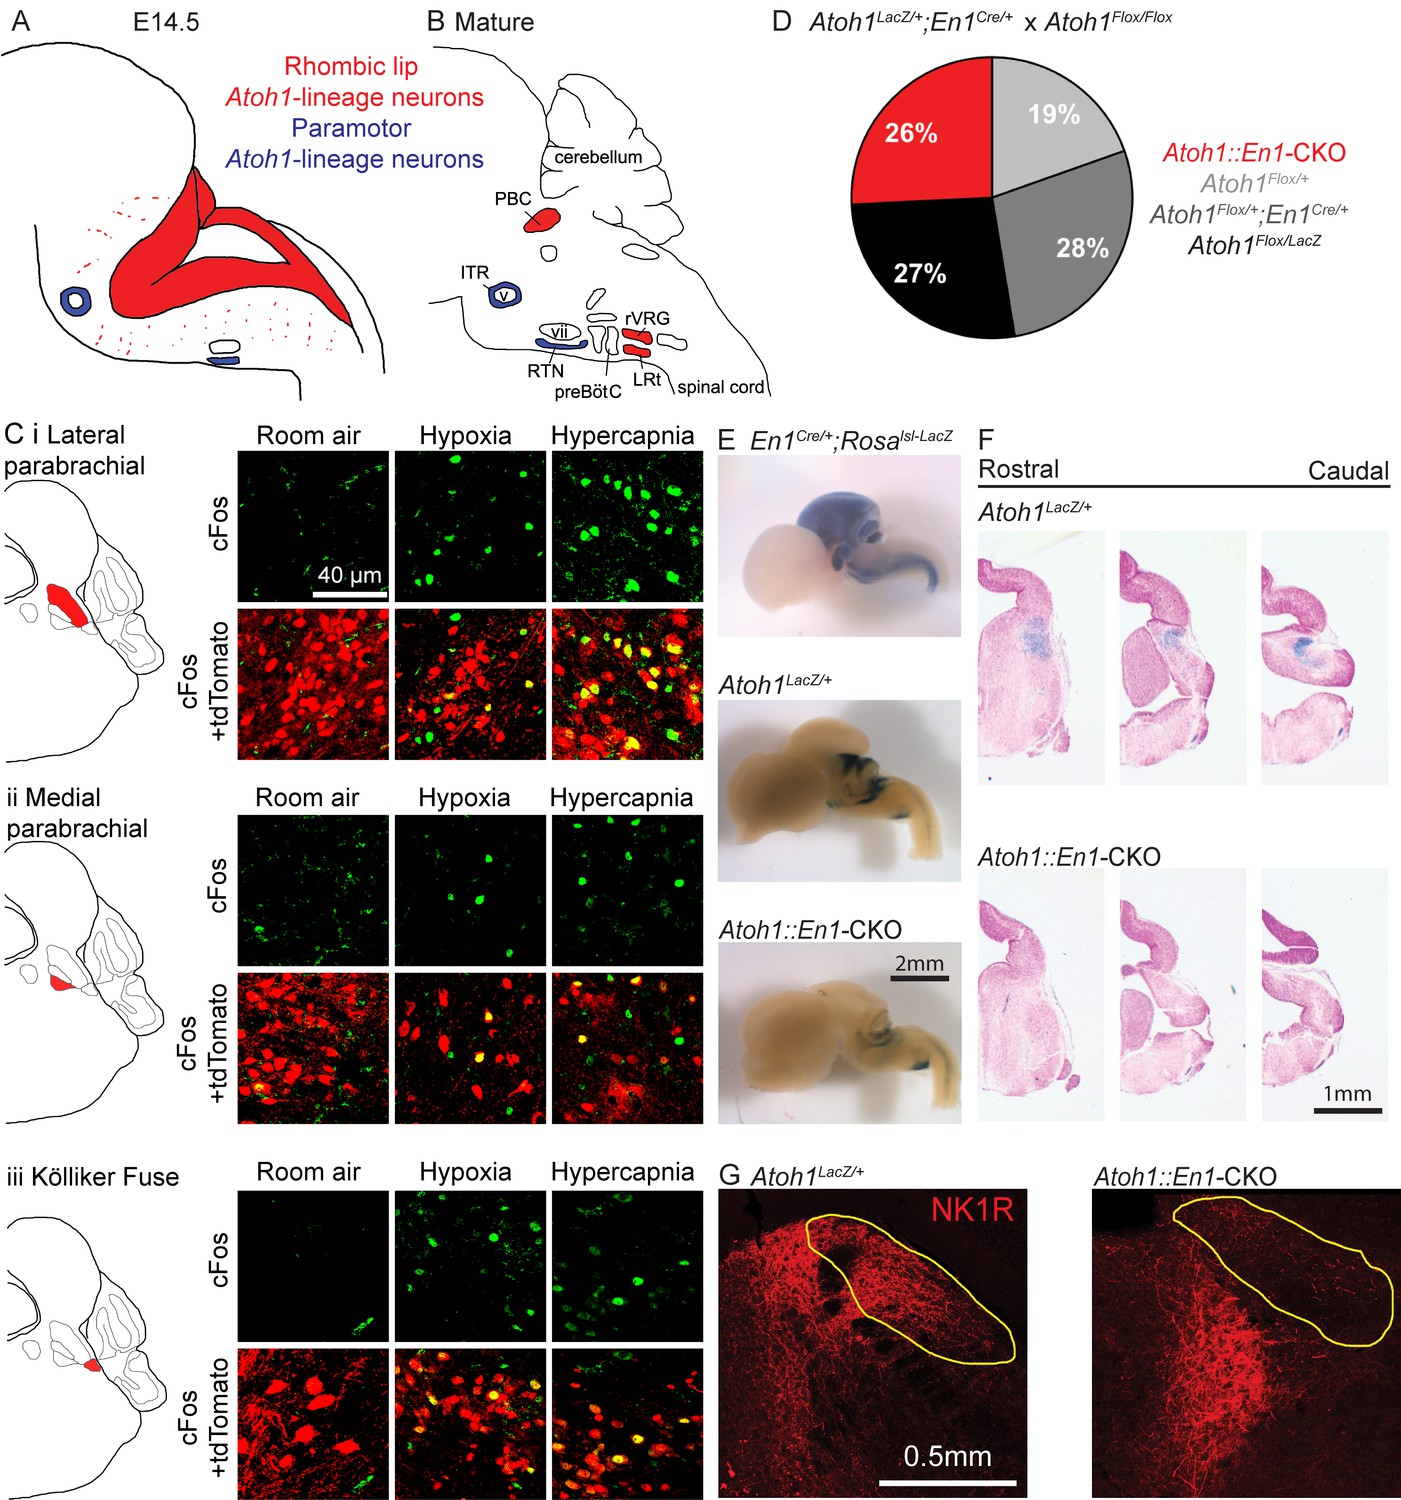
Atoh1-lineage parabrachial complex neurons are activated during chemochallenges but are not essential for neonatal survival.
(A) Schematic of Atoh1-expression cells in the developing brainstem (E14.5). Red area represents proliferating cells in the rhombic lip. Blue cells are postmitotic neurons in paramotor nuclei. (B) Schematic of neural populations in the brainstem respiratory circuitry. Red nuclei represent rhombic lip, Atoh1-lineage neurons important for respiratory control. Blue nuclei are Atoh1-lineage neurons in two paramotor nuclei. (C) Atoh1-lineage neurons (tdTomato+) in three sub compartments of the parabrachial complex (i) lateral parabrachial, (ii) medial parabrachial and (iii) Kölliker Fuse) express the neural activity marker cFos selectively after a one-hour-exposure to hypoxia (10% O2, balanced N2) or hypercapnia (5% CO2, 21% O2, balanced N2). (D) Atoh1::En1-CKO mice are born and survive in Mendelian ratios. (E) X-gal staining in En1Cre/+;Rosalsl-LacZ reporter allele, Atoh1LacZ/+ and Atoh1::En1-CKO E14.5 embryos to visualize En1Cre expression and Atoh1-lineage cells in the developing brain. (F) Serial sections of X-gal-stained brains at the level of the pons in Atoh1LacZ/+ and Atoh1::En1-CKO mice. No Atoh1-lineage pontine PBC neurons develop in Atoh1::En1-CKO mice at E14.5. (G) Stain for NK1R receptor that is highly expressed in Atoh1-lineage PBC neurons. Loss of NK1R expression in Atoh1::En1-CKO mice at P21. Abbreviations: PBC, parabrachial complex; ITR, intertrigeminal region; RTN, retrotrapezoid nucleus; rVRG, rostral ventral respiratory group; LRt, lateral reticular; preBötC, preBötzinger complex; v, trigeminal motor nucleus; vii, facial motor nucleus.
Figure 1—figure supplement 1
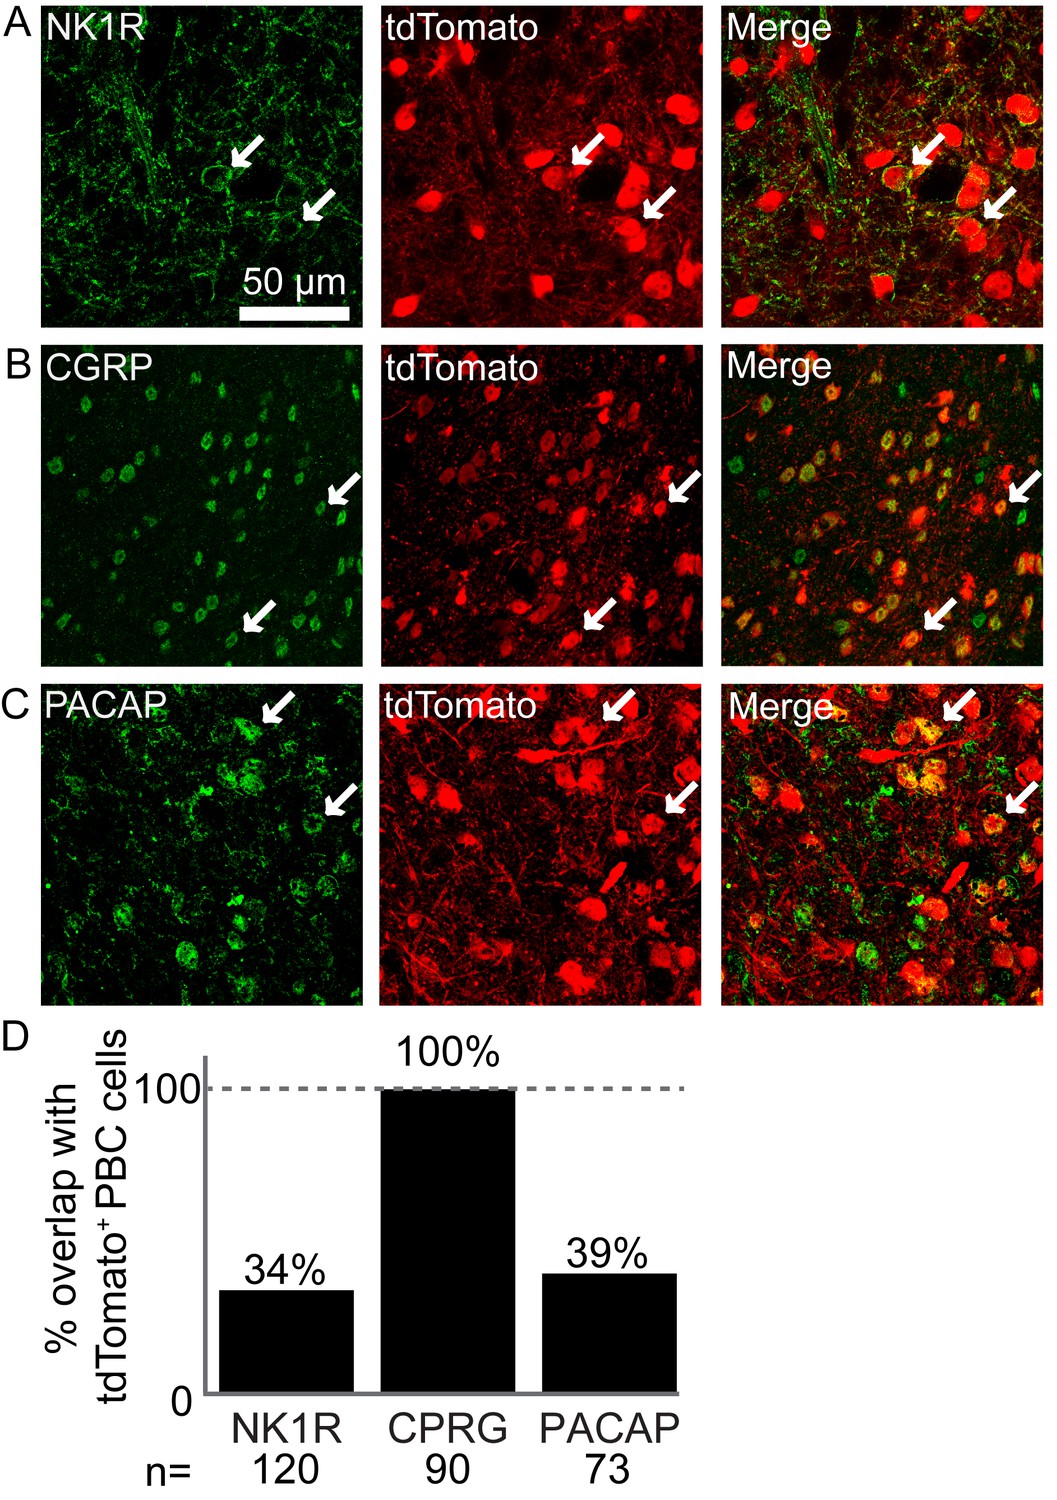
Atoh1-lineage parabrachial complex neurons express specific markers.
(A) Some Atoh1-lineage PBC neurons express the substance P receptor NK1R (tdTomato+ cells in Atoh1Cre/+;Rosalsl-tdTomato/+ mice). (B) All Atoh1-lineage PBC neurons express the peptide calcitonin gene-related peptide (CGRP). (C) Some Atoh1-lineage PBC neurons express the peptide pituitary adenylate cyclase-activating peptide (PACAP). (D) Number of Atoh1-lineage PBC neurons overlapping with the respective markers. N is total number of cells counted from 3 to 4 mice per marker.
Figure 1—figure supplement 2

Atoh1-lineage cerebellar neurons are not activated during chemochallenges.
(A) Atoh1::En1-CKO mice have a small cerebellum. (B) Atoh1-lineage in the dentate nucleus are not activated during chemochallenges. (C) Atoh1-lineage granule cells are not activated during chemochallenges.
Figure 2 with 1 supplement
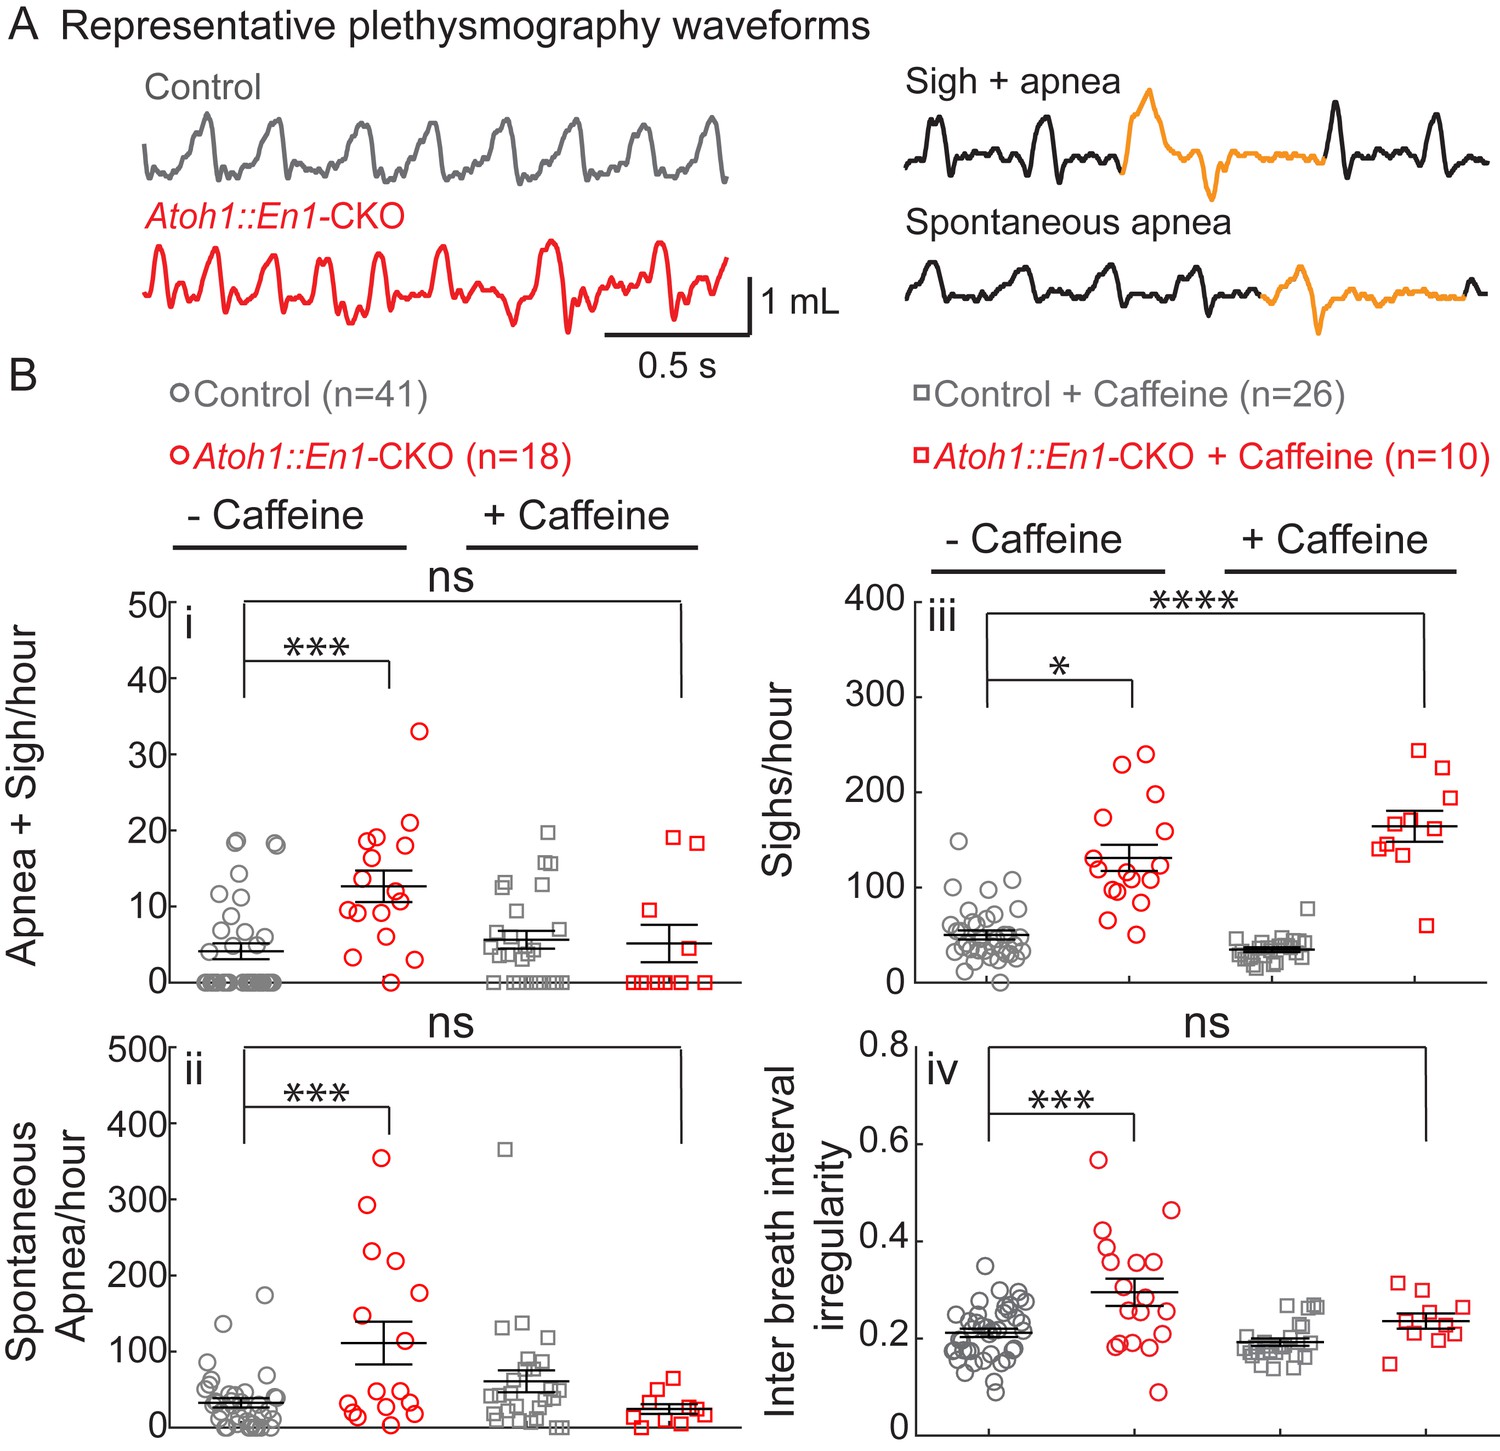
Atoh1::En1-CKO mice have many apneas causing irregular breathing rhythms that can be rescued by caffeine treatment in room air.
(A) Representative plethysmography traces from a control and Atoh1::En1-CKO mouse. Example traces of apnea and sigh. (Bi) Atoh1::En1-CKO mice have more apneas following sighs and (Bii) spontaneous apneas per hour than control littermates. Caffeine treatment rescues apneas. (Biii) Atoh1::En1-CKO mice have more sighs per hour than control littermates, which was not be rescued by caffeine. (Biv) Atoh1::En1-CKO mice breathe more irregularly than control littermates, which can be rescued with caffeine treatment. Inter breath interval irregularity was defined as: absolute (breath length(n + 1) – breath length(n)/breath length(n). Significance was determined using a Two-way ANOVA (genotype*treatment), Tukey-Kramer post-hoc. *p<0.05. **p<0.01. ***p<0.001. ****p<0.0001. Error bars represent: mean ± SEM.
-
Figure 2—source data 1
Raw plethysmography data room air recordings.
- https://doi.org/10.7554/eLife.38455.008
Figure 2—figure supplement 1
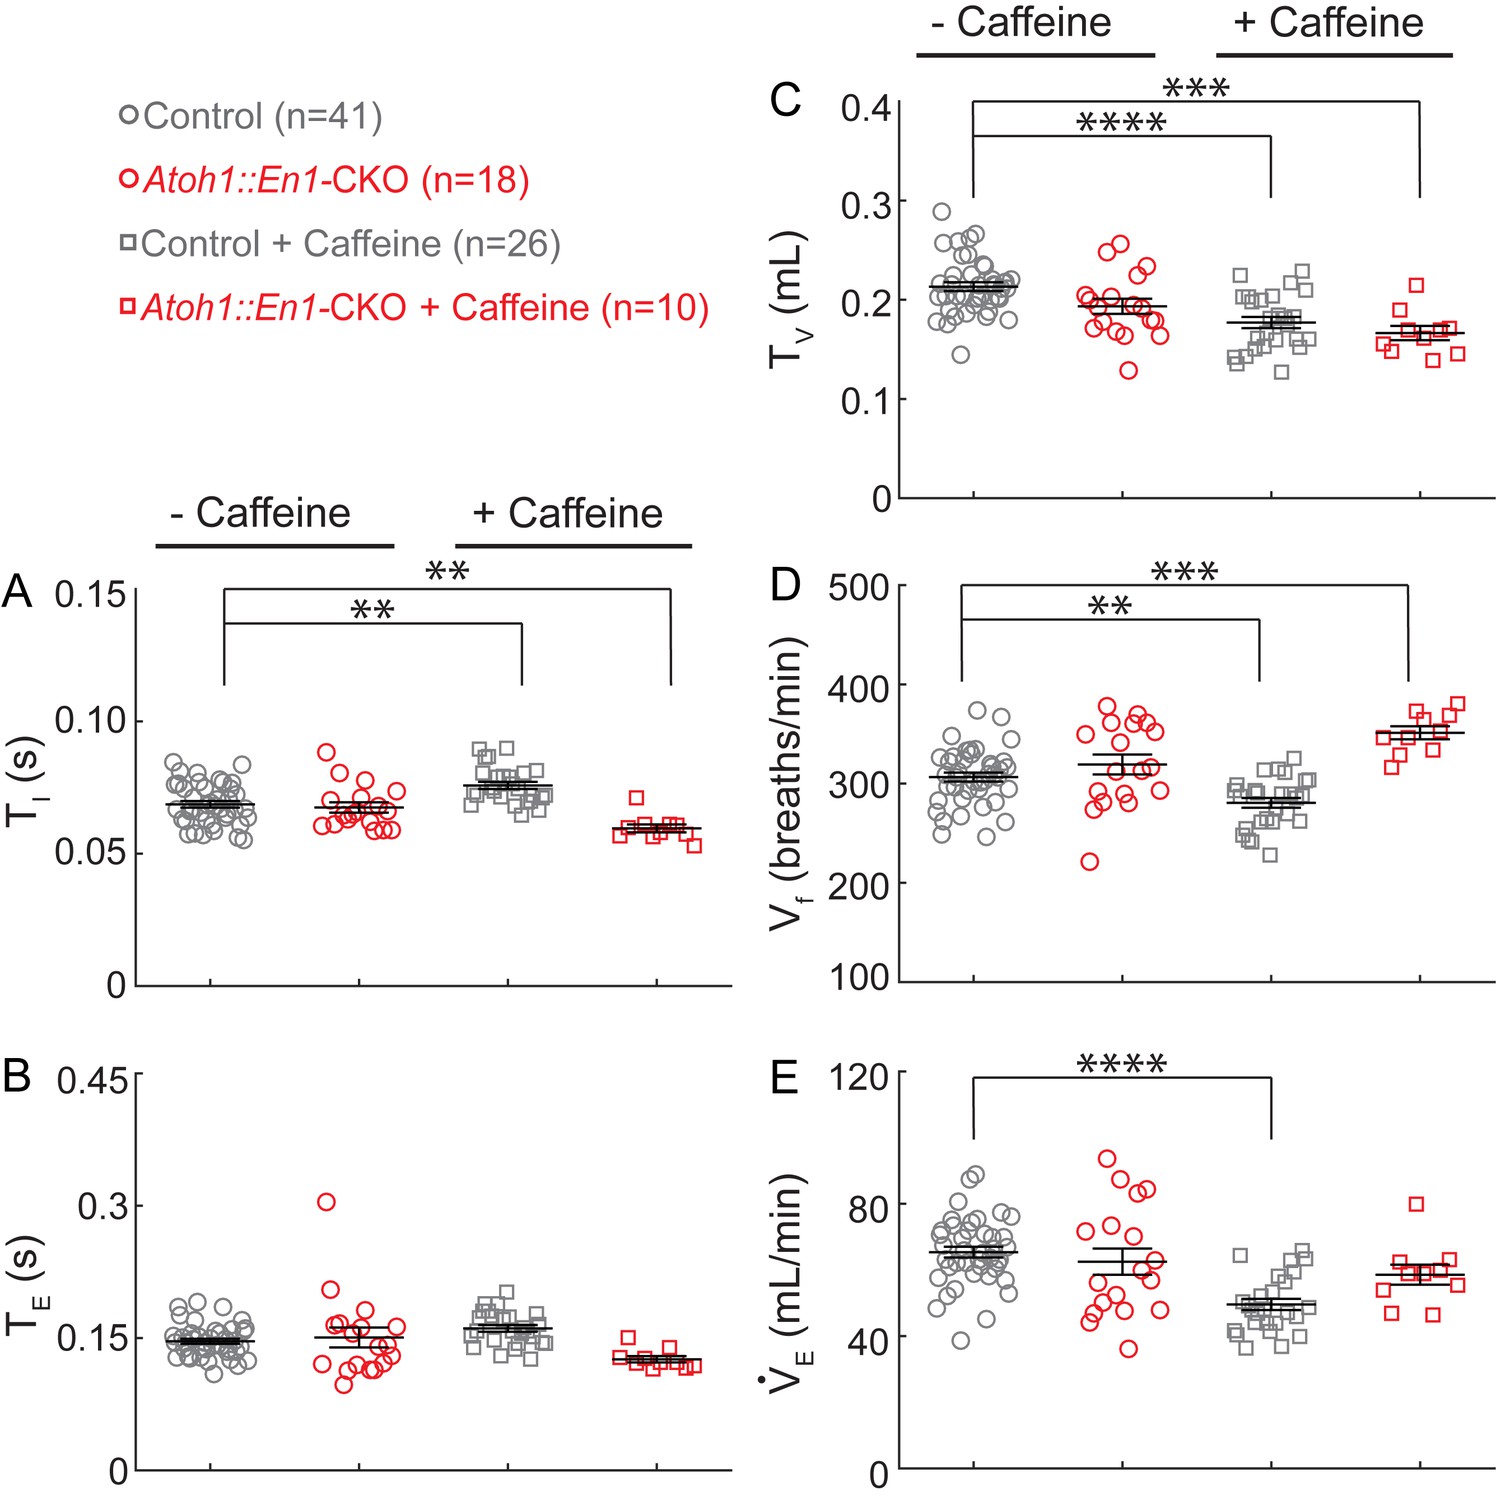
Caffeine treatment has opposing effects on changes in respiratory rhythms and tidal volume between Atoh1::En1-CKO mice and control littermates.
There was no significant difference in (A) inspiration time (TI), (B) expiration time (TE), (C) Tidal volume (TV), (D) respiratory frequency (Vf), or (E) minute ventilation (VE) between Atoh1::En1-CKO mice and control littermates at baseline. Caffeine treatment caused a slight, but statistically significant, increase in TI (A) resulting in an increase in Vf in control mice (D), and, conversely, a decrease in TI (A) and increase in Vf in Atoh1::En1-CKO mice (D). Caffeine treatment also caused a decrease in TV in both control and Atoh1::En1-CKO mice (C), resulting in a decrease in VE in control mice but not in Atoh1::En1-CKO mice (E) due to the observed increase in Vf (D). Significance was determined using a Two-way ANOVA (genotype*treatment), Tukey-Kramer post-hoc. *p<0.05. **p<0.01. ***p<0.001. ****p<0.0001. Error bars represent mean ± SEM.
Figure 3 with 1 supplement

Atoh1::En1-CKO mice have abnormal respiratory chemoresponses that cannot be rescued by caffeine.
Normalized changes in tidal volume (TV) (A), respiratory frequency (Vf) (B), and minute ventilation (VE) (C and D) during hypoxic challenge (10% O2, balanced N2). Atoh1::En1-CKO mice show respiratory repression during hypoxia (B) that cannot be rescued by caffeine (D). Normalized changes in TV (E), Vf (F), and VE (G and H) during hypercapnic chemochallenge (5% CO2, 21% O2, balanced N2). Atoh1::En1-CKO mice have attenuated response to hypercapnia (E and F) that cannot be rescued by caffeine (H). Significance was determined using a t-test (2-tailed) at each individual time point, *p<0.0011 (0.05/44 for Bonferroni correction). Error bars represent mean ± SEM.
-
Figure 3—source data 1
Raw plethysmography data respiratory chemoresponses.
- https://doi.org/10.7554/eLife.38455.012
Figure 3—figure supplement 1

Silencing cerebellar cortex output neurons does not cause abnormal respiratory control.
(A) Mice with silenced Purkinje cells (Pcp2Cre/+;Slc32a1Flox/Flox) have slightly more irregular breathing rhythms (iii), but otherwise normal respiratory rhythms in room air. Significance for room air breathing parameters were determine using a t-test (2-tailed). *p<0.05. (B) Pcp2Cre/+;Slc32a1Flox/Flox have normal respiratory chemoresponses to hypoxia and hypercapnia. Significance was determined using a t-test (2-tailed) at each individual time point, *p<0.0011 (0.05/44 for Bonferroni correction). Error bars represent mean ± SEM.
-
Figure 3—figure supplement 1—source data 1
Raw plethysmography data respiratory chemoresponses.
- https://doi.org/10.7554/eLife.38455.011
Figure 4
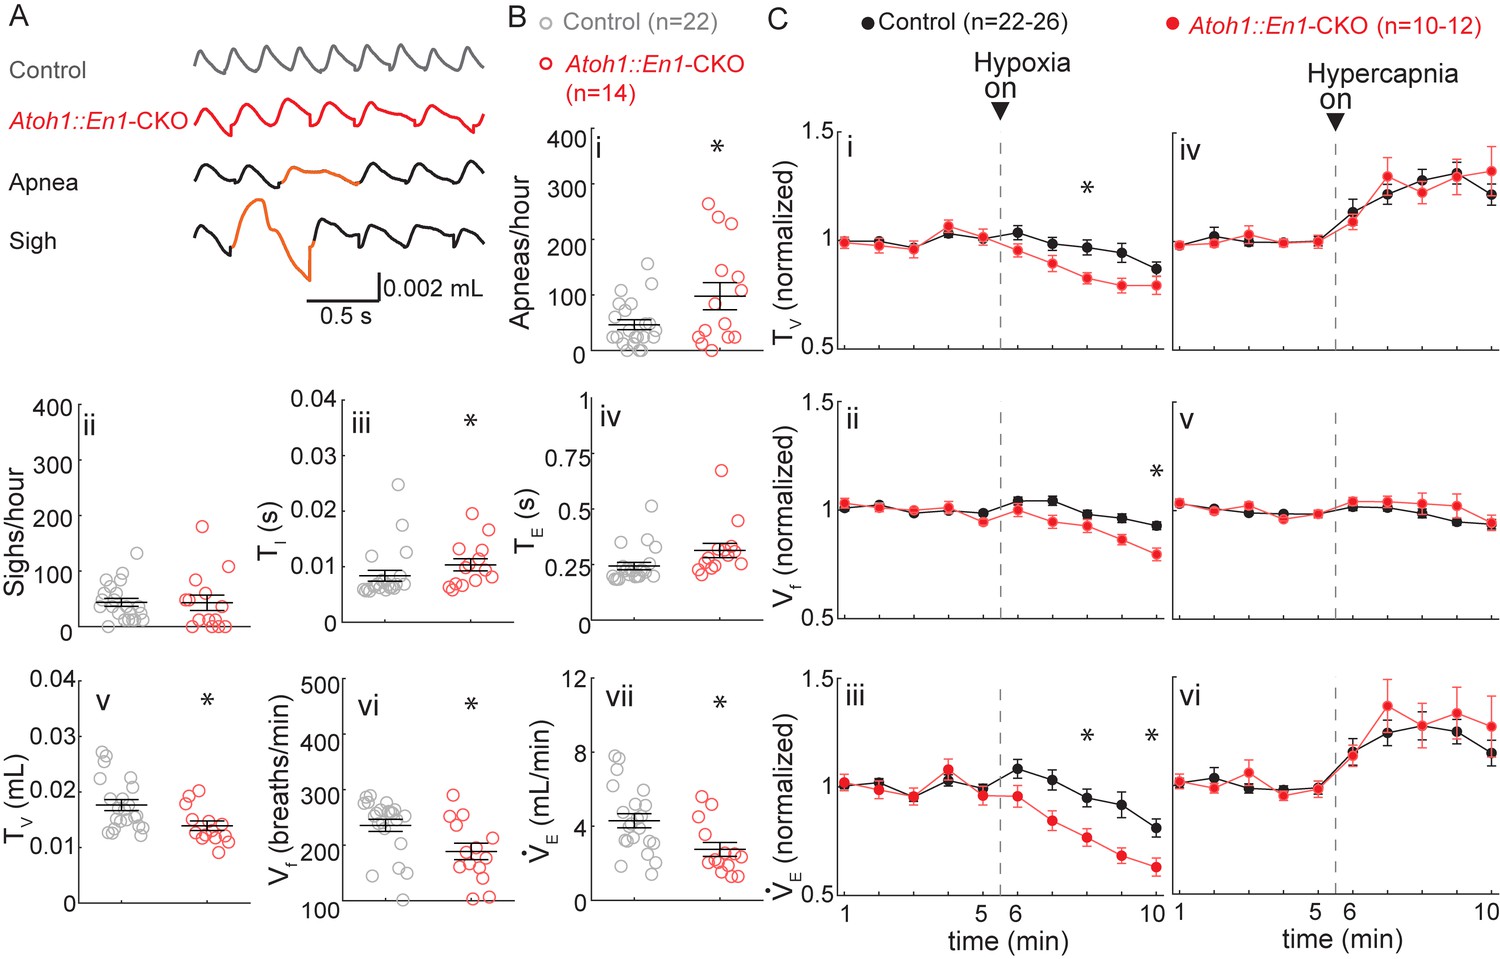
P7 Atoh1::En1-CKO mice have abnormal respiratory control.
(A) Representative plethysmography traces from a control and Atoh1::En1-CKO mouse. Example traces of apnea and sigh. (B) One-week-old Atoh1::En1-CKO mice have significantly more apneas (i), longer inspiratory time (TI) (iii), smaller tidal volume (TV) (v), slower respiratory rhythms (Vf) (vi), and lower minute ventilation (VE) (vii). Number of sighs (ii) and expiratory time (TE) (iv) were not different. Significance for room air breathing parameters were determined using a t-test (2-tailed). *p<0.05. (C) One-week-old Atoh1::En1-CKO mice have enhanced respiratory depression in response to hypoxia through an enhanced decrease in TV (i) and Vf (ii), resulting in a decreased VE(iii). There were no significant differences in the respiratory chemoresponses to hypercapnia (iv to vi). Significance was determined using a t-test (2-tailed) at each individual time point, *p<0.01. Error bars represent mean ± SEM.
-
Figure 4—source data 1
Raw data P7 plethysmography recordings.
- https://doi.org/10.7554/eLife.38455.014
Figure 5 with 1 supplement
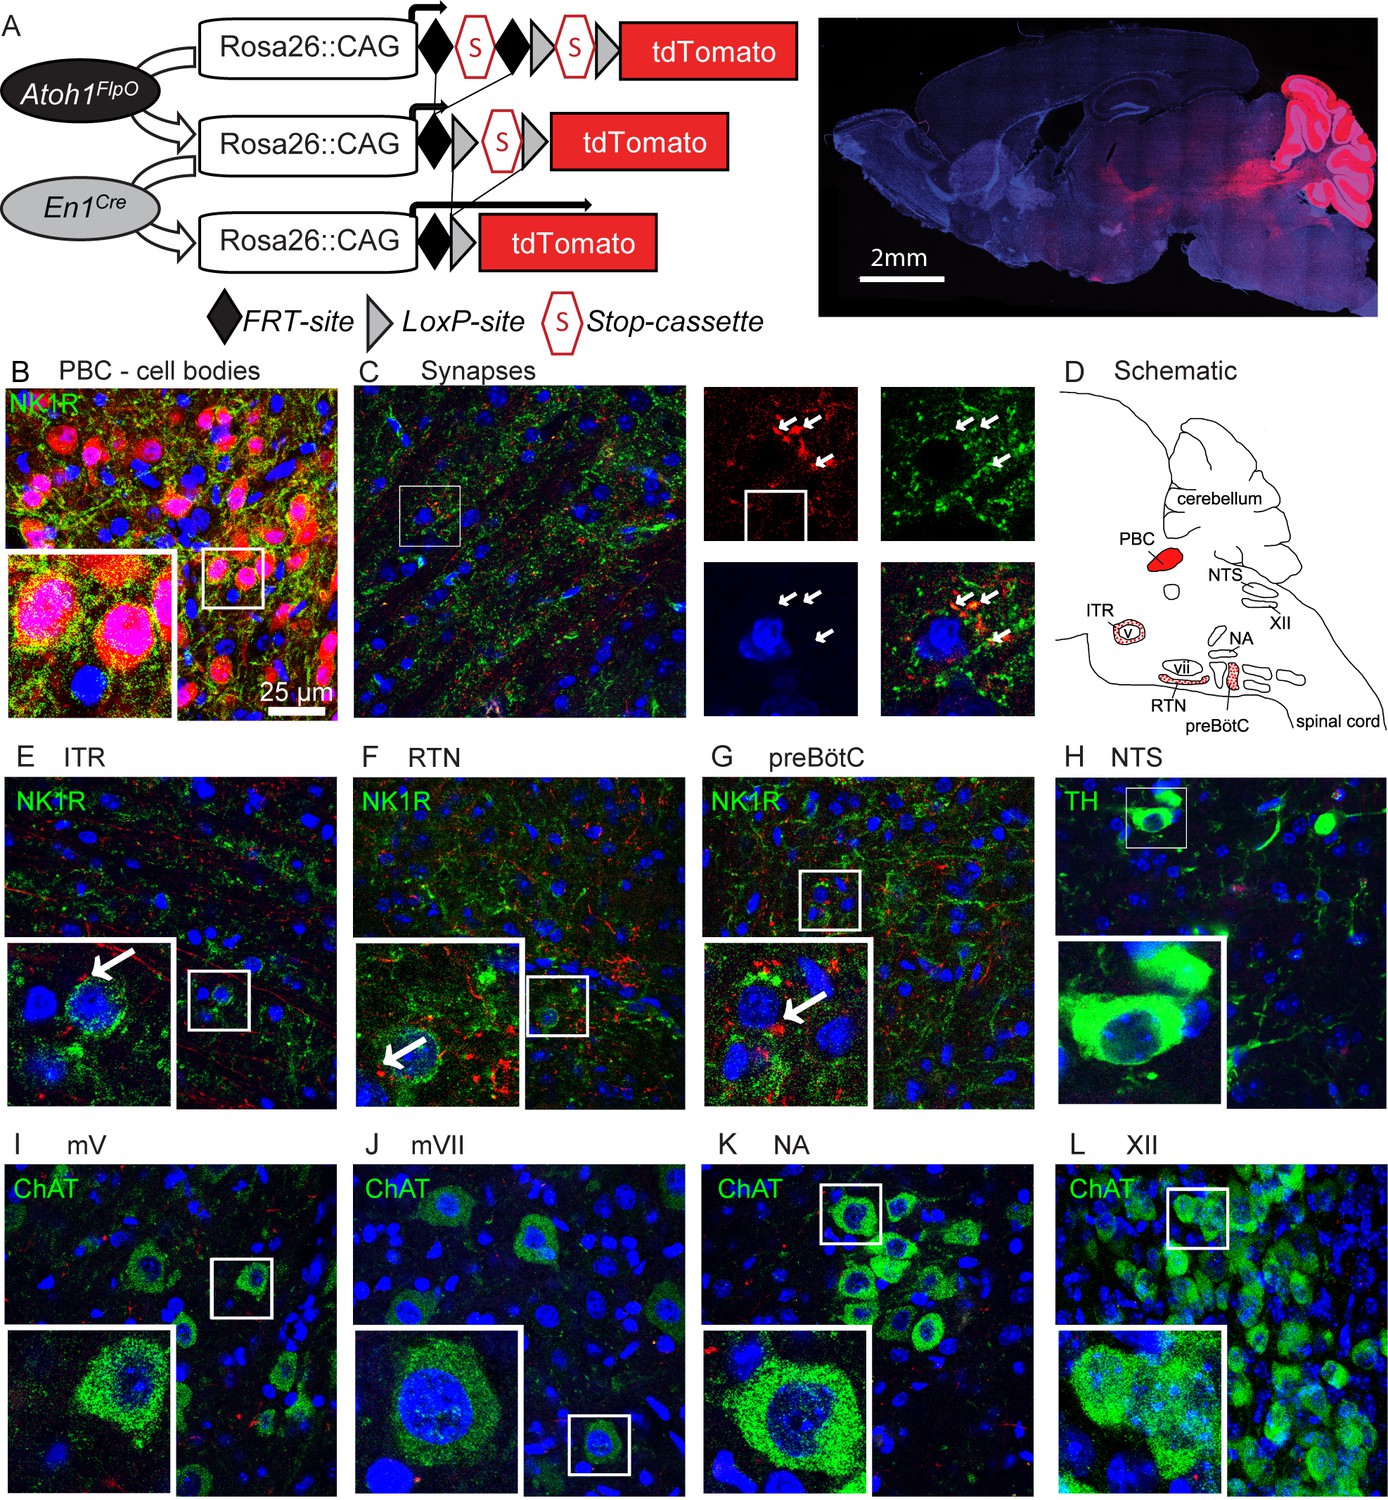
Rostral rhombic lip neurons project to paramotor nuclei and the preBötC.
(A) Intersectional strategy to label only those neurons with a history of Atoh1 (FlpO) and En1 (Cre) expression. Representative whole-brain image of P21 Atoh1FlpO;En1Cre;Ai65/+ mouse on the right. (B) Cell bodies in the PBC are tdTomato+. (C) tdTomato+ puncta overlap with the synapse-marker synapsin. (D) Schematic of the respiratory circuitry. Solid red PBC is the only respiratory nucleus expressing tdTomato. Dotted nuclei are the nuclei in which tdTomato+ projections were observed. TdTomato+ puncta near cell bodies were observed in the (E) ITR, (F) RTN, and (G) preBötC. No tdTomato+puncta were observed in the (H) NTS, or in respiratory motor nuclei (I) mV, (J) mVII, (K), NA, (L), XII. Abbreviations: PBC, parabrachial complex; ITR, intertrigeminal region; RTN, retrotrapezoid nucleus; preBötC, preBötzinger Complex; NTS, nucleus tractus solitarius; mV, trigeminal motor nucleus; mVII, facial motor nucleus; NA, nucleus ambiguus; XII, hypoglossal motor nucleus.
Figure 5—figure supplement 1
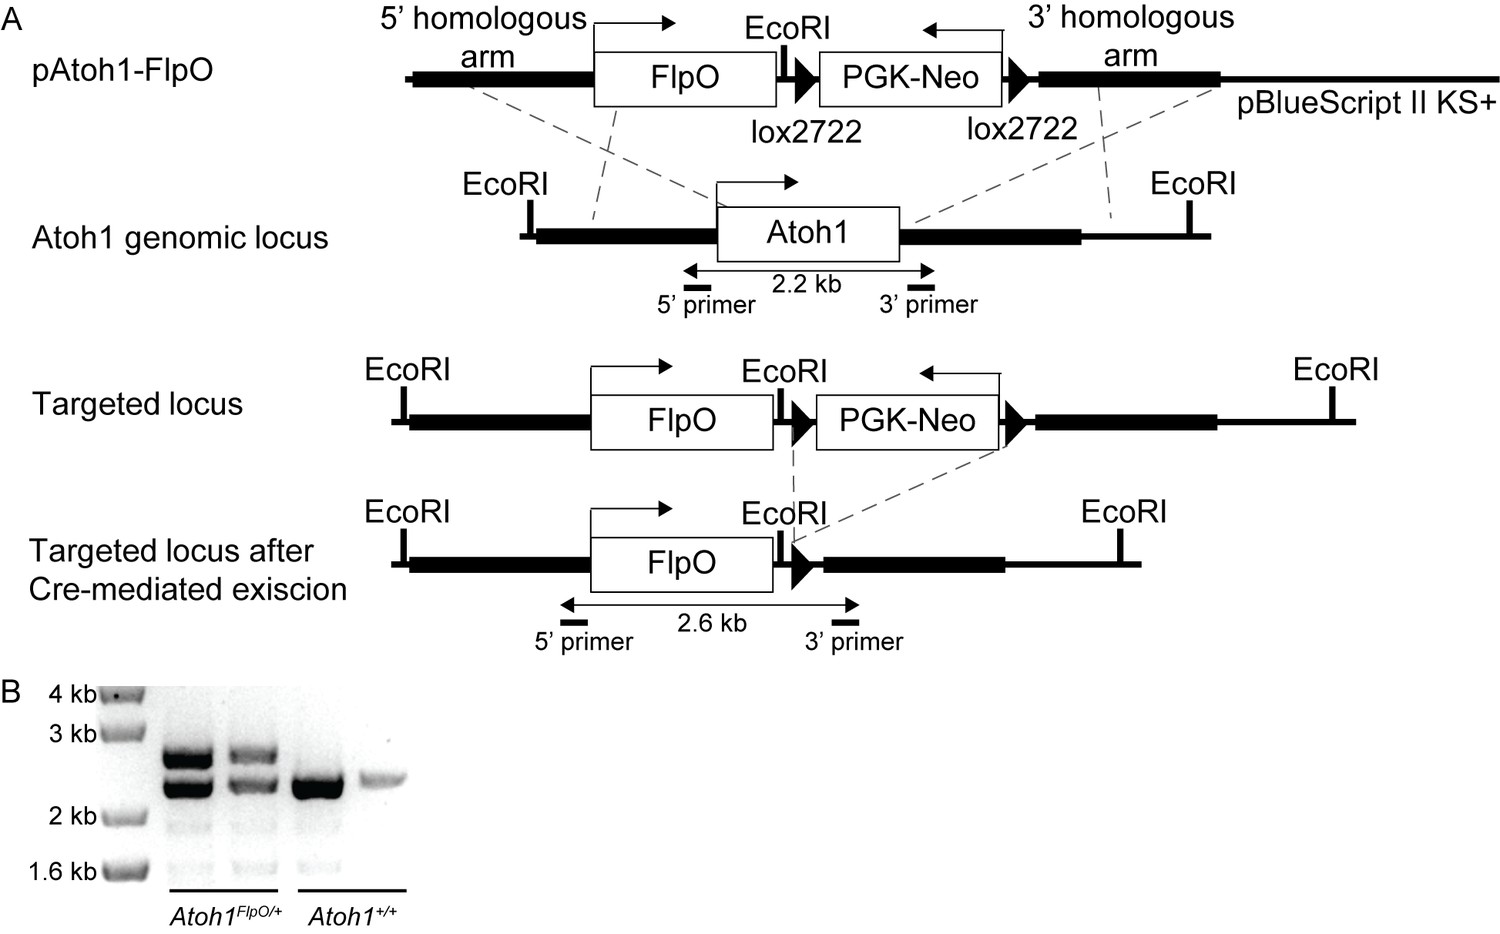
Generation of Atoh1FlpO mice.
(A) A FlpO-lox2722-PGK-Neo-lox2722 cassette was cloned in between the 5’ and 3’ homologues arm of the Atoh1 locus in a pBlueScript II KS+ vector. Through homologous recombination this sequence was targeted to the endogenous Atoh1 locus. Sox2Cre was used to excise the PGK-Neo cassette from the target sequence. (B) Representative PCR genotyping reaction from wild-type and Atoh1FlpO/+ mice.
Figure 6 with 2 supplements
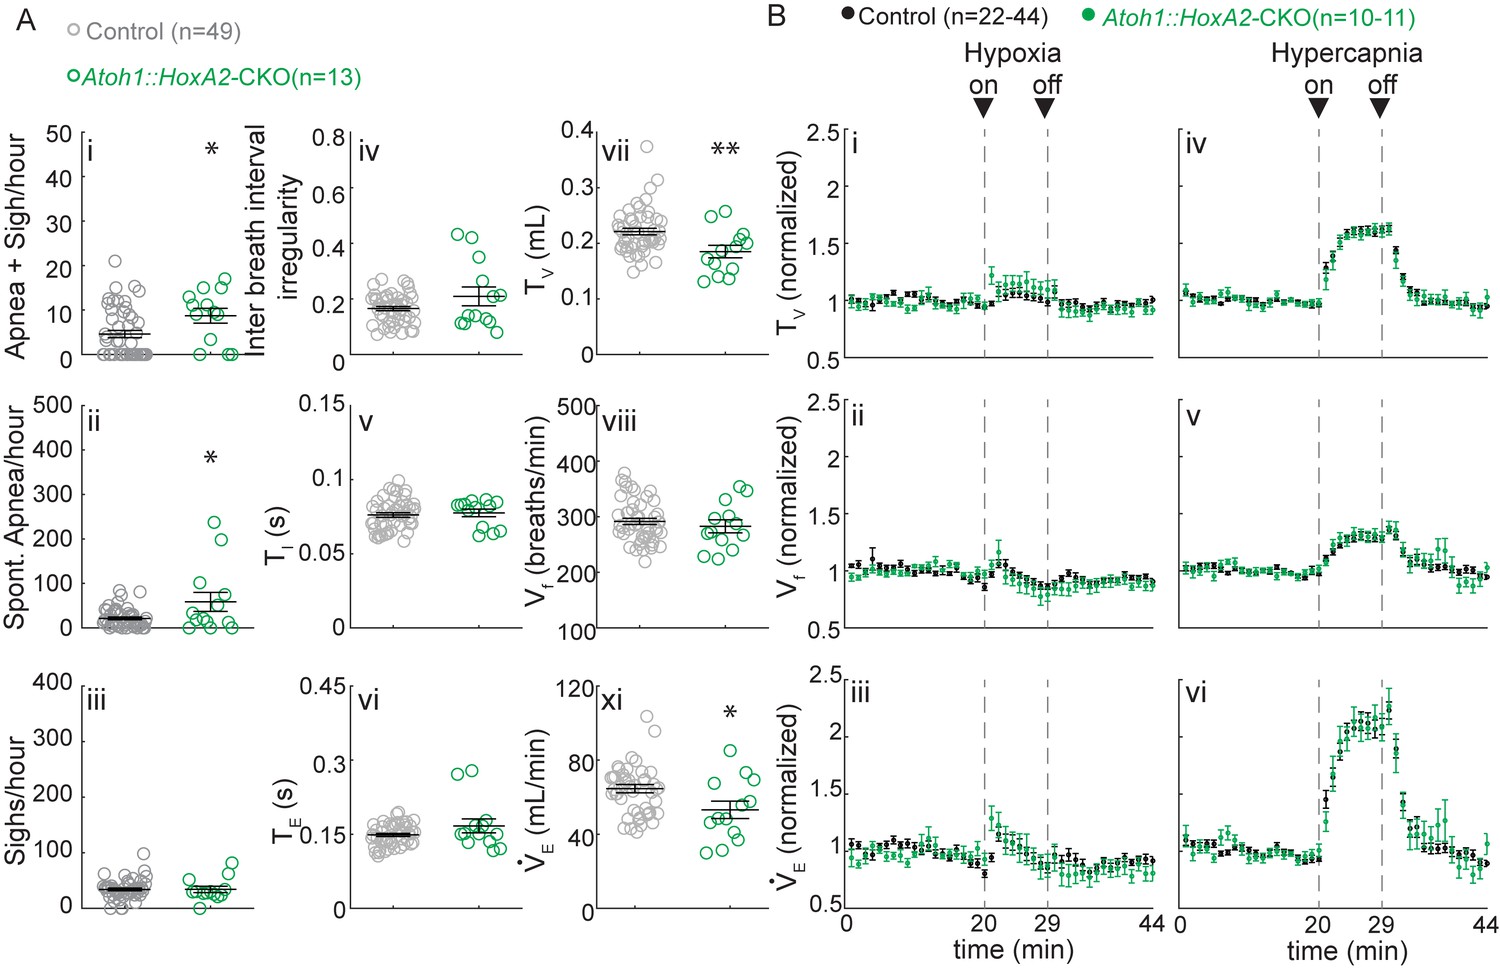
Atoh1::HoxA2-CKO mice have normal chemoresponses.
(A) Atoh1::HoxA2-CKO mice have more apneas following sighs (i) and spontaneous apneas (ii) than control littermates and a smaller tidal volume per breath (TV) (vi) resulting in smaller minute ventilation (VE) (Viii). Other breathing parameters were not affected. Significance for room air breathing parameters were determined using a t-test (2-tailed). *p<0.05, **p<0.01. (B) Atoh1::HoxA2-CKO mice have normal respiratory chemoresponses in hypoxia (i to iii) and hypercapnia (iv to vi). Significance was determined using a t-test (2-tailed) at each individual time point, *p<0.0011 (0.05/44 for Bonferroni correction). Error bars represent mean ± SEM.
-
Figure 6—source data 1
Raw numbers observed surviving offspring.
- https://doi.org/10.7554/eLife.38455.020
Figure 6—figure supplement 1
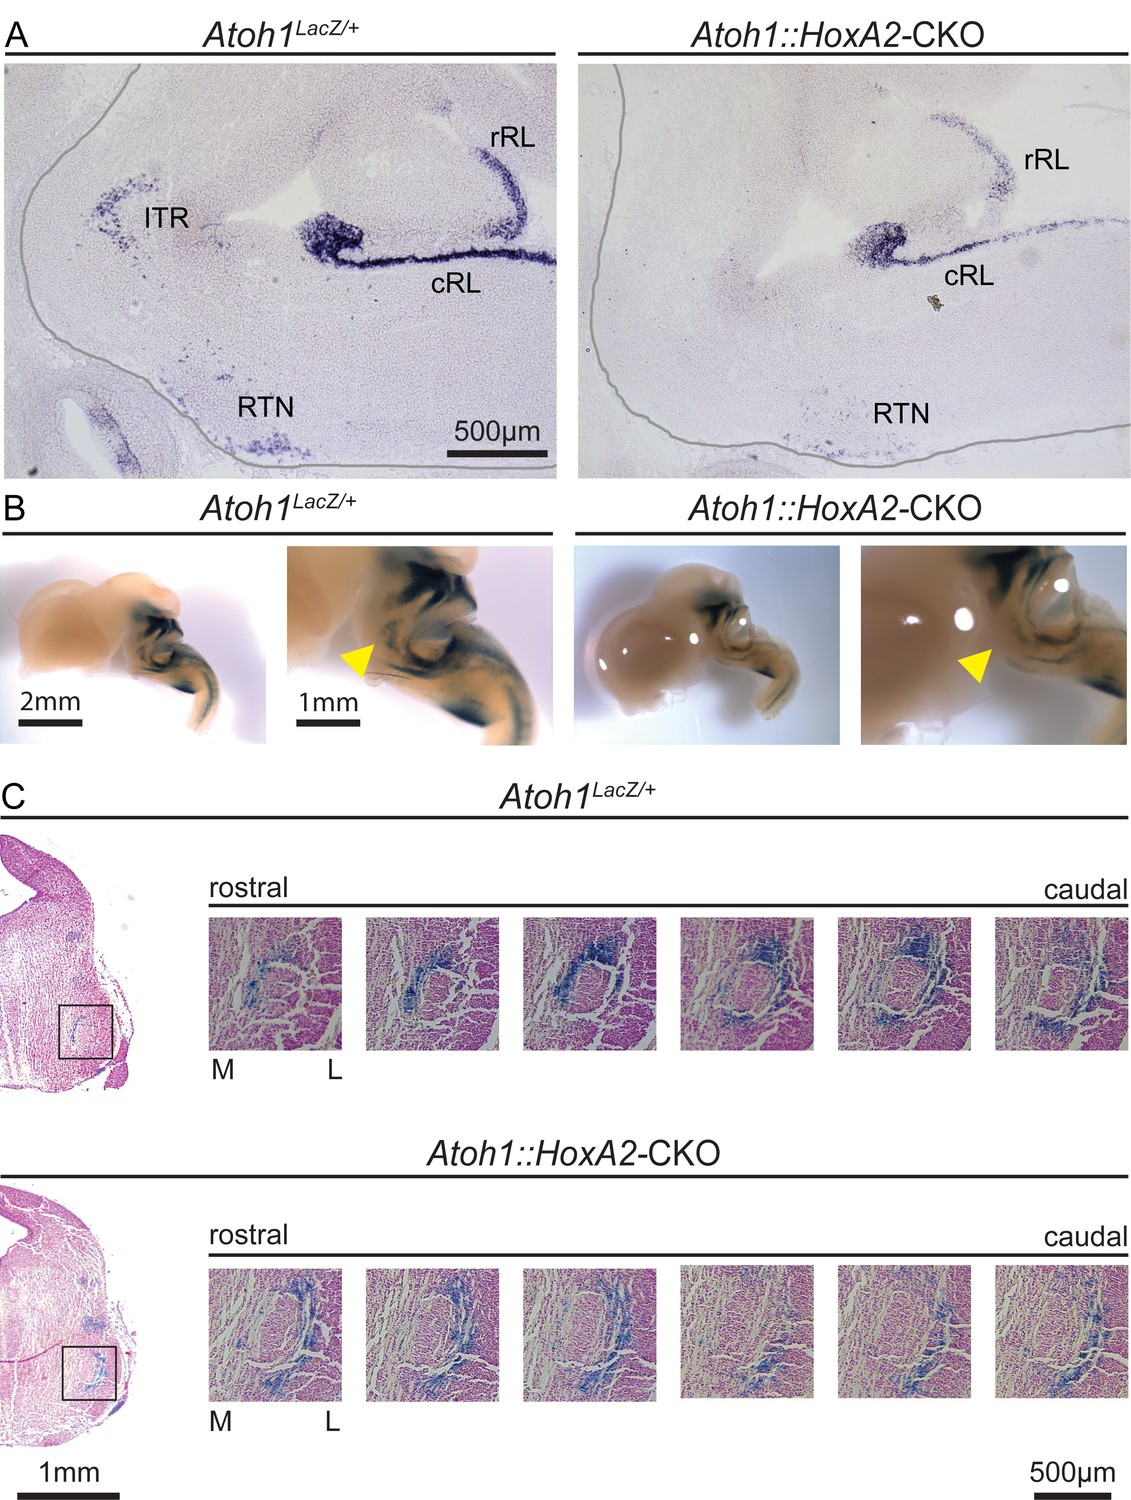
Atoh1::HoxA2-CKO mice have abnormal migration of ITR neurons.
(A) In situ hybridization with an Atoh1 probe confirms loss of Atoh1 from the ITR in Atoh1::HoxA2-CKO E14.5 embryos. (B) X-gal stain in Atoh1LacZ/+ and Atoh1::HoxA2-CKO E14.5 embryos to visualize Atoh1-dependent cells in the developing brain. (C) Serial sections at the level of the ITR visualize an abnormal location of ITR neurons at the lateral site of the trigeminal motor neuron in Atoh1::HoxA2-CKO E14.5 embryos. Abbreviations: rRL, rostral rhombic lip; cRL, caudal rhombic lip; ITR, intertrigeminal region; RTN, retrotrapezoid nucleus.
Figure 6—figure supplement 2
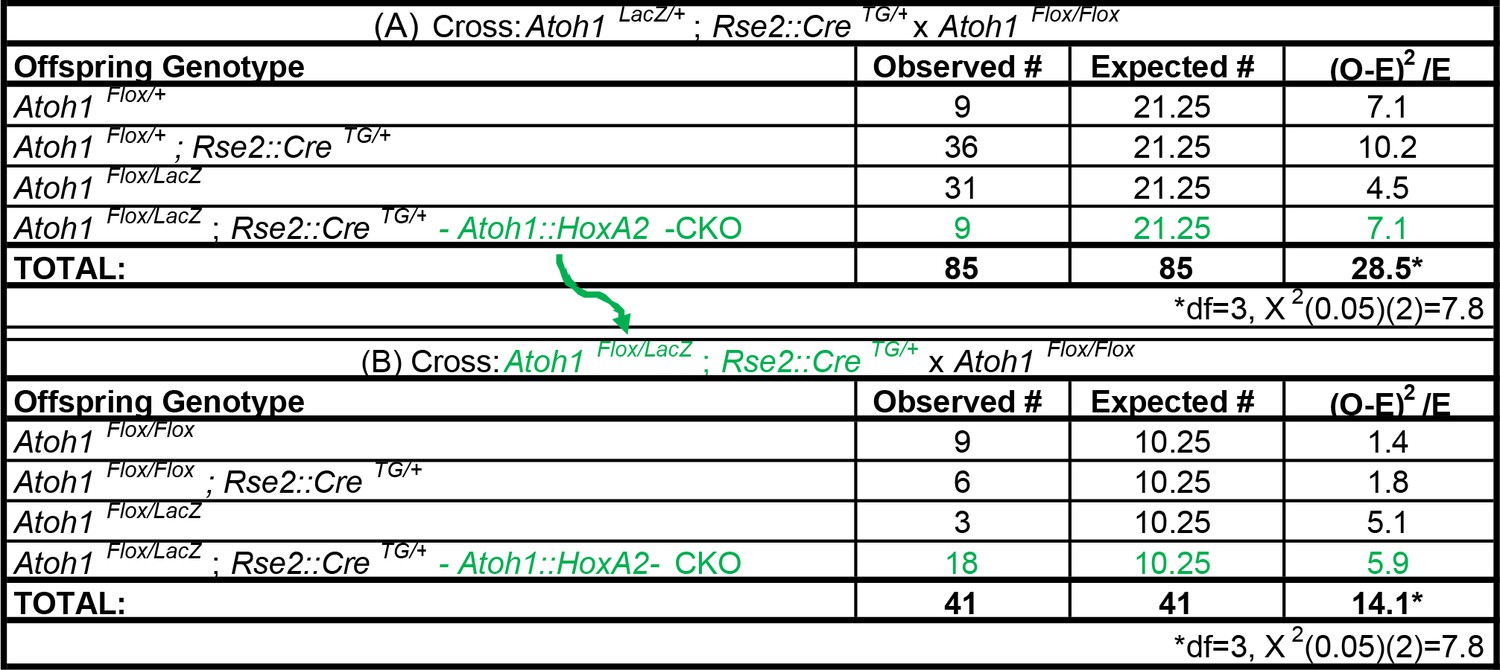
Atoh1::HoxA2-CKO mice survive the neonatal period.
(A) Ratio of surviving offspring from Atoh1LacZ /+; HoxA2::CreTG/+ x Atoh1Flox/Flox cross: 9/85 (10.6%) surviving pups were Atoh1::HoxA2-CKO mice (B) Ratio of surviving offspring from Atoh1Flox/LacZ; HoxA2::CreTG/+ x Atoh1Flox/Flox cross: 18/41 surviving pups (43.9%) were Atoh1::HoxA2-CKO mice. Green text indicates Atoh1::HoxA2-CKO mice. These crosses indicate Atoh1::HoxA2-CKO mice are not neonatal lethal and that the HoxA2::CreTG allele is linked to the Atoh1 allele.
Figure 7 with 1 supplement

Atoh1-dependent neurons involved in chemoresponses and rates of neonatal lethality.
https://doi.org/10.7554/eLife.38455.021
Figure 7—figure supplement 1

Atoh1-dCKO mice die in the neonatal period.
https://doi.org/10.7554/eLife.38455.022
Author response image 1
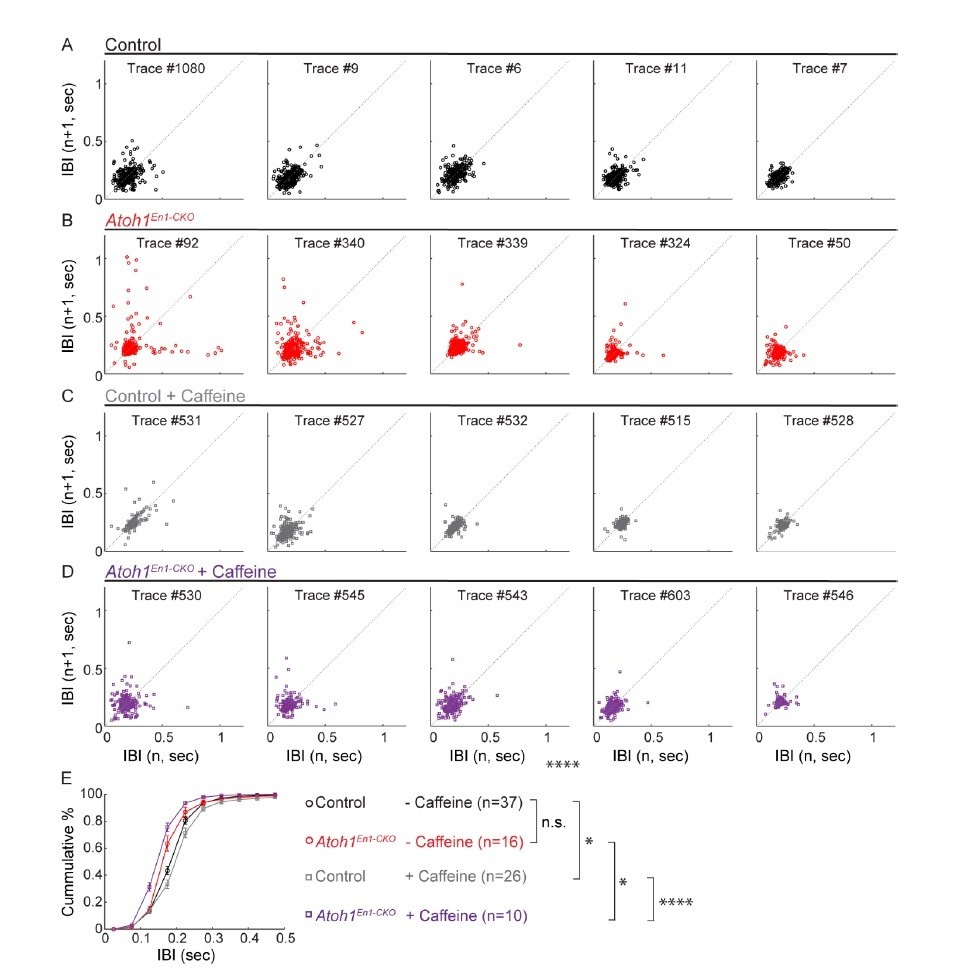
Caffeine had opposing effects on respiratory frequency distributions in Atoh1En1-CKOmice and control littermates.
(A-D) Poincaré plots of breathing frequency of subsequent breaths plotted as the inter breath interval against subsequent breaths (n vs. n+1). Each plot represents the first 250 recorded breaths of five randomly selected animals from each group. Points that fall far away and a wider distribution from the dotted diagonal represent breaths that are more irregular. Breaths with an IBI larger than 0.5 seconds are possibly apnea. For each group, the plots were ordered from most irregular breathing to most regular breathing animals to ease visual comparison. (E) Cumulative frequency distribution curves Atoh1En1-CKOand control mice treated with or without caffeine. Untreated control and Atoh1En1-CKO mice had similar frequency distributions. The frequency distribution curve for control mice was right-shifted, representing longer IBIs and possibly calmer mice. The frequency distribution curve for Atoh1En1-CKO mice was left-shifted, representing shorter IBIs and potentially less calm mice. Significance was determined using a two-way repeated measure ANOVA. *p<.05. **p<.01. ***p<0.001. ****p<.0001. Error bars represent mean ± SEM.
Tables
Key resources table
| Reagent type (species) or resource | Designation | Source or reference | Identifiers |
|---|---|---|---|
| Strain: C57BL/6 | Rosalsl-tdTomato | The Jackson Laboratory | RRID: IMSR_JAX:007914 |
| Strain: C57BL/6 | Atoh1Cre | Yang et al., 2001 | RRID: MGI:4844110 |
| Strain: C57BL/6 | En1 Cre | The Jackson Laboratory | RRID: IMSR_JAX:007916 |
| Strain: C57BL/6 | Rosalsl-LacZ | The Jackson Laboratory | RRID:IMSR_JAX:012429 |
| Strain: C57BL/6 | Atoh1LacZ | The Jackson Laboratory | RRID:IMSR_JAX:005970 |
| Strain: C57BL/6 | Atoh1Flox | The Jackson Laboratory | RRID:MGI:4420944 |
| Strain: C57BL/6 | Slc32a1Flox | The Jackson Laboratory | RRID:IMSR_JAX:012897 |
| Strain: C57BL/6 | Pcp2::CreTG | The Jackson Laboratory | RRID:IMSR_JAX:004146 |
| Strain: C57BL/6 | HoxA2::CreTG | Awatramani et al. (2003) | N/A |
| Strain: C57BL/6 | Phox2b::CreTG | The Jackson Laboratory | RRID: IMSR_JAX:016223 |
| Strain: C57BL/6 | Atoh1FlpO | This paper: Figure 5—figure supplement 1 | N/A |
| Strain: C57BL/6 | RosaFSF-LSL-tdTomato | The Jackson Laboratory | RRID:IMSR_JAX:021875 |
| Strain: C57BL/6 | Sox2::CreTG | The Jackson Laboratory | RRID:MGI:3801167 |
| Antibody | anti-cFos (rabbit polyclonal) | Santa Cruz | SC-52; RRID:AB_2106783 |
| Antibody | anti-NK1R (rabbit polyclonal) | Advanced Targeting Systems | AB-N04; RRID: AB_171801 |
| Antibody | anti-CGRP (rabbit polyclonal) | Sigma Aldrich | C8198; RRID:AB_259091 |
| Antibody | anti-PACAP (mouse monoclonal) | Abcam | ab216589 |
| Antibody | anti-synapsin (mouse monoclonal) | Synaptic Systems | 106 001; RRID:AB_2617071 |
| Antibody | anti-TH (rabbit polyclonal) | ImmunoStar | 22941; RRID:AB_572268 |
| Antibody | anti-ChAT (goat polyclonal) | EMD millipore | AB144P; RRID:AB_2079751 |
| Chemical compound, drug | Caffeine | FISHER | S25215A |
| Chemical compound, drug | X-gal | Gold Biotechnology | X4281C |
| Commercial assay or kit | Caffeine/Pentoxifylline ELISA | Neogen | 106419 |
| Software, algorithm | MATLAB | MathWorks | RRID: SCR_001622 |
| Software, algorithm | Ponemah 3 | DSI | N/A |
| Software, algorithm | FinePoint | DSI | N/A |
| Software, algorithm | ImageJ | NIH | RRID: SCR_003070 |
Additional files
-
Source code 1
Custom MATLAB code.
- https://doi.org/10.7554/eLife.38455.023
-
Transparent reporting form
- https://doi.org/10.7554/eLife.38455.024
Download links
A two-part list of links to download the article, or parts of the article, in various formats.
Downloads (link to download the article as PDF)
Open citations (links to open the citations from this article in various online reference manager services)
Cite this article (links to download the citations from this article in formats compatible with various reference manager tools)
Loss of Atoh1 from neurons regulating hypoxic and hypercapnic chemoresponses causes neonatal respiratory failure in mice
eLife 7:e38455.
https://doi.org/10.7554/eLife.38455


