Direct visualization of a native Wnt in vivo reveals that a long-range Wnt gradient forms by extracellular dispersal
- University of North Carolina at Chapel Hill, United States
Figures
Figure 1 with 3 supplements
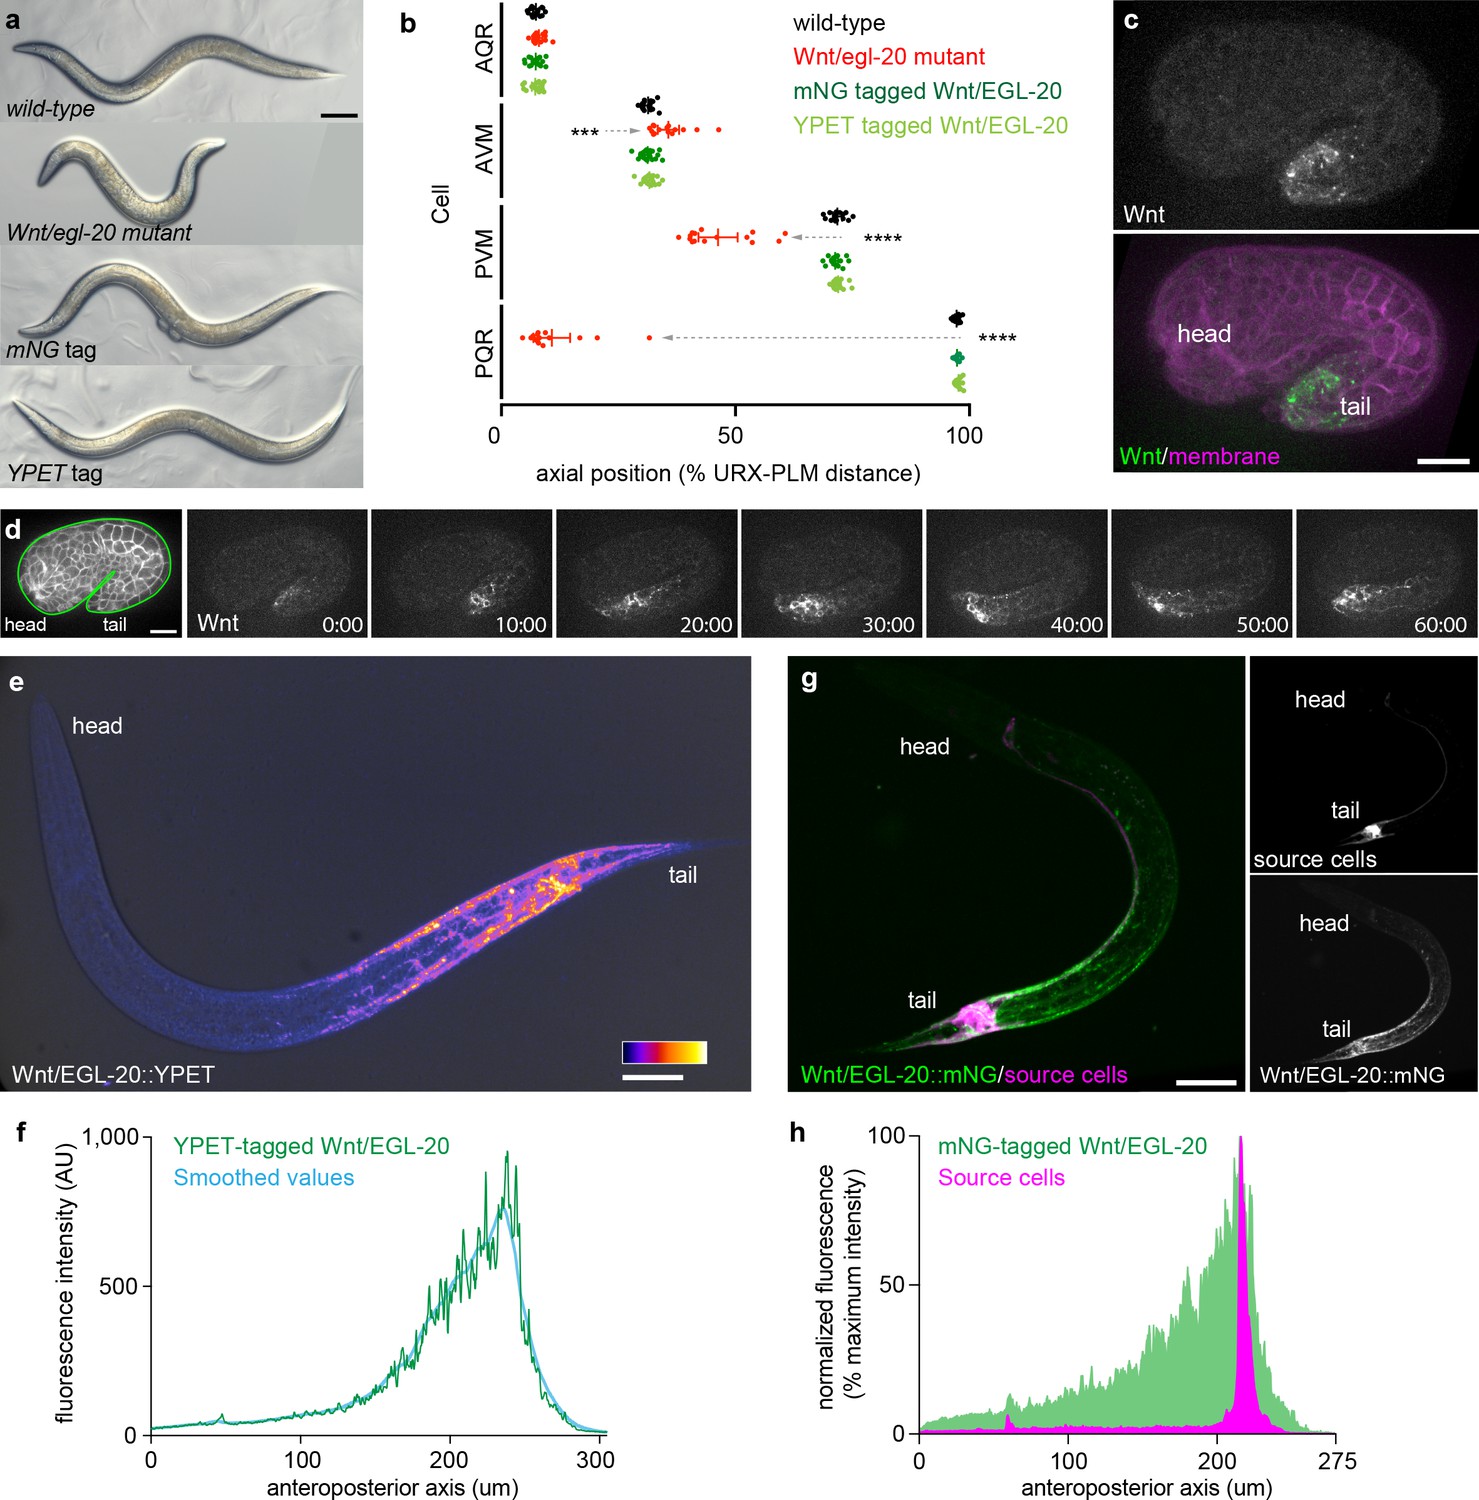
Tagged Wnt/EGL-20 is biologically functional and forms a long-range, anteroposterior gradient in vivo.
(a) transmitted light images of adult C. elegans with wild-type egl-20, the egl-20 loss-of-function mutant egl-20(n585), mNG-tagged egl-20, or YPET-tagged egl-20 showing normal external anatomy in mNG and YPET-tagged strains; (b) positions of QR neuroblast descendants AQR and AVM and QL neuroblast descendants PVM and PQR in wild-type, egl-20 mutant, egl-20::mNG, and egl-20::YPET strains showing that tagged EGL-20 is biologically functional for Q neuroblast migration. Dashed arrows indicate abnormal cell migrations. Means and 95% confidence intervals are shown for each cell type/genotype. Wild-type n = 15, egl-20(n585) n = 15, EGL-20::mNG n = 20, EGL-20::YPET n = 18.***, adjusted p=0.0005; ****, adjusted p<0.0001, all other comparisons adjusted p>0.9999, one-way ANOVA with Sidak’s multiple comparisons test; (c) maximum intensity projection of a comma stage embryo showing the earliest detectable Wnt/EGL-20::mNG fluorescence; (d) surface optical sections from time-lapse images of Wnt/EGL-20::mNG showing the onset of spreading from 1.5-fold to 2-fold stages; (e) maximum intensity projection of Wnt/EGL-20::YPET fluorescence in a living, late L1 stage animal illustrating the anteroposterior Wnt gradient colored with fire look-up-table and overlaid with transmitted light image; (f) profile plot of raw and LOWESS smoothed Wnt/EGL-20::YPET fluorescence intensity along the anteroposterior axis in the same worm as in (e); (g) maximum intensity projections of a living, mid L1 stage animal showing plasma membranes of egl-20 source cells labeled by Pegl-20>2x mKate2::PH (magenta) and Wnt/EGL-20::mNG protein (green); (h) profile plot of normalized EGL-20::mNG and Pegl-20>2x mKate2::PH fluorescence intensities along the anteroposterior axis illustrating Wnt dispersal from source cells. Images are oriented with anterior to left and dorsal to top. Scale bars = 0.1 mm in a, 10 μm in c and d, and 20 μm in e and g.
-
Figure 1—source data 1
Positions of Q neuroblast descendants in wild type, egl-20(n585), EGL-20::mNG, and EGL-20::YPET strains.
Source data corresponding to Figure 1b. Positions of Q neuroblast progeny after migration were quantified by using the non-motile URX neuron in the head and PLM neurons in the tail as fiducial markers. Relative positions of Q neuroblast progeny AQR, AVM, PVM, and PQR were calculated as a percentage of the distance between URX and PLM.
- https://doi.org/10.7554/eLife.38325.007
-
Figure 1—source data 2
Fluorescence intensity values for EGL-20::YPET, EGL-20::mNG, and Pegl-20 > 2 x mKate2::PH.
Source data corresponding to Figure 1f,h. Fluorescence intensity values were obtained in FIJI (Schindelin et al., 2012) by drawing a line the width of the worm from head to tail and using the ‘plot profile’ function. Off-worm background in a nearby region was then subtracted from the raw pixel intensities.
- https://doi.org/10.7554/eLife.38325.008
Figure 1—figure supplement 1
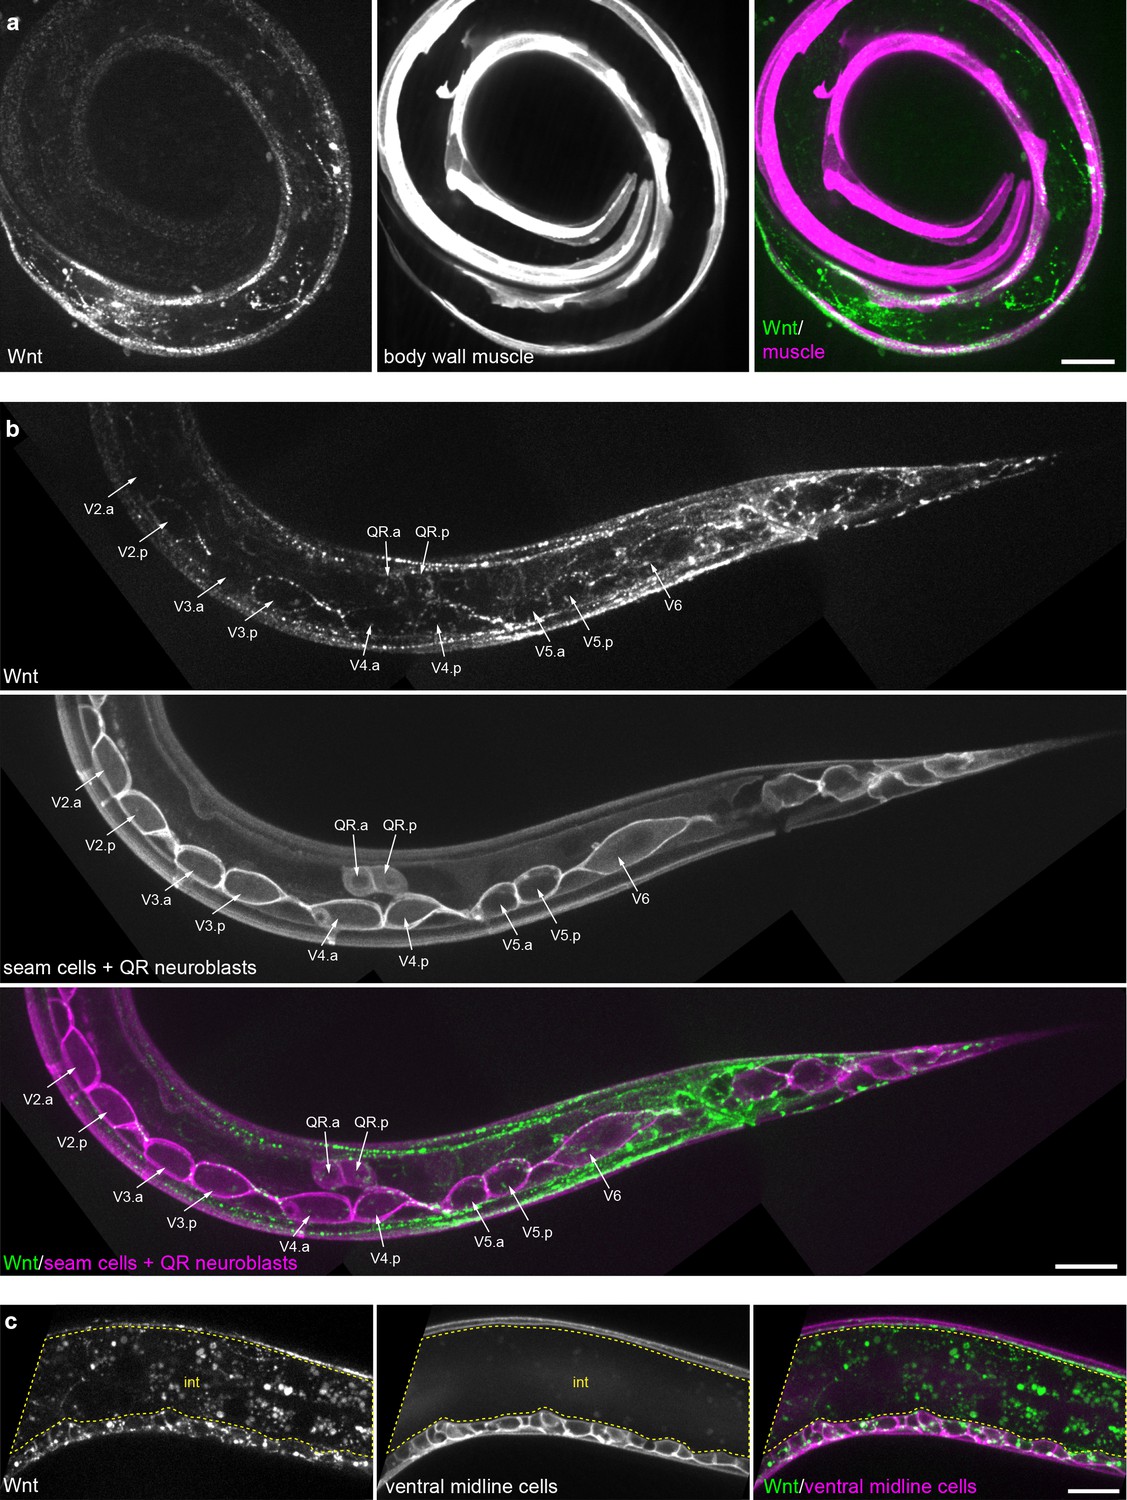
Tissue-specific Wnt/EGL-20::mNG localization.
(a) Maximum intensity projection of surface planes in an L1 larva highlighting Wnt/EGL-20::mNG (green) localization to body wall muscles marked by Pmyo-3>mCherry::PH (magenta). (b) Maximum intensity projection of surface planes in an L1 larva highlighting Wnt/EGL-20::mNG localization to plasma membranes of seam cells and migrating QR neuroblasts marked by Pwrt-2>2x mTurq2::PH (magenta). Note that Wnt/EGL-20 is concentrated in posterior daughters of seam cells V2-5. (c) Wnt/EGL-20 localization to ventral midline cells (magenta) in a mid-body region. Area of bright intestinal autofluorescence with 514 nm illumination is outlined. animal in (a) is curled with tail to bottom left and head to inner right. Images in (b) and (c) are oriented with anterior to left and dorsal to top,, scale bars = 10 μm.
Figure 1—figure supplement 2
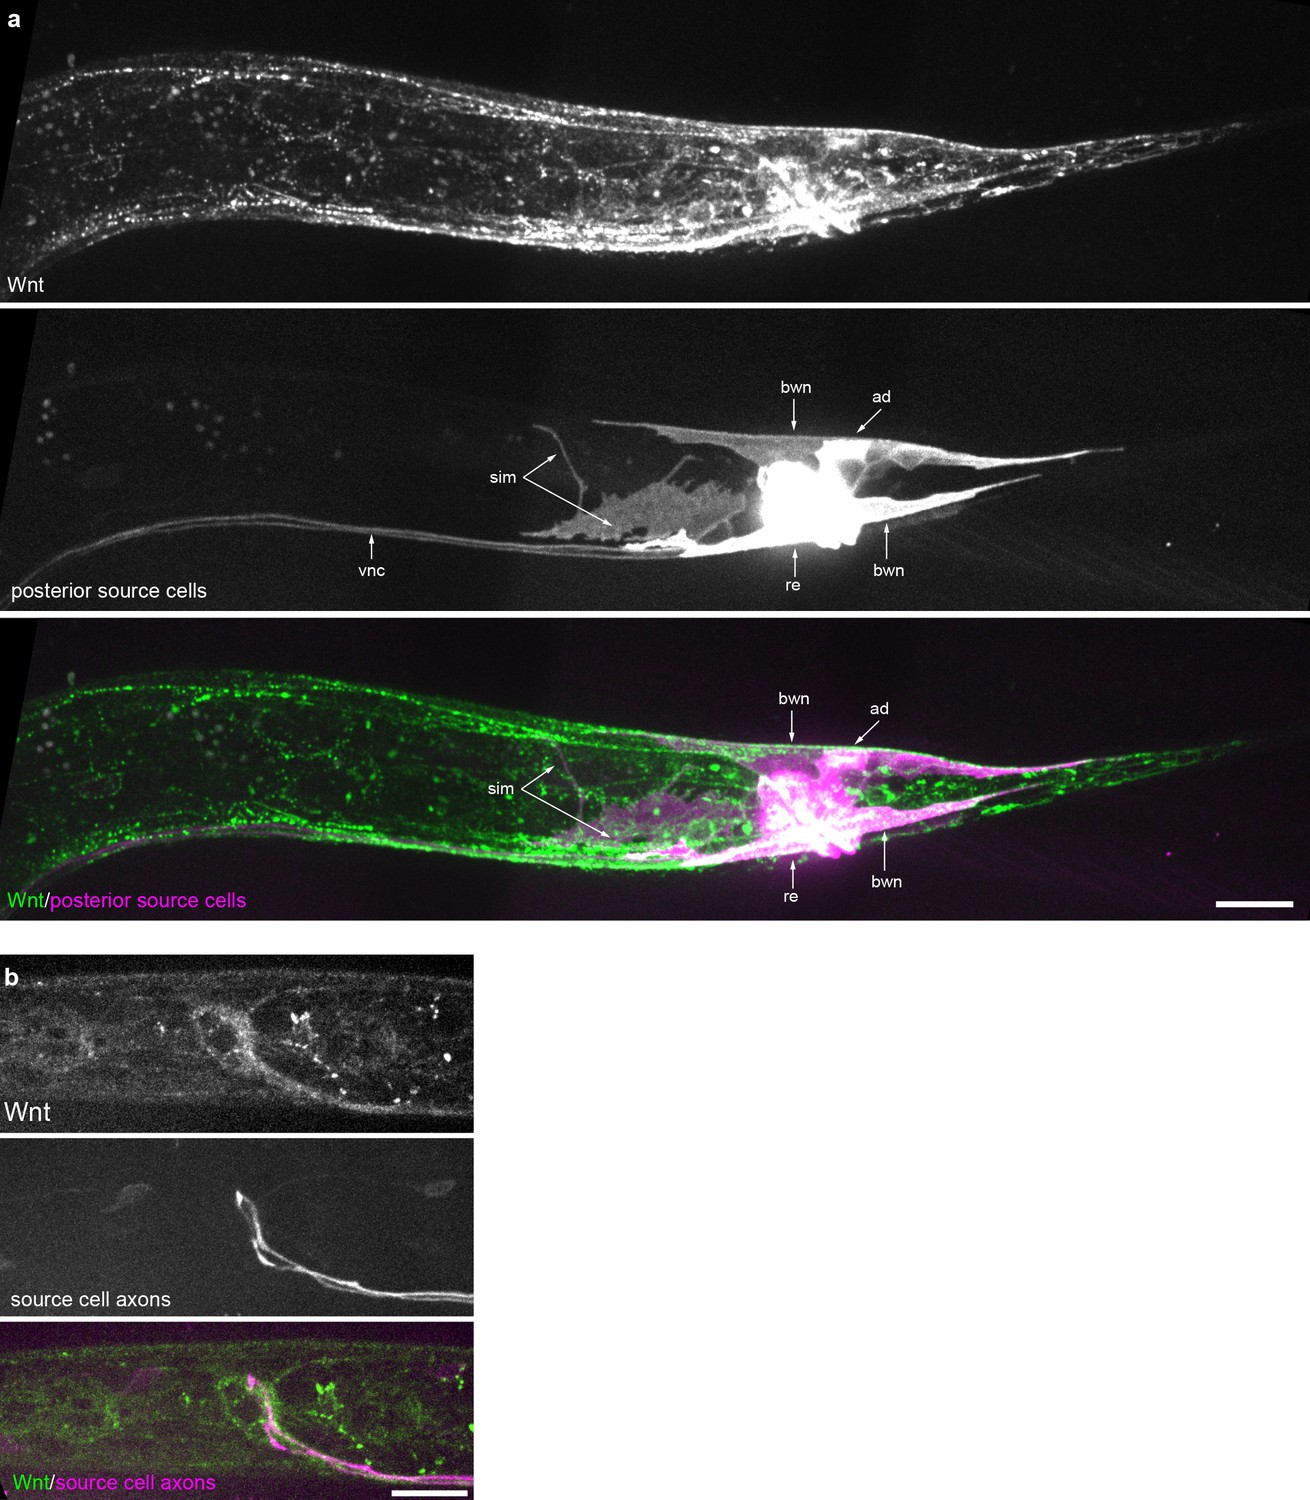
Wnt/EGL-20 localization and plasma membrane architectures of source cells.
(a) Maximum intensity projection of surface optical sections in the posterior of an L2 larva showing tagged Wnt (green) and plasma membranes of source cells marked by Pegl-20>2x mKate2::PH (magenta). (b) Maximum intensity projection of midline planes in the head region of an L2 animal highlighting Wnt/EGL-20::mNG localization near axons that encircle the pharynx and originate from posterior source neurons expressing Pegl-20>2x mKate2::PH. Abbreviations: ad, anal depressor muscles; bwn, body wall muscle; re, rectal epithelial cells; sim, stomatointestinal muscles; vnc, ventral nerve cord. Images are oriented with anterior to left and dorsal to top, scale bars = 10 μm.
Figure 1—figure supplement 3
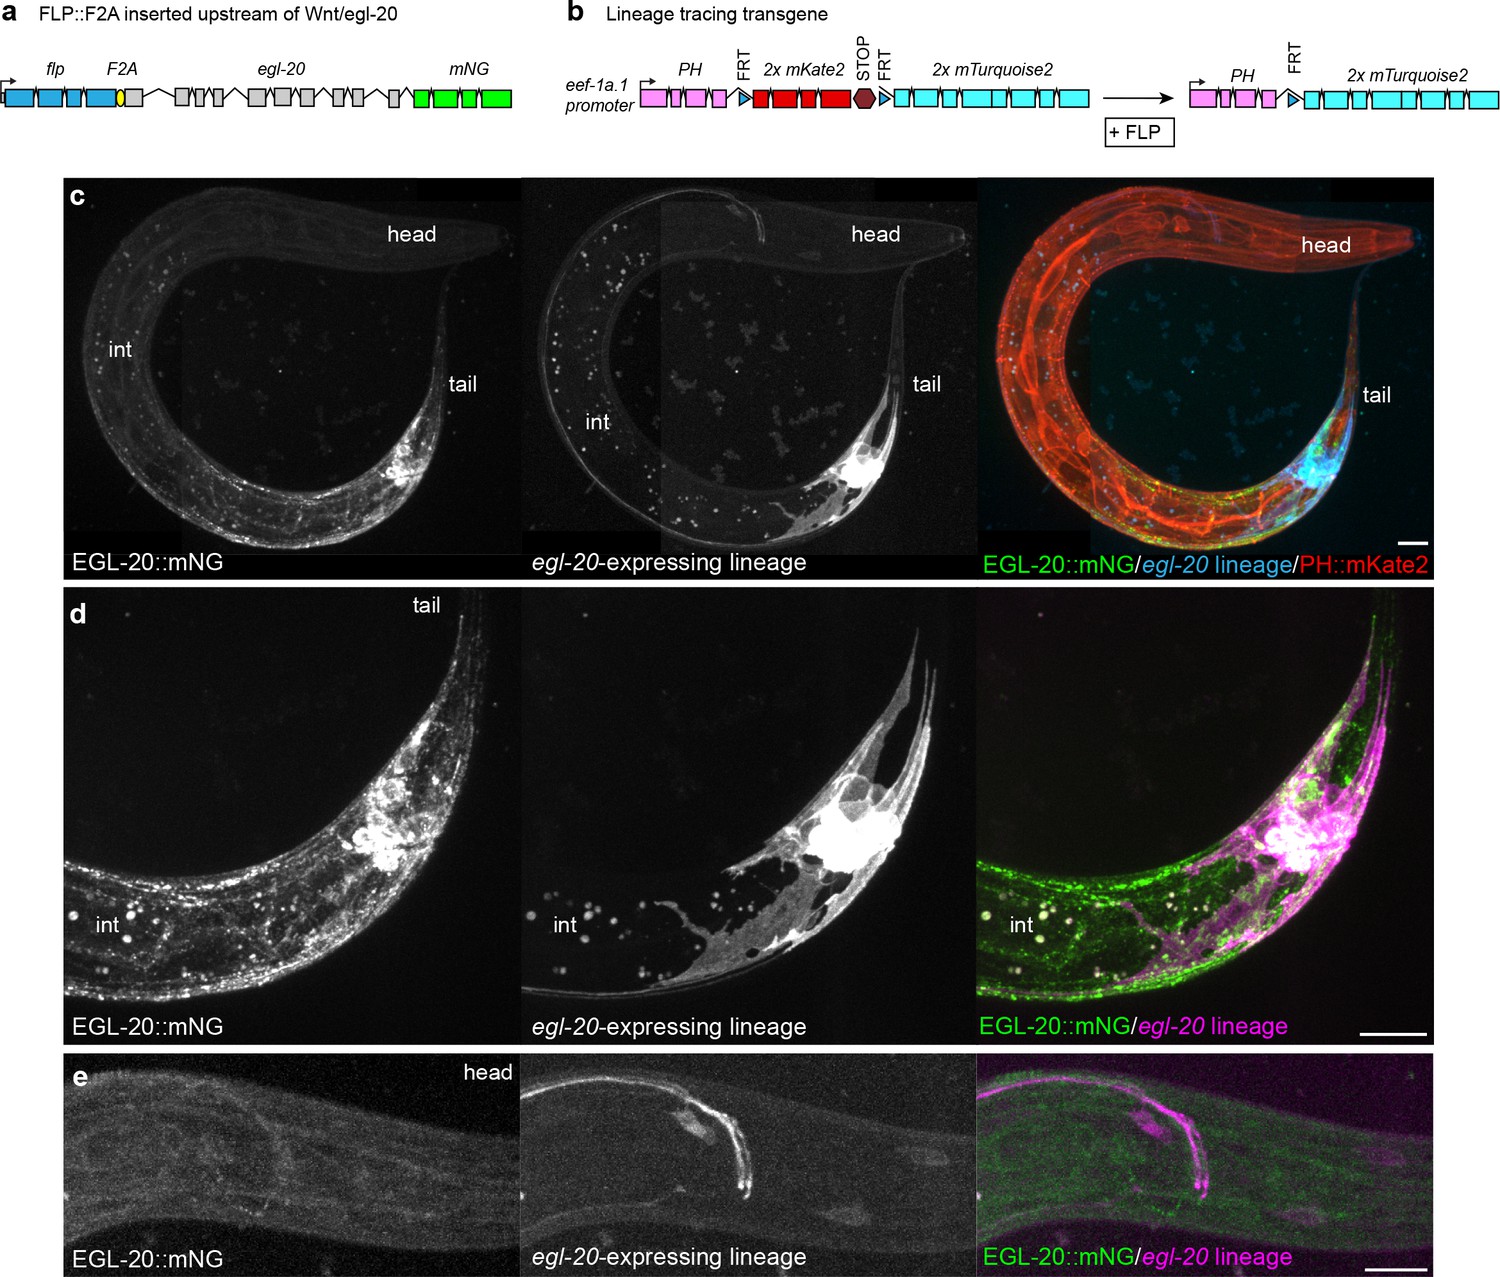
Visualization of the native egl-20-expressing cell lineage in vivo.
(a) Design of an endogenously engineered, bicistronic flp::F2A::egl-20::mNG allele to drive FLP-based recombination in cells that natively express egl-20. (b) Design of a cell-lineage reporter based on a ubiquitously expressed Peef-1a.1>PH::FRTmKate2::STOPFRTmTurq2 transgene that converts irreversibly from PH::mKate2 to PH::mTurq2 after excision by FLP. (c–e) maximum intensity projections of EGL-20::mNG, the egl-20-expressing cell lineage marked by PH::mTurq2, and non-excised cells marked by PH::mKate2 in a L2 stage animal. (c) image of entire animal. (d) detailed view of posterior source-cell lineage. (e) detailed view of posterior head showing axons from posterior neurons that project to the nerve ring, along with head neurons. Spots in the mid-body region in (c) and (d) are intestinal autofluorescence from deep optical sections (labeled int). Scale bars = 10 μm.
Figure 2 with 1 supplement
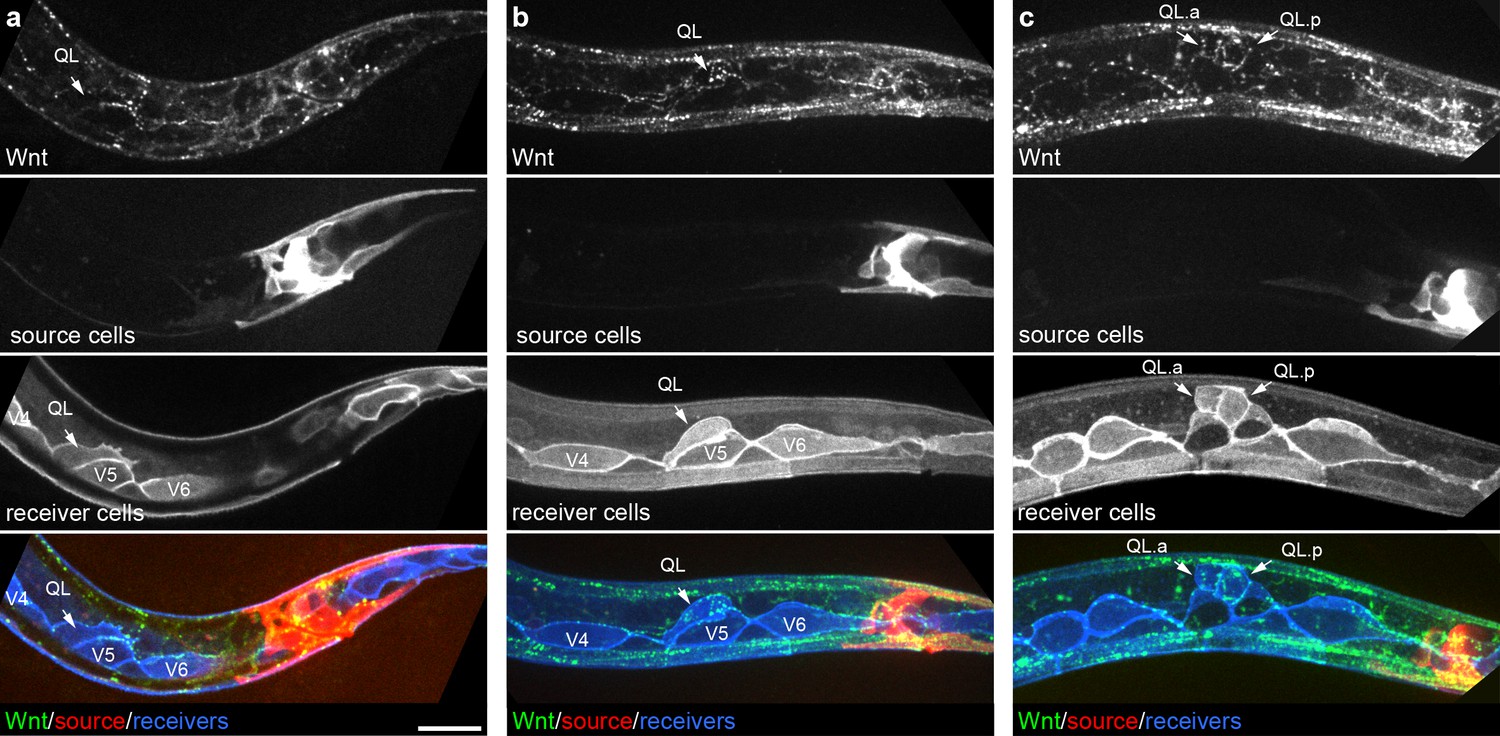
Endogenously tagged Wnt/EGL-20 localizes to responding QL neuroblasts that do not directly contact Wnt source cells.
(a–c) Maximum intensity projections showing Wnt/EGL-20::mNG protein (green), plasma membranes of EGL-20 source cells marked by Pegl-20>2x mKate2::PH (red), and responding Q neuroblast and seam cell membranes marked by Pwrt-2>2x mTurq2 (blue) in L1 larvae during QL polarization (a), early QL migration over the seam cell V5 (b) and the onset of QL descendant migration after the first cell division (c). Images are oriented with anterior to left and dorsal to top, scale bar = 10 μm.
Figure 2—figure supplement 1
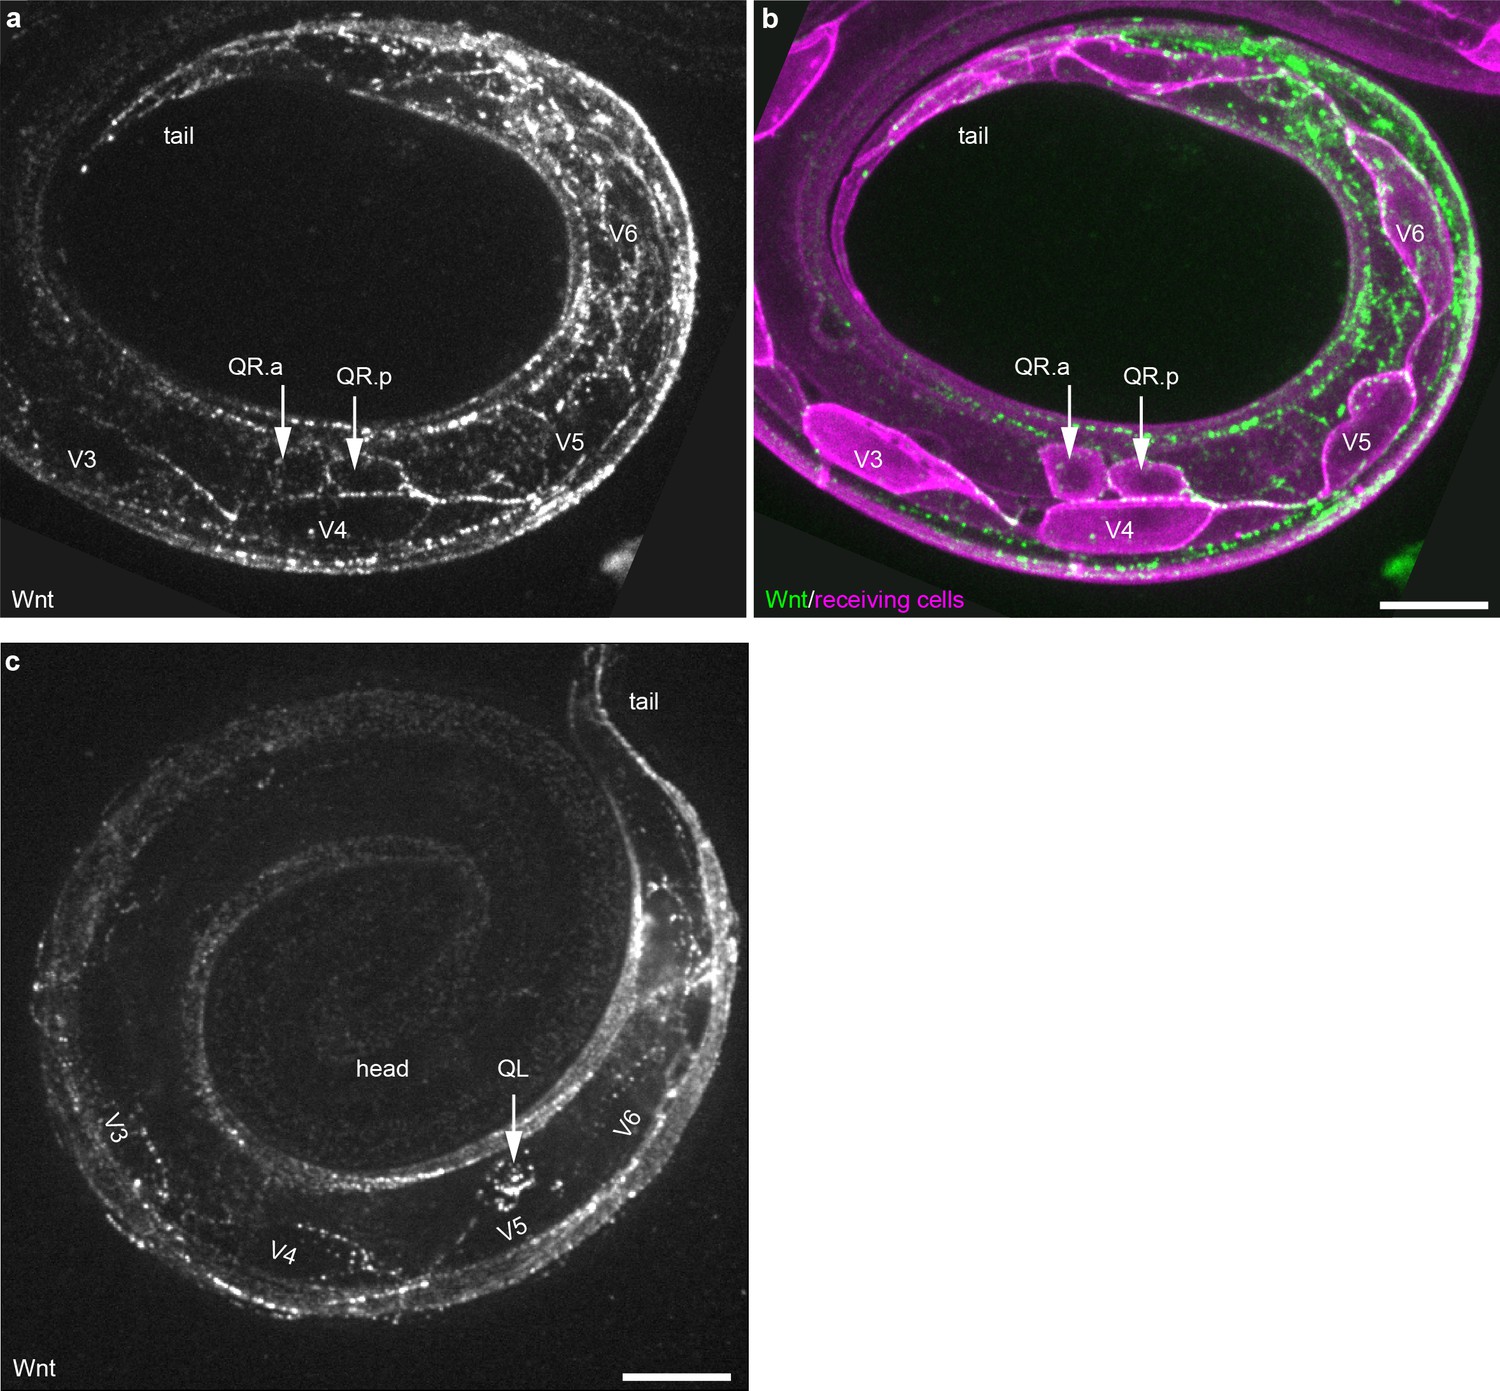
Wnt/EGL-20::mNG localization in QR neuroblast descendants and seam cells.
(a–b) Maximum intensity projections of sub-surface optical sections on the right side of an L1 stage larva showing bright Wnt/EGL-20::mNG punctae (green) that localize to anteriorly migrating QR neuroblast descendants and the posterior ends of seam cells V3-V6 (magenta). (c) Maximum intensity projection of surface optical sections on the left side of and L1 larva highlighting bright Wnt/EGL-20::mNG punctae that localize to the QL neuroblast and seam cells V3-V6. QL has migrated over V5 but has not yet divided. Animals are curled with the tail to upper right, scale bars = 10 μm.
Figure 3 with 3 supplements
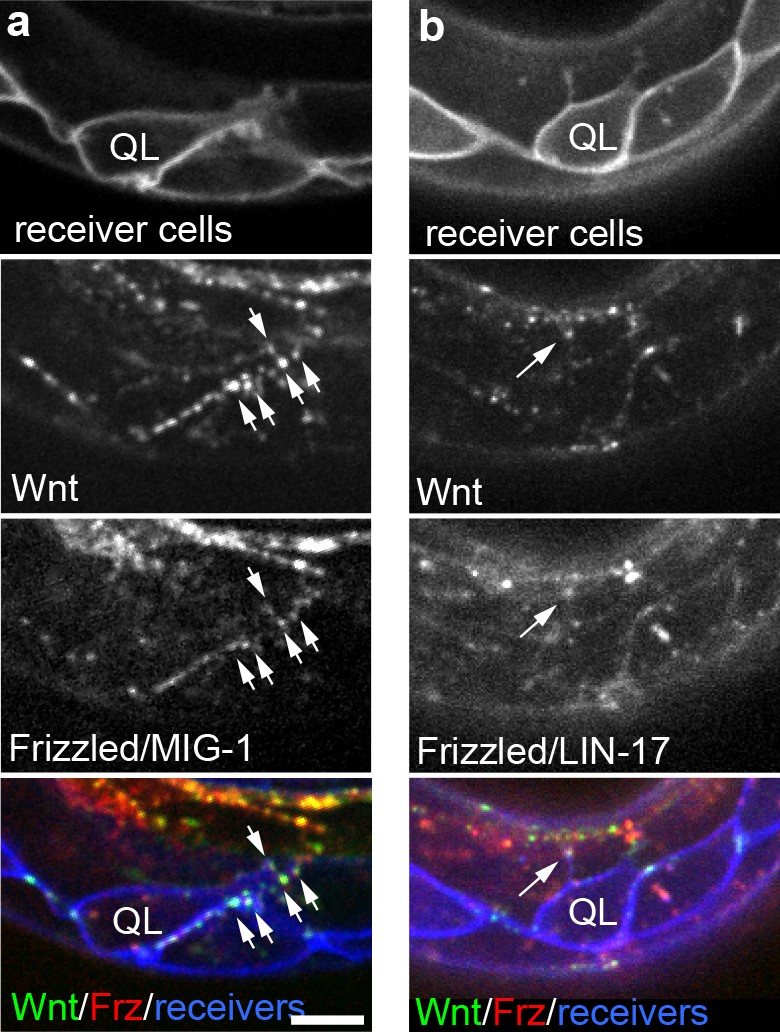
Endogenously tagged Wnt/EGL-20 and receptors co-localize on QL neuroblast protrusions.
(a, b) Endogenously tagged Wnt/EGL-20::mNG (green) and Frizzled/MIG-1::mKate2 (red) (a) or Frizzled/LIN-17::mScarlet-I (red) (b) punctae overlap and localize to protrusions from QL neuroblasts marked by Pwrt-2>2x mTurq2::PH (blue) prior to their posterior migration. Arrows indicate punctae containing tagged Wnt and Frizzled on neuroblast protrusions; Images are oriented with anterior to left and dorsal to top, scale bar = 10 μm.
Figure 3—figure supplement 1

Endogenously tagged Dishevelled/MIG-5 localizes to QL neuroblast protrusions.
Maximum intensity projections of surface optical sections showing mNG::MIG-5 punctae (green) (a, c) localize to protrusions (white arrow) from QL neuroblasts that respond to Wnt signaling, marked by Pwrt-2>2x mTurq2::PH (magenta) (b, c). Images are oriented with anterior to left and dorsal to top, scale bar = 10 μm.
Figure 3—figure supplement 2
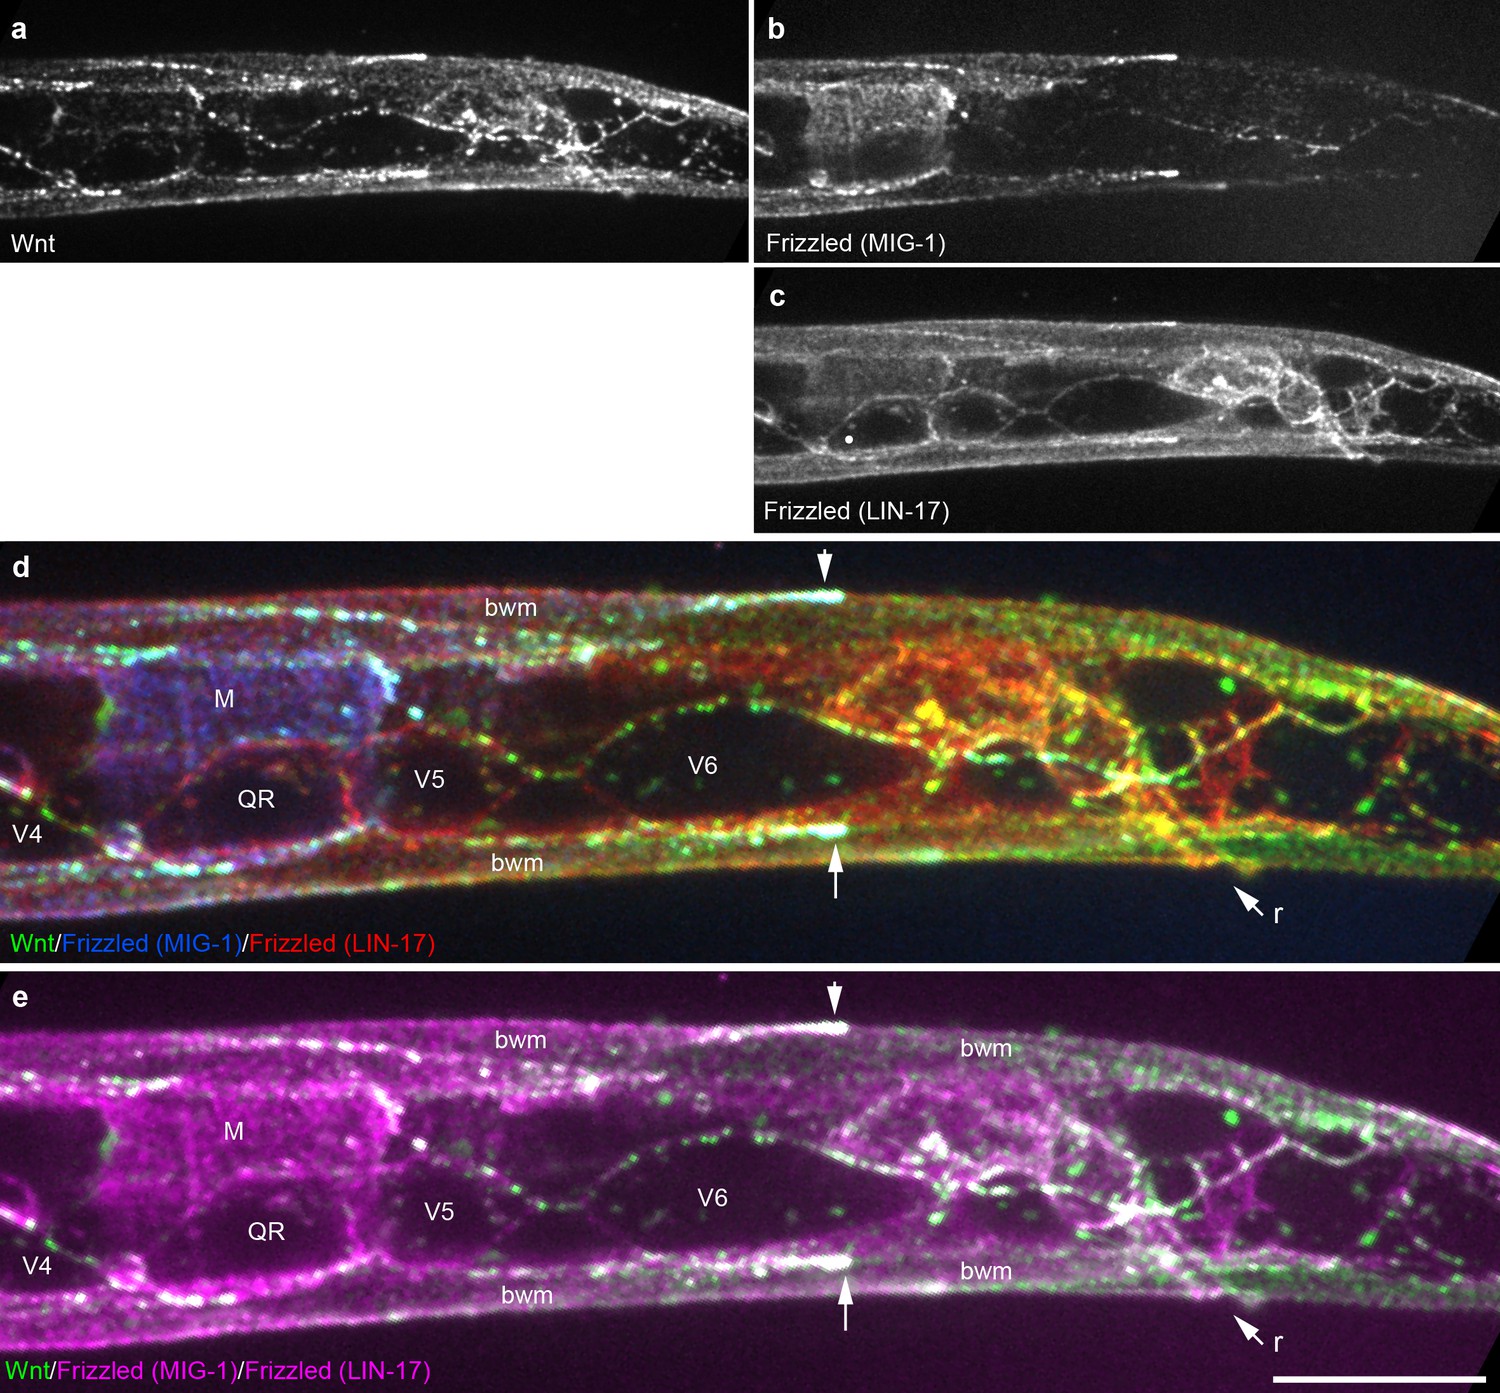
Extensive overlap between Wnt punctae and two Frizzled homologs in an early L1 animal.
Maximum intensity projection of surface optical sections showing the posterior right side of an early L1 animal including the QR neuroblast and seam cells V4-6. (a) Wnt/EGL-20::mNG; (b) Frizzled/MIG-1::2x mKate2; (c) Frizzled/LIN-17::mTurq2; (d) merged image showing overlap between tagged Wnt (green) and two Frizzled receptors pseudocolored individually with blue (MIG-1) or red (LIN-17); (e) merged image showing overlap between Wnt (green) and two Frizzled receptors with both pseudocolored in magenta. Arrows highlight localization to the posterior ends of body wall muscles. Abbreviations: bwm, body wall muscle; M, first M-lineage cell; r, rectum. Images are oriented with anterior to left and dorsal to top, scale bar = 10 μm.
Figure 3—figure supplement 3
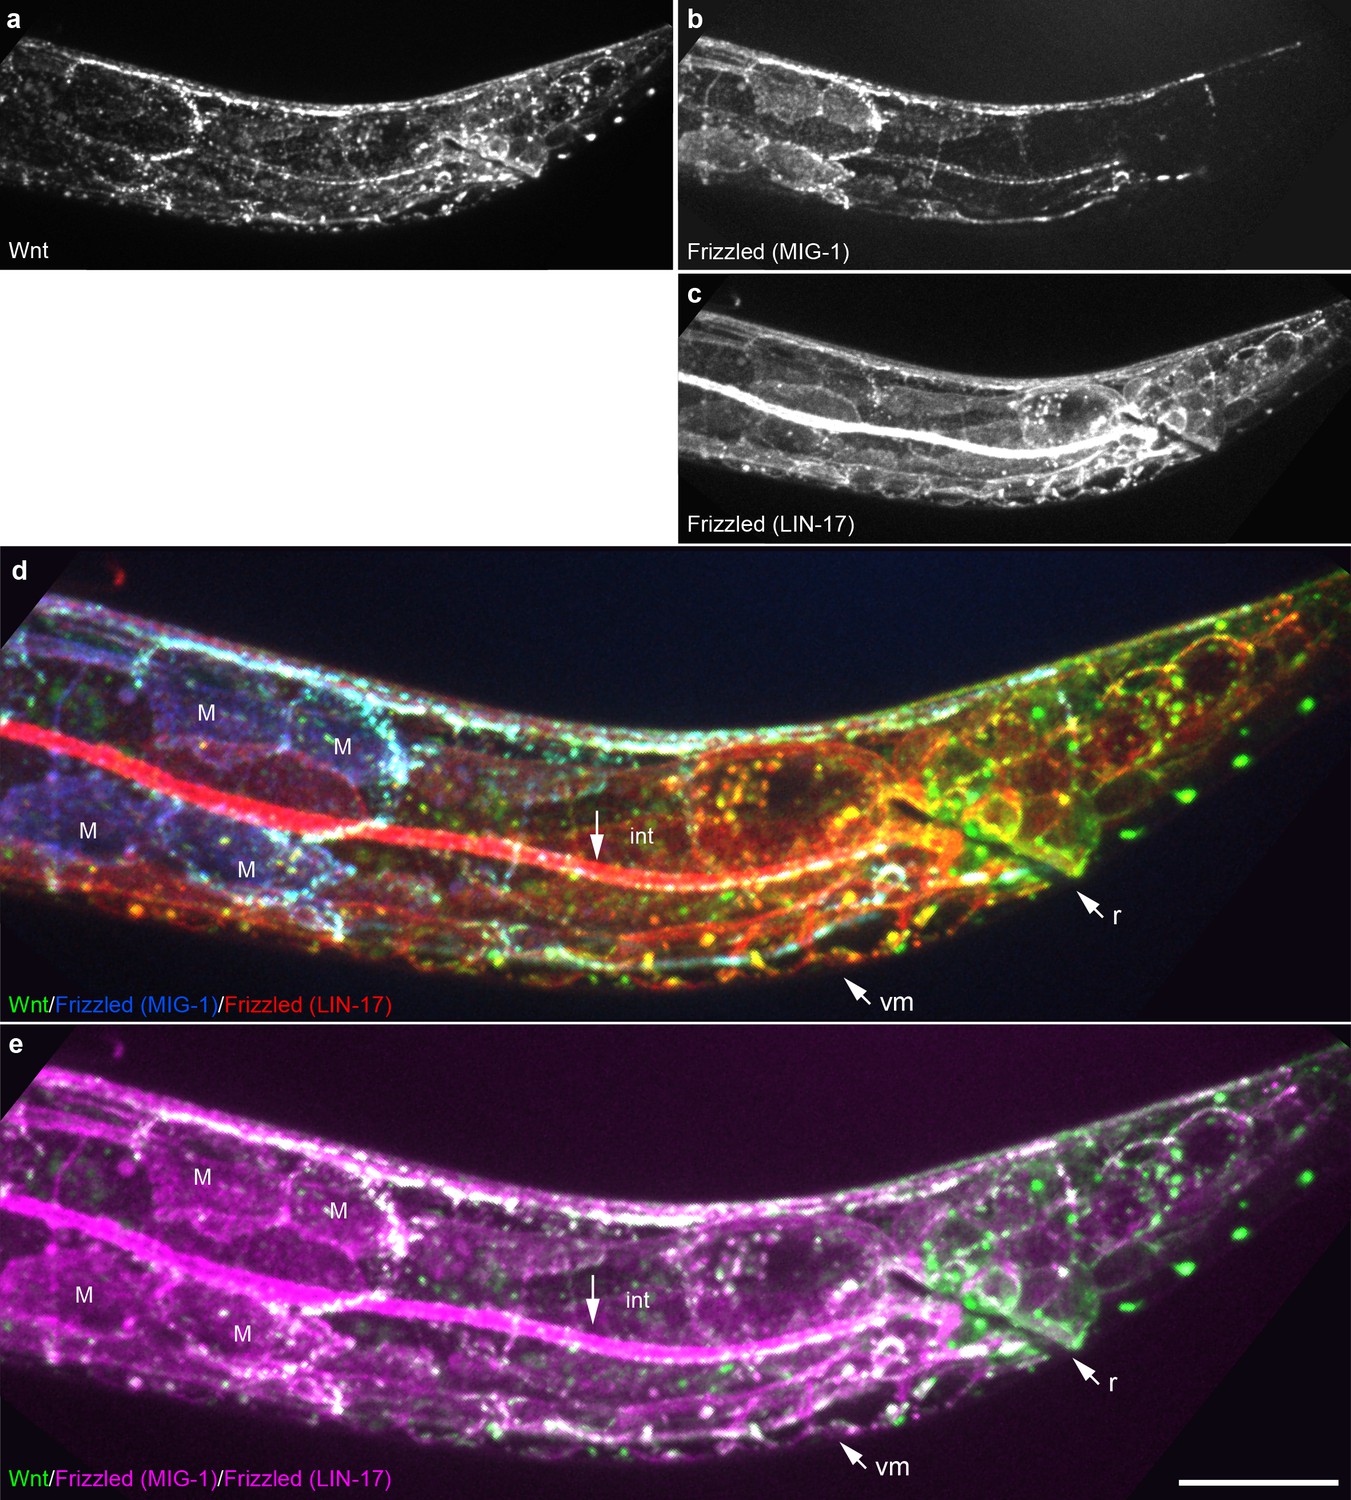
Extensive overlap between Wnt punctae and two Frizzled homologs in a late L1 animal.
Maximum intensity projection of midline optical sections showing the posterior of a late L1 animal. (a) Wnt/EGL-20::mNG; (b) Frizzled/MIG-1::2x mKate2; (c) Frizzled/LIN-17::mTurq2; (d) merged image showing overlap between tagged Wnt (green) and two Frizzled receptors pseudocolored individually with blue (MIG-1) or red (LIN-17); (e) merged image showing overlap between Wnt (green) and two Frizzled receptors with both pseudocolored in magenta. Abbreviations: int, intestine; m, M-lineage cells; r, rectum; vm, ventral midline cells. Images are oriented with anterior to left and dorsal to top, scale bar = 10 μm.
Figure 4 with 1 supplement
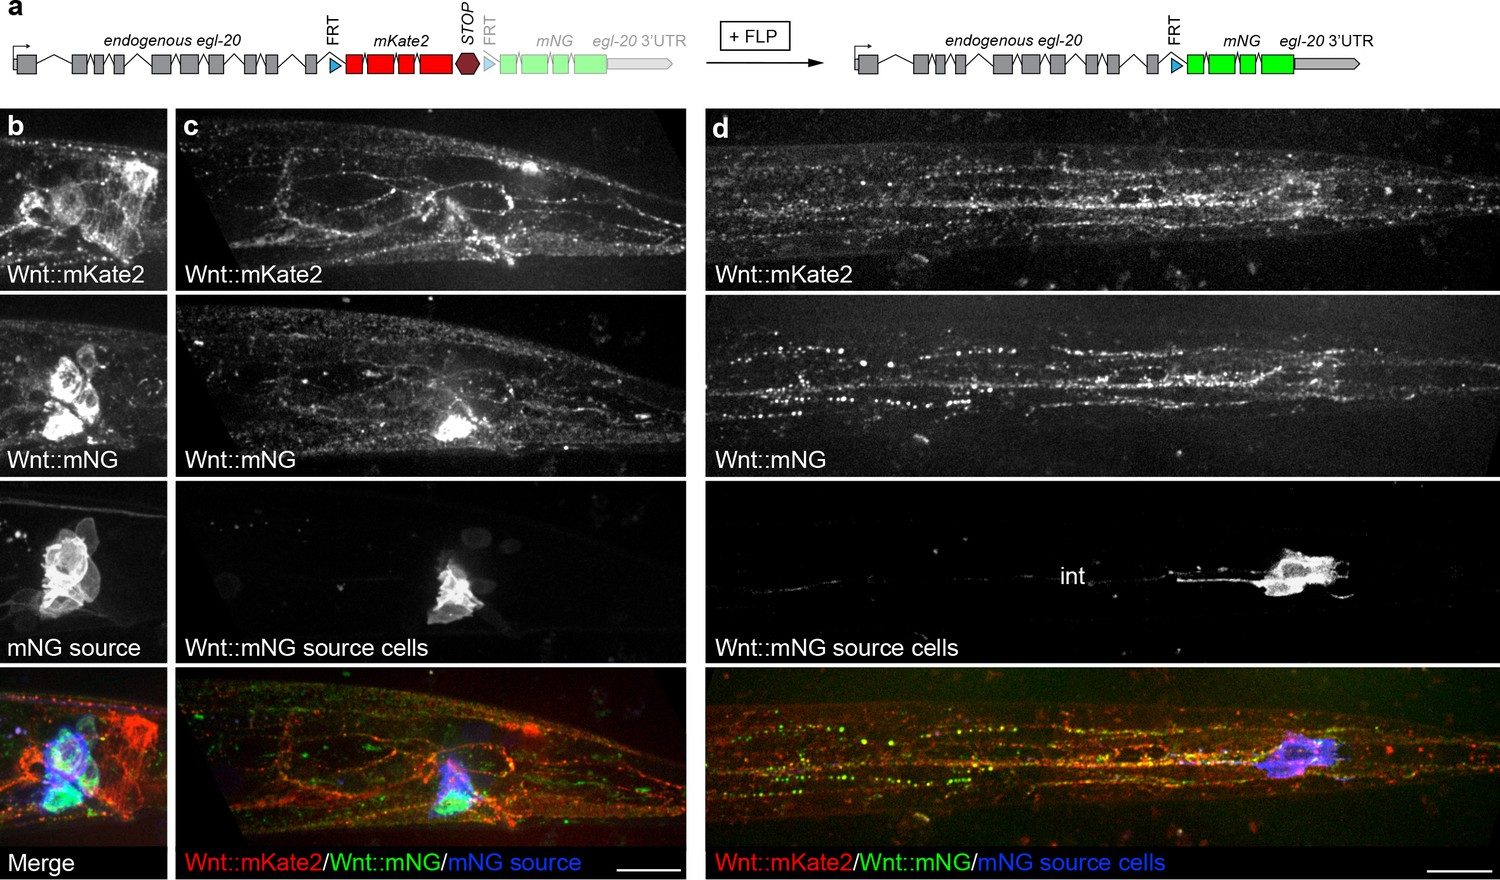
Distribution of endogenously tagged Wnt/EGL-20 secreted from different cell types suggests a common pool of extracellular ligand.
(a) design of an endogenous egl-20 tagged with: :FRTmKate2::STOPFRTmNG cassette to visibly distinguish Wnt/EGL-20 molecules produced by different cell types. By default, this allele expresses egl-20::mKate2 followed by a stop cassette, which can be excised by FLP recombinase to irreversibly change to egl-20::mNG. (b–d) In vivo imaging of Wnt/EGL-20::mKate2 produced by non-excised cells (red), Wnt/EGL-20::mNG produced by excised cells (green), and plasma membranes of cells expressing FLP driven by an egl-5 enhancer (blue); (b) maximum intensity projection of midline planes showing full shapes of cells producing Wnt/EGL-20::mKate2, Wnt/EGL-20::mNG, and FLP-expressing mNG source cells in an L2 larva; (c) Maximum intensity projection of surface planes in the same worm illustrating Wnt/EGL-20::mNG that has dispersed from its source cells. A region of the source cell membranes nearest the surface are visible; (d) maximum intensity projection of ventral surface in a separate worm showing dispersed Wnt/EGL-20::mNG from source cells. Area with isolated spots of intestinal autofluorescence in mNG source channel is labeled ‘int’. Images in b and c are oriented with anterior to left and dorsal to top, scale bars = 10 μm.
Figure 4—figure supplement 1
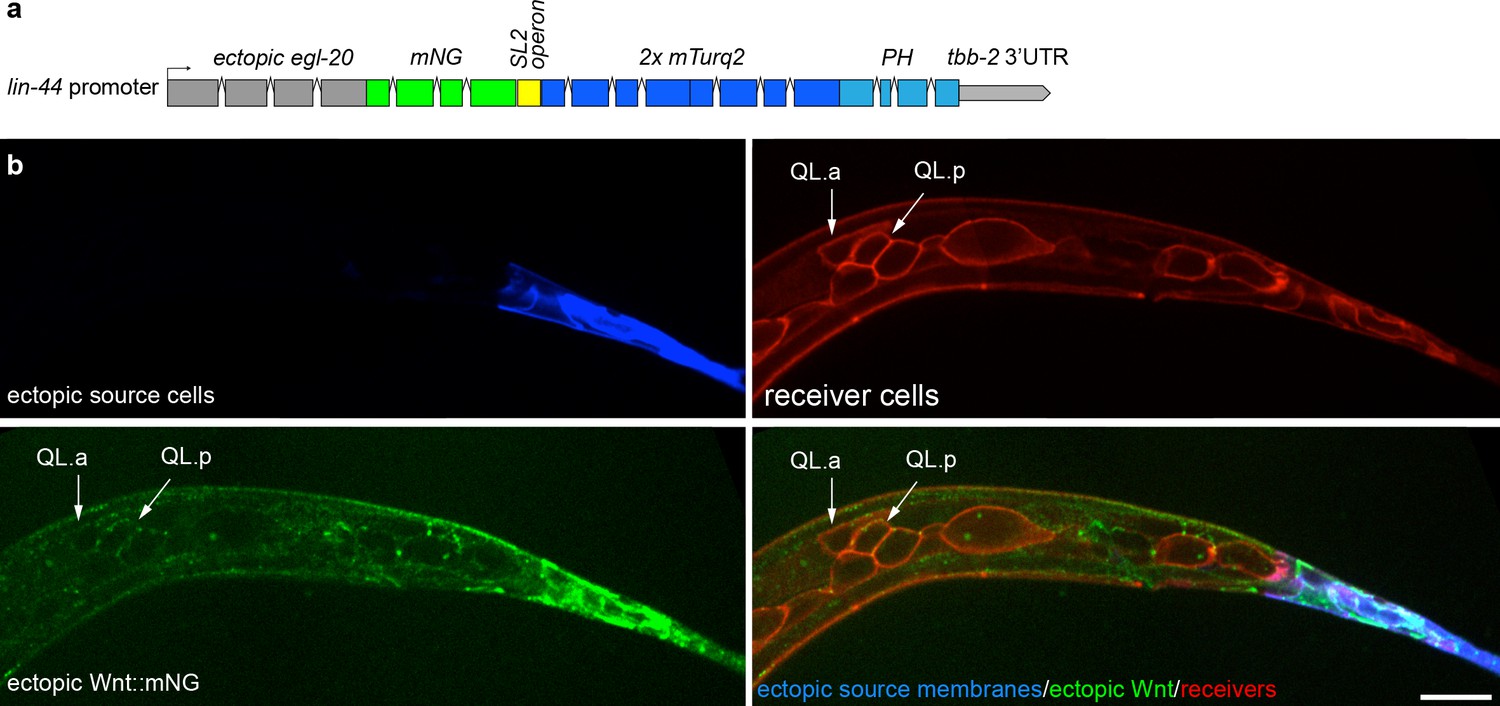
Ectopically expressed Wnt/EGL-20 spreads extracellularly and localizes to native receiving cells.
(a) Design of a transgene to ectopically express Wnt/EGL-20::mNG (green) and a 2x mTurq2::PH plasma membrane marker (blue) in posterior tail epithelial cells using a promoter fragment from the Wnt homolog lin-44. (b) ectopically expressed EGL-20::mNG spreads anteriorly and reaches QL neuroblast descendants and seam cells (red) in the absence of native cell contacts or potential signaling protrusions. At this stage, the anterior daughter cell QL.a has started its posterior migration over QL.p, which is controlled by Wnt/EGL-20. Images are oriented with anterior to left and dorsal to top, scale bar = 10 μm.
Figure 5 with 1 supplement

FRAP shows rapid Wnt recovery consistent with free extracellular spreading in vivo.
(a, b) Images of Wnt/EGL-20::YPET fluorescence recovery at selected time points during the first 5:30 after photobleaching in a mid-body region. The bleached region of interest included a responding QL neuroblast, indicated by an asterisk, prior to its protrusive behaviors. Arrowheads indicate the anterior boundary of the unbleached region. See Video 1 for complete time-lapse. (a) Wnt/EGL-20::YPET fluorescence colored using glow look-up-table; (b) composite images of Wnt/EGL-20::YPET (green) and plasma membranes of Q and seam cells (magenta). (c) kymograph of fluorescence intensity along the anteroposterior axis at 30 s intervals before and after photobleaching demonstrating Wnt spreading from the unbleached posterior domain; (d) Wnt/EGL-20::YPET fluorescence recovers in part as stable punctae suggesting dispersing Wnt molecules not individually visible by spinning disc microscopy are recruited to spatially stable clusters. Images are oriented with anterior to left and dorsal to top, scale bar = 10 μm.
Figure 5—figure supplement 1
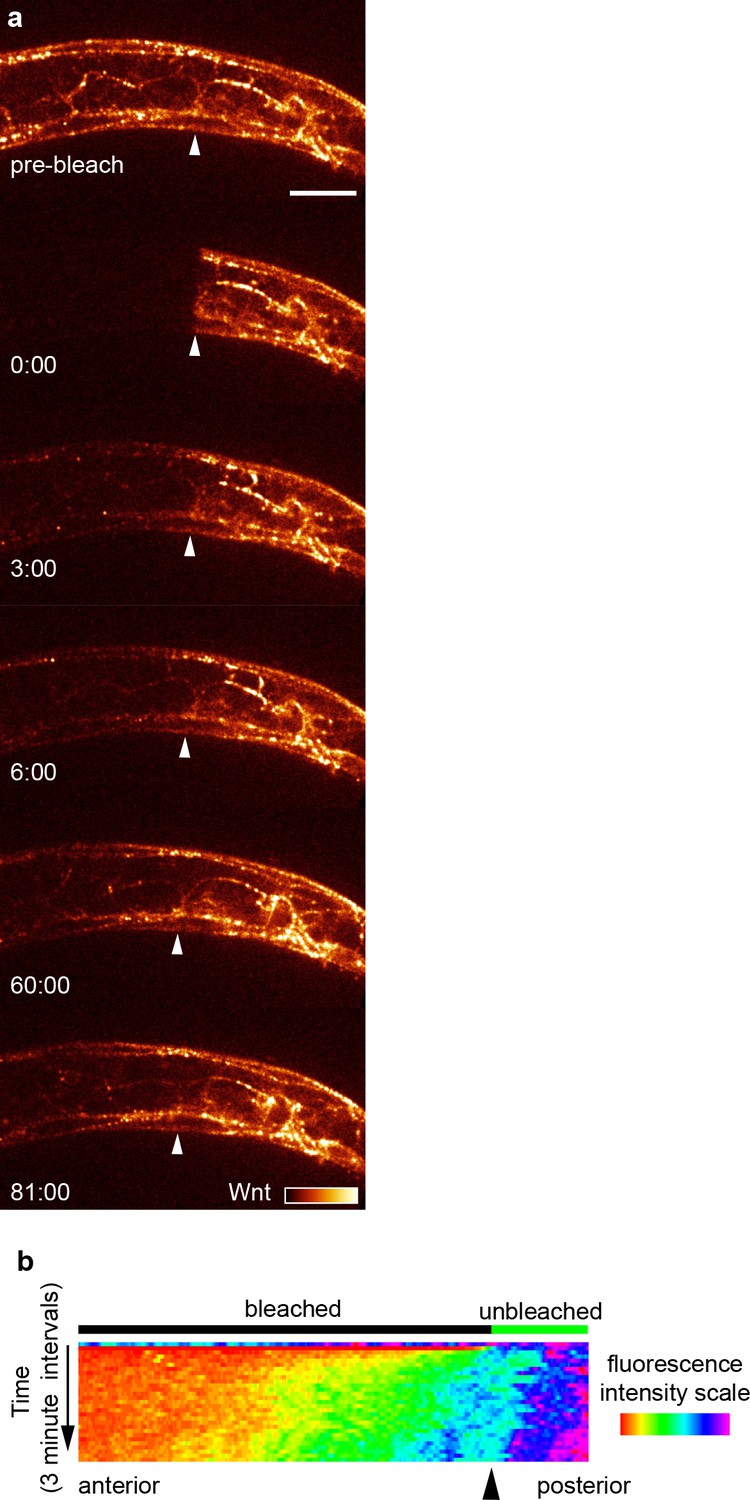
Tagged Wnt recovery after photobleaching over 90 min.
(a) Images of Wnt/EGL-20::YPET fluorescence recovery during the first 90 min after photobleaching in a mid-body region with images acquired every 3 min. Arrows indicate the anterior boundary of the unbleached region. (b) kymograph of fluorescence intensity along the anteroposterior axis at 3 min intervals before and after photobleaching demonstrating Wnt spreading from the unbleached posterior domain. Images are oriented with anterior to left and dorsal to top, scale bar = 10 μm.
Figure 6 with 1 supplement
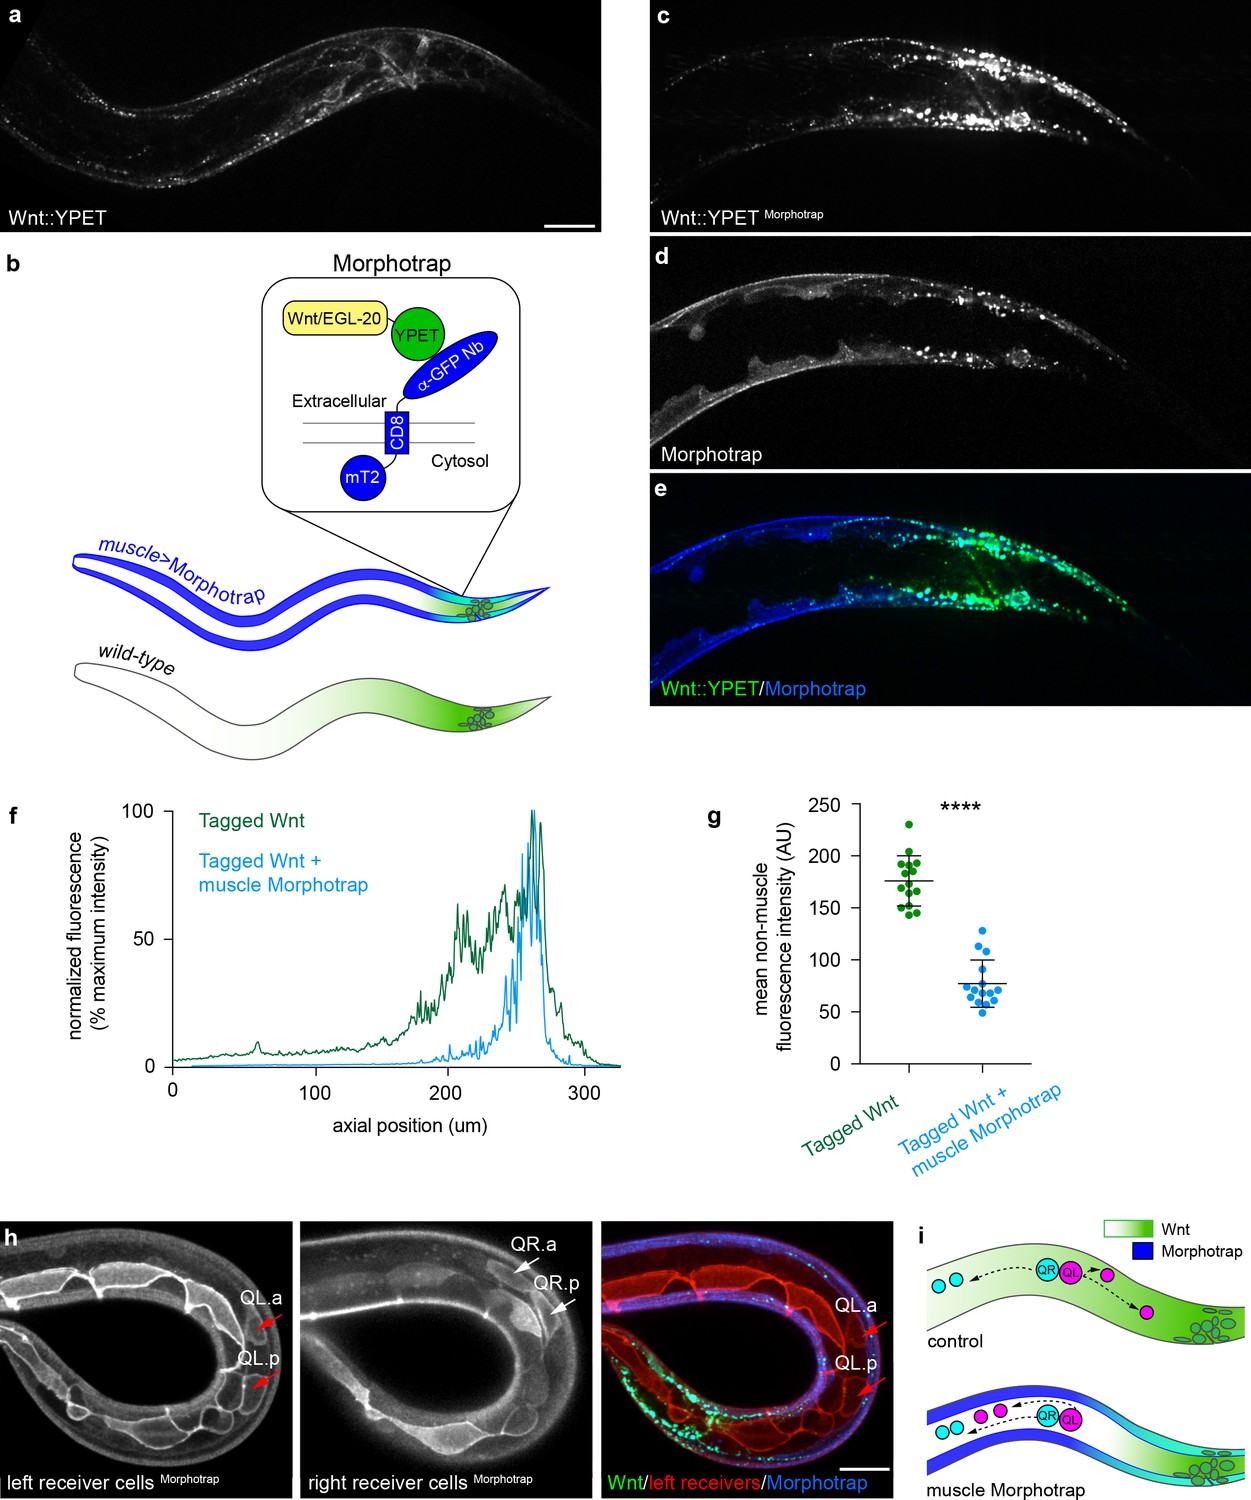
Extracellular spreading shapes long-range Wnt dispersal.
(a) Normal Wnt/EGL-20::YPET fluorescence in the posterior of a late L1 larva; (b) Schematic diagram of the Morphotrap system and Wnt/EGL-20::YPET distribution in Pmyo-3 >Morphotrap and control animals; (c, d) Identically acquired and processed images of Wnt/EGL-20::YPET (c, e) and Pmyo-3 >Morphotrap (d, e) fluorescence in a transgenic animal showing that Morphotrap fluorescence (blue) overlaps with Wnt/EGL-20::YPET (green) and alters its spatial distribution; (f) Profile plot of normalized Wnt/EGL-20::YPET fluorescence intensity along the anteroposterior axis in representative animals with (blue lines) or without (green lines) Morphotrap expression in body wall muscles; (g) Capturing Wnt/EGL-20::YPET in body wall muscles reduces levels in adjacent tissues, p<0.0001 Mann-Whitney test. Graph shows raw data points with means and 95% confidence intervals. Control n = 15, Morphotrap n = 15; (h) Separate images of left and right side Q neuroblasts and seam cells in a Morphotrap transgenic animal showing reversed QL neuroblast migration. Responding cells are marked by Pwrt-2>2 x mKate2::PH (red), and red arrows indicate anteriorly migrating QL descendants; (i) schematic diagrams of Q neuroblast migration in control and Morphotrap animals showing Wnt/EGL-20::YPET distribution and migrations of QR (cyan) and QL (magenta) neuroblast descendants. QL descendants have reversed migration in Morphotrap animals and in egl-20 mutants (see Figure 1b). Images in (a–e) are oriented with anterior to left and dorsal to top, images in (h) show a curled worm with tail to lower left and anterior to upper left, scale bars = 10 μm.
-
Figure 6—source data 1
Fluorescence intensity values for EGL-20::YPET in control and Morphotrap animals.
Source data corresponding to Figure 6f. Fluorescence intensity values were obtained in FIJI (Schindelin et al., 2012) by drawing a line the width of the worm from head to tail and using the ‘plot profile’ function. Off-worm background in a nearby region was then subtracted from the raw pixel intensities.
- https://doi.org/10.7554/eLife.38325.023
-
Figure 6—source data 2
Non-muscle fluorescence intensity values for EGL-20::YPET in control and Morphotrap animals.
Source data corresponding to Figure 6g. Wnt/EGL-20::YPET levels outside of body wall muscle were calculated by measuring the mean pixel intensity of a region of interest anterior to the egl-20-expressing cells that did not include body wall muscles marked by a Pmyo-3-driven transgene. Control and Morphotrap worms were imaged with identical settings on the same slides, and off-worm background in a nearby region was subtracted from the raw pixel intensities.
- https://doi.org/10.7554/eLife.38325.024
Figure 6—figure supplement 1

Intracellular Wnt-Morphotrap aggregations caused by ubiquitous Morphotrap expression and abnormal morphologies in cells with multi-copy extrachromosomal arrays.
(a–c) Wnt/EGL-20::YPET (a), Peft-3 driven Morphotrap (b), and composite image (c) highlighting tagged Wnt-Morphotrap aggregrations (arrows) in Wnt-producing cells; (d–f) body wall muscle morphologies in animals with mosaic Pmyo-3 > Morphotrap expressed from multi-copy extrachromosomal arrays. (d) normal body wall, muscle morphology; (e, f) body wall muscles with abnormal protrusive or branching structures in cells with high Morphotrap levels. Images are oriented with anterior to left and dorsal to top, scale bars = 10 μm.
Videos
Video 1
FRAP experiment showing Wnt/EGL-20::YPET recovery over 5:30 in vivo.
Video of time lapse images showing Wnt/EGL-20::YPET fluorescence recovery every 30 s for the first 5:30 after photobleaching in a mid-body region including seam cells and a QL neuroblast. Top panel shows Wnt/EGL-20::YPET fluorescence colored using glow look-up-table. Bottom panel shows composite of Wnt/EGL-20::YPET (green) and plasma membranes of Q and seam cells (magenta). Video corresponds with Figure 5.
Video 2
FRAP experiment showing Wnt/EGL-20::YPET recovery over 81 min in vivo.
Video of time lapse images showing Wnt/EGL-20::YPET fluorescence recovery every 3 min for the first 81 min after photobleaching in a mid-body region. Wnt/EGL-20::YPET fluorescence was colored using glow look-up-table. Video corresponds with Figure 5—figure supplement 1.
Tables
Key resources table
| Reagent type (species) or resource | Designation | Source or reference | Identifiers | Additional information |
|---|---|---|---|---|
| Strain, strain background (C. elegans) | cpIs89[Pwrt-2>2x mTurq2::PH::tbb-2 3'UTR loxN] I; cpIs85[Pegl-20 > 2 x mKate2::PH::3xHA::tbb-2 3'UTR loxN] II; egl-20(cp221[egl-20::m NG^3xFlag]) IV | This paper | LP515 | |
| Strain, strain background (C. elegans) | egl-20(cp221[egl-20::mNG^3xFlag]) IV; qyIs541[Pmyo-3>mCherry::P H::tbb-2 3'UTR] | This paper | LP673 | |
| Strain, strain background (C. elegans) | cpIs128[Pwrt2>2x mTurquoise2 ::PH::3xHA::tbb-2 3'UTR loxN] I; mig-1(cp360[mig-1::mKate2^ 3xMyc]) I; egl-20(cp221[egl-20: :mNG^3xFlag]) IV | This paper | LP727 | |
| Strain, strain background (C. elegans) | cpIs89[Pwrt-2>2x mTurquoise2 ::PH::tbb-2 3'UTR loxN] I; mig -5(cp385[mNG-GLO^AID::mig-5]) II | Heppert et al., 2018 | LP728 | |
| Strain, strain background (C. elegans) | cpIs92 [Pmec-7>2x mTurq2::PH:: 3xHA::tbb-2 3'UTR loxN] I; cpIs129 [Pgcy-32 > 2 x mKate2:: PH::3xHA::tbb-2 3'UTR loxN] II; egl-20(cp353[egl-20::mNG^3xFlag]) IV | This paper | LP729 | |
| Strain, strain background (C. elegans) | cpIs92 [Pmec-7>2x mTurq2::PH: :3xHA::tbb-2 3'UTR loxN] I; cpIs129 [Pgcy-32 > 2 x mKate2::PH ::3xHA::tbb-2 3'UTR loxN] II | This paper | LP730 | |
| Strain, strain background (C. elegans) | cpIs130[Pwrt-2>2x mKate2 ::PH::3xHA::let-858 3'UTR::Ptag-168 > HisCl1::tbb-2 3'UTR loxN] II; egl-20 (cp353[egl-20::mNG^3xFlag]) IV | This paper | LP732 | |
| Strain, strain background (C. elegans) | cpIs130[Pwrt-2>2x mKate2::PH:: 3xHA::let-858 3'UTR::Ptag-168 > HisCl1::tbb-2 3'UTR loxN] II; egl-20(cp400[egl-20::YPET^3xFlag]) IV | This paper | LP783 | |
| Strain, strain background (C. elegans) | cpIs156[Pwrt2>2x mTurquoise2::PH: :3xHA::tbb-2 3'UTR SEC + loxN] I; lin-1 7(cp391[lin-17::mScarlet-C1^AID]) I; egl-20(cp221[egl-20::mNG^3xFlag]) IV | This paper | LP790 | |
| Strain, strain background (C. elegans) | mig-1(cp360[mig-1::mKate2^3xMyc]) I; lin-17(cp404[lin-17::mTurquoise2^AID]) I; egl-20(cp221[egl-20::mNG^3xFlag]) IV | This paper | LP792 | |
| Strain, strain background (C. elegans) | cpIs92 [Pmec-7>2x mTurq2:: PH::3xHA::tbb-2 3'UTR loxN] I; cpIs129 [Pgcy-32 > 2 x mKate 2::PH::3xHA::tbb-2 3'UTR loxN] II; egl-20(n585) IV | This paper, CGC | LP793 | egl-20(n585) crossed to LP730 |
| Strain, strain background (C. elegans) | cpIs92 [Pmec-7>2x mTurq2:: PH::3xHA::tbb-2 3'UTR loxN] I; cpIs129 [Pgcy-32 > 2 x mKate2 ::PH::3xHA::tbb-2 3'UTR loxN] II; egl-20(cp400[egl-20:: YPET^3xFlag]) IV | This paper | LP795 | |
| Strain, strain background (C. elegans) | cpIs117[Peft-3::FRT > 2 x mKate2::PH::let-858 3'UTR::FRT > 2 x mTurquoise2::PH::3x HA::tbb-2 3'UTR + loxN] I; egl-20(cp411[flp::F2A::egl-20]) IV; egl-20(cp221[egl-20::m NG^3xFlag]) IV; | This paper | LP805 | |
| Strain, strain background (C. elegans) | cpIs158[Pmyo-3>pat-3sp::2x vhhGFP4:: CD8 tm::2x mTurquoise2::PH::tbb-2 3'UTR loxN] I; cpIs130[Pwrt-2>2x mKate2::PH::3xHA::let-858 3'UTR ::Ptag-168 > HisCl1::tbb-2 3'UTR loxN] II; egl-20(cp400 [egl-20::YPET^3xFlag]) IV | This paper | LP815 | |
| Strain, strain background (C. elegans) | cpIs159[egl-5(K enhancer)::pes-10 delta > flp::SL2::2x mTurq2::PH::3xHA::tbb-2 3'UTR loxN] I; egl-20(cp413[egl-20::FRT5T2:: mKate2::let-858 3'UTR::FRT5T2:: mNG^3xFlag]) IV | This paper | LP817 | |
| Strain, strain background (C. elegans) | cpIs160 [Plin-44 > egl-20::mNG ::SL2::2x mTurq2::PH::3x HA::tbb-2 3'UTR loxN] I; cpIs130[Pwrt-2>2x mKate2::PH::3xHA::let-858 3'UTR::Ptag-168 > HisCl1:: tbb-2 3'UTR loxN] II | This paper | LP818 | |
| Recombinant DNA reagent | Peft-3>Cas9+PU6>empty sgRNA | Dickinson et al., 2013 | pDD162 | vector for Cas9 + sgRNA cloning |
| Recombinant DNA reagent | Peft-3>Cas9+ttTi5605 sgRNA | Dickinson et al., 2013 | pDD122 | Cas9 + sgRNA targeting genomic site near ttTi5605 |
| Recombinant DNA reagent | Peft-3>Cas9+ttTi4348 sgRNA | This paper | pAP082 | Cas9 + sgRNA targeting genomic site near ttTi4348. Derived from pDD122. |
| Recombinant DNA reagent | empty promoter > 2 x mKate2::PH::3xHA::tbb-2 3'UTR loxN SEC loxN ttTi5605 | This paper | pAP087.2 | vector for plasma membrane reporter insertions near ttTi5605. Derived from pCFJ150. |
| Recombinant DNA reagent | empty promoter > 2 x mTurq2::PH::3xHA::tbb-2 3'UTR loxN SEC loxN ttTi4348 | This paper | pAP088 | vector for plasma membrane reporter insertions near ttTi4348. Derived from pCFJ352. |
| Recombinant DNA reagent | mNG^SEC^3xFlag | Dickinson et al., 2015 | pDD268 | vector for cloning homologous repair templates |
| Recombinant DNA reagent | YPET^SEC^3xFlag | Dickinson et al., 2015 | pDD283 | vector for cloning homologous repair templates |
| Recombinant DNA reagent | mKate2^SEC^3xMyc | Dickinson et al., 2015 | pDD287 | vector for cloning homologous repair templates |
Additional files
-
Supplementary file 1
PCR primers used to amplify transgene promoters.
- https://doi.org/10.7554/eLife.38325.025
-
Transparent reporting form
- https://doi.org/10.7554/eLife.38325.026
Download links
A two-part list of links to download the article, or parts of the article, in various formats.
Downloads (link to download the article as PDF)
Open citations (links to open the citations from this article in various online reference manager services)
Cite this article (links to download the citations from this article in formats compatible with various reference manager tools)
Direct visualization of a native Wnt in vivo reveals that a long-range Wnt gradient forms by extracellular dispersal
eLife 7:e38325.
https://doi.org/10.7554/eLife.38325


