Cerebellar Purkinje cells control eye movements with a rapid rate code that is invariant to spike irregularity
- Stanford University, United States
- University of Rochester, United States
- QIMR Berghofer Medical Research Institute, Australia
- Tampere University, Finland
Figures
Figure 1 with 3 supplements
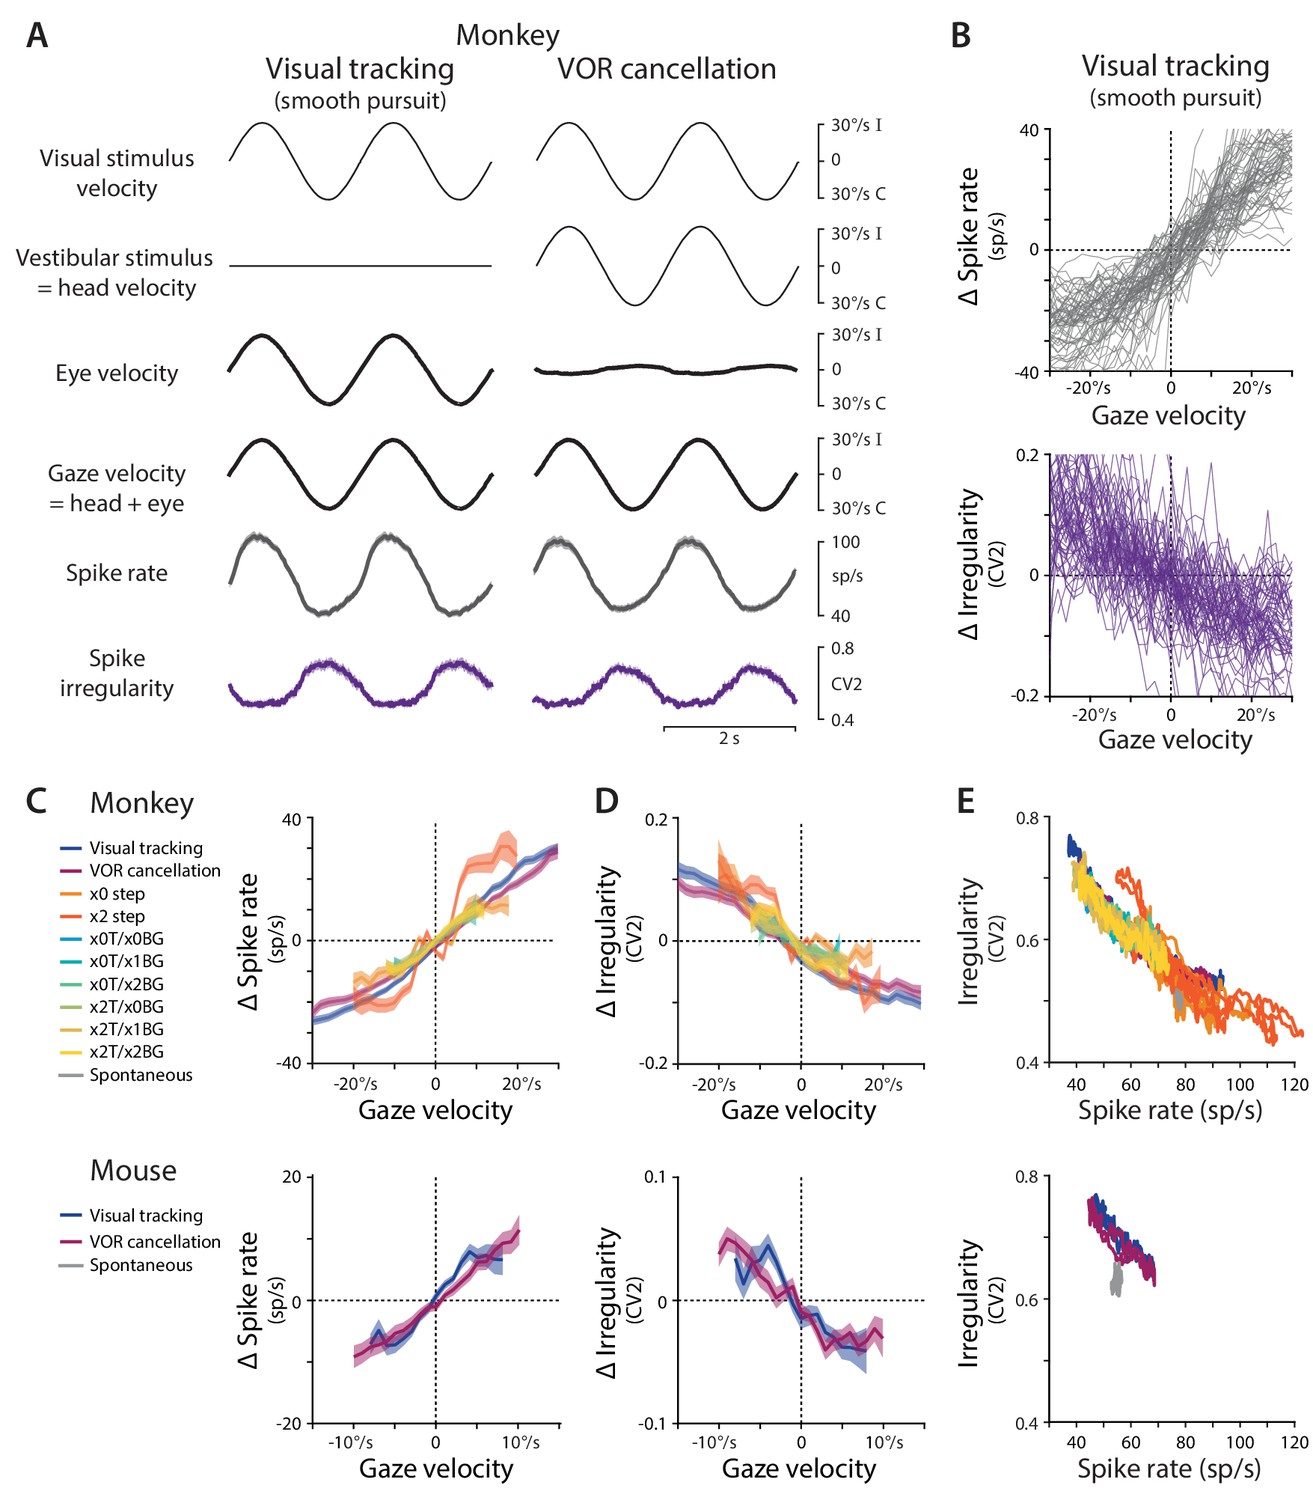
Spike rate and irregularity during oculomotor behavior.
(A) Visual and vestibular stimuli, oculomotor responses, and Purkinje cell spike rate and local spike irregularity (CV2) during two oculomotor behaviors in rhesus monkeys: visual tracking (smooth pursuit of a small visual target; left) and VOR cancellation (cancellation of the vestibulo-ocular reflex, achieved by tracking a visual target that moves exactly with the head; right). Upward deflections represent ipsiversive movements of the visual stimulus, head, eye, or gaze; downward deflections represent contraversive movements (relative to the side of the brain in which the Purkinje cell was recorded). Data were averaged across stimulus cycles (median 24 cycles, range 10 to 118) for each neuron, and then averaged across neurons (n = 66 cells from two monkeys, data reanalyzed from Raymond and Lisberger, 1998). For clarity of illustration, the average cycle is repeated twice. Results are shown for the largest subclass of Purkinje cells in the cerebellar flocculus, the EiHi Purkinje cells, which increase their firing in response to ipsiversive eye motion during visual tracking and ipsiversive head motion during VOR cancellation (Raymond and Lisberger, 1997). Results from Purkinje cells with other responses to eye or head motion are shown in Figure 1—figure supplement 2. (B) The relationship between spike rate and gaze velocity (top) and spike irregularity (CV2) and gaze velocity (bottom) during visual tracking for individual Purkinje cells included in the averages in panel (A). Spike rate, CV2, and gaze velocity were first averaged across stimulus cycles, and then binned according to gaze velocity (2°/s bins). The average spike rate or CV2 was subtracted from each cell to obtain Δ spike rate or Δ CV2, respectively. (C) The relationship between spike rate and gaze velocity during eye movement responses to different combinations of vestibular and visual stimuli (see Materials and methods for descriptions of each visual-vestibular stimulus listed in the legend). The Δ spike rate and Δ irregularity were calculated as in (B) and then averaged across the population of all EiHi Purkinje cells recorded in monkeys (top; n = 120 cells from four monkeys, data reanalyzed from Raymond and Lisberger, 1998; Raymond and Lisberger, 1997; Kimpo et al., 2014) and mice (bottom; n = 33 cells from 29 mice, data reanalyzed from Katoh et al., 2015). (D) The relationship between spike irregularity (CV2) and gaze velocity averaged across the population of Purkinje cells recorded in monkeys (top) and mice (bottom). (E) The relationship between spike rate and spike irregularity (CV2), averaged across the population of Purkinje cells recorded in monkeys (top) and mice (bottom) and plotted for each 2 ms time point within the stimulus cycle. Spontaneous activity is plotted in gray. In this and all figures, error bars represent ± SEM.
-
Figure 1—source data 1
Electrophysiology data from monkey recorded during oculomotor behavior, including instantaneous firing rate (MATLAB variable name: FR), local irregularity (CV2), and gaze velocity (GAZE).
Associated with Source code 1 and Source code 2.
- https://doi.org/10.7554/eLife.37102.006
-
Figure 1—source data 2
Electrophysiology data from mouse recorded during oculomotor behavior.
Variable names as in Figure 1—source data 1. Associated with Source code 1 and Source code 2.
- https://doi.org/10.7554/eLife.37102.007
Figure 1—figure supplement 1
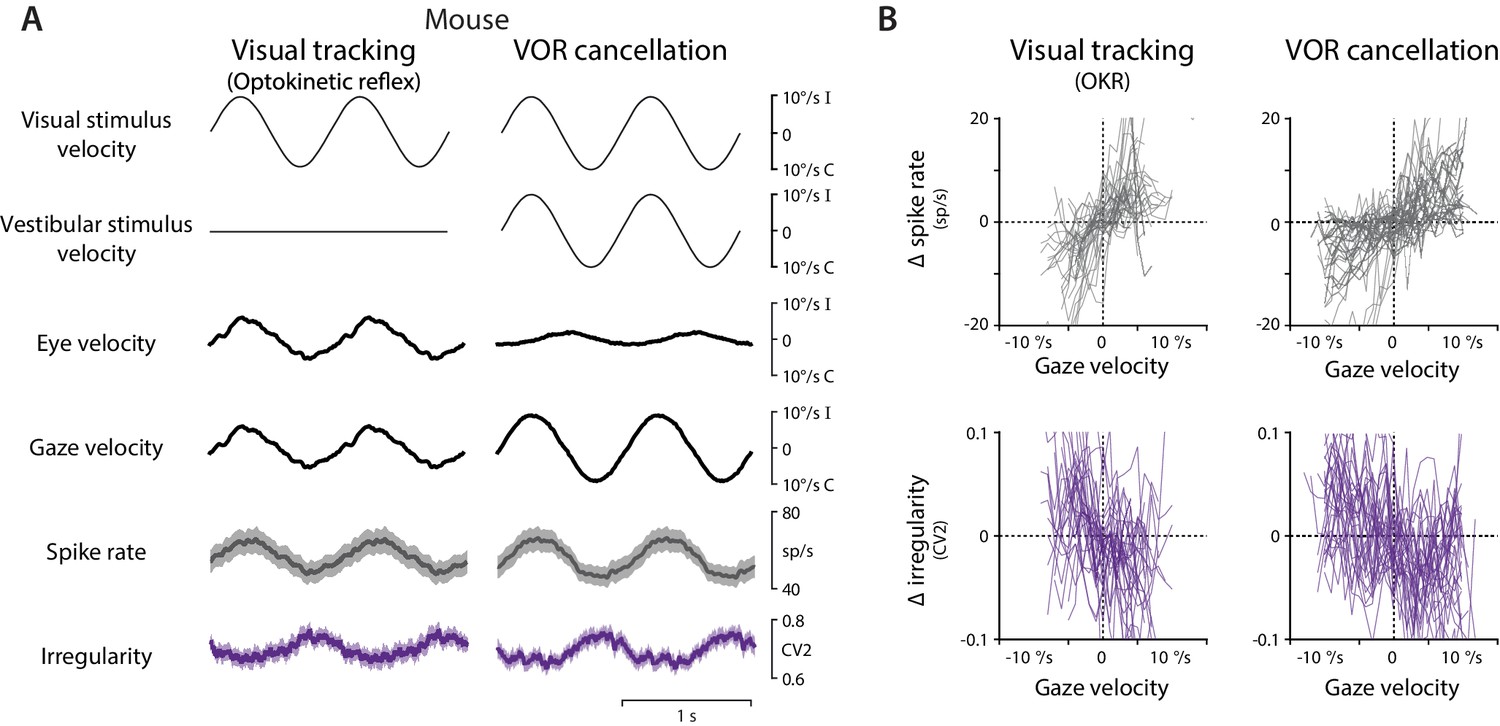
Spike rate and irregularity during oculomotor behavior in mice.
(A) Visual and vestibular stimuli, oculomotor responses, and Purkinje cell spike rate and local spike irregularity (CV2) in mice during visual tracking (the optokinetic reflex evoked by the motion of a striped drum surrounding the mouse; left) and VOR cancellation (right), averaged across stimulus cycles (median 53, range 26 to 95) and then averaged across EiHi Purkinje cells (n = 33 Purkinje cells from 29 mice). (B) The relationship between Δ spike rate (top) or Δ irregularity (CV2) (bottom) and gaze velocity during visual tracking (left) or VOR cancellation (right) for the individual Purkinje cells included in the population averages in (A).
Figure 1—figure supplement 2

Relationship between spike rate and irregularity for all Purkinje cells.
Left, the phase of peak spike irregularity (CV2) (ordinate), compared with the phase of peak spike rate in the same Purkinje cell (abscissa) during visual tracking, with phase of CV2 and spike rate each measured relative to peak ipsiversive eye velocity. Positive numbers represent a phase lead. Right, the phase of peak spike irregularity (CV2) and spike rate in each Purkinje cell during VOR cancellation, with phase measured relative to peak ipsiversive head velocity. Each point represents the result from a single Purkinje cell recorded in monkeys (top) or mice (bottom). The EiHi Purkinje cells (filled circles, n = 120 monkey; n = 33, mouse) were defined as having a spike rate phase within ±90° of zero during both visual tracking and VOR cancellation. Other Purkinje cells had different spike rate phases (open circles, n = 102, monkey; n = 77, mouse). Insets, histogram of the difference between CV2 phase and spike rate phase. Across all Purkinje cells, peak CV2 was roughly 180° out of phase with peak spike rate.
Figure 1—figure supplement 3

Contribution of a refractory period to the relationship between instantaneous spike rate and irregularity.
The possibility that the inverse relationship between spike rate and irregularity observed in vivo could be accounted for by an absolute spike refractory period was assessed using a simple model of spike train statistics. (A) Top, trial-aligned spike raster plots for an example neuron recorded in monkey during smooth pursuit (left column), and for an inhomogeneous Poisson process with a 3 ms absolute refractory period (right column) with rate modulated to match the trial-averaged rate of the example neuron. Bottom, spike rate and spike irregularity (CV2) for all Purkinje cells recorded during smooth pursuit from Figure 1B (left) and all rate-matched Poisson simulations (right). (B) The relationship between the instantaneous irregularity (CV2) and instantaneous spike rate of pairs of ISIs, averaged across cells, for both real and simulated spike trains. For each cell, the CV2 and spike rate were calculated for each pair of ISIs, and the data were then binned and averaged according to the instantaneous rate. The simulated spike trains generated by the refractory Poisson model for each cell were treated identically to the real spike trains. Poisson spike trains were simulated with absolute refractory periods of 2 ms, 3 ms, or 4 ms as indicated. Note that a Poisson process without a refractory period would have an average CV2 equal to one across all ISI durations. The refractory Poisson models exhibit less irregularity at faster spike rates (shorter ISI durations), as also observed in the Purkinje cell data. However, irregularity drops off steeply only at the shortest ISIs in the models, whereas in the data there is a more gradual change in irregularity across the range of ISIs. Thus, a refractory period does not readily account for the relationship between spike rate and irregularity observed in the data, and other factors such as synaptic input are likely to contribute.
Figure 2 with 1 supplement
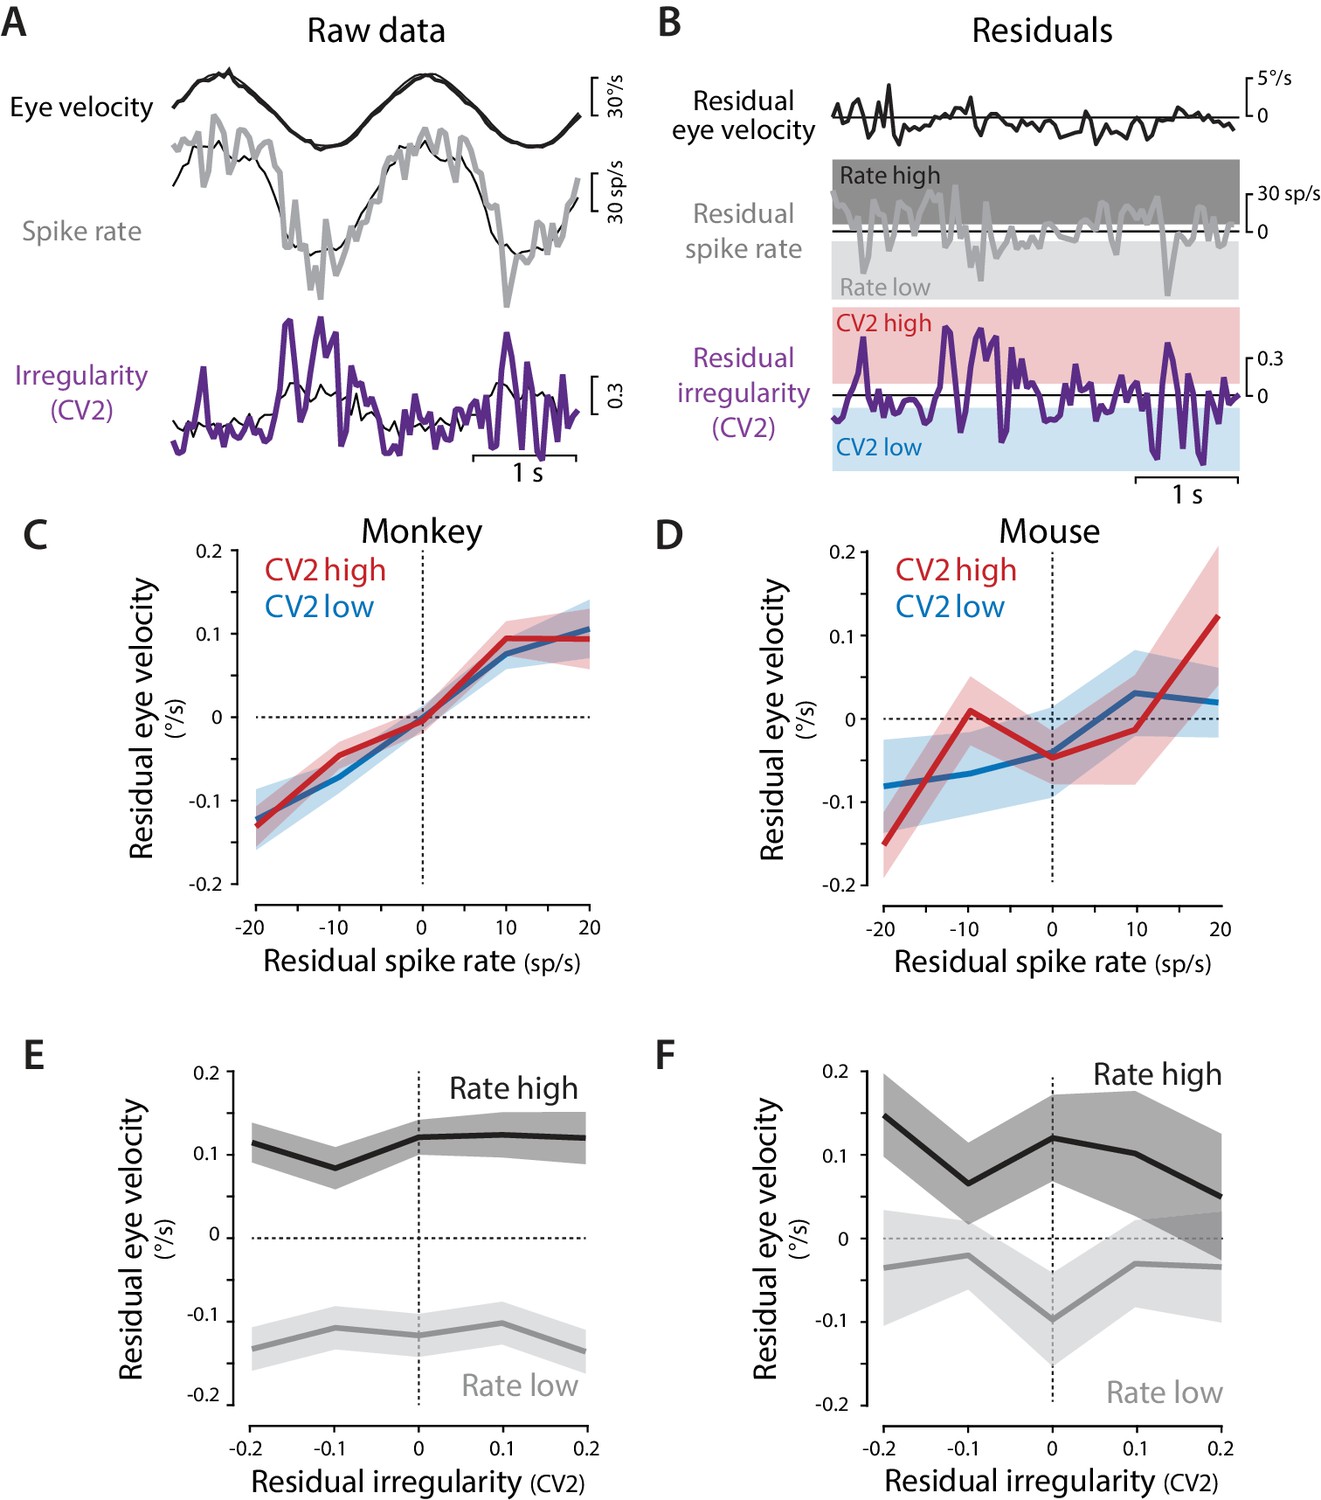
Residual analysis of spike rate and irregularity during oculomotor behavior.
(A) Example traces of raw eye velocity, instantaneous spike rate, and spike irregularity (thick lines) during two cycles of sinusoidal visual tracking in monkey, calculated in 50 ms bins, and overlaid on the mean responses across all cycles for this Purkinje cell (thin black lines). (B) Residuals were calculated by subtracting the mean response from the raw response. For visualization only (panels C–F) the residual spike rates and CV2 values were divided into the lower and upper thirds of the distribution for each cell (shading). Statistical analysis was conducted on the full distribution of residuals (see text). (C,D) The relationship between residual spike rate and residual eye velocity, plotted separately for time bins with residual CV2 values in the lower (blue) or upper (red) third of the CV2 distribution for each cell, and then averaged across Purkinje cells for monkeys (C, n = 120 cells from four monkeys) and mice (D, n = 33 cells from 29 mice). (E,F) The relationship between residual spike irregularity (CV2) and residual eye velocity, plotted separately for time bins with residual spike rate values in either the lower (light gray) or upper (dark gray) third of the spike rate distribution for each cell, for monkeys (E) and mice (F).
Figure 2—figure supplement 1
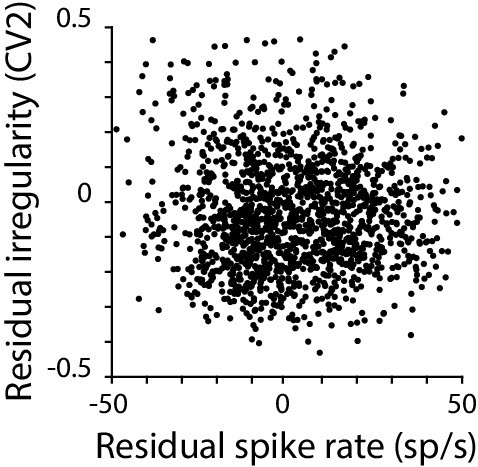
Moment-to-moment spike rate and spike irregularity are only weakly correlated.
Residual spike irregularity (CV2) plotted against residual spike rate for each 50 ms time bin in a representative monkey Purkinje cell. Across the population, there was only weak correlation between the residual CV2 and residual spike rate (mean correlation coefficient –0.23 ± 0.01, n = 120 cells, monkey; –0.25 ± 0.02 n=33 cells, mouse).
Figure 3
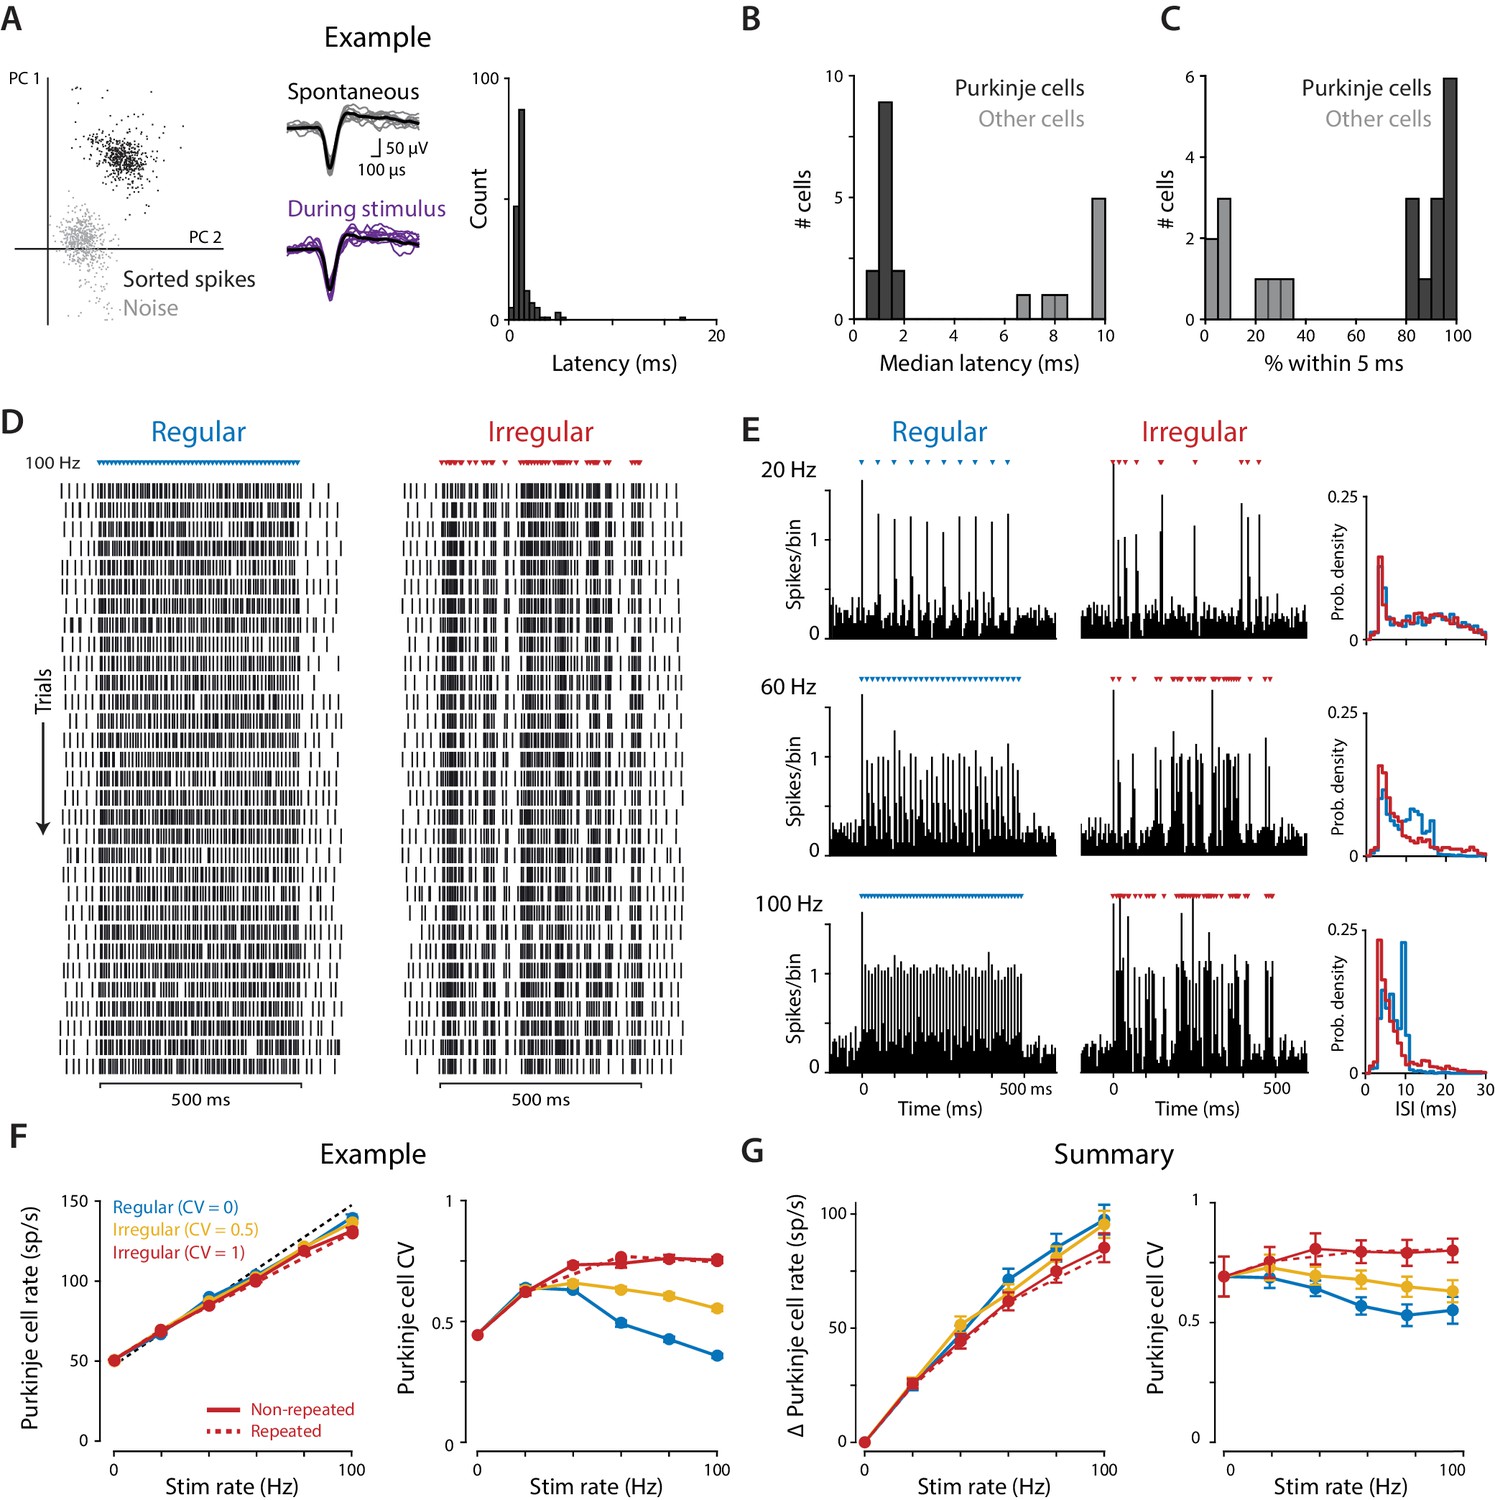
Optogenetic stimulation of Purkinje cells with regular and irregular stimulus trains.
(A) Recordings of optogenetically-driven spikes in an example Purkinje cell. Left, first two principle components of waveforms sorted as noise (gray) or spikes (black). Middle, spontaneous and optogenetic stimulus-driven spike waveforms. Right, distribution of the latency to the first spike following a single light pulse (1 ms, 1 mW). (B) Histogram of median first-spike latencies following a single light pulse for the population of identified Purkinje cells and for other cerebellar cell types (1 ms, 1 mW light pulses). (C) Histogram of the percent of trials for which the first spike following the first light stimulus occurred within 5 ms, for Purkinje cells and other cell types. (D) Raster of spike times in the example Purkinje cell shown in (A) during 100 Hz trains of regular (CV = 0; left) and irregular (CV = 1, repeated; right) optogenetic stimulation. Colored triangles above rasters indicate the time of each 1 ms light pulse. Each row represents a single trial, with 31 trials shown for each stimulus train, spanning 60 min of recording. (E) Peristimulus time histograms (left; 5 ms bin width) and ISI distributions (right; 1 ms bin width) for the example cell during 20 Hz, 60 Hz, and 100 Hz regular and irregular optogenetic stimulation. (F) Mean spike rate (left) and CV (right) for the example cell as a function of stimulus rate. The black dashed line represents a 1:1 relationship between stimulus rate and the increase in Purkinje cell spike rate relative to the spontaneous baseline. Solid lines show the responses to the regular and irregular (non-repeated) stimuli. The red dashed line shows the response to the irregular (CV = 1, repeated) trains shown in (D,E). (G) Mean increase in spike rate relative to baseline (left) and mean CV (right) for the population of Purkinje cells (n = 12, 1 mW light intensity). There was a small but significant effect of stimulus irregularity on Purkinje cell spike rate (main effect of stimulus irregularity F(2,22) = 20.73, p=0.0009; interaction between rate and irregularity, F(10, 110)=5.48, p<0.0001, two-way repeated measures ANOVA; or F(2,24) = 4.89, p=0.017; F(10, 120)=4.87, p<0.0001 with inclusion of one additional outlier (not shown, see Materials and methods)). Importantly, there was a significant effect of stimulus irregularity on Purkinje cell spike irregularity (main effect of stimulus irregularity F(2,22) = 20.73, p<0.0001; interaction between rate and irregularity, F(10, 110)=15.07, p<0.0001, two-way repeated measures ANOVA; or F(2,24) = 21.0, p<0.0001; F(10, 120)=13.6, p<0.0001 with outlier included).
-
Figure 3—source data 1
Optogenetic stimulus-driven Purkinje cell spike rate and spike irregularity.
Associated with Source code 3.
- https://doi.org/10.7554/eLife.37102.011
Figure 4 with 1 supplement

Eye movements evoked by regular and irregular Purkinje cell stimulation.
(A) Eye position averaged across trials in one representative mouse, during optogenetic stimulation of Purkinje cells with regular (left) or irregular (CV = 1, repeated; right) stimulus trains at 20, 60, and 100 Hz. Colored triangles indicate stimulus times. (B) Eye velocity averaged across trials in the example mouse. (C) Mean eye velocity, averaged across the 500 ms period of stimulation and plotted as a function of the stimulus rate, for the example mouse. Solid lines represent the results for regular and non-repeated irregular trains; dashed line represents the results from the repeated irregular trains. (D) Mean eye velocity as a function of the optogenetic stimulation rate, averaged across experiments (n = 16 flocculi from 10 mice). Colors indicate the stimulus irregularity, as in (C). There was a small but significant interaction of stimulus irregularity and stimulus rate on the mean eye movement responses (fixed effect of irregularity: p=0.34, interaction: p=0.021, likelihood ratio test of linear mixed effects model). (E) Mean eye velocity as a function of the mean increase in spike rate recorded in the population of Purkinje cells. Colors indicate the stimulus irregularity, as in (C). There was no significant effect of Purkinje cell irregularity on the mean eye movement responses (fixed effect of irregularity: p=0.86, interaction: p=0.80, likelihood ratio test of linear mixed effects model; with the outlier Purkinje cell included in the mean Δ Purkinje cell rate, fixed effect of irregularity: p=0.50; interaction: p=0.88).
-
Figure 4—source data 1
Optogenetic stimulus-driven eye velocity and Purkinje cell spike rates.
Associated with Source code 4.
- https://doi.org/10.7554/eLife.37102.014
Figure 4—figure supplement 1
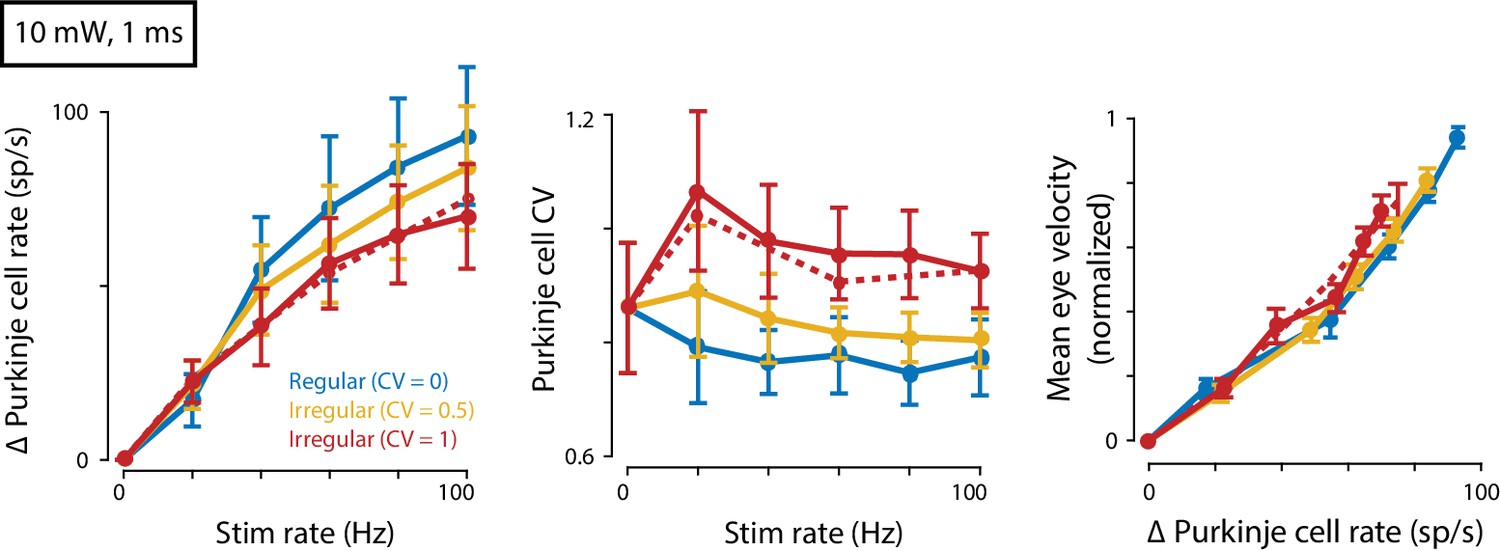
Eye movements evoked by regular and irregular Purkinje cell stimulation at a higher light intensity.
Mean spike rate (left) and CV (middle) for Purkinje cells recorded in response to 10 mW light intensity stimulation (n = 7 cells from four mice). Right, Mean eye velocity as a function of the mean increase in Purkinje cell spike rate during 10 mW stimulation. There was no significant effect of Purkinje cell irregularity on mean eye velocity (fixed effect of irregularity: p=0.19, interaction: p=0.56, n = 19 flocculi from 13 mice, likelihood ratio test of linear mixed effects model).
Figure 5 with 1 supplement

Purkinje cells control eye velocity with a rapid rate code.
(A) Mutual information between Purkinje cell spike rate and eye velocity during regular and irregular (CV = 1, repeated) optogenetic stimulus trains, calculated with the Purkinje cell spike rate smoothed by taking a moving average over time windows of different lengths (‘Temporal smoothing’). Purkinje cell spike rate carried the same amount of information about eye velocity during the regular and irregular stimulus trains for temporal smoothing windows from 1 ms through 8 ms (all p>0.1 for 1 ms – 8 ms, 13 ms, and 20 ms; for other window lengths p ranges from 0.0003 to 0.0361, post hoc test with Sidak correction; two-way repeated measures ANOVA with significant interaction between smoothing window length and irregularity (F (19, 285)=11, p<0.0001, n = 16 flocculi from 10 mice; or all p>0.1 for 1 ms – 8 ms, 13 ms, and 20 ms and other p ranging from 0.0002 to 0.0223 with outlier Purkinje cell included). (B) Linear filter describing the transformation of Purkinje cell rate into eye velocity, fit using data from irregular stimulation (CV = 1, non-repeated; n = 16 flocculi from 10 mice). (C) Actual eye velocity (black) and predicted eye velocity (colors) in an example mouse for test stimuli that were not used to fit the linear filter model: regular and irregular (CV = 1, repeated) stimulation at 20, 60, and 100 Hz. (D) Actual versus predicted eye velocity at each 1 ms time point during the regular and irregular test stimuli, for the example mouse in (C). (E) Root mean squared error (RMSE) between actual and predicted eye velocity for each experiment (5.57 ± 0.45°/s regular, 5.56 ± 0.41°/s irregular, n = 16, p=0.92, n.s.: not significant, paired t-test; or p=0.87 with outlier Purkinje cell included). RMSE for the example mouse in (C,D) is plotted with hollow circles.
-
Figure 5—source data 1
Mutual information and linear filter fits for Figure 5.
Associated with Source code 5.
- https://doi.org/10.7554/eLife.37102.017
Figure 5—figure supplement 1
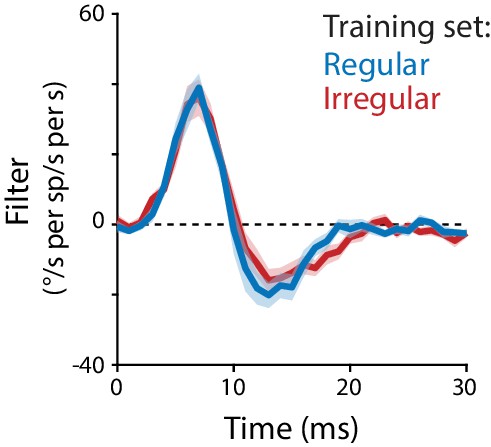
Linear filter models fit to regular or irregular training data.
Linear filter describing the transformation from Purkinje cell rate to eye velocity, fit using data from regular stimulation at all frequencies (20, 40, 60, 80, 100 Hz; blue) overlaid on the linear filter fit using data from irregular stimulation (CV = 1, non-repeated, replotted from Figure 5B; red).
Figure 6

Effect of spike irregularity on the variability of the population spike rate.
(A) The probability density of the population spike rate, computed in 5 ms bins, for a population of 50 simulated Purkinje cells, each firing asynchronously at a given mean rate with the level of irregularity indicated in the legend. The two lower levels of irregularity (CV = 0.55 and CV = 0.82) correspond to the mean CV measured in Purkinje cells during 100 Hz regular or irregular optogenetic stimulation (Figure 3G). The high level of irregularity (CV = 1.7) is near the high end of the range reported in mouse models of ataxia (Hoebeek et al., 2005; Gao et al., 2012; Stahl and Thumser, 2014; Mark et al., 2015) and was used in the simulations of Luthman et al. (2011). (B) Receiver operator characteristic (ROC) curve (Fawcett, 2006) for the distributions in (A), with the true positive fraction (sensitivity) plotted as a function of the false positive fraction (1 – specificity). Chance performance (no discrimination) is represented by the dashed diagonal line; perfect discrimination is represented by a step function beginning at the origin. Increasing the CV from 0.55 to 0.82 has a minor effect on the ability to discriminate the two frequencies, whereas discrimination is more impaired for a pathological level of irregularity (CV = 1.7).
Figure 7
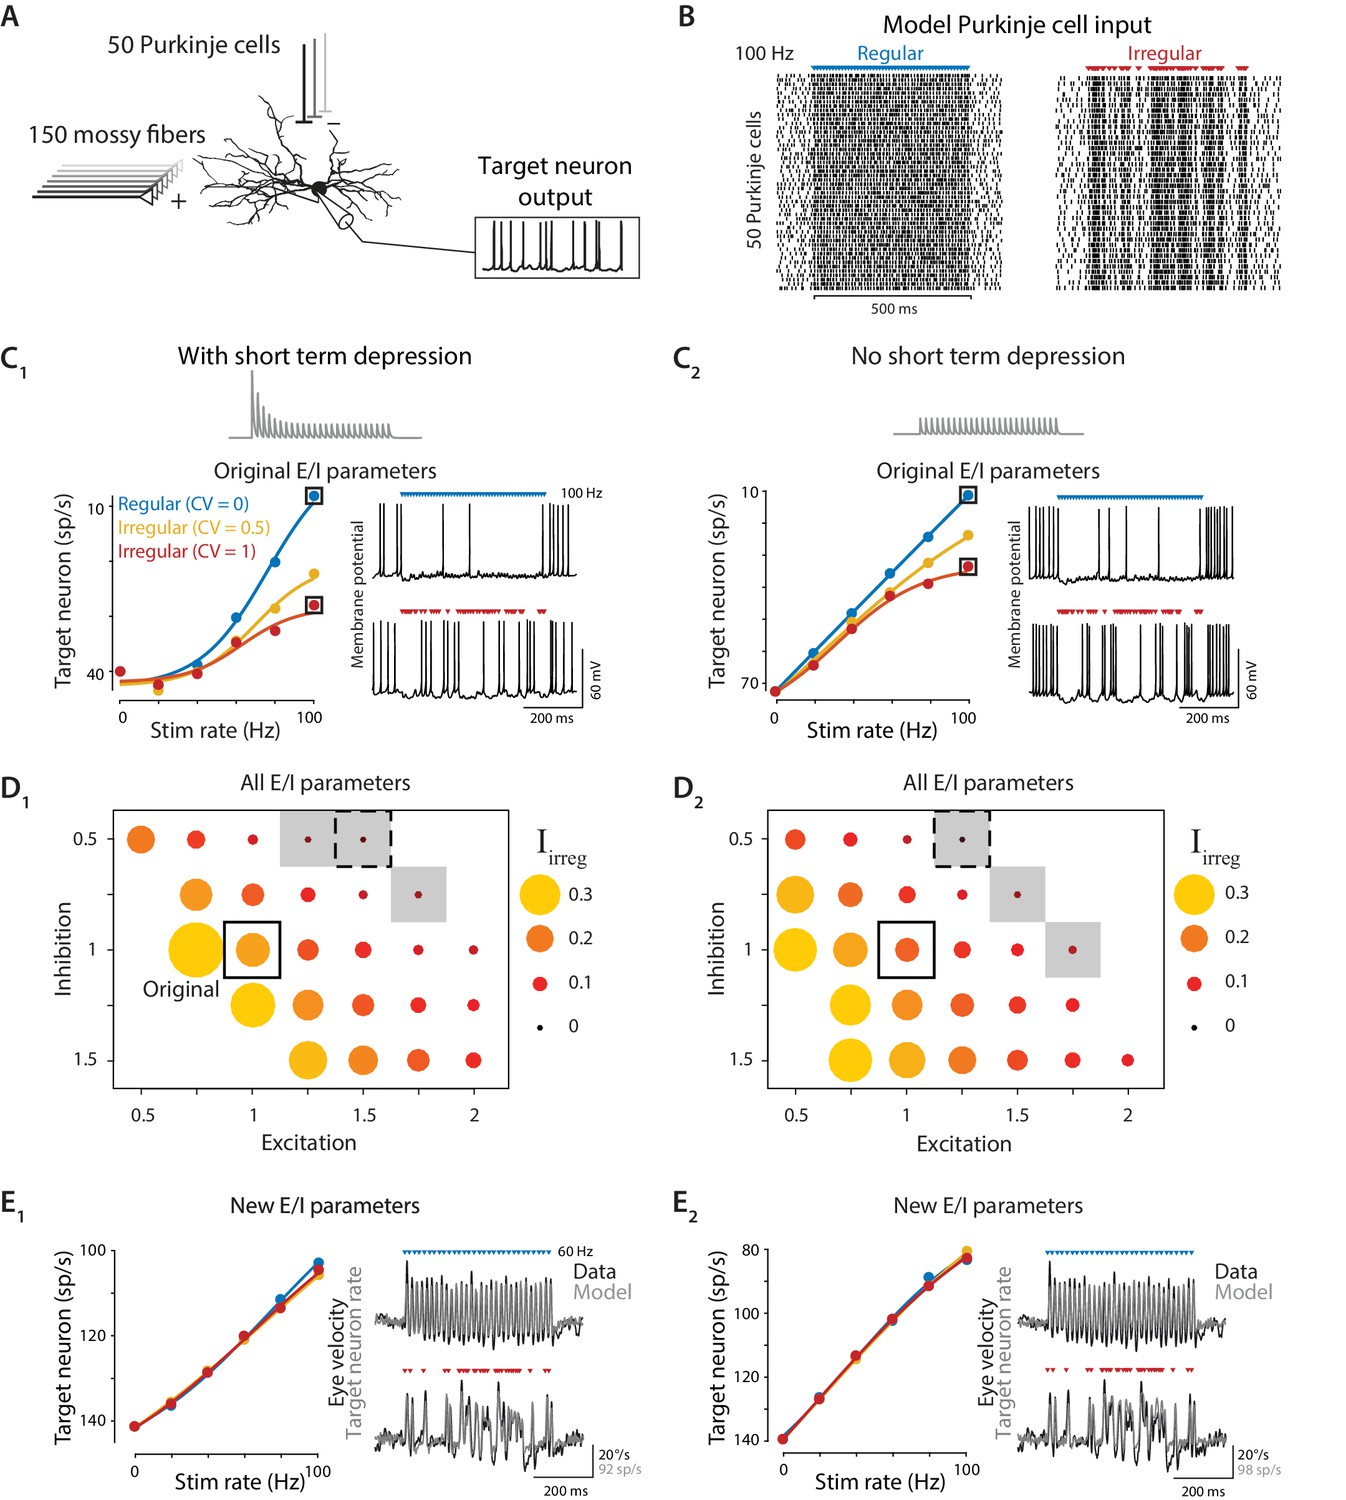
Biophysical model: During simulated optogenetic stimulation, impact of spike irregularity is sensitive to the excitation/inhibition ratio.
(A) Schematic showing elements in the model. A biophysical model of a Purkinje cell target neuron received inhibitory synaptic input from 50 Purkinje cells and excitatory synaptic input from 150 mossy fibers. The effect of Purkinje cell stimulation on the output of the model target neuron was compared with the experimentally observed eye movement responses to Purkinje cell stimulation. (B) Spike trains in the 50 model Purkinje cells during simulated optogenetic stimulation (100 Hz regular and irregular stimulation illustrated here) were composed of spontaneous spikes plus stimulus-driven spikes. (C) Target neuron output in response to simulated optogenetic stimulation, for the model with all original parameters including short-term synaptic depression (STD) at the Purkinje cell-to-target neuron synapses (C1) and for the same model but without STD (C2). Note different scales of vertical axes in C1 and C2. Gray traces show STD of the inhibitory conductance in the model during 50 Hz stimulation. Mean target neuron spike rate during the 500 ms stimulus train is plotted for a range of different stimulation rates and levels of irregularity (left). In this and subsequent panels, the firing rate of the model target neuron is plotted with the y-axis inverted (lower firing rate plotted higher on the y-axis) since Purkinje activation drives a decrease in target neuron activity below the spontaneous rate (Lisberger et al., 1994b), which in turn drives eye movements (Dufossé et al., 1977). Voltage traces (right) show the membrane potential of the model target neuron during 100 Hz regular (top) or irregular (bottom) stimulation. (D) Irregularity impact index (, see text) for models with different strengths of excitatory (E) and inhibitory (I) conductance (relative to the original model, indicated by solid box), with short-term depression (D1) or without short-term depression (D2) of the Purkinje cell-to-target neuron synapses. The size and color of the circle reflects the value of for each set of model E/I parameters, with larger circles representing a larger difference in the impact of regular versus irregular Purkinje cell stimulus trains on the mean target neuron output (positive values reflect a bigger impact of regular trains). Gray shading indicates model parameters for which < 0.05 (compare with gray shading in Figure 8A). Dashed boxes indicate parameters that yielded a close fit to experimental results, shown in (E). (E) Mean target neuron output averaged across the 500 ms stimulus trains (left); the moment-to-moment trajectory of the model output (right, gray) and actual eye velocity from an example mouse (right, black) during 60 Hz stimulus trains, for models with new E/I parameters (indicated by dashed boxes in panel D), either with short-term depression (E1) or without short-term depression (E2).
Figure 8
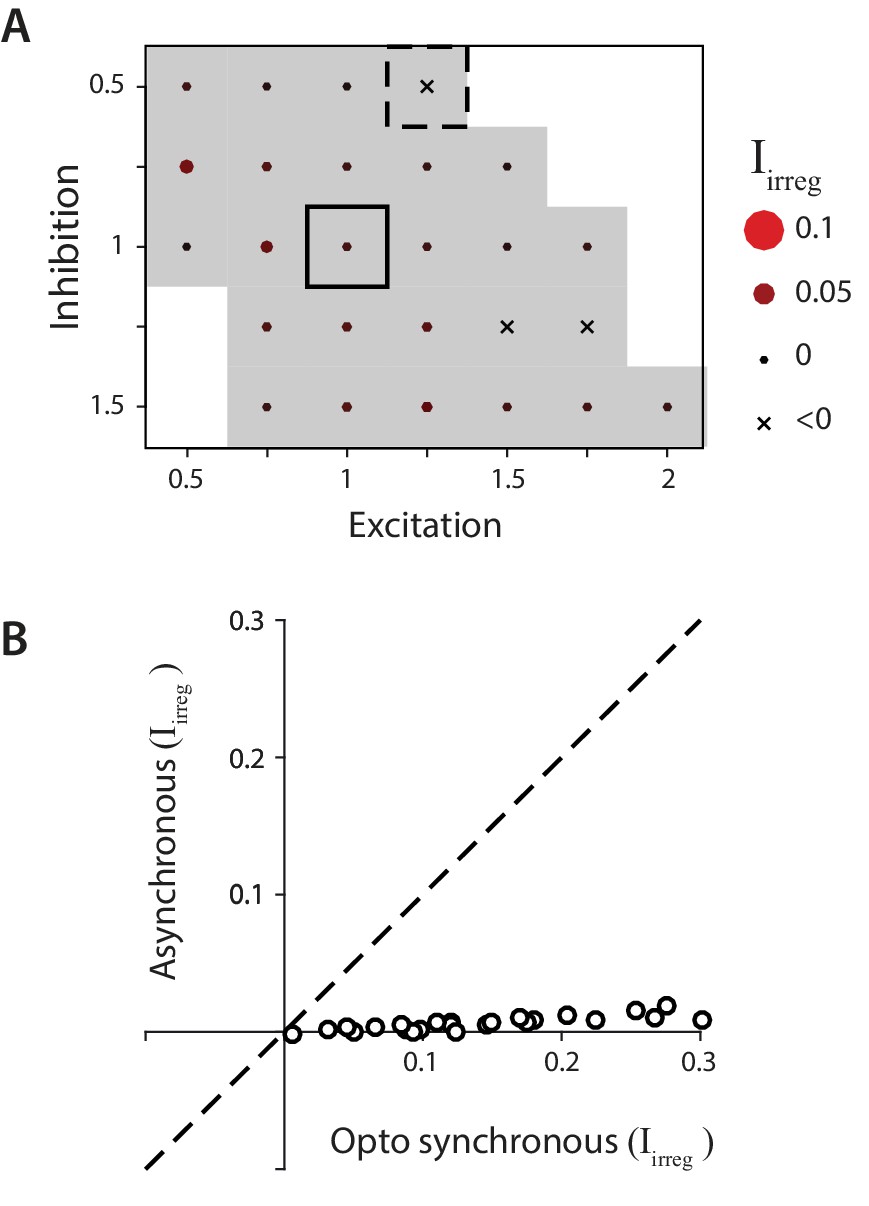
Biophysical model: Reduced impact of irregularity during asynchronous activity.
(A) Impact of irregularity () during asynchronous Purkinje cell activity for biophysical models without STD. The color scale for is the same as in Figure 7, while the size of the corresponding circles is expanded two-fold to improve visibility of the much smaller differences between models. Gray shading indicates < 0.05, for comparison with Figure 7D. (B) The impact of irregularity during the more synchronous Purkinje cell activity of simulated optogenetic stimulation (‘Opto synchronous’), compared with the impact of irregularity when the same spike trains were shuffled to provide asynchronous Purkinje cell activation in the same model (‘Asynchronous’). Note that even in the Opto synchronous condition, there was considerable spike asynchrony due to the independent, spontaneous activity in each Purkinje cell and variation in the latencies of the spikes driven by each simulated light pulse.
Figure 9
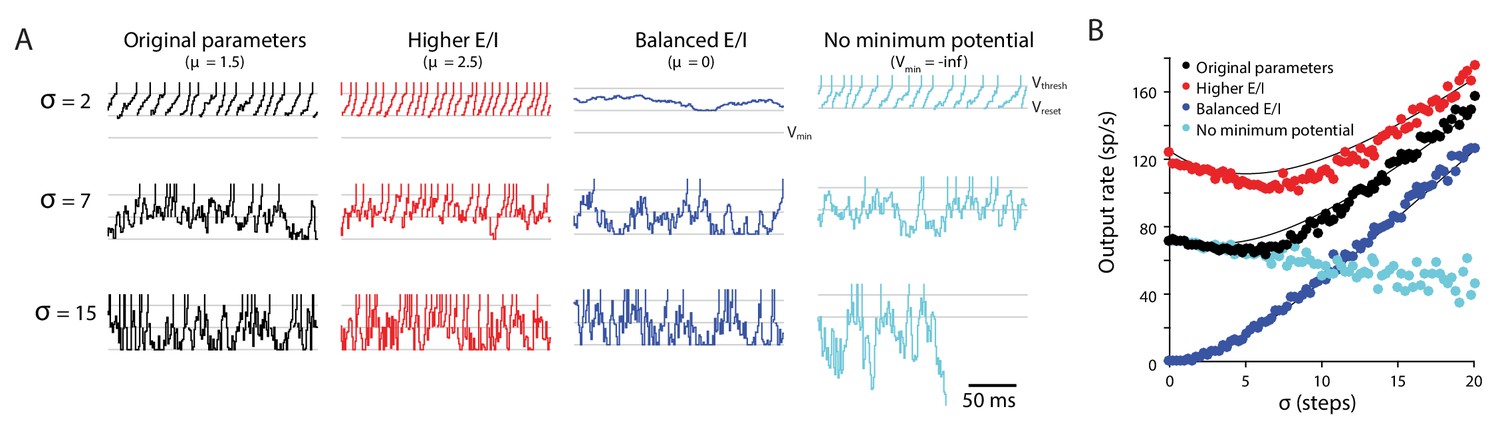
Random walk model: Input variability can increase or decrease target neuron firing.
Random walk simulation of a simple integrate-and-fire neuron receiving stochastic inputs with mean μ and standard deviation σ. Additional parameters are the threshold voltage Vthresh = 40 steps (arbitrary units), reset voltage Vreset = 20 steps, minimum voltage Vmin = 0 and time step dt = 1 ms (Salinas and Sejnowski, 2000). Black: original parameters (μ = 1.5; Vmin = 0); red: increased E/I ratio (‘Higher E/I’, μ = 2.5), dark blue: balanced excitation and inhibition (‘Balanced E/I’, μ = 0); light blue: membrane potential floor eliminated (‘No minimum potential’, Vmin = –infinity, equivalent to raising Vthresh and Vreset very far from Vmin). (A) Example traces showing the membrane potential in model neurons for different levels of input variability (σ = 2, 7, 15 steps). At each time step, the voltage changes by an amount drawn from a normal distribution with mean μ and standard deviation σ. Upon crossing Vthresh (top gray line), the voltage is automatically lowered to Vreset (middle gray line) (vertical lines are added to visualize spike times). There is a reflecting floor at Vmin (bottom gray line, not present for ‘No reflecting barrier’). (B) Numerical simulations (dots) and approximate analytic predictions (lines) of the firing rate output of model neurons receiving stochastic inputs with mean μ and standard deviation σ. In both the original and ‘Higher E/I’ simulations, there is a range of σ where small changes in variability have little effect on mean output rates (the range where the curves are approximately flat). Increasing the E/I balance shifts this flat region to the right.
Figure 10
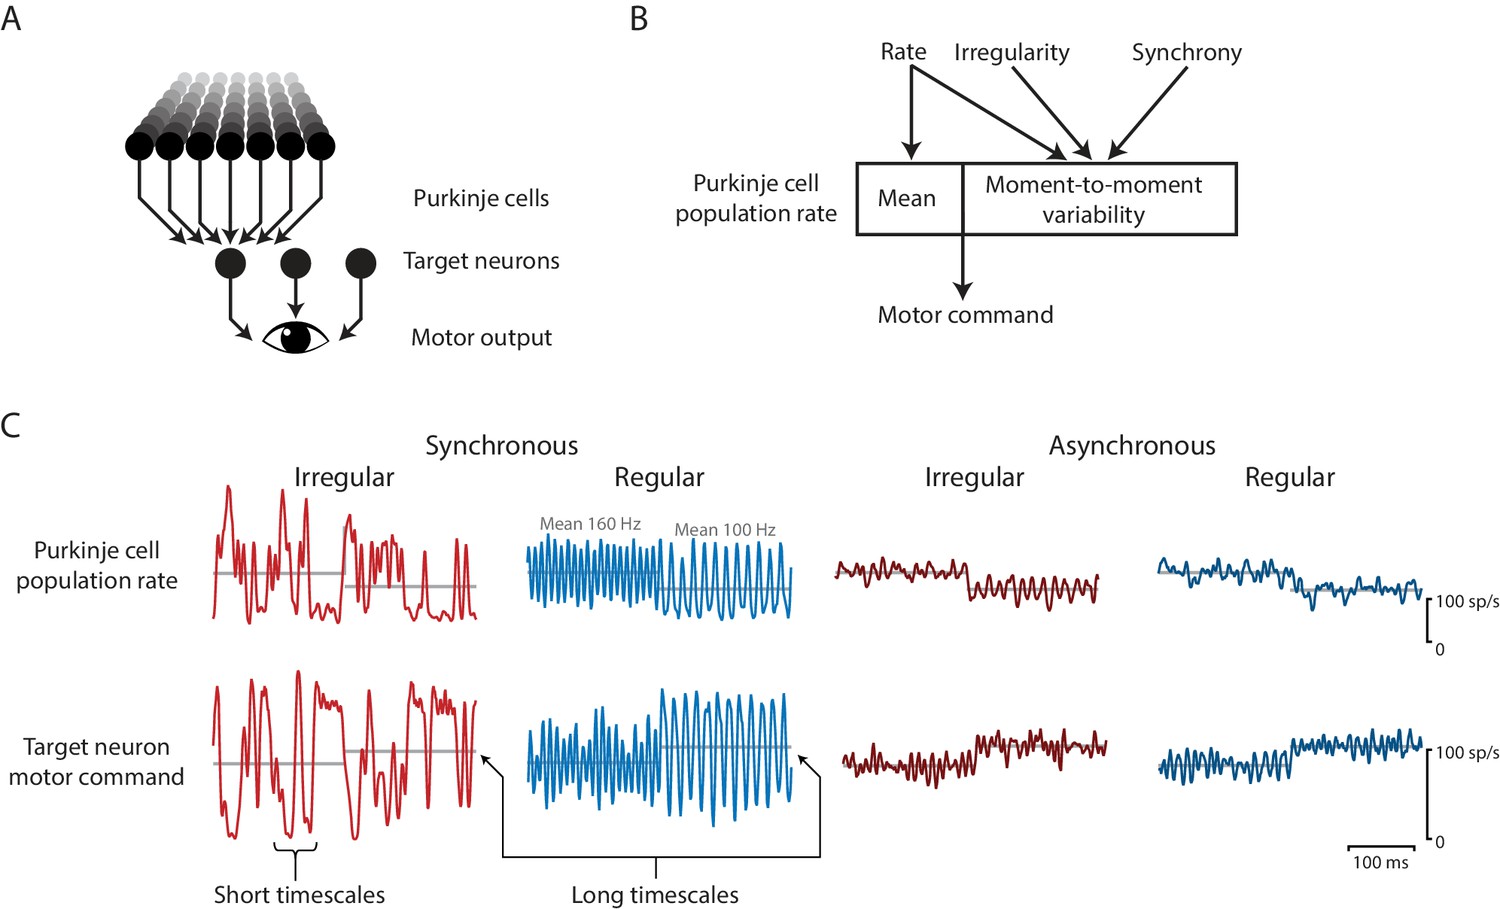
Effects of spike irregularity and synchrony on motor output over short and long timescales.
Our recording, stimulation, and modeling results indicate that Purkinje cells in the cerebellar flocculus control motor output with a rapid rate code. (A) Schematic of the transformation from Purkinje cells to motor output. A population of Purkinje cells (and excitatory neurons, not shown) converges on each target neuron. A population of target neurons drive eye movements. (B) The rate, irregularity, and synchrony of spike trains in individual Purkinje cells can each influence the population spike rate. The mean and variability of the Purkinje cell population rate both affect motor output through a rapid rate code. (C) Effects of Purkinje cell spike irregularity and synchrony on the Purkinje cell population spike rate (top), and target neuron spike rate, representing the eye velocity motor command (bottom). The mean population spike rate in a given time interval—either a few milliseconds or hundreds of milliseconds—can predict the mean eye velocity in that same time interval. At short timescales of a few milliseconds, the irregularity and synchrony of spiking in individual Purkinje cells can affect the population spike rate and hence the moment-to-moment motor output. At longer timescales of a few hundred milliseconds, the same mean spike rate elicits the same mean eye velocity (gray lines), regardless of the level of irregularity or synchrony.
Tables
Key resources table
| Reagent type (species) or resource | Designation | Source or reference | Identifiers |
|---|---|---|---|
| Strain, strain background (Mus musculus) | ChR2(H134R)-EYFP | Jackson Laboratory | RRID:IMSR_JAX:024109 |
| Strain, strain background (Mus musculus) | (Pcp2-cre)3555 Jdhu/J | Jackson Laboratory | RRID:IMSR_JAX:010536 |
| Software, algorithm | NEURON biophysical model by Luthman et al., 2011. | ModelDB | 144523 |
Additional files
-
Source code 1
Source code for Figure 1.
Requires Figure 1—source data 1 and Figure 1—source data 2.
- https://doi.org/10.7554/eLife.37102.023
-
Source code 2
Source code for Figure 2.
Requires Figure 1—source data 1 and Figure 1—source data 2.
- https://doi.org/10.7554/eLife.37102.024
-
Source code 3
Source code for Figure 3.
Requires Figure 3—source data 1.
- https://doi.org/10.7554/eLife.37102.025
-
Source code 4
Source code for Figure 4.
Requires Figure 4—source data 1.
- https://doi.org/10.7554/eLife.37102.026
-
Source code 5
Source code for Figure 5.
Requires Figure 5—source data 1.
- https://doi.org/10.7554/eLife.37102.027
-
Source code 6
Source code for Figure 6.
- https://doi.org/10.7554/eLife.37102.028
-
Source code 7
- https://doi.org/10.7554/eLife.37102.029
-
Source code 8
Source code for Figure 9.
- https://doi.org/10.7554/eLife.37102.030
-
Supplementary file 1
Results from the linear mixed effects model used to predict residual eye velocity from residual Purkinje cell spike rate and irregularity.
Fixed effect coefficients (β0, spike rate; β1, CV2; β2, interaction between rate and CV2), 95% confidence intervals (CI), and p-value (F-test) for the fits to data from monkeys and mice are shown.
- https://doi.org/10.7554/eLife.37102.031
-
Transparent reporting form
- https://doi.org/10.7554/eLife.37102.032
Download links
A two-part list of links to download the article, or parts of the article, in various formats.
Downloads (link to download the article as PDF)
Open citations (links to open the citations from this article in various online reference manager services)
Cite this article (links to download the citations from this article in formats compatible with various reference manager tools)
Cerebellar Purkinje cells control eye movements with a rapid rate code that is invariant to spike irregularity
eLife 8:e37102.
https://doi.org/10.7554/eLife.37102


