Active presynaptic ribosomes in the mammalian brain, and altered transmitter release after protein synthesis inhibition
- Rutgers University, United States
Figures
Figure 1
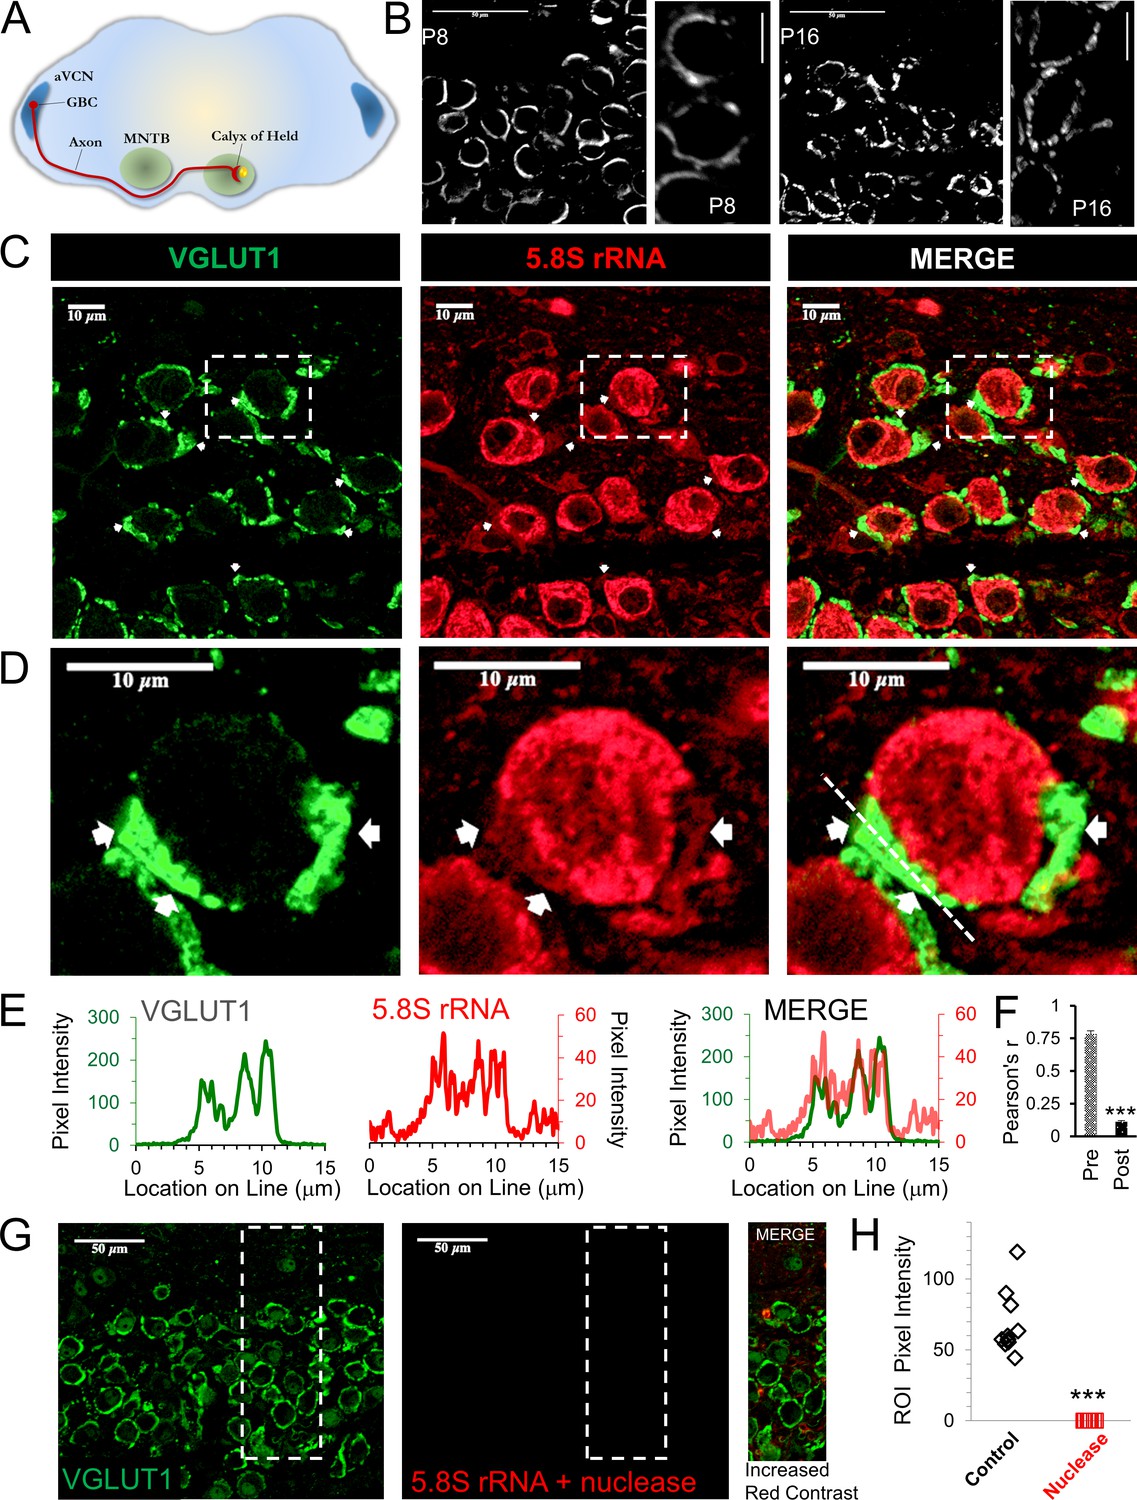
Presence of presynaptic ribosomes in brain slices.
(A) Globular bushy cells (GBCs) in anteroventral cochlear nucleus (aVCN) project long axons (~3 mm) forming monosynaptic calyx synapses onto principal cells in the contralateral medial nucleus of the trapezoid body (MNTB). (B) VGLUT1 antibody labels synaptic vesicles in the calyx of Held nerve terminal. At postnatal day 8 (P8) the calyx largely surrounds the postsynaptic neuron. By P16, a fenestrated morphology with swellings is seen (scale: 50 μm or 10 μm). (C) VGLUT1 antibody labels synaptic vesicles in the calyx of Held nerve terminal. Immunolabeling of 5.8S rRNA identifies ribosomes. White arrows in each panel depict some examples of clear presynaptic 5.8S rRNA signal. (D) High optical zoom of dotted box in panel C. White arrows mark presynaptic 5.8S rRNA. (E) Line scan analysis depicts pixel intensity of VGLUT1 and 5.8S rRNA along a 15 μm line shown in Figure 1D. Merged line scans show excellent overlap in relative signal intensity of VGLUT1 and 5.8S rRNA. (F) Pearson’s correlation coefficients (r) quantifies colocalization between the VGLUT1 and 5.8S rRNA signals, (n = 13 presynaptic terminals). The r-value of 0.78 ± 0.02, demonstrates high colocalization. The r-values for the matching postsynaptic cell body regions (n = 13) have an r-value of 0.11 ± 0.10 (p ≤ 0.001 t-test and KS2-test; AD-test for presynaptic dataset normal distribution, p = 0.06). (G) Nuclease treatment prior to 5.8S rRNA antibody binding eliminates the ribosomal signal. Enhanced contrast further shows the lack of ribosomal RNA after nuclease treatment. (H) Nuclease treatment effectively eliminates 5.8S rRNA signal compared to control conditions (p ≤ 0.001 t-test and KS2-test; AD-test control dataset normal distribution, p = 0.025).
-
Figure 1—source data 1
5.8s rRNAline scan, Pearson's r, and pixel intensity.
- https://doi.org/10.7554/eLife.36697.003
Figure 2 with 1 supplement
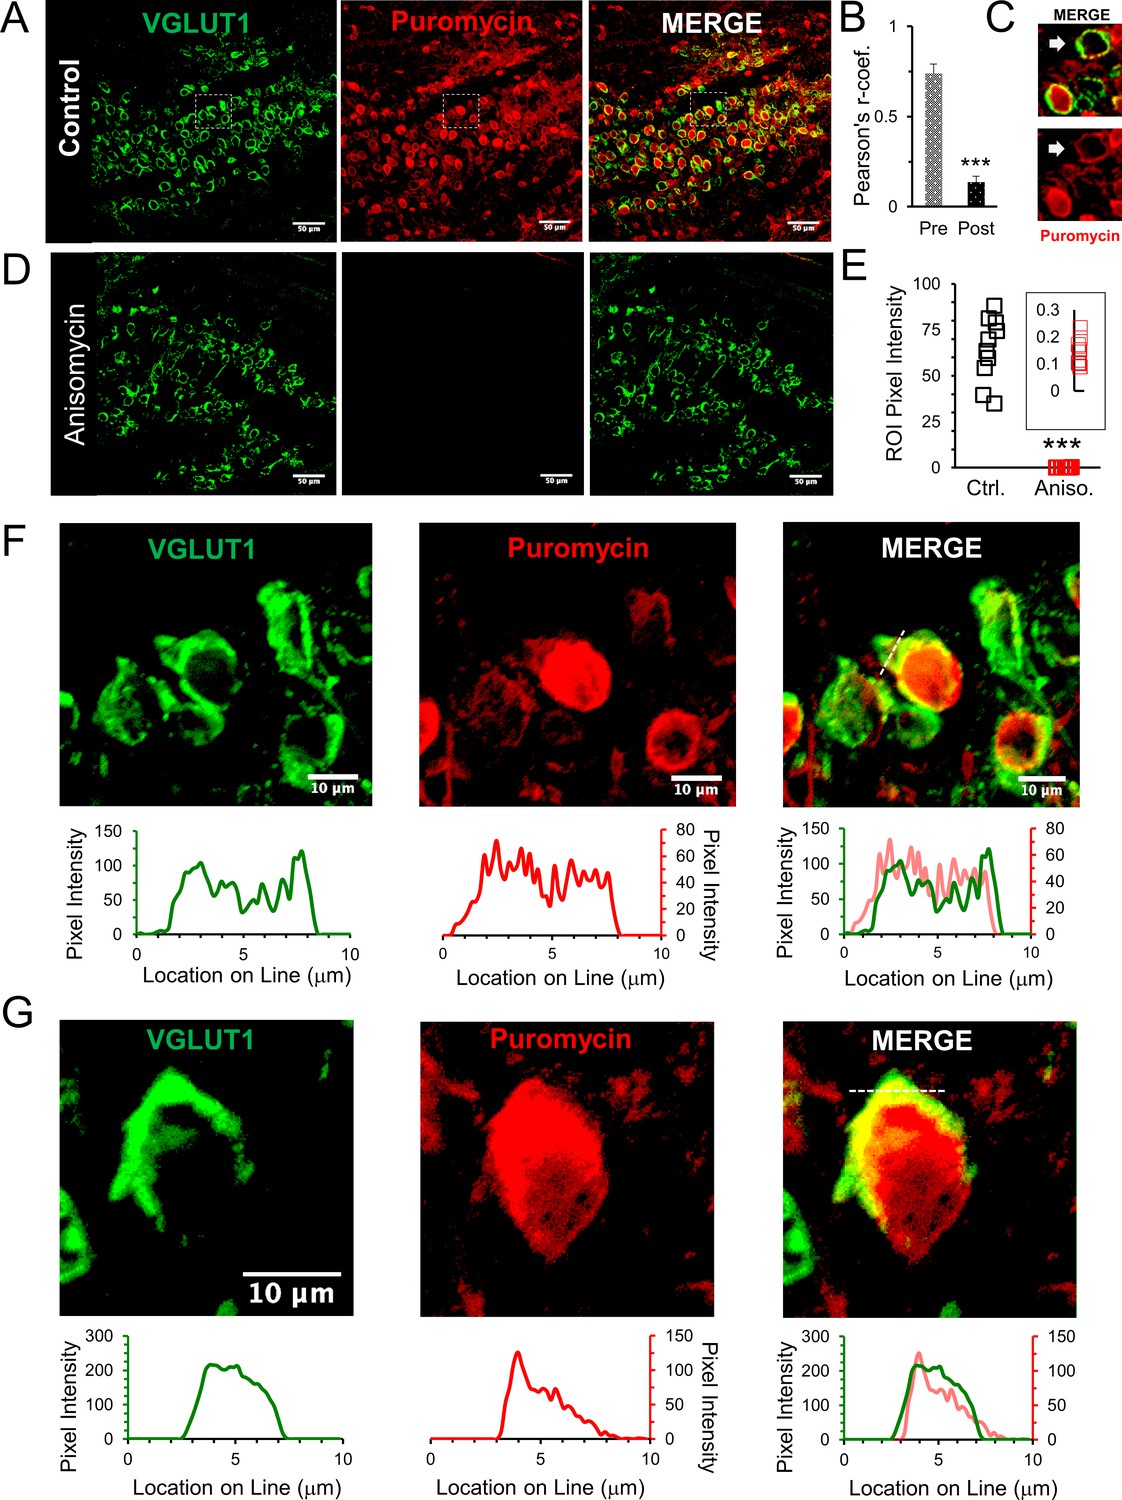
Active ribosomes in the presynaptic terminal in brain slices.
(A) VGLUT1 antibody identifies the presynaptic terminal by labeling synaptic vesicles in the calyx of Held nerve terminal. Puromycin, tRNA analog, labeling shows active translation sites (SUnSET). Merge VGLUT1 +Puromycin shows active presynaptic ribosomes. (B) Pearson’s correlation coefficient (r) quantifies colocalization between VGLUT1 and puromycin signals for presynaptic terminals (n = 13). Average r = 0.74 ± 0.05, demonstrates high colocalization. A comparison, average r in corresponding postsynaptic cell bodies = 0.14 ± 0.03 (p ≤ 0.001 t-test and KS2-test; AD-test presynaptic dataset normal distribution, p = 0.06, AD-test postsynaptic dataset normal distribution, p = 0.05; n = 13). (C) Example of presynaptic puromycin signal (arrow) in the absence of a postsynaptic signal. Likely due to damage and deterioration of postsynaptic neuron with intact terminal. (D) Application of translational inhibitor (anisomycin, 40 μM) for 1 hr prior to puromycin treatment eliminates puromycin labeling (center panel and right panel), showing specificity of puromycin binding to active ribosomes. (E) Anisomycin treatment eliminates the puromycin signal. Inset shows higher detail of the residual ROI pixel intensity following anisomycin treatment (Pixel Intensity Ctrl = 64.4 ± 1.76, Aniso = 0.14 ± 0.02; p ≤ 0.001 t-test and KS2-test; n = 10). (F) Top Panels: higher optical zoom (63x) of dotted box in panel 2A. Bottom Panels: Line scan analysis shows pixel intensity of VGLUT1 and puromycin along the 10 μm line shown in merged image (right panel). Line scan overlay shows a high overlap in relative signal intensity of VGLUT1 and puromycin along scan line. (G) Additional example from a different brain slice (PN8) shows active ribosomes in both the pre- and postsynaptic compartments, demonstrated in line scans below each image. Merged overlay shows an excellent match in relative intensities of VGLUT1 and puromycin.
-
Figure 2—source data 1
Puromycin line scans, Pearson's r, and pixel intensity.
- https://doi.org/10.7554/eLife.36697.006
Figure 2—figure supplement 1
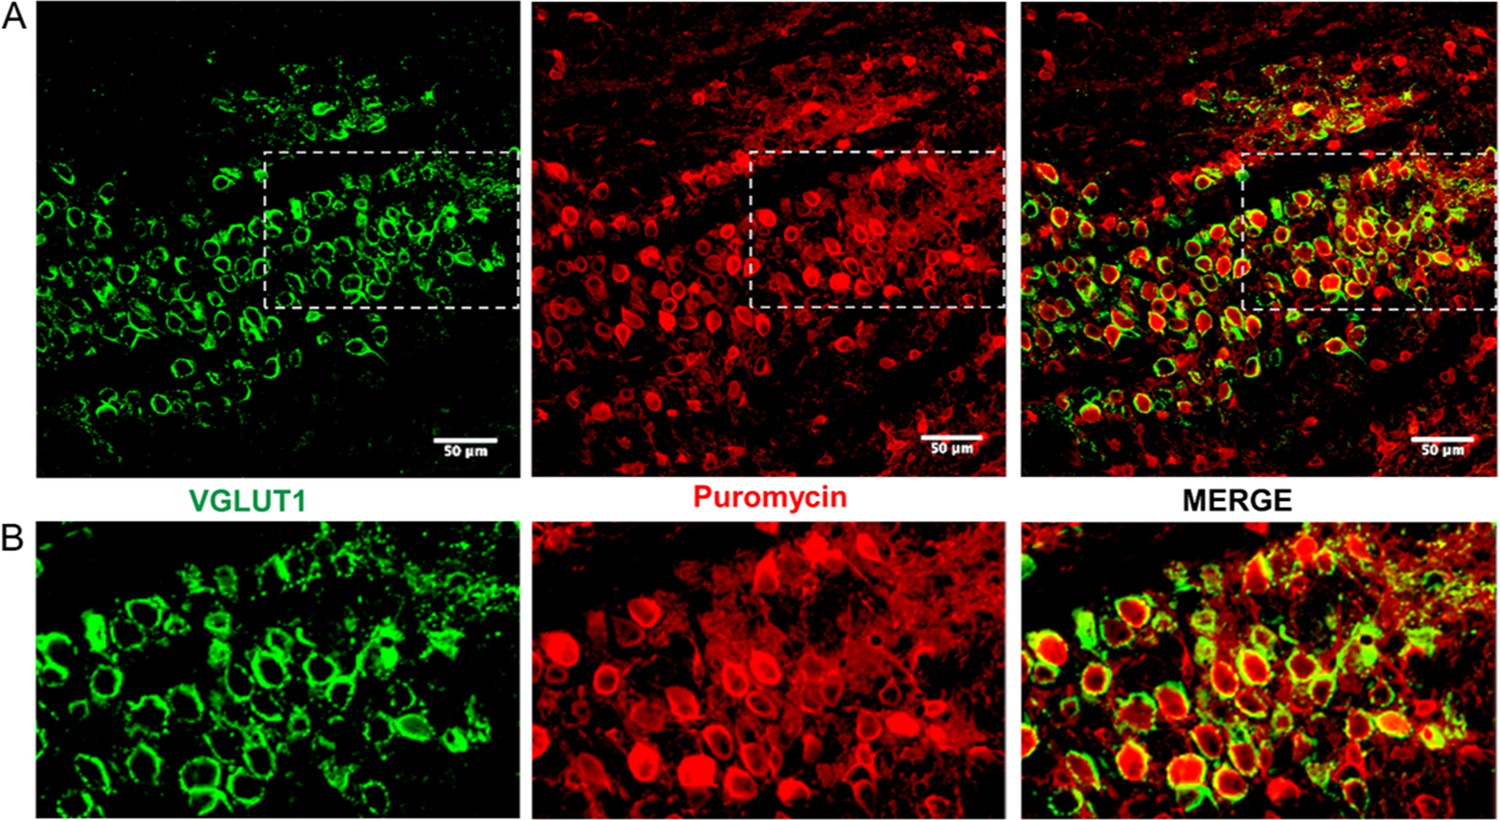
Active ribosomes adjacent to the calyx of Held in brain slices.
(A) This is the same image shown in Figure 2, shown at a larger size to better illustrate the ribosomal activity present in the slice. (B) The sections outlined in panel A are shown here at a higher level of detail. Here, ribosomal activity in the calyx presynaptic terminal is present, but the higher level of background activity in this area made it more difficult to specifically show the ribosomal activity occurring in the presynaptic terminal.
Figure 3
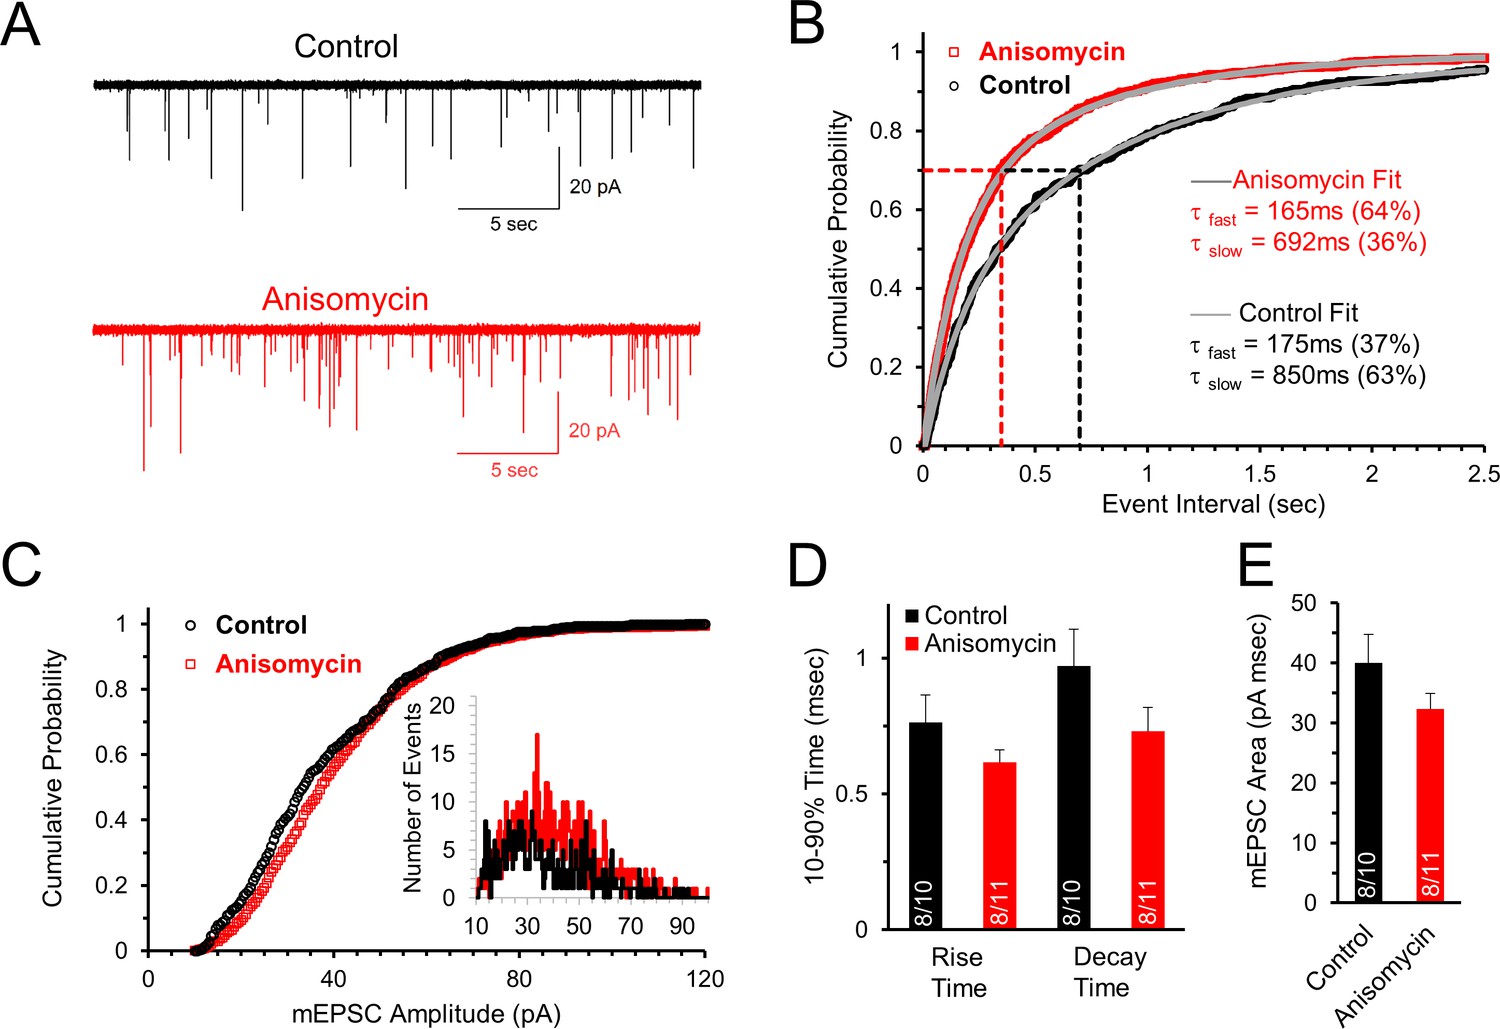
Initial spontaneous release frequency is higher in neurons treated with protein synthesis inhibitor, demonstrating a presynaptic effect.
(A) Representative recordings of the initial spontaneous release in control neurons (black) and neurons treated with the translational inhibitor anisomycin (red). (B) Cumulative probability of the intervals between spontaneous release events measured by mEPSCs in neurons treated with protein synthesis inhibitor (red) and control neurons (black). The time constants and amplitudes of double exponential fits (gray versus blue lines) show a reversal in the percent contributions of the fast and slow release components for the population of event intervals in control and translation inhibited neurons. (C) Cumulative probability of mEPSC amplitudes in protein synthesis inhibited (red) and control (black) neurons. Inset histogram: number of release events at different amplitudes. (D) Average mEPSC 10–90% rise time for control and anisomycin treated neurons (left; control = 0.76 ± 0.1; aniso = 0.62 ± 0.05) and decay time (right; control = 0.97 ± 0.14; aniso = 0.73 ± 0.09). Bar graph n-values: # of animals/ # of neurons. (E) Average mEPSC area for control (40 ± 4.7) and anisomycin treated neurons (32.4 ± 2.6).
-
Figure 3—source data 1
Initial spontaneous release following anisomycin treatment.
- https://doi.org/10.7554/eLife.36697.008
Figure 4
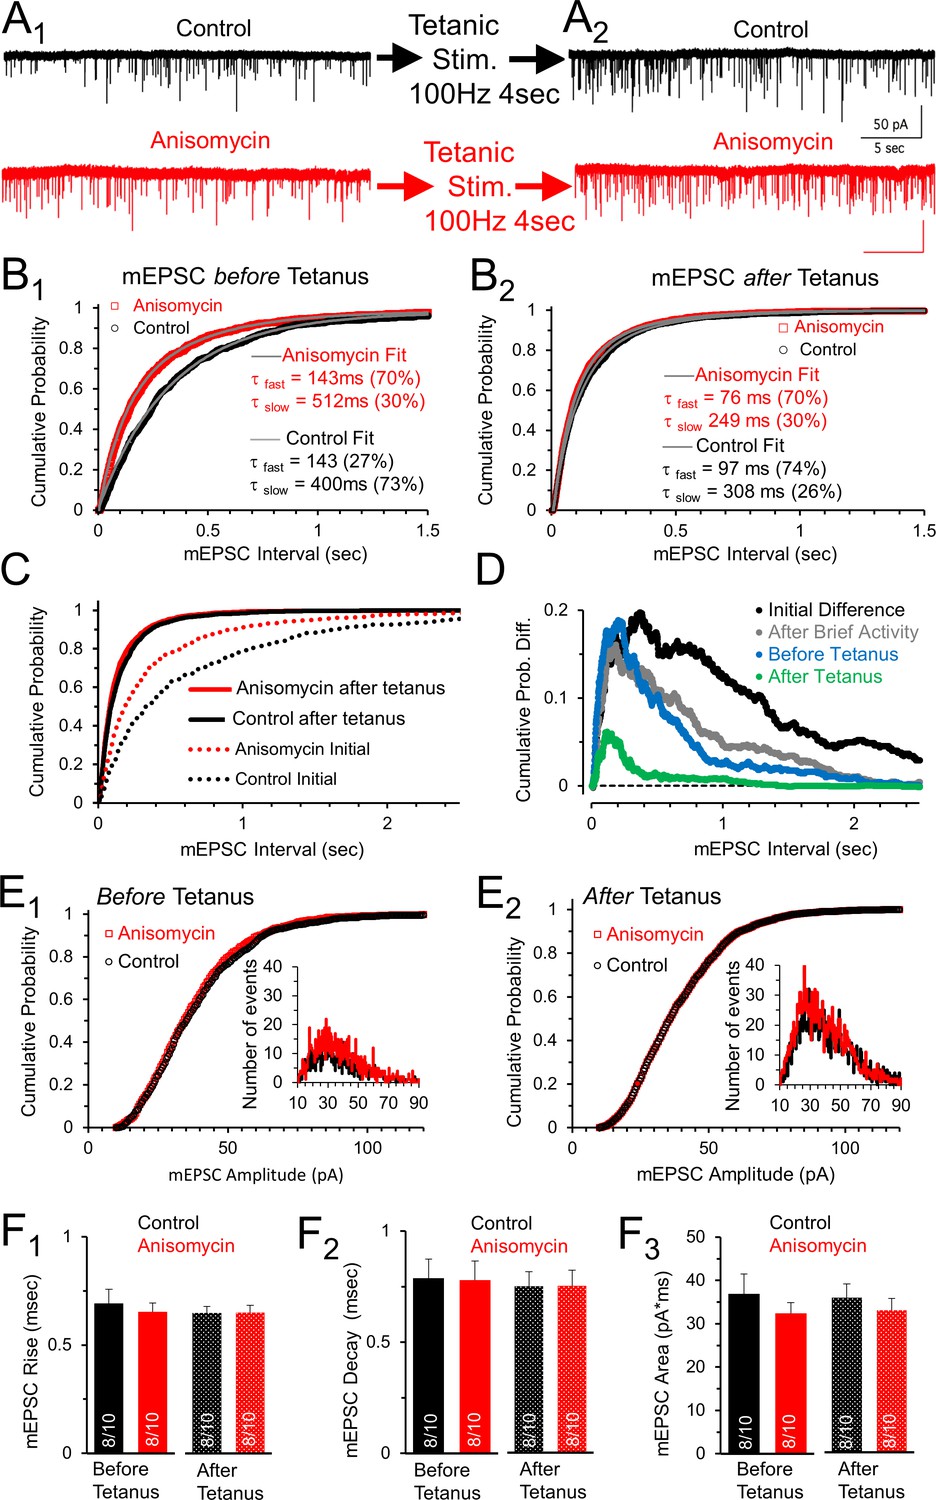
Spontaneous release following tetanus eliminates differences in mEPSC frequency between control and protein synthesis inhibited neurons.
(A1) Spontaneous release in control (black) and slices treated with the translational inhibitor anisomycin (red). Earlier activity (0.4 s, 100 and 200 Hz, and 4 s 100 Hz) increased frequency in both groups. (A2) Spontaneous release in control (black traces) and neurons treated with the protein synthesis inhibitor anisomycin (red) following tetanic stimuli. (B1) Cumulative probability of interval times between spontaneous release events in neurons treated with anisomycin (red) and control neurons (black) before tetanic stimulation. Double exponential fits (gray) show differences in the percent contributions of the fast and slow components. (B2) Cumulative probability of intervals between mEPSC events after a tetanic stimulation. Double exponential fits (gray) show percent differences in the fast and slow components. (C) Initial cumulative probability of release (dotted lines) compared to release following tetanic stimulation in control (black) and neurons treated with anisomycin. (D) Differences in cumulative probability of release in anisomycin treated minus control neurons: initial difference (black); after brief activity (100 and 200 Hz for 400 msec each, gray); before tetanic stimulation (blue); following tetanic stimulation (green). (E1) Cumulative probability of mEPSC amplitudes in protein synthesis inhibited (red) and control (black) neurons prior to evoked stimulation. Inset: depicts histogram of the mEPSC amplitudes. (E2) Cumulative probability of mEPSC amplitudes in protein synthesis inhibited neurons (red) and control (black) following a tetanic stimulation. Inset: mEPSC amplitude histogram. (F1) mEPSC 10–90% rise time for control (black) and anisomycin (red) before (left, p = 0.62 t-test and KS2-test; AD-test for normal distribution control p = 0.04) and following tetanic stimulation (right; p = 0.96 t-test; p = 1 KS2-test; n-values in bar graph apply to all panels Figure F: 8 animals and 10 neurons). (F2) Average mEPSC 10–90% decay time for control (black) and neurons treated with anisomycin (red) before (left; p = 0.94 t-test; p = 0.97 KS2-test) and following tetanic stimulation (right). (F3) Average mEPSC area for control (black) and neurons treated with anisomycin (red) before (left; p = 0.39 t-test; p = 0.67 KS2-test) and following tetanic stimulation (right; p = 0.48 t-test; p = 0.67 KS2-test).
-
Figure 4—source data 1
Anisomycin effects on spontaneous release, before and after tetanus.
- https://doi.org/10.7554/eLife.36697.010
Figure 5
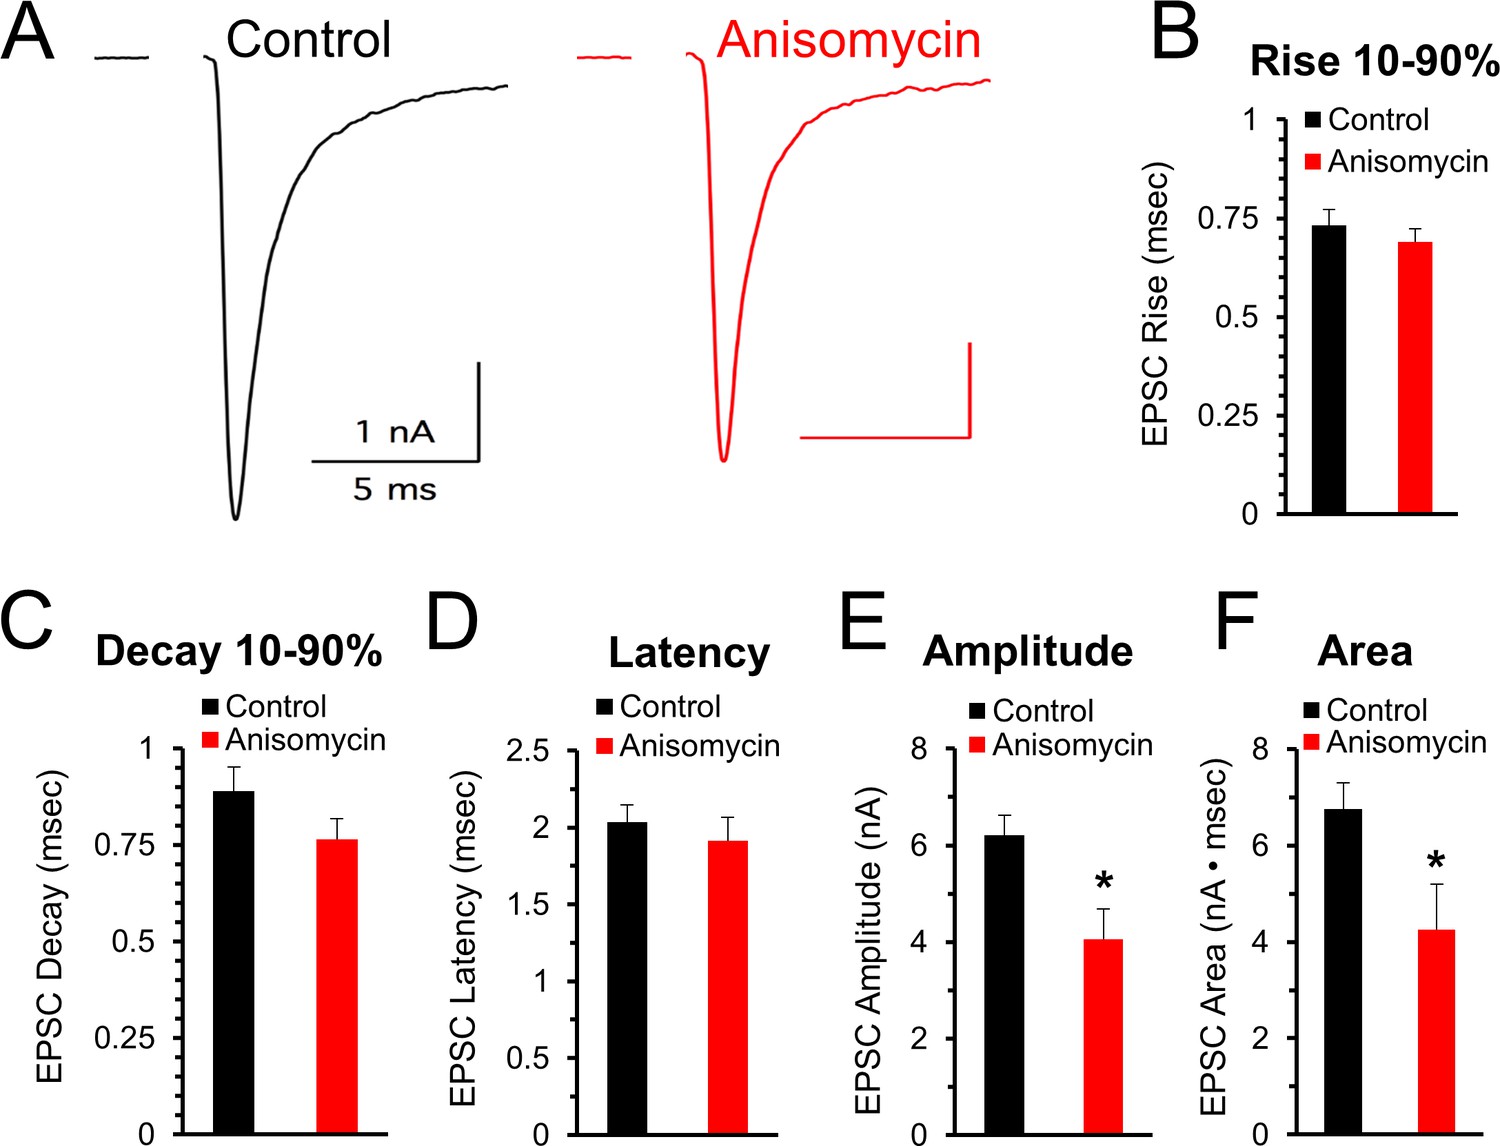
Initial evoked response timing and shape are not affected by inhibiting protein synthesis.
(A) Representative traces of evoked excitatory postsynaptic currents (EPSCs) for control (black) and neurons treated with anisomycin (red) from PN10 mice. For both traces, horizontal scale bar is 5 msec, vertical scale bar is 1 nA. (B) Average 10–90% evoked EPSC rise time for control (black) and anisomycin (red) treated neurons (p = 0.43 t-test; 0.96 KS2-test; n = 9 control, eight anisomycin). (C) Average 10–90% evoked EPSC decay time for control (black) and anisomycin (red) treated neurons (p = 0.15 t-test; 0.28 KS2-test; n = 9 control, eight anisomycin). (D) Average evoked EPSC latency for control (black) and anisomycin (red) treated neurons. (p = 0.52 t-test; 0.69 KS2-test; n = 9 control, eight anisomycin). (E) Average evoked EPSC amplitude, control (black) and anisomycin (red) treated neurons. (p = 0.01 t-test; 0.09 KS2-test; n = 9 control, eight anisomycin). (F) Average evoked EPSC area, control (black) and anisomycin (red) treated neurons (p = 0.02 t-test; 0.007 KS2-test; AD-test for normal distribution control p = 0.027; n = 9 control, eight anisomycin).
-
Figure 5—source data 1
Initial evoked release properties for anisomycin.
- https://doi.org/10.7554/eLife.36697.012
Figure 6 with 4 supplements
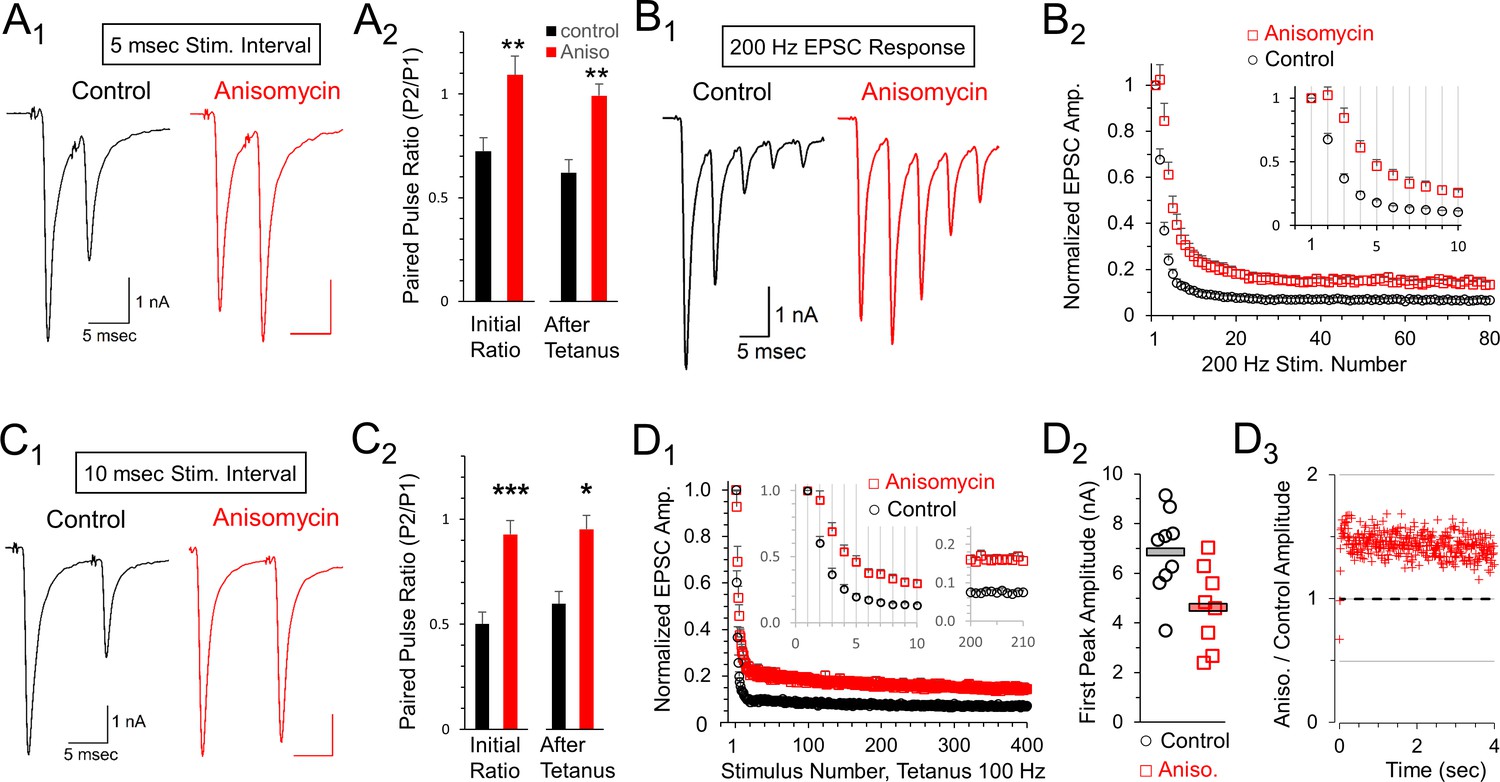
Reduced depression at 100 or 200 Hz after protein synthesis inhibition.
(A1) Representative traces of initial paired pulse responses, 5 msec interpulse interval (IPI). (A2) Initial paired pulse ratio (5 msec IPI) for control (black, n = 9) and anisomycin (red, n = 8) treatment (p = 0.004 t-test, 0.006 KS2-test), compared to the ratio after 100 Hz tetanic stimulation for 4 s (p = 0.001 t-test; p = 0.006 KS2-test; n = 7 control, six anisomycin). Average Rs values for control and anisomycin were ~4.8 MΩ and ~7.6 MΩ, respectively. (B1) Representative EPSC responses at 200 Hz stimulation for control and anisomycin. (B2) Average normalized EPSCs at 200 Hz stimulation for control and anisomycin treatment (p < 0.001 ANOVA). Average Rs values for control and anisomycin were ~4.8 MΩ and ~7.6 MΩ, respectively. (C1) Representative initial paired pulse responses at a 10 msec interpulse interval (IPI). (C2) Initial paired pulse ratio (10 msec IPI) for control (black, n = 8) and anisomycin (red, n = 8) treatment (p < 0.001 t-test; p = 0.0014 KS2-test), compared to the ratio (10 msec IPI) after tetanic stimulation at 100 Hz for 4 s (p < 0.016 t-test; p = 0.049 KS2-test). (D1) Average normalized EPSCs from 100 Hz tetanic stimulation in control and anisomycin treated neurons (p < 0.001 ANOVA). (D2) Amplitudes of first EPSC in tetanic stimulation response for each control neuron (black circles) and anisomycin (red squares) treated neurons (p < 0.015 t-test; p = 0.034 KS2-test). Horizontal bars correspond to the average responses. (D3) Ratio of 100 Hz EPSC responses from anisomycin and control neurons shows anisomycin treated neurons maintain a higher EPSC responses during sustained stimulation for 4 s.
-
Figure 6—source data 1
Paired pulse ratios and peak responses at 100 Hz and 200 Hz following anisomycin treatment.
- https://doi.org/10.7554/eLife.36697.020
Figure 6—figure supplement 1
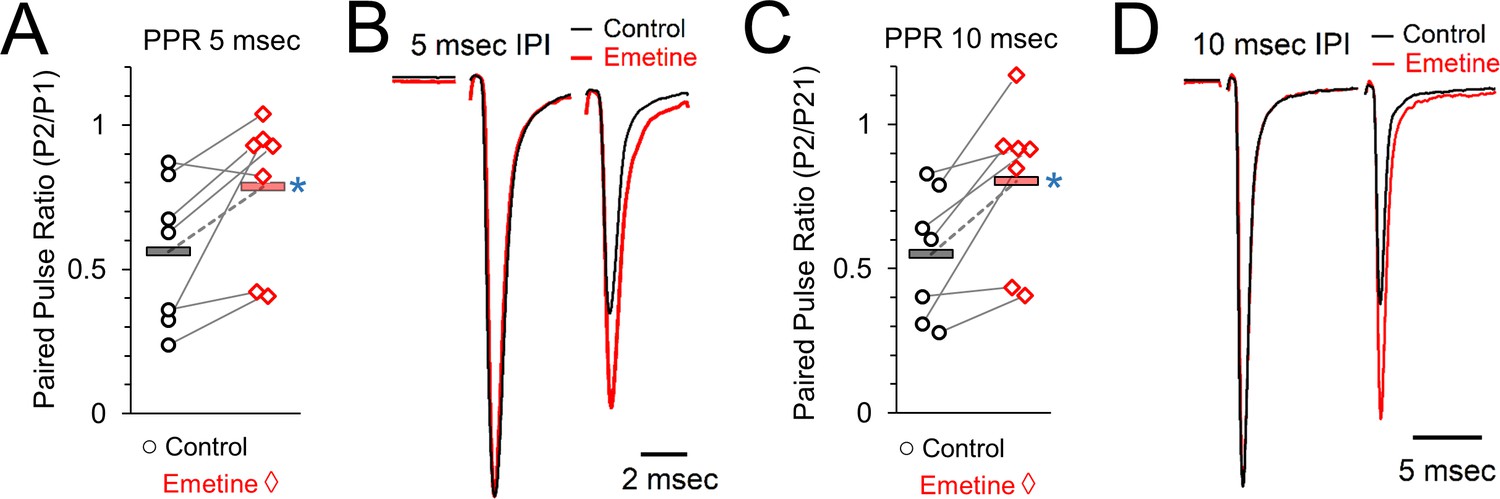
Paired pulse ratios (PPR) in control and after protein synthesis inhibition induced by emetine treatment.
(A) Paired pulse ratio at an interpulse interval of 5 msec, measured as the amplitude of the response to stimulation pulse 2 (P2) divided by the amplitude of the response to pulse 1 (P1). Grey lines connect the average responses for recordings done from the same set of brain slices under control (left, black) and protein synthesis inhibited conditions (emetine, right, red). Horizontal bars show the average responses. Blue star indicates a statistically significant difference in the average responses. (B) Representative traces showing responses to two stimuli at an interval of 5 msec in control (black) and protein synthesis inhibited (emetine, right) recordings from the same set of brain slices. (C) Paired pulse ratio at an interpulse interval of 10 msec, measured as the P2/P1 response ratio. Grey lines connect the average responses for recordings done from the same set of brain slices under control (left, black) and protein synthesis inhibited conditions (emetine, right, red). Horizontal bars show the average responses. Blue star indicates a statistically significant difference in the average responses. (D) Representative traces showing responses to two stimuli at an interval of 10 msec in control (black) and protein synthesis inhibited (emetine, right) recordings from the same set of brain slices.
-
Figure 6—figure supplement 1—source data 1
Emetine paired pulse ratios.
- https://doi.org/10.7554/eLife.36697.015
Figure 6—figure supplement 2
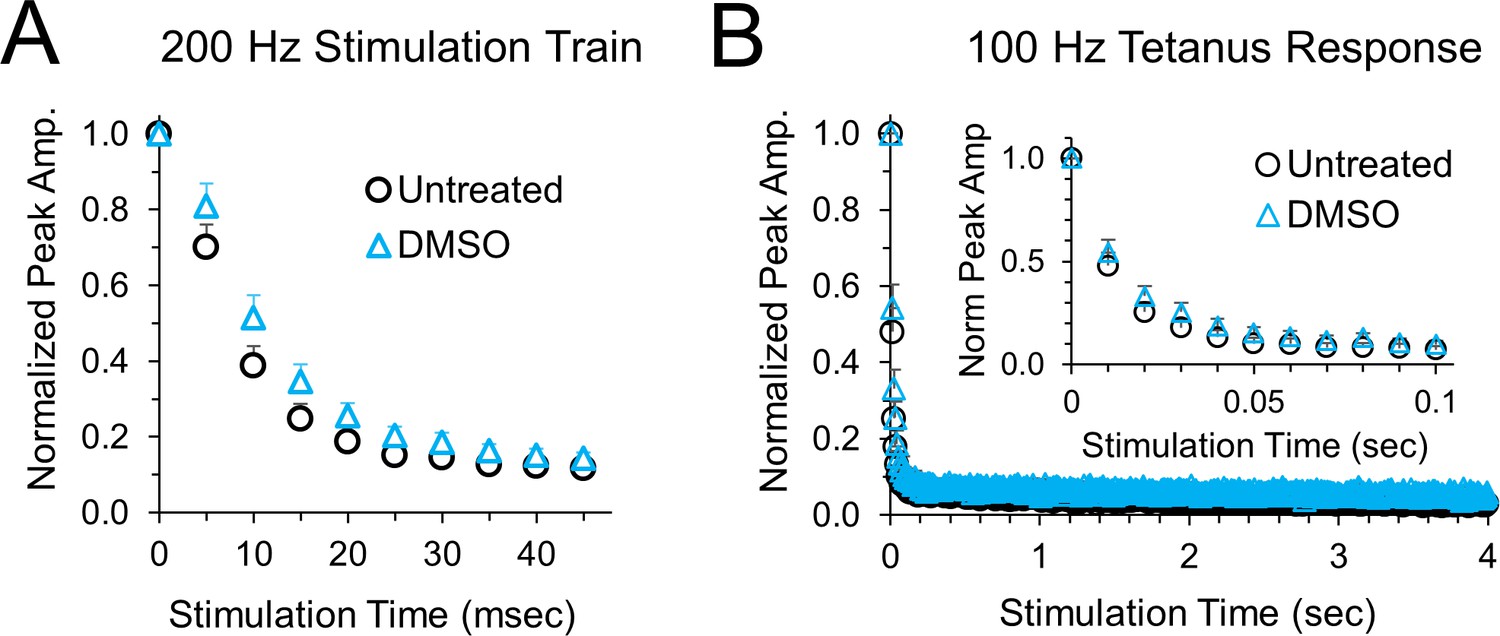
Peak amplitudes for blinded experiments for cells that were randomly treated with DMSO instead of anisomycin.
(A) Average normalized EPSCs at 200 Hz stimulation for untreated versus DMSO treatment for 1–2 hr, n = 6 control and 6 DMSO cells, p = 0.17 ANOVA. (B) Average normalized EPSCs at 100 Hz stimulation for untreated versus DMSO treatment for 1–2 hr. No significant difference was found between DMSO and untreated cells, n = 6 control and 6 DMSO cells, p = 0.49 ANOVA.
-
Figure 6—figure supplement 2—source data 1
DMSO peak amplitudes at 100 Hz and 200 Hz stimulation.
- https://doi.org/10.7554/eLife.36697.017
Figure 6—figure supplement 3
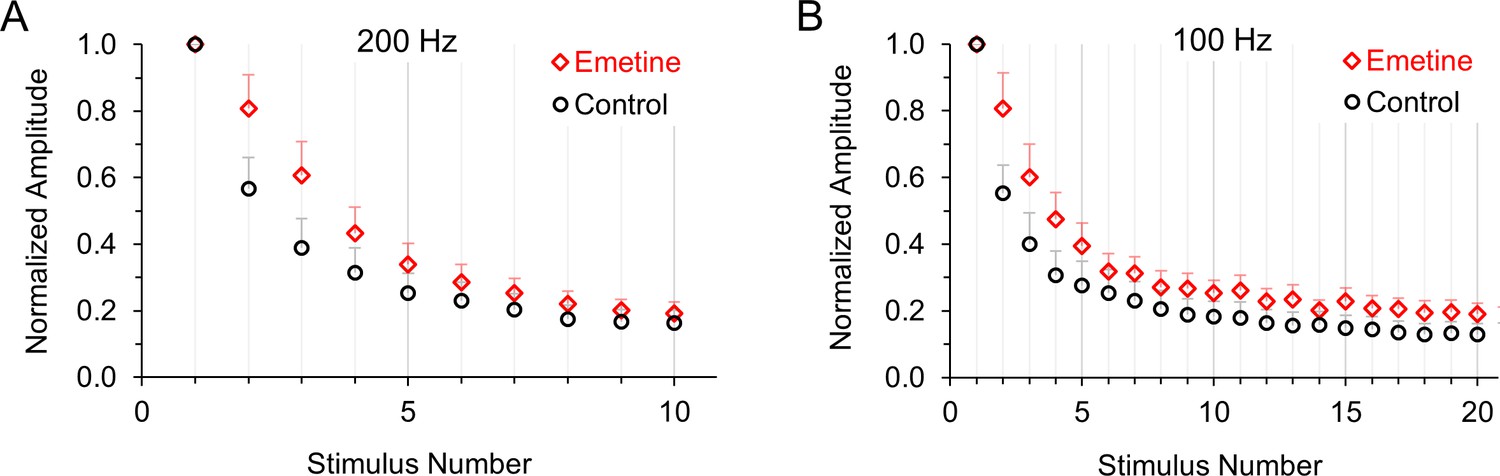
Normalized average excitatory postsynaptic currents in control neurons and neurons treated with emetine to inhibit protein synthesis.
(A) Average response to 200 Hz stimulation in control conditions (black) or after 1–2 hr of treatment with 20 μM emetine (red) to inhibit translation (p < 0.001 ANOVA). (B) Average response to 100 Hz stimulation in control conditions (black) or after 1–2 hr of treatment with 20 μM emetine (red) to inhibit translation (p < 0.001 ANOVA).
Figure 6—figure supplement 4
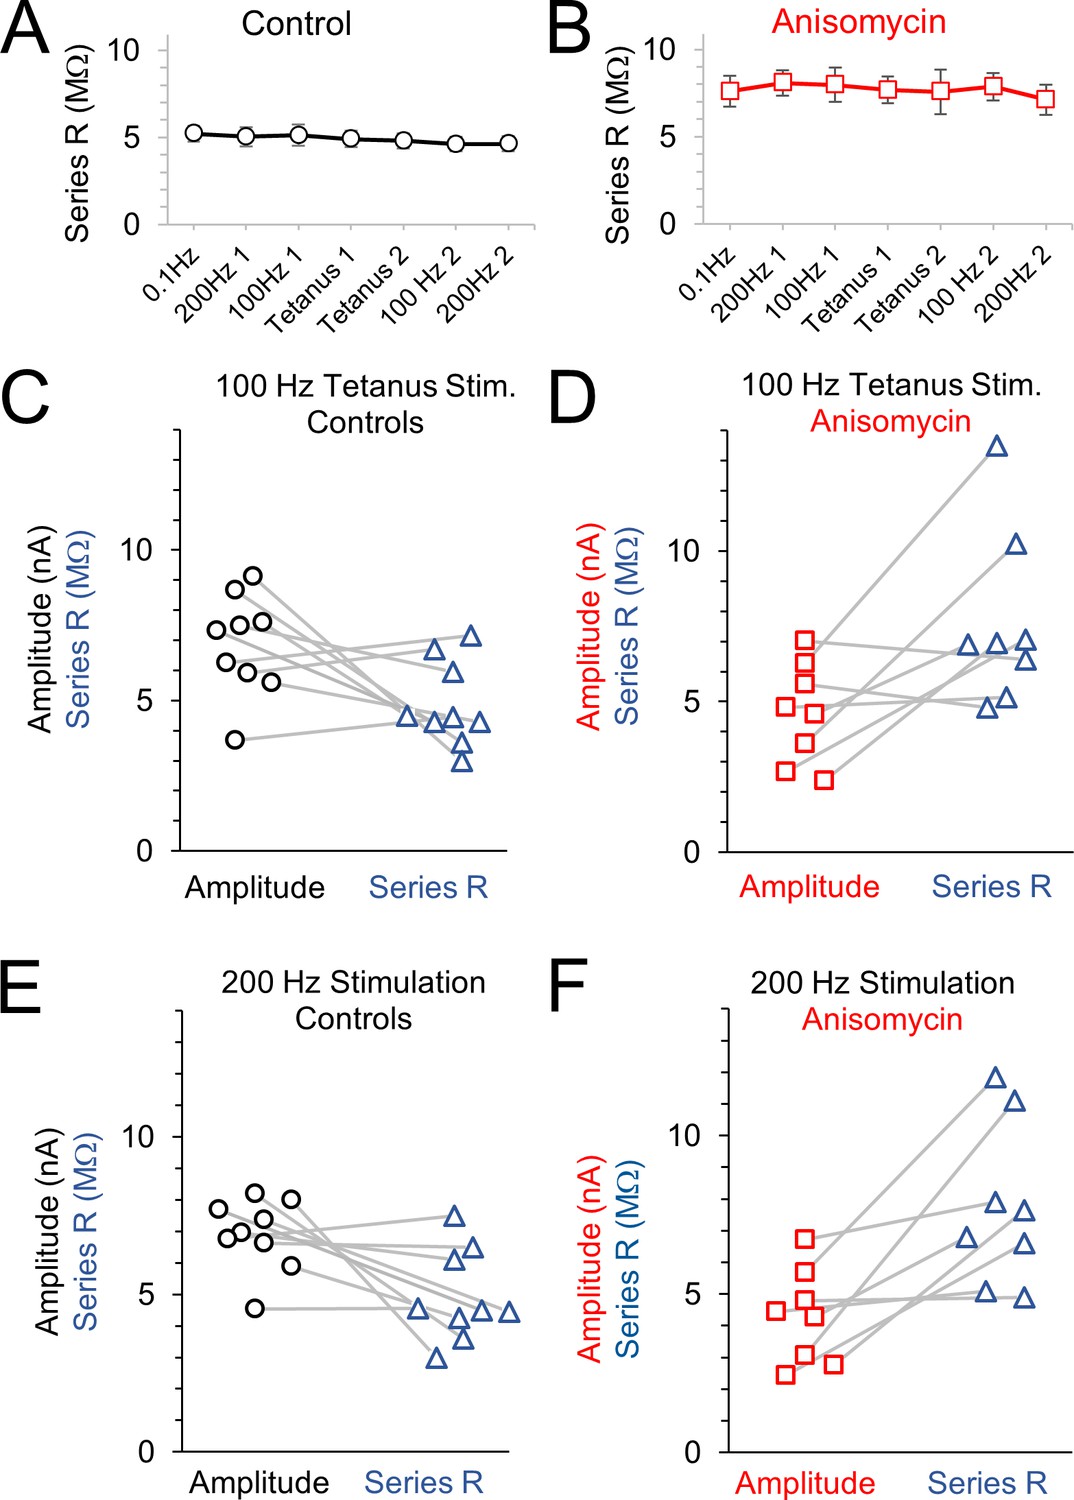
Amplitude and series resistance values during tetanus recordings.
(A) Average series resistance values throughout each recording for control cells; error bars are SEM values. (B) Average series resistance values throughout each recording for anisomycin treated cells; error bars are SEM values. (C) Amplitude and corresponding series resistance value for the 100 Hz tetanus recordings from control cells. Lines connect amplitude and corresponding series resistance for each cell. (D) Amplitude and corresponding series resistance value for the 100 Hz tetanus recordings from anisomycin treated cells. Lines connect amplitude and corresponding series resistance for each cell. (E) Amplitude and corresponding series resistance value for the 200 Hz recordings from control cells. Lines connect amplitude and corresponding series resistance for each cell. (F) Amplitude and corresponding series resistance value for the 200 Hz recordings from anisomycin treated cells. Lines connect amplitude and corresponding series resistance for each cell.
Figure 7 with 1 supplement
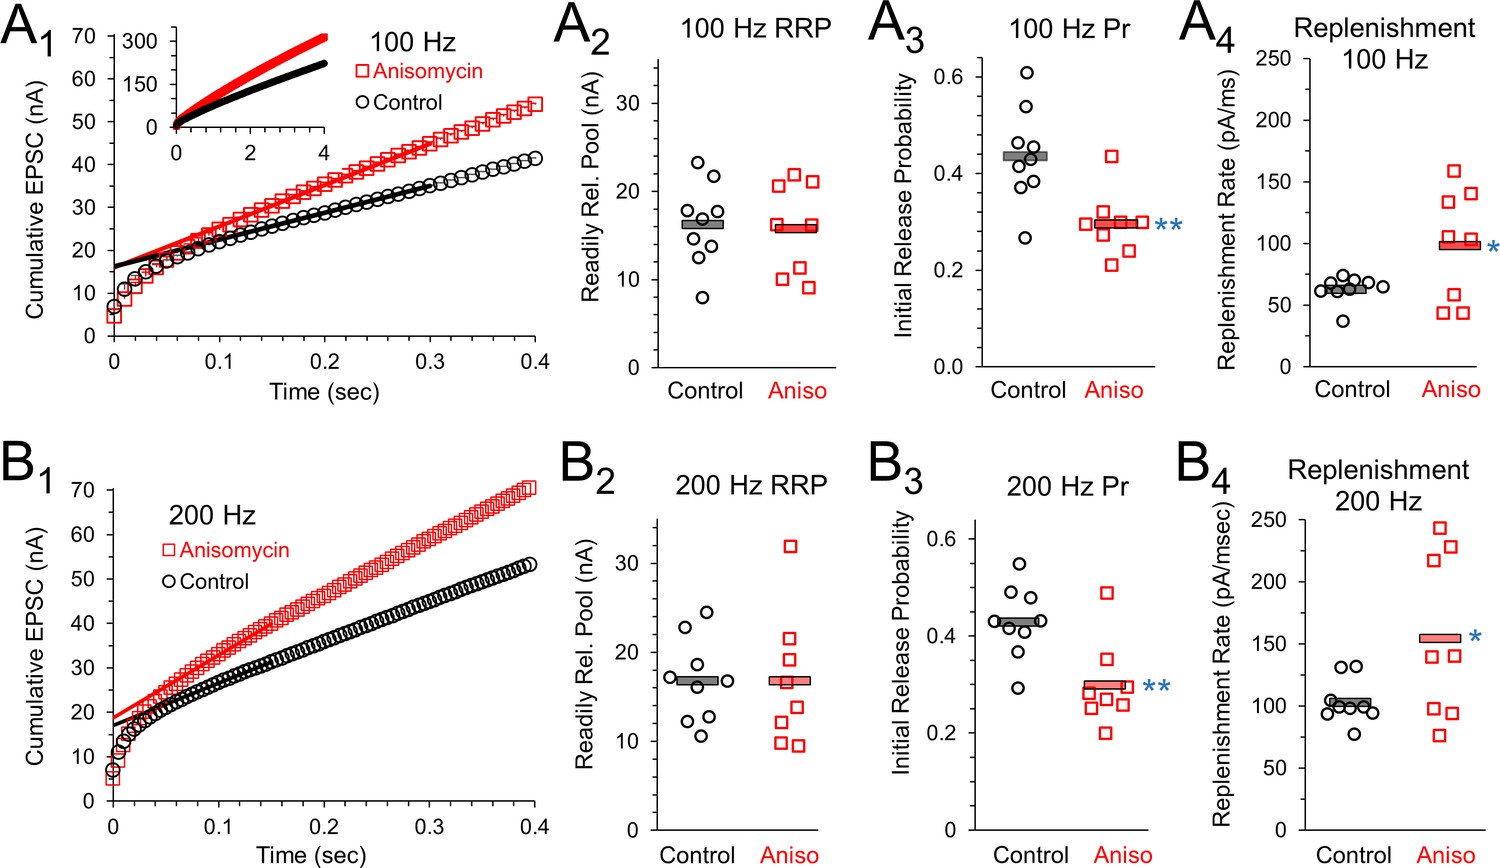
Initial release probability and vesicle release during sustained activity are affected by inhibiting protein synthesis.
(A1) 100 Hz Cumulative EPSC plot of averaged peak response in control (black) and protein synthesis inhibited (anisomycin, red) neurons. The y-intercept of a line fit to responses 20 to 30 measures the readily releasable pool (RRP). (A2) RRP measurement for each cell, during 100 Hz stim, measured as the y-intercept of a best fit line through responses 20 to 30, for the beginning of the steady state response. (A3) The initial probability of release (Pr1) for 100 Hz trains, measured as the ratio of the amplitude of the first EPSC to the RRP. Averages shown by horizontal bars. (A4) Rate of vesicle replenishment during steady state response during 100 Hz stimulation, measured as the slope of a best fit line through responses 20 to 30, separately measured for each cell. (B1) 200 Hz Cumulative EPSC plot of averaged peak response in control and protein synthesis inhibited (anisomycin) neurons. The y-intercept of a line fit to responses 20 to 30 measures the readily releasable pool (RRP). (B2) RRP measurement for each cell, during 200 Hz stim, measured as the y-intercept of a best fit line through responses 20 to 30, for the beginning of the steady state response. (B3) The initial probability of release (Pr1) measured during 200 Hz trains, measured as the ratio of the amplitude of the first EPSC to the RRP. Averages shown by horizontal bars. (B4) Rate of vesicle replenishment during the steady state response during 200 Hz stimulation, measured as the slope of a best fit line through responses 20 to 30, separately measured for each cell.
-
Figure 7—source data 1
Vesicle replenishment, initial release probability, and readily releasable pool following anisomycin treatment.
- https://doi.org/10.7554/eLife.36697.024
Figure 7—figure supplement 1
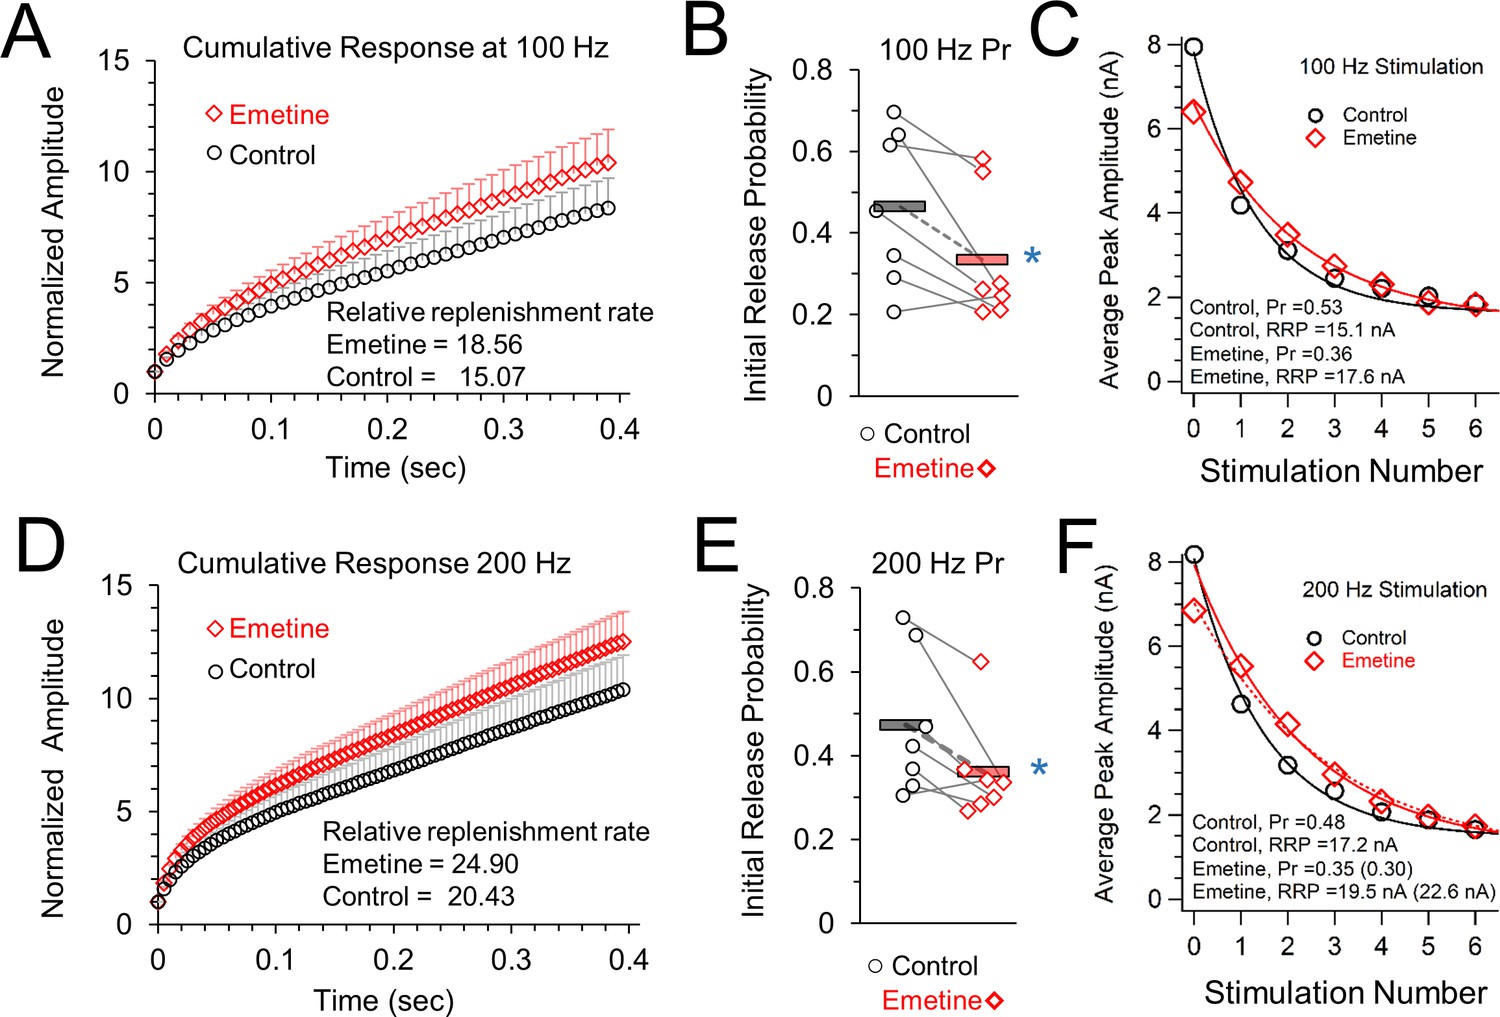
Vesicle release properties after inhibiting protein synthesis by treatment with emetine.
(A) 100 Hz Cumulative EPSC plot of averaged peak response for control (black) and protein synthesis inhibited (emetine, red) conditions. (B) The initial probability of release (Pr1) for 100 Hz trains, measured as the ratio of the amplitude of the first EPSC to the RRP. Grey lines connect the average responses for recordings done on the same day under control (left, black) and emetine treated (right, red) conditions. Horizontal bars show the average response. Blue star indicates a statistically significant difference in the average responses. (C) Exponential fit of the average control (black) and emetine (red) responses to measure probability of release (Pr) and readily releasable pool (RRP). (D) 200 Hz Cumulative EPSC plot of averaged peak response for control (black) and protein synthesis inhibited (emetine, red) conditions. (E) The initial probability of release (Pr1) for 200 Hz trains, measured as the ratio of the amplitude of the first EPSC to the RRP. Grey lines connect the average responses for recordings done on the same day under control (left, black) and emetine treated (right, red) conditions. Horizontal bars show the average response. Blue star indicates a statistically significant difference in the average responses. (F) Exponential fit of the average control (black) and emetine (red) responses to measure probability of release (Pr) and readily releasable pool (RRP).
-
Figure 7—figure supplement 1—source data 1
Relative replenishment, initial release probability, and readily releasable pool following emetine treatment .
- https://doi.org/10.7554/eLife.36697.023
Additional files
-
Transparent reporting form
- https://doi.org/10.7554/eLife.36697.025
Download links
A two-part list of links to download the article, or parts of the article, in various formats.
Downloads (link to download the article as PDF)
Open citations (links to open the citations from this article in various online reference manager services)
Cite this article (links to download the citations from this article in formats compatible with various reference manager tools)
Active presynaptic ribosomes in the mammalian brain, and altered transmitter release after protein synthesis inhibition
eLife 7:e36697.
https://doi.org/10.7554/eLife.36697


