Structure of the CLC-1 chloride channel from Homo sapiens
- Howard Hughes Medical Institute, The Rockefeller University, United States
Figures
Figure 1
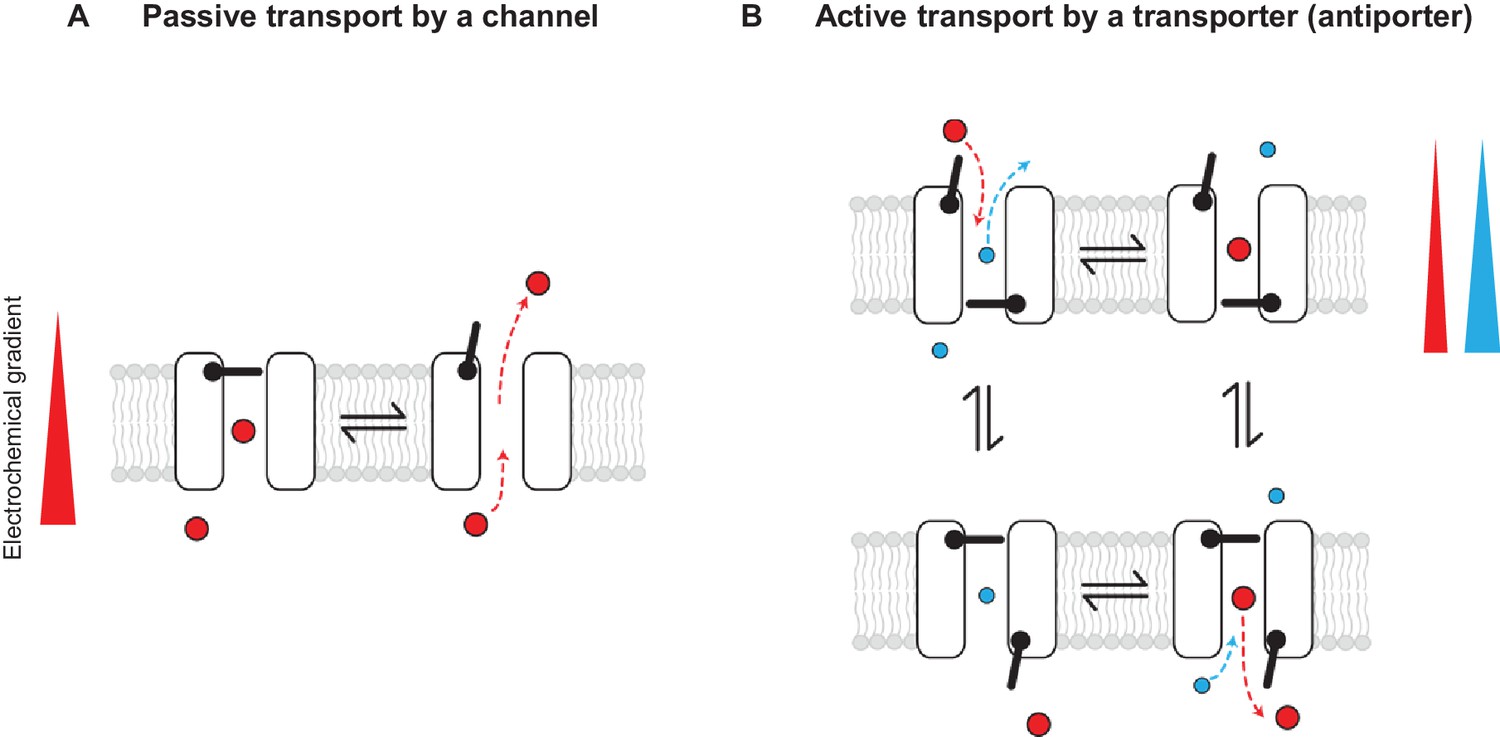
Passive and active transport explained by gating mechanisms.
One-gate (A) and two-gate (B) models explaining passive transport by a channel and active transport by a transporter (shown is an antiporter). Direction of the solute electrochemical gradient is indicated by a wedge (the thicker end means more positive).
Figure 2 with 2 supplements
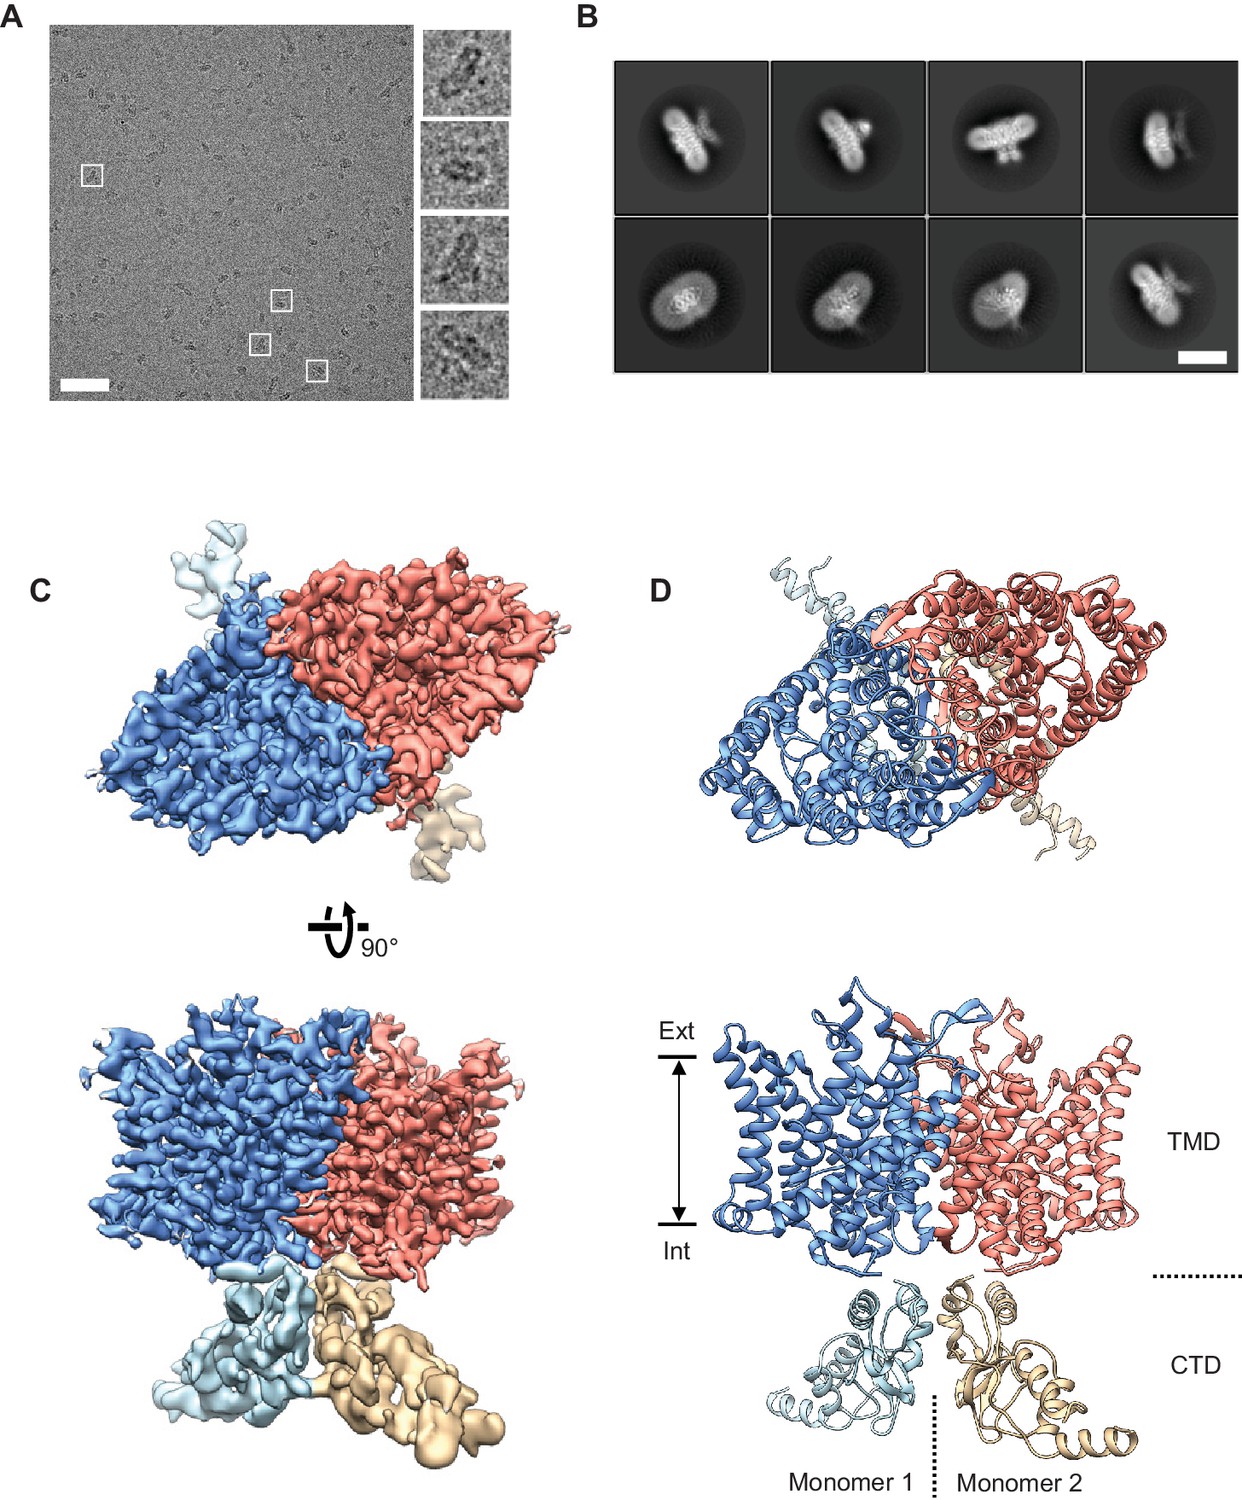
Cryo-EM structure of the human CLC-1 channel.
(A) Representative micrograph of the purified CLC-1 channel (scale bar, 50 nm) on a cryo-EM grid. Representative particles (white squares) are magnified and shown in the right panels. (B) Images of selected 2D classes from reference-free 2D classification by RELION. Scale bar, 10 nm. (C and D) Cryo-EM density map (C) and atomic model (D) of the hCLC-1 channel. The transmembrane domain (TMD; blue and salmon) and the cytosolic domain (CTD; light blue and tan) were separately refined and combined for visualization. Ext, extracellular side. Int, intracellular side. The approximate lipid bilayer region is shown by arrows.
Figure 2—figure supplement 1
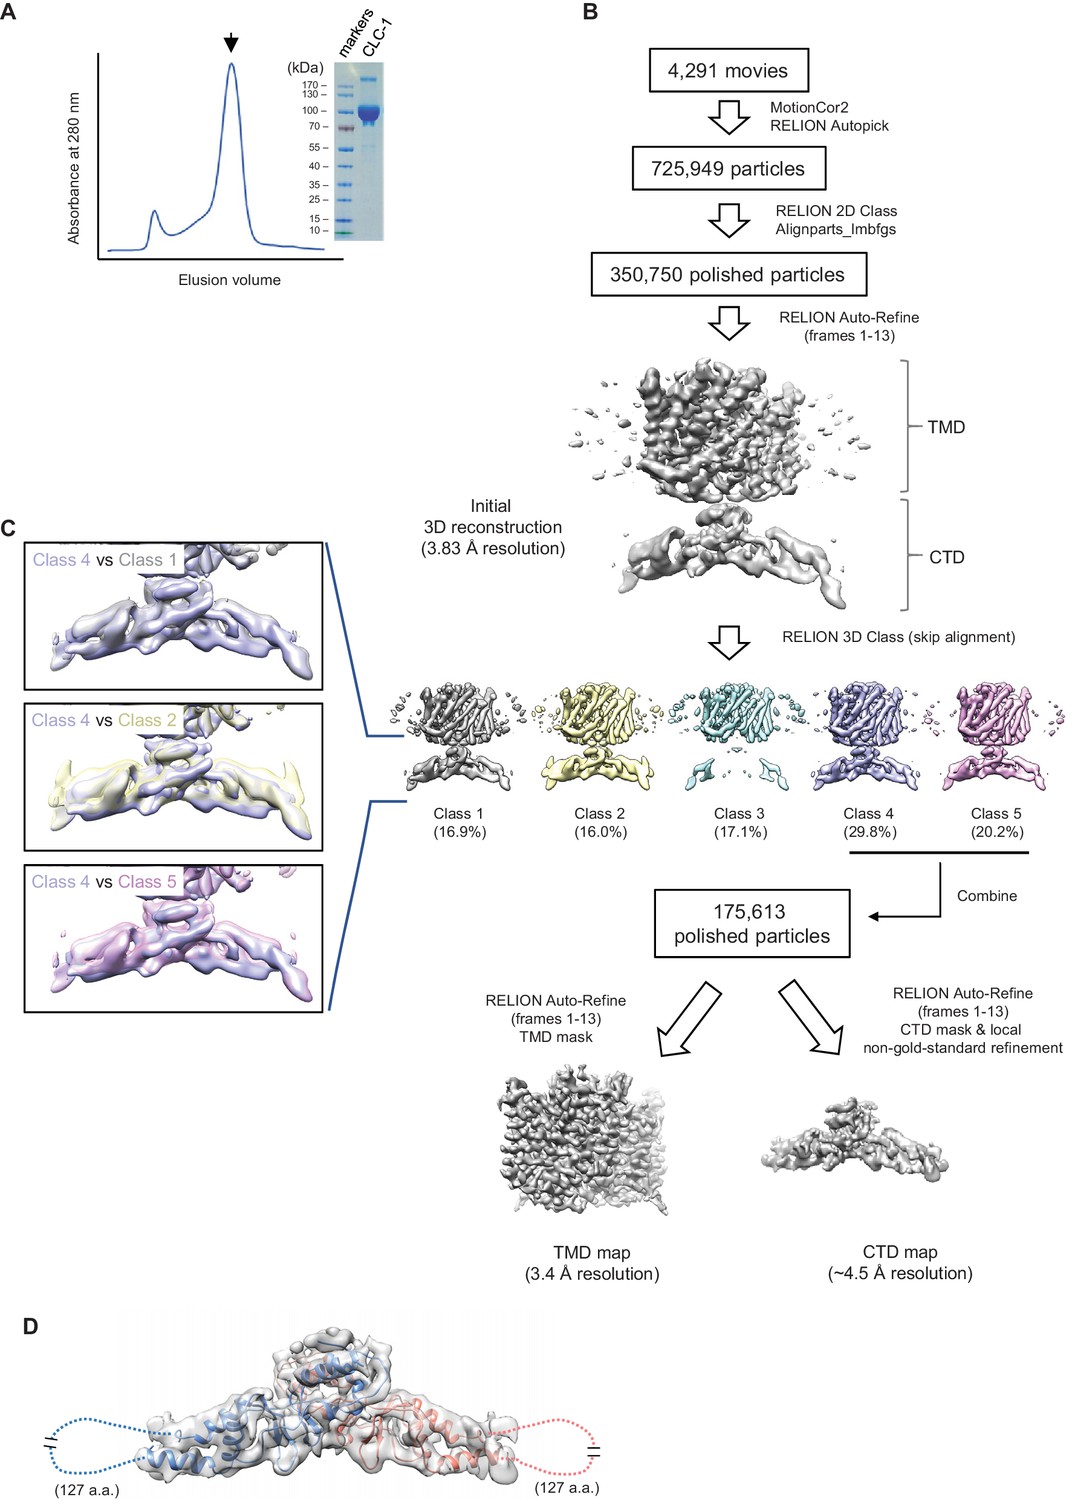
Sample preparation and cryo-EM image processing procedures.
(A) Superdex-200 gel-filtration profile (UV absorbance at 280 nm) of affinity purified human CLC-1. Peak fractions (arrowhead) were collected for cryo-EM grid preparation and SDS-PAGE analysis (right). (B) Summary of cryo-EM image processing procedure (see the Methods section). (C) Classes indicated were aligned and superimposed to compare their CTD density. Note that there are significant mismatches between classes mainly due to pivotal movements of the two arms. (D) A model for CTD was generated by Rosetta using a crystal structure of the CLC-0 CBS domains and the CLC-1 density map. The model was superimposed (blue and salmon for each monomer) onto the CBS density map (semi-transparent gray surface). Note that density for a segment of ~127 amino acids is missing likely due to flexibility of the segment.
Figure 2—figure supplement 2

Quality of the cryo-EM map and atomic model of CLC-1.
(A) Local resolution was estimated by the RELION program (relion_postprocess) and displayed on the TMD map. Shown is the combined map (a sum of two half maps), which is not sharpened or filtered. Top, a view from the extracellular side. Bottom, a side view. (B) Fourier shell correlation (FSC) of two half maps before (black) and after (red) masking for TMD. The masked FSC curve was corrected for masking effects during the RELION postprocessing procedure. Correlation between the map and the phase-randomized mask is shown as a black dashed line. (C) FSC between the atomic model and EM maps of the CLC-1 TMD. The red curve shows the FSC between the final refined atomic model and the combined map that the model was refined against (FSCfull). To test potential overfitting during the model refinement procedure, a test refinement was performed using the first half map. The resulting model was then compared to the first half map (FSCwork; solid black curve) and the second half map (FSCfree; dashed black curve). Similarity of the two curves indicates that overfitting is insignificant. (D) Segments of the TMD model in stick representation were superimposed with EM density (semi-transparent gray surface). Numbers indicate amino acid positions of segments. The density map was sharpened with a B-factor of −97 Å2 and low-pass filtered at 3.4 Å.
Figure 3 with 1 supplement
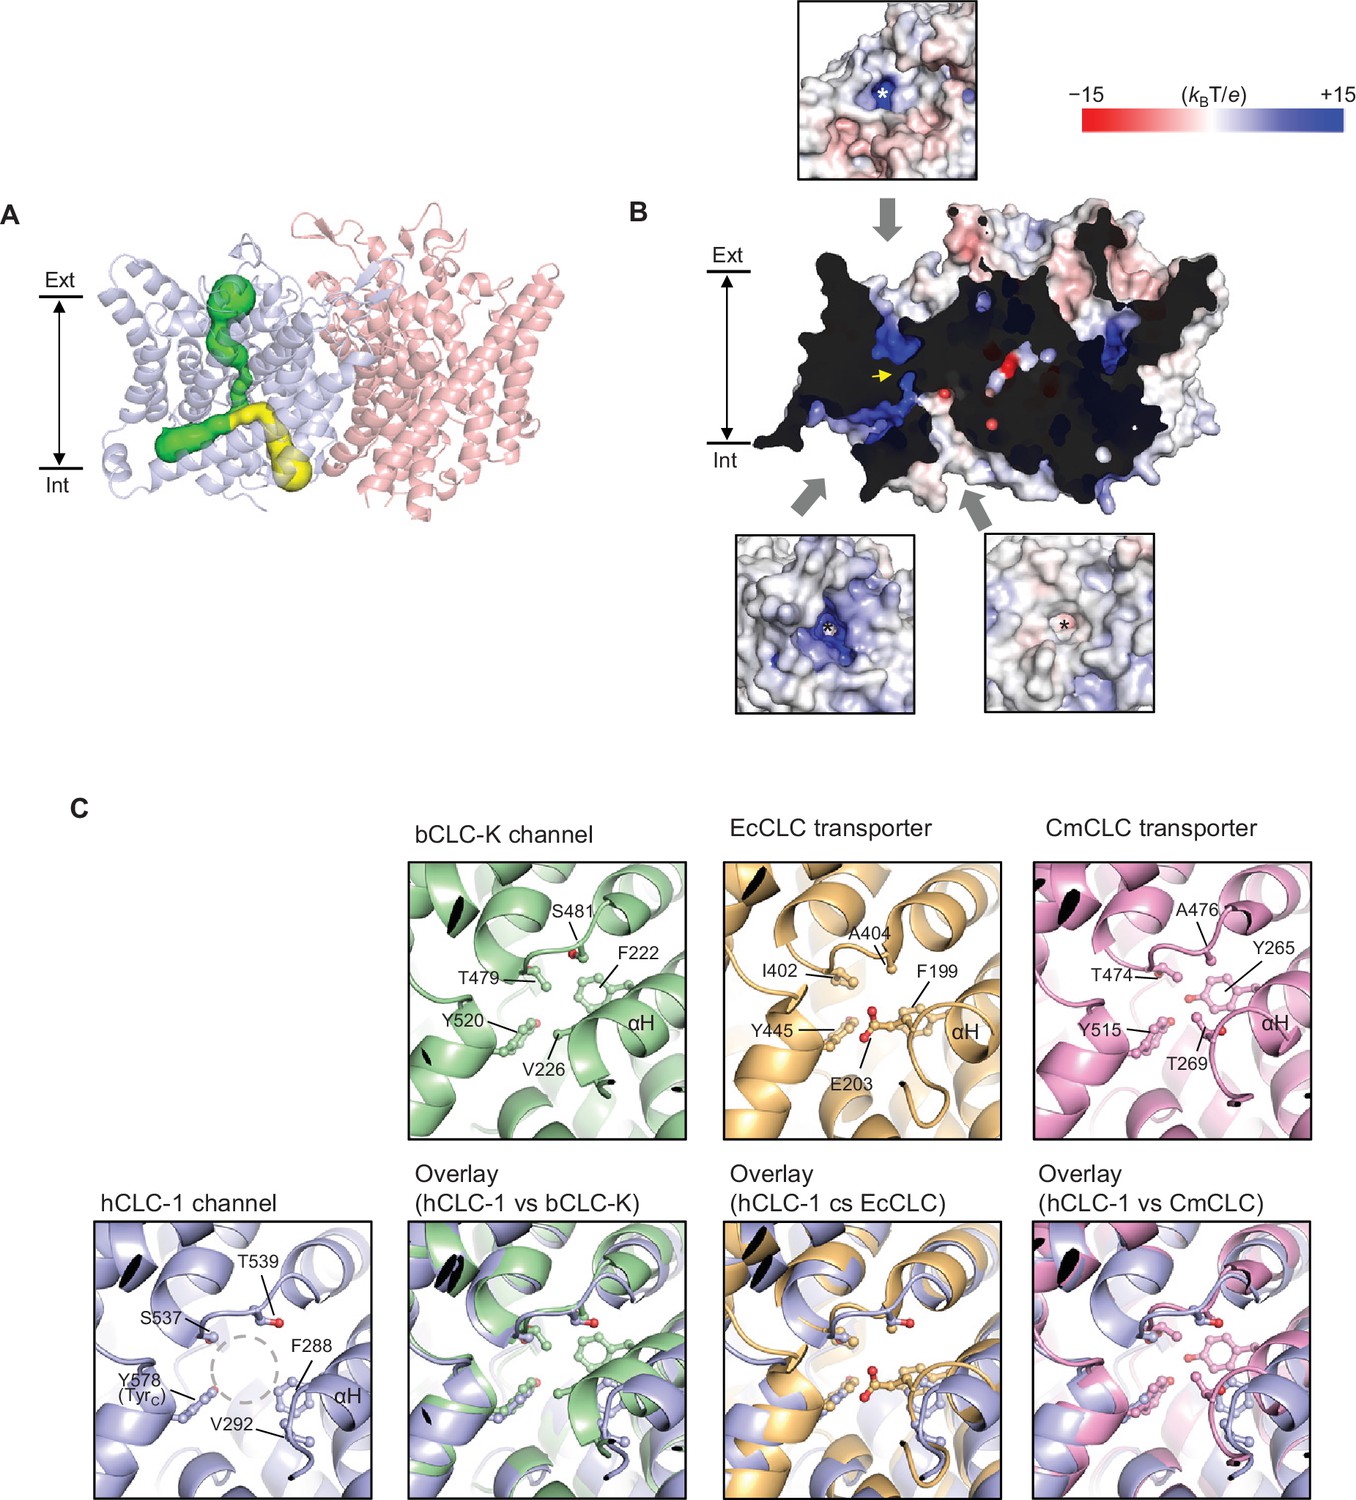
Bifurcated pore structure of the CLC-1 channel.
(A) The canonical Cl− transport pathway (green) and the second intracellular pore (yellow) are depicted in a side view of CLC-1. The pores of only one monomer are shown for simplicity. (B) Surface electrostatistics of CLC-1’s pore lining. The protein surface was clipped to show optimally the pore lining of the CLC-1 monomer on the left. The yellow arrowhead indicates the position of the selectivity filter. The insets show views into the pore entrances, which are marked with asterisks. (C) A view into the second intracellular pore entrance from the cytosolic surface was compared to equivalent views with other CLC proteins. In the CLC-1 panel, the pore is indicated by a dashed gray circle. Amino acids lining the pore were indicated with their side chain atoms shown in ball-and-stick representation.
Figure 3—figure supplement 1

Comparison of the second intracellular pore among CLC proteins.
(A) and (B) As in Figure 2A, pores in the protein interior were detected in EcCLC (A) and CmCLC (B) transporters using the Caver program. The canonical Cl− transport pathway and the second intracellular pore are shown as green and yellow surfaces, respectively, superimposed on ribbon representations of the proteins (side view). For simplicity, pores of only one monomer (blue) are shown. Note that the second intracellular pore (minimal radius larger than 0.9 Å) could be detected only with the E203 mutant of the EcCLC and wild-type CmCLC transporters, not with the wild-type EcCLC or the bovine CLC-K channel (not shown). (C) The pore radii are displayed as a color map. The second intracellular pore is indicated by a red asterisk. The view angle is similar to (A) and (B).
Figure 4 with 1 supplement
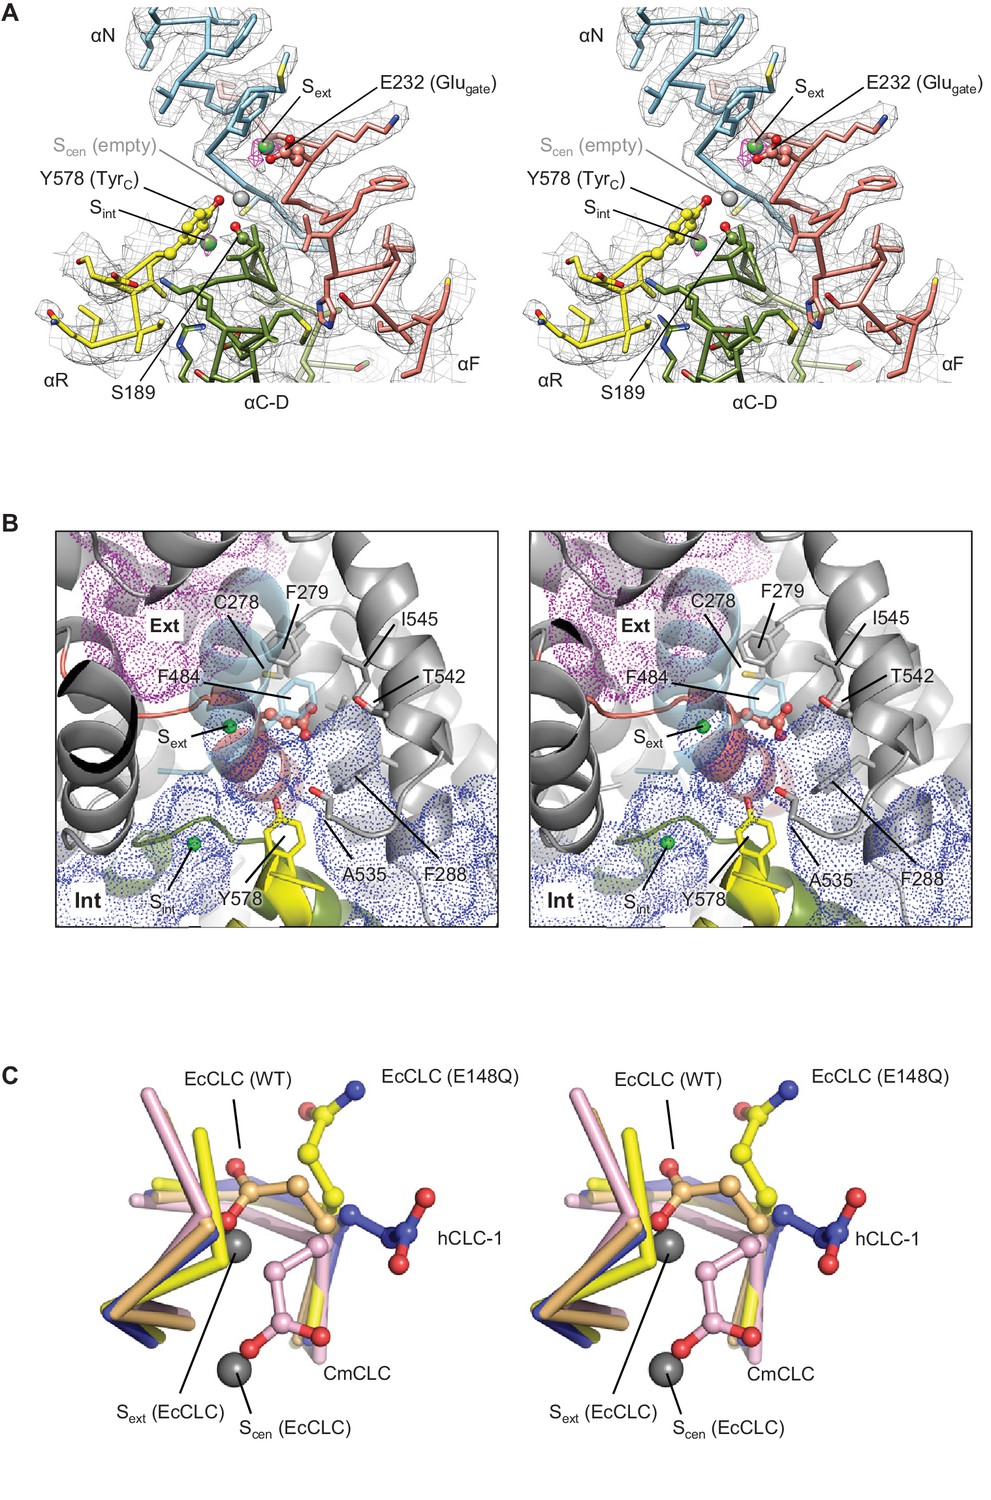
Glutamate gate (Glugate) and Cl−-binding sites of CLC-1.
(A) View (stereo) into the selectivity filter of CLC-1. αN, αF, αR, and αC-D segments (Cα trace and side chains) are shown in cyan, salmon, yellow, and olive, respectively. The side chains of Glugate, TyrC, and SerC are represented with balls and sticks. Cl−-binding sites are indicated by green (Sext and Sint) and gray (Scen) spheres. The cryo-EM density map is shown in mesh (Sext and Sint in magenta and the rest in gray). (B) Water-accessible regions in the filter region, probed by Hollow (Ho and Gruswitz, 2008), are shown with purple (extracellular vestibule) and blue (intracellular vestibule) dots. Glugate is represented in ball-and-stick. (C) Comparison of Glugate positions between the CLC-1 channel and CLC transporters. The amino acid segments 146–149 and 355–358 forming the anion selectivity filter were aligned between structures. Cα-traces of the segments are shown with the Glugate side chains in ball-and-stick representation. Blue, CLC-1. Light orange, WT EcCLC (PDB ID: 1OTS). Yellow, EcCLC E148Q mutant (PDB ID: 1OTU). Magenta, CmCLC (PDB ID: 3ORG). Gray spheres represent the positions of Cl− ions seen in EcCLC E148Q mutant (Sext and Scen). Note that the Cl− ion at CLC-1’s Sext (not shown) essentially coincides with Sext of EcCLC.
Figure 4—figure supplement 1
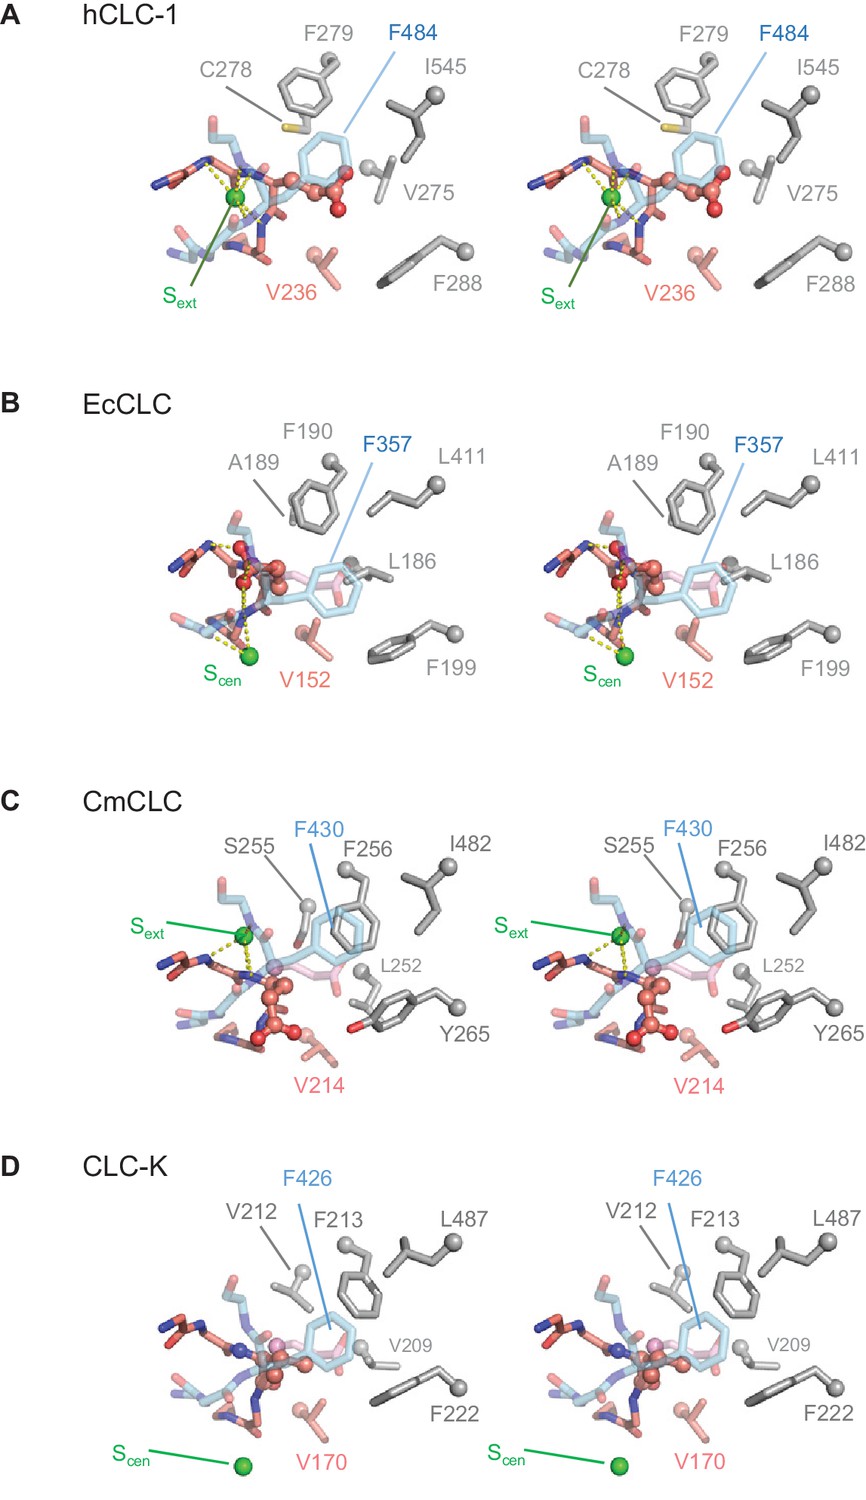
Comparison of the anion selectivity filter and Glugate between CLC proteins.
(A–D) As in Figure 3B, but focused on Glugate and neighboring hydrophobic amino acids (stereo views with the same view angle). (B–D) also include superimposed Glugate of CLC-1 in pink semi-transparent sticks, to show steric clashes with neighboring hydrophobic amino acid side chains of other CLC proteins. The green spheres indicate the position of Sext or Scen. Note that in the EcCLC and CmCLC structures, Glugate’s side chain occupies Sext and Scen, respectively, and in the bCLC-K, Sext is unoccupied.
Figure 5
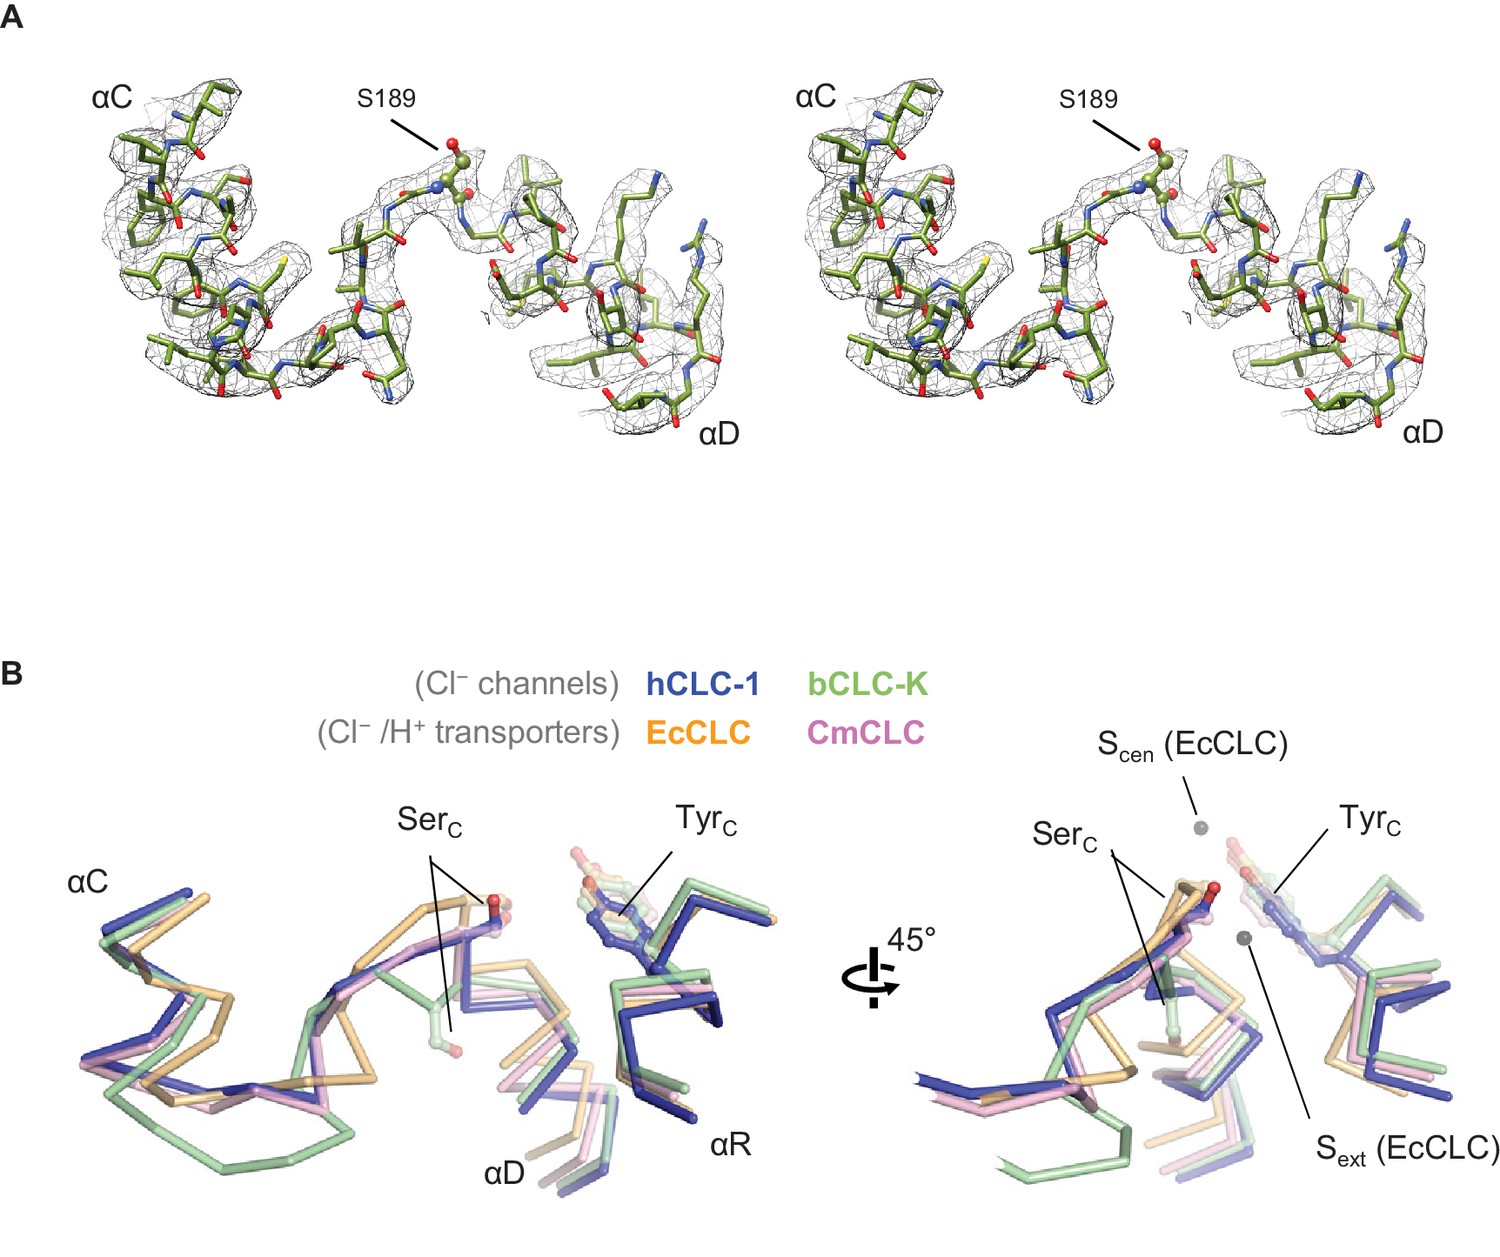
Structure of the αC-D loop and SerC.
(A) Atomic model and cryo-EM density of the CLC-1 αC-D. (B) Comparison of the αC-D and αR segments (shown in Cα-only trace) among CLC channels and transporters. The side chains of SerC and TyrC are shown in sticks.
Figure 6 with 1 supplement
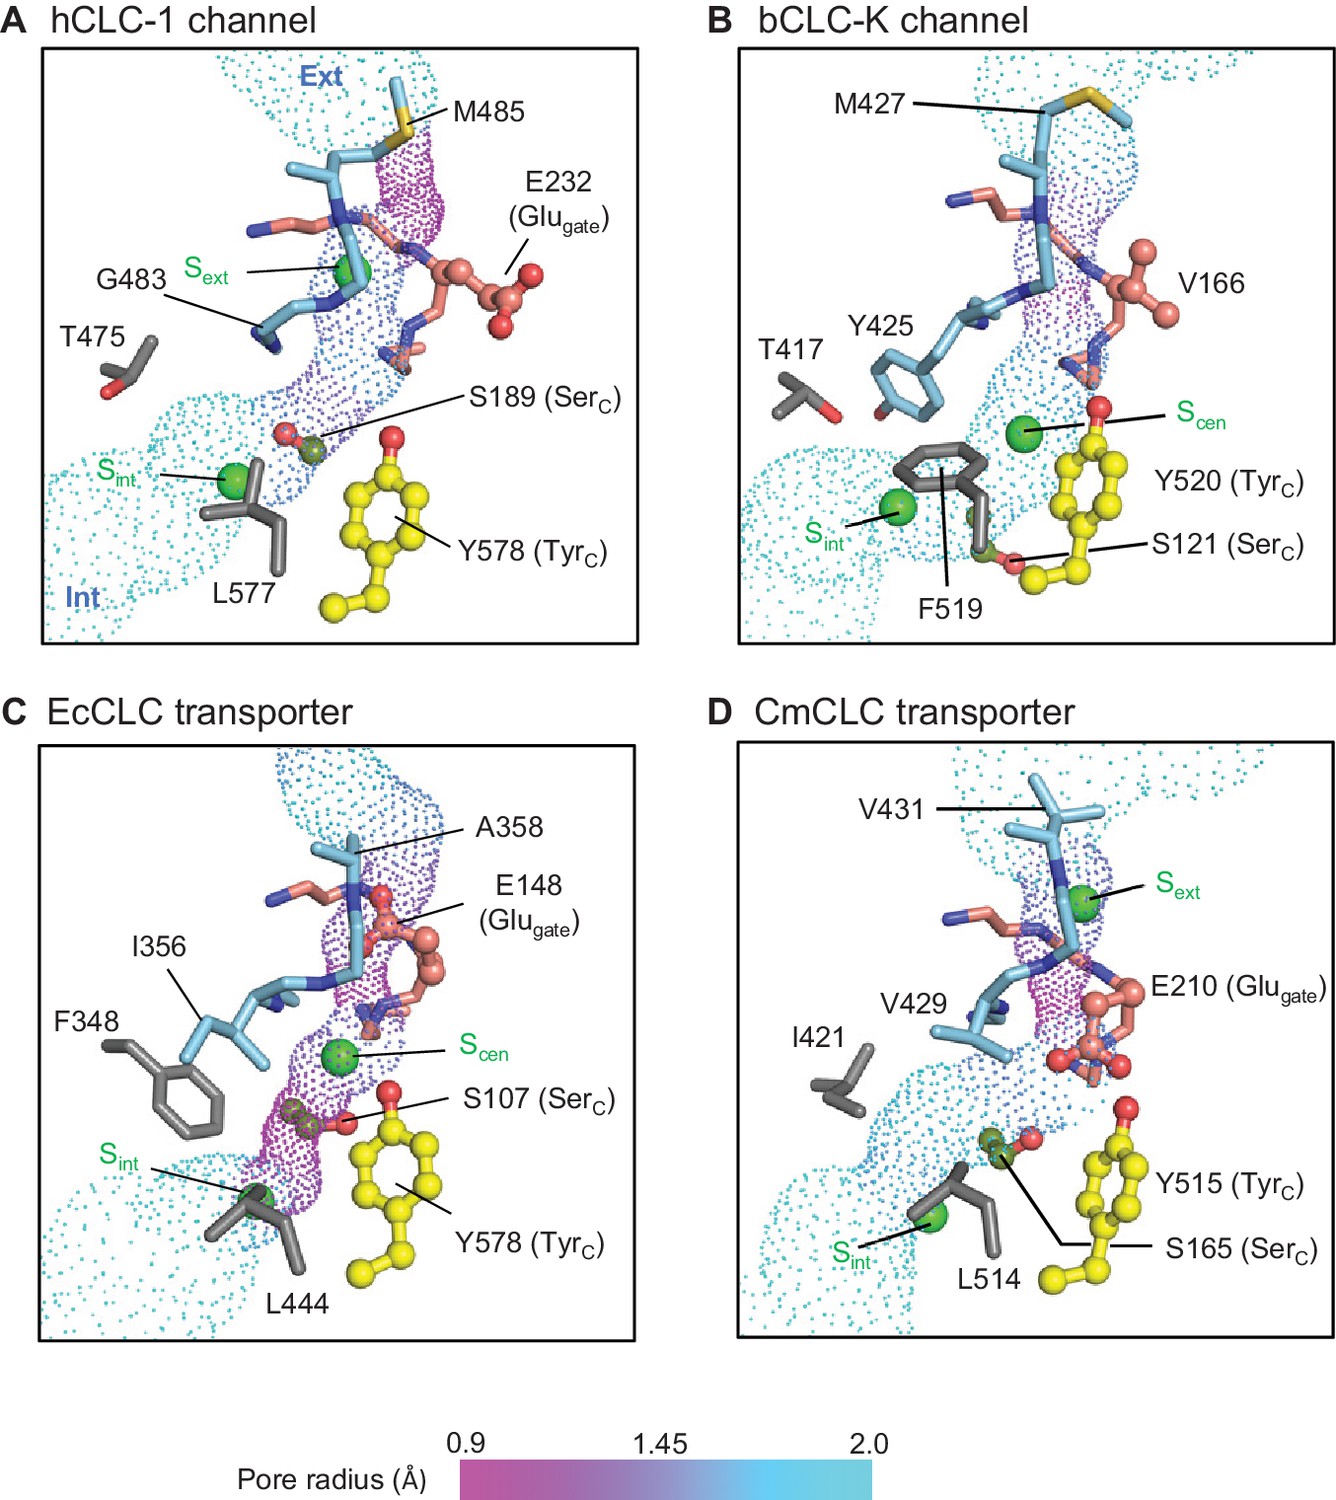
Profile of the Cl− transport pore and the kinetic barrier between Scen and Sint.
Pore structures along the Cl− pathway are shown in dot representation together with amino acids around it. Glugate, TyrC, and SerC side chains are shown in ball-and-stick representation. The color scheme is the same as in Figure 4. Pore-lining amino acids that are distinctive between CLC channels and transporters are shown in gray.
Figure 6—figure supplement 1
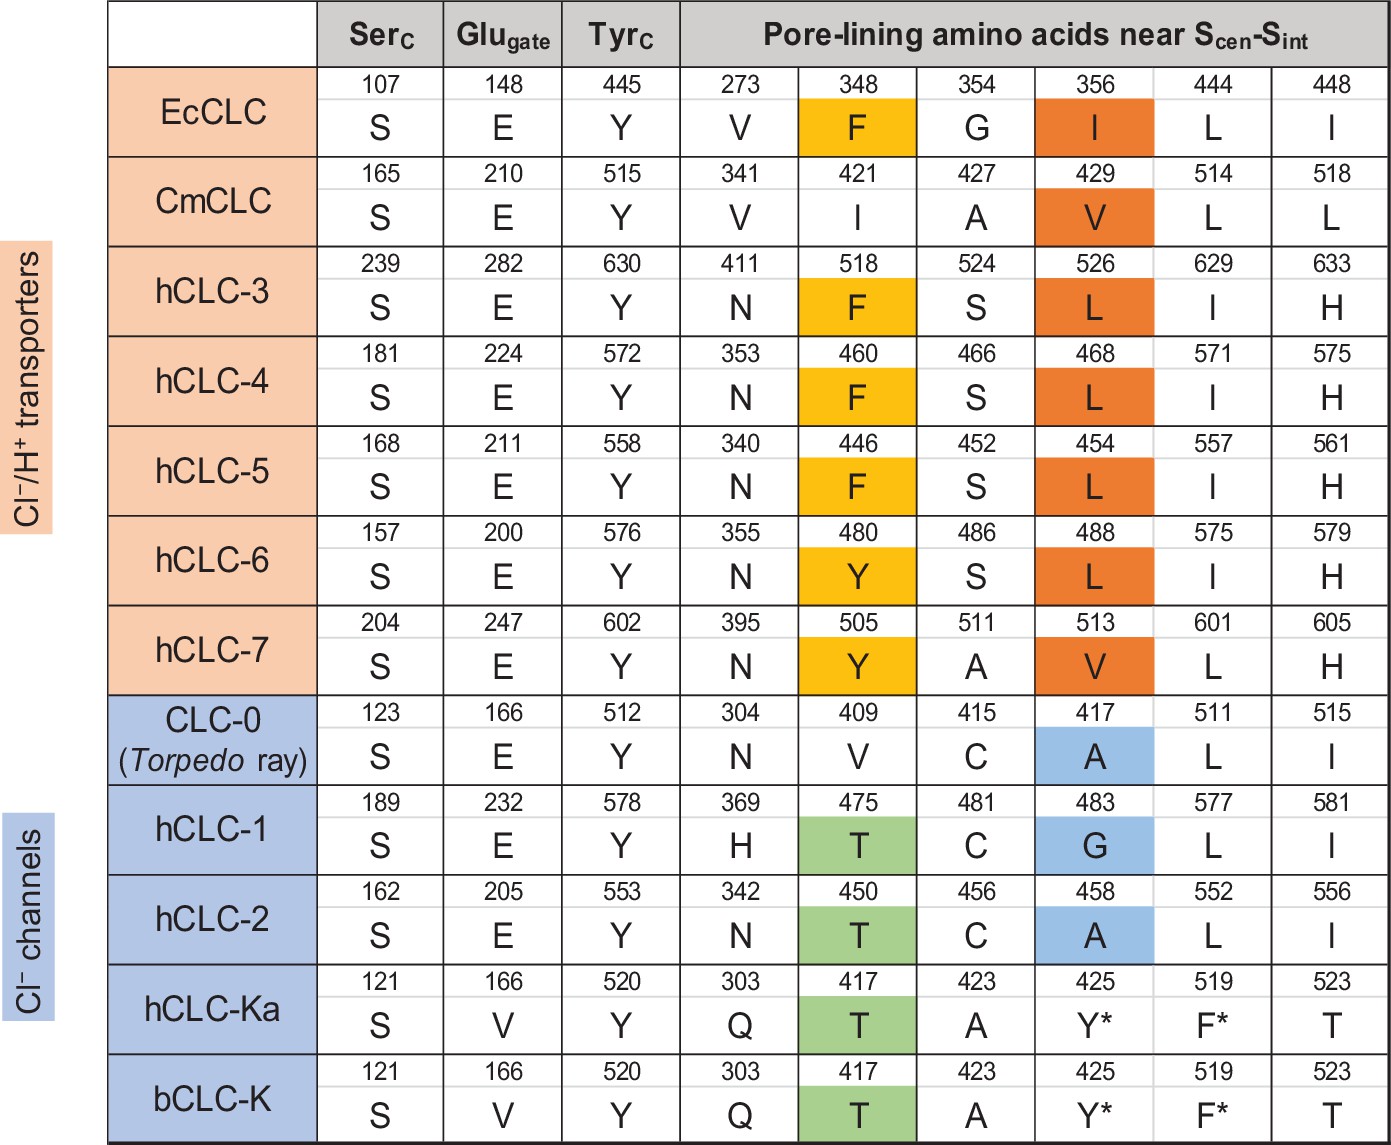
Sequence comparison of selected amino acids forming the ion selectivity filter and the pore lining.
Amino acids and their positions (numbers) of selected residues in the filter and pore lining are indicated. For transporters, E. coli CLC (EcCLC), C. merolae CLC (CmCLC), and human CLC transporters (hCLC-3 to hCLC-7) were selected. For channels, Torpedo marmorata CLC-0, human CLC channels (hCLC-1, hCLC-2, and hCLC-Ka), and bovine CLC-K (bCLC-K) channel were included. Amino acids showing a pattern distinguishing channels and transporters were highlighted (positions 348 and 356 in EcCLC). Note that in hCLC-Ka and bCLC-K, the side chains of tyrosine and phenylalanine, denoted by an asterisk, are involved in binding of a Cl− ion at Scen by quadrupole-anion interactions (see Figure 6D).
Figure 7

Models for ion transport mechanisms of CLC transporters and channels.
(A) General architecture of CLC proteins. F348 and I356 are labelled according to E. coli transporter (EcCLC) numbering. (B) Model for 2:1 Cl−/H+ exchange by CLC transporters. The negatively-charged carboxylic group of the Glugate side chain can occupy Sext (state 2) or Scen (state 3) by a swinging motion, competing with a Cl− ion for binding therein. When protonated at Scen by a proton transferred from the cytosol (state 4), the Glugate side chain flips out to the extracellular side (state5). The kinetic barrier between Scen and Sint would prevent leakage of Cl− ions through the open pore during this transient step. Also, as seen previously with EcCLC (Picollo et al., 2009), synergistic binding of two Cl− ions at Sext and Scen (depicted by solid gray curves around Sext and Scen) might further deter slippage of Cl− ions. Deprotonation resets the cycle (state1). The cycle is reversible, and for simplicity the intermediate steps were omitted. Cl− ions and H+ are depicted as green and blue spheres, respectively. (C) Model for the CLC-1 channel. The cryo-EM structure of CLC-1 presented in this study represents the depolarized state. Although the conformation of the αC-D loop remains similar to that of transporters, CLC-1’s kinetic barrier is lower than transporters due to the lack of additional kinetic barrier elements. In addition, weak Cl−-binding affinity at Scen might facilitate rapid permeation of Cl− ions along the pore. When the membrane potential is negative (resting), the Glugate side chain may occupy Sext or Scen as in transporters, blocking the pore. (D) Model for CLC-K channels. The outer gate is removed by a natural mutation of Glugate to valine (V166). The kinetic barrier is largely reduced due to a flip-down of SerC, as well as lack of other kinetic barrier elements. The cryo-EM structure suggested that Sext and Scen have weaker Cl−-binding affinity than transporters (empty and with a semi-transparent Cl− sphere).
Figure 8 with 1 supplement
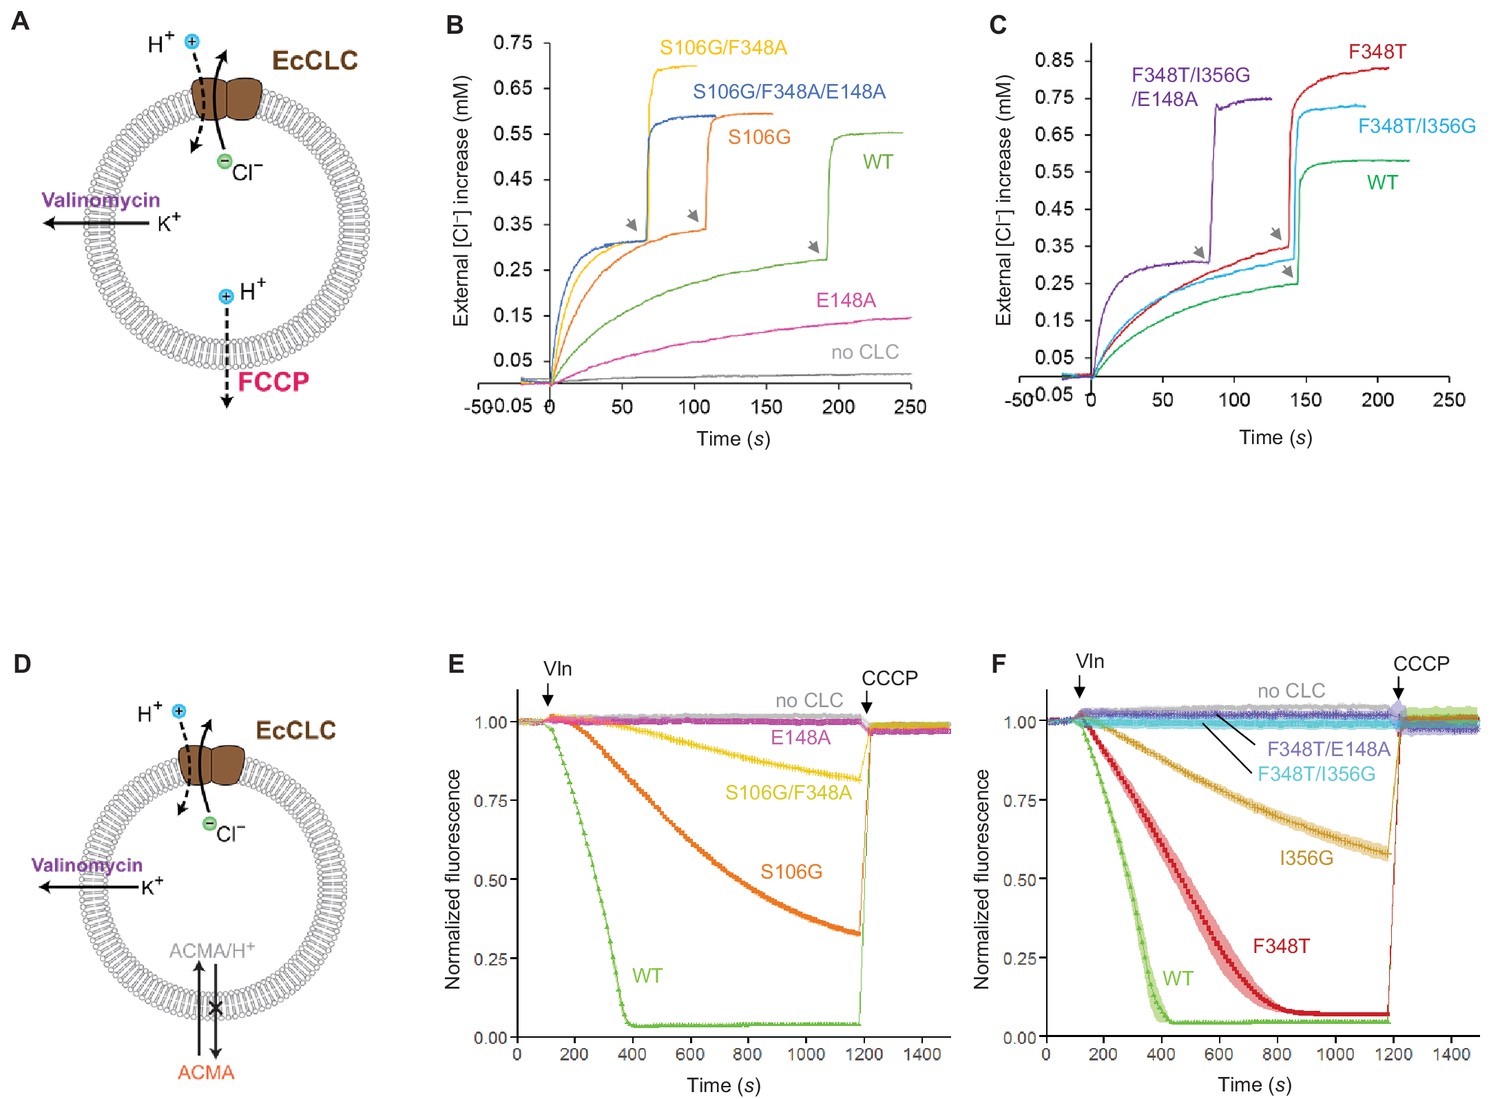
Effects of Glugate and kinetic barrier mutations on Cl− and H+ transport activities of EcCLC.
(A) Schematics of the Cl− dump assay to measure the Cl− transport rate of EcCLC. Purified EcCLC protein is reconstituted into proteoliposomes containing 300 mM KCl inside. Buffer outside the liposomes was reduced to 150 mM K2SO4, lowering the Cl− concentration outside to ~1 mM. Transmembrane ion flux was initiated by addition of the K+-ionophore valinomycin (Vln) and the protonophore carbonyl cyanide-4-(trifluoromethoxy)phenylhydrazone (FCCP). Increase of the Cl− concentration outside the liposomes was monitored using a Cl−-selective electrode. (B) and (C) Examples of raw traces of Cl− dump assays. Vln/FCCP was added at t = 0. the gray arrowheads indicate addition of the β-octyl glucoside detergent to the reaction to release all Cl− from liposomes. (D) Schematics of the fluorescence-based H+ influx assay to measure the H+ transport activity of EcCLC. EcCLC proteoliposomes containing 450 mM KCl inside were diluted to buffer containing 450 mM potassium gluconate, lowering Cl− concentration outside to ~30 mM. The flux was initiated by addition of valinomycin at t = 100 s. As H+ are transported into the vesicles by EcCLC, intravesicular pH drops, which can be monitored by the quenching of 9-amino-6-chloro-2-methoxyacridine (ACMA) fluorescence. At the end of experiments (t = 1200 s), the protonophore carbonyl cyanide m-chlorophenylhydrazone (CCCP) was added to release all H+ from the vesicles. (E) and (F) Examples of normalized fluorescence traces of ACMA-based H+ influx assay. Shown are means (line and symbols) and s.e.m. (band) of 4 experiments.
Figure 8—figure supplement 1
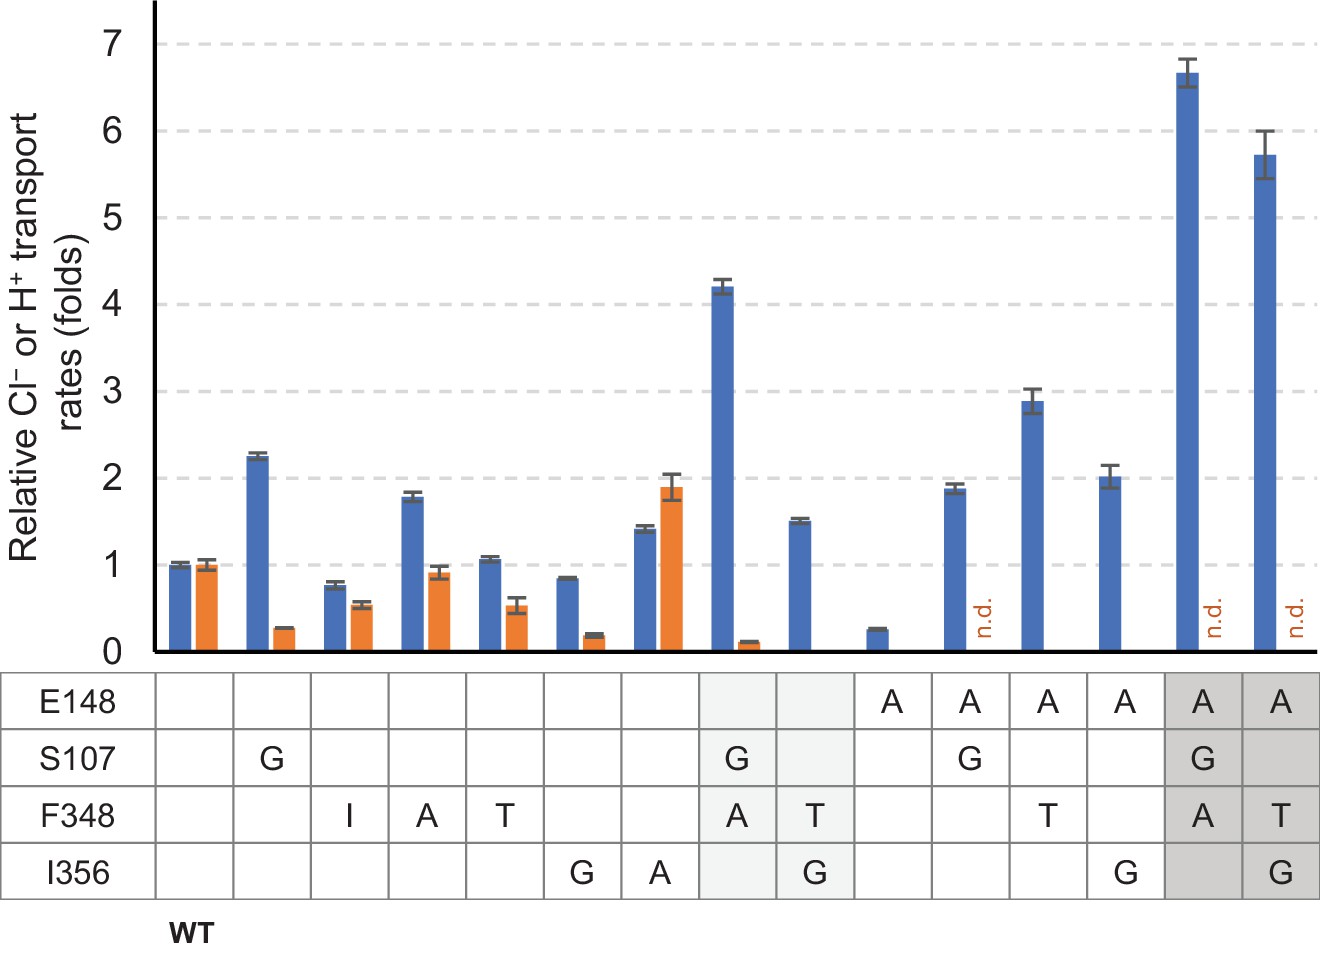
Summary of relative Cl− and H+ transport activities of EcCLC mutants.
Cl− (blue bars) and H+ (orange bars) transport rates of EcCLC mutants were calculated from raw data (Figure 8) as described in the Materials and methods section and shown as relative values with respect to the values of wildtype EcCLC. The Cl− transport measurement assay allows quantification of Cl− turnover rates, which was 800 s−1 per monomer for wildtype EcCLC. Error bars, s.e.m. (n = 4 or 5). n.d., not determined.
Videos
Video 1
Cryo-EM structure of the human CLC-1 channel.
The cryo-EM map and atomic model of human CLC-1 are illustrated. Also see Figure 2C and D.
Video 2
Glutamate gate (Glugate) and Cl−-binding sites of CLC-1.
The selectivity filter region of human CLC-1 is shown. The same color scheme and representation are used in Figure 4A.
Tables
Key resources table
| Reagent type (species) or resource | Designation | Source or reference | Identifiers | Additional information |
|---|---|---|---|---|
| Gene (Homo sapiens) | CLCN1 | Synthetic | UniProt: P35523 | |
| Cell line (Homo sapiens) | HEK293S GnTI- | ATCC | ATCC: CRL-3022 RRID:CVCL_A785 | |
| Cell line (Spodoptera frugiperda) | Sf9 | ATCC | ATCC: CRL-1711 RRID:CVCL_0549 | |
| Recombinant DNA reagent | pEG BacMam | doi: 10.1038/nprot.2014.173 | ||
| Software, algorithm | RELION-2 | doi: 10.1016/j.jsb.2012.09.006 | https://www2.mrc-lmb.cam.ac.uk/relion/index.php?title=Main_Page | |
| Software, algorithm | MotionCor2 | doi:10.1038/nmeth.4193 | http://msg.ucsf.edu/em/software/motioncor2.html | |
| Software, algorithm | CTFFIND4 | 10.1016/j.jsb.2015.08.008 | http://grigoriefflab.janelia.org/ctffind4 | |
| Software, algorithm | Alightpart_lmbfgs | doi: 10.1016/j.jsb.2015.08.007 | https://sites.google.com/site/rubinsteingroup/direct-detector-align_lmbfgs | |
| Software, algorithm | Rosetta | RosettaCommons | RRID:SCR_015701 | https://www.rosettacommons.org/software |
| Software, algorithm | Pymol | PyMOL Molecular Graphics System, Schrödinger, LLC | RRID:SCR_000305 | http://www.pymol.org/ |
| Software, algorithm | UCSF Chimera | UCSF Resource for Biocomputing, Visualization, and Bioinformatics | RRID:SCR_004097 | http://plato.cgl.ucsf.edu/chimera/ |
Table 1
Model refinement and validation statistics.
https://doi.org/10.7554/eLife.36629.019| TMD | CTD | |
|---|---|---|
| Rosetta Model Refinement | ||
| Map pixel size (Å) | 1.03 | 1.03 |
| Map sharpening B-factor (Å2) | −97.9 | 0 |
| Map lowpass filter (Å) | 3.36 | 4.2 |
| Refinement resolution limit (Å) | 3.36 | 4.5 |
| Number of atoms | 14,536 | 5124† |
| Protein | 14,536 | 5124† |
| Non-hydrogen atoms | 7152 | 2550† |
| Hydrogen atoms | 7384 | 2574† |
| Non-protein | 0 | 0 |
| Refined Model Statistics | ||
| Average B-factor (Å2) | 24.59 | 161.34 |
| r.m.s deviations | ||
| Bond length (Å) | 0.02 | 0.02† |
| Bond angle (°) | 1.42 | 1.55† |
| Ramachandran Plot | ||
| Favored (%) | 96.75 | 96.15† |
| Outliers (%) | 0.43 | 0.64† |
| MolProbity | ||
| Clash score*/percentile | 1.38 (99 %) | 0.39# (99%) |
| Rotamers | ||
| Favored (%) | 99.48% | 100.00# % |
| Outliers (%) | 0.00% | 0.0† % |
| Overall score/percentile | 1.07 (100 %) | 0.90† (100%) |
-
*number of steric overlaps >0.4 Å per 1000 atoms.
†numbers and scores before truncation of side chain atoms.
Additional files
-
Transparent reporting form
- https://doi.org/10.7554/eLife.36629.020
Download links
A two-part list of links to download the article, or parts of the article, in various formats.
Downloads (link to download the article as PDF)
Open citations (links to open the citations from this article in various online reference manager services)
Cite this article (links to download the citations from this article in formats compatible with various reference manager tools)
Structure of the CLC-1 chloride channel from Homo sapiens
eLife 7:e36629.
https://doi.org/10.7554/eLife.36629


