Cryo-EM structure of alpha-synuclein fibrils
- University of Basel, Switzerland
- Roche Innovation Center Basel, Switzerland
- ETH Zürich, Switzerland
Figures
Figure 1 with 3 supplements
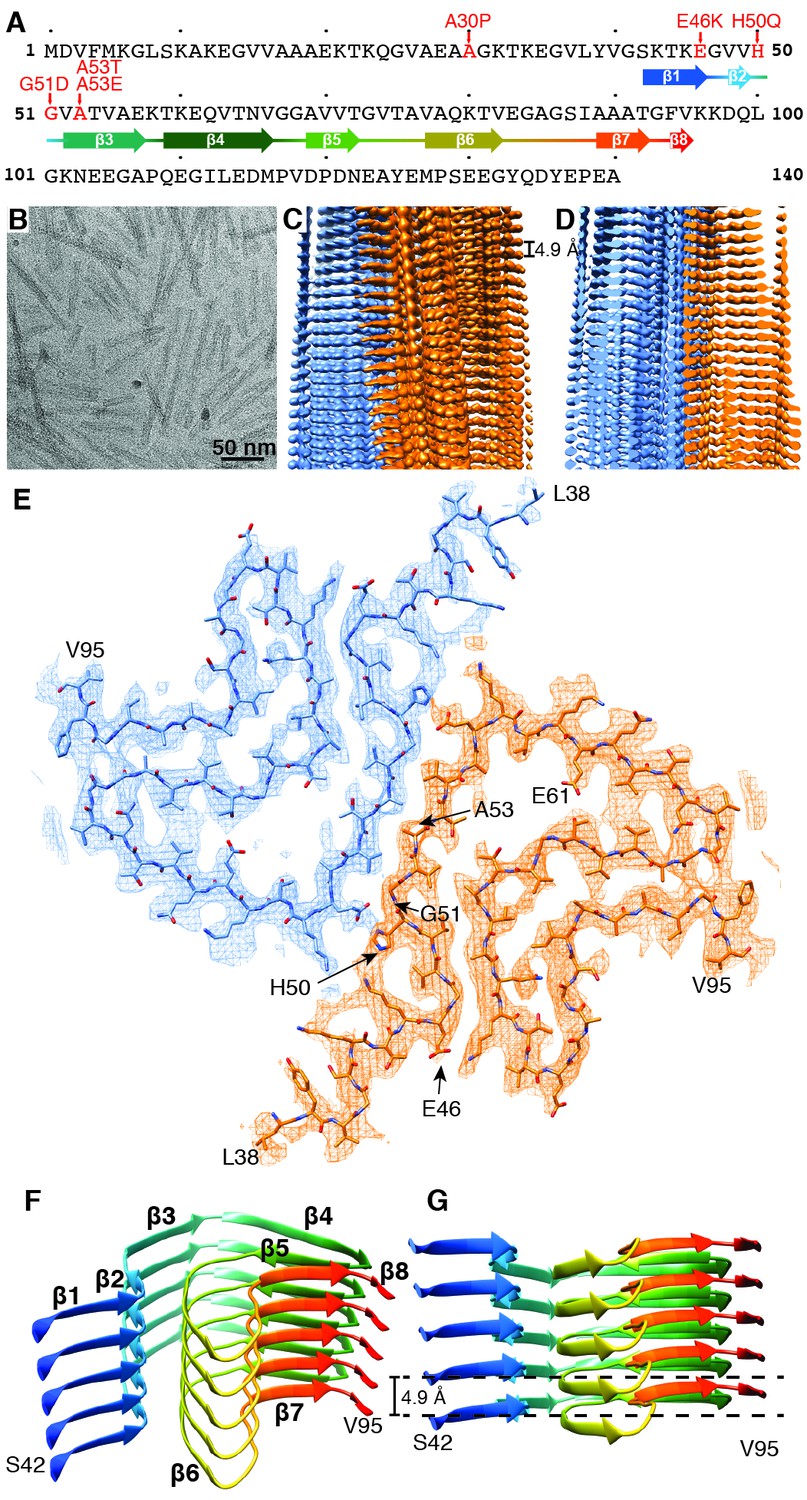
Structure of α-Syn(1-121) fibril.
(A) Schematic depicting the sequence of human α-Syn. The positions of the known familial mutations are indicated. β-strand regions are indicated by arrows colored from blue to red. (B) Cryo-EM micrograph depicting the distribution and general appearance of α-Syn fibrils. (C) Cryo-EM reconstruction of α-Syn(1-121) fibrils showing two protofilaments (orange and blue). (D) Cross-section of (C) illustrating the clear separation of the β-strands, also shown in Figure 1—figure supplement 3A and B. (E) Cross-section of a fibril (along the axis) illustrating the arrangement of the two protofilaments (orange and blue) and fitted atomic model. Positions of the initial (L38) and final (V95) residues fitted are indicated, as well as the initial and final residue of the NAC region (E61 to V95). Arrows indicate the location of four of the five α-Syn residues where familial mutations associated with PD occur. (F) Distribution of β-strands in a single protofilament of the α-Syn fibril, corresponding to residues 42 to 95. Color scheme, as in (A). (G) As in (F) but a perpendicular view to the fibril axis illustrating height differences in some areas of a single protofilament.
Figure 1—figure supplement 1
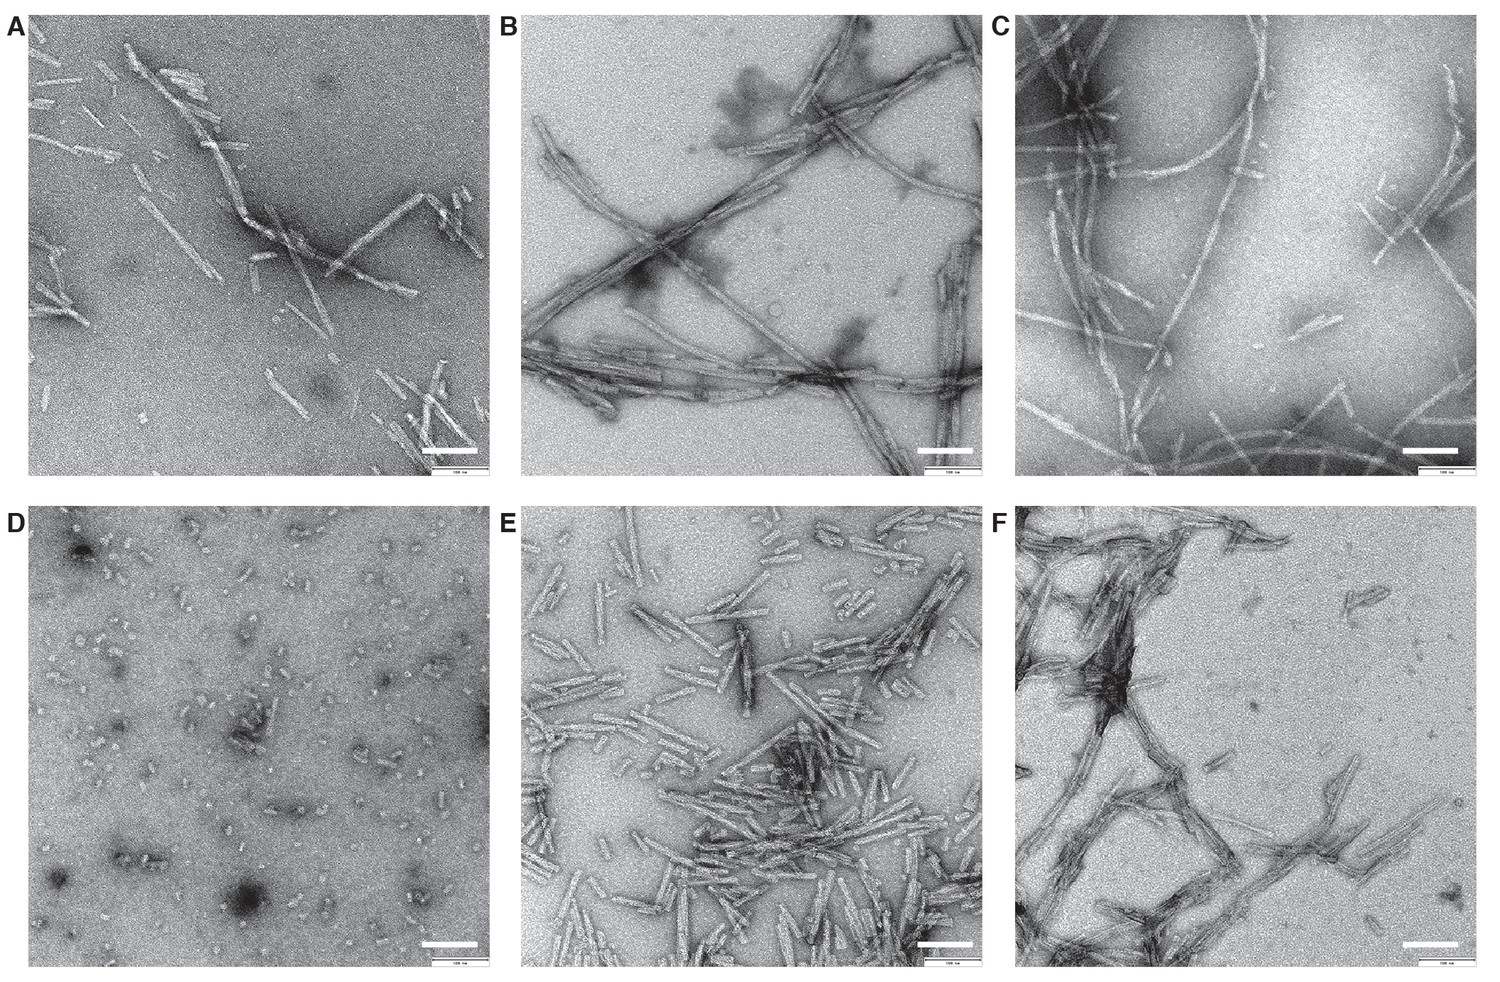
Negative stain TEM images of α-Syn strains.
(A) Wildtype. (B) Ser129 Phosphorylated. (C) N-terminally acetylated. (D) C-terminally truncated (α-Syn(1-119)). (E) C-terminally truncated (α-Syn(1-121)). (F) C-terminally truncated (α-Syn(1-122)). 0.5 mg/ml fibril preparations were stained with 2% uranyl acetate. Scale bars: 100 nm.
Figure 1—figure supplement 2
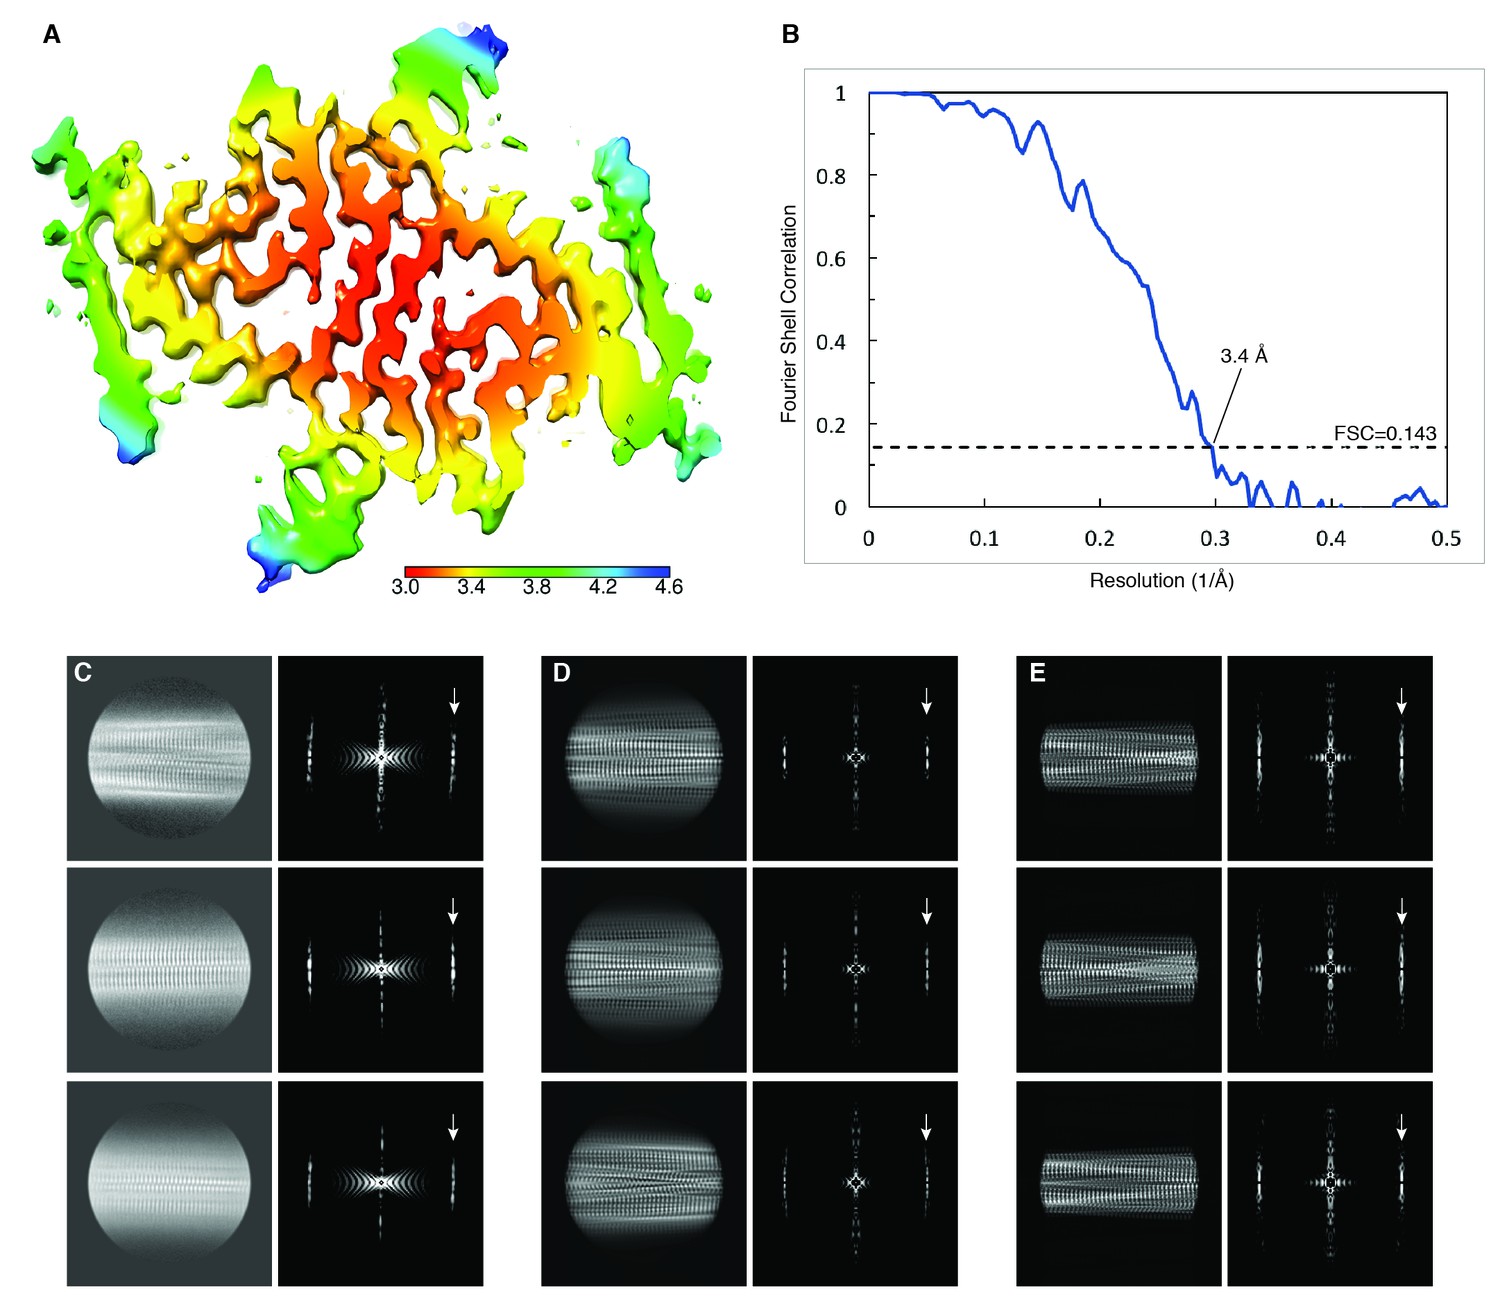
Local resolution estimation and FSC curves.
(A) Cryo-EM map with local resolution estimation; the color scale indicates resolution ranging from 3.0 Å to 4.6 Å. (B) Fourier shell correlation curve between two independently-refined half-maps, indicating an overall resolution of 3.4 Å. (C) Three examples of reference-free 2D class averages from the original dataset with their respective power spectra on the right. (D) 2D projections and power spectra of the 3D map. (E) 2D projections and power spectra of the atomic model. Arrows in power spectrum panels show the layer line at 1/ (4.9 Å) with peak intensities on both sides of the meridian (Bessel order n = 1), resulting from an approximate 21 screw symmetry between adjacent α-Syn subunits.
Figure 1—figure supplement 3
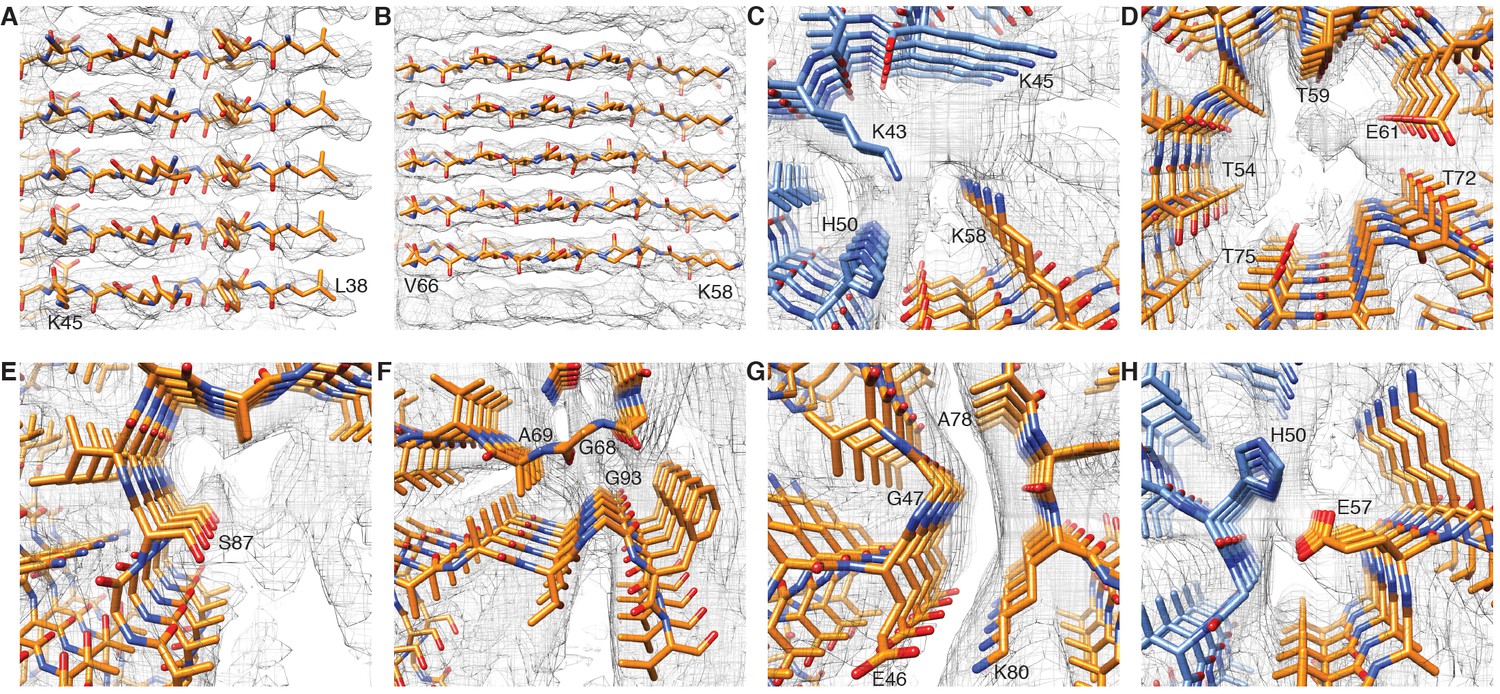
Details of atomic model and density.
(A) (B) Clearly resolved separation of individual β-strands along the fibril. (C) Extra density at the interface of adjacent protofilaments between the positively charged lysines K43 and K45 and lysine K58. (D) Hydrophilic region surrounding a tunnel filled with an additional density. (E) Phosphorylation site S87 showing the location of this residue towards the outside of the fibril. (F) Distal loop of a protofilament indicating residues G68, A69 and G93, which may contribute to loop stability. (G) Arrangement of G47 and A78, which may contribute to the interaction between E46 and K80. (H) Interaction between H50 and E57 in the interface region of two protofilaments, which may contribute to the stability of protofilament interaction.
Figure 2 with 1 supplement
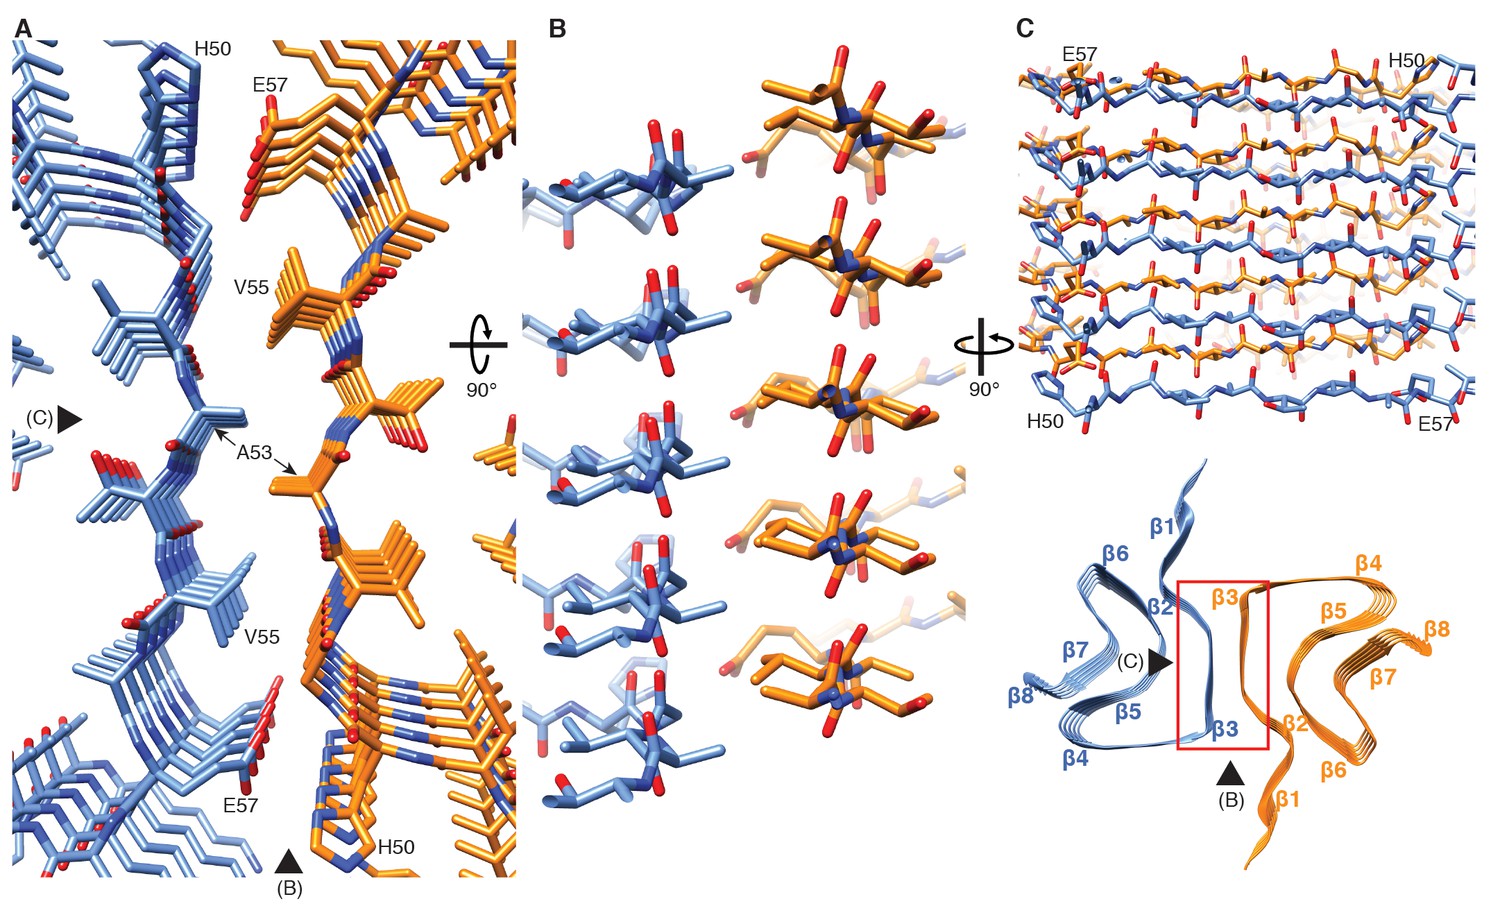
Interface region between two protofilaments of the α-Syn(1-121) fibril.
(A) View along the axis of the fibril as indicated by the red rectangle on the ribbon diagram (bottom right). (B) (C) Side views of the fibril with orientations indicated by arrowheads in (A) and the ribbon diagram (bottom right). Panels (B) and (C) clearly illustrate the 21 screw symmetry that results from the staggered arrangement of subunits.
Figure 2—figure supplement 1

Stacking of β-strands.
(A–D) Close-up side views of the α-Syn fibril illustrating homo- and hetero-steric zippers present in the structure. Pointers in the cross-section panel (top left) indicate the points of view for panels (A) to (D).
Figure 3
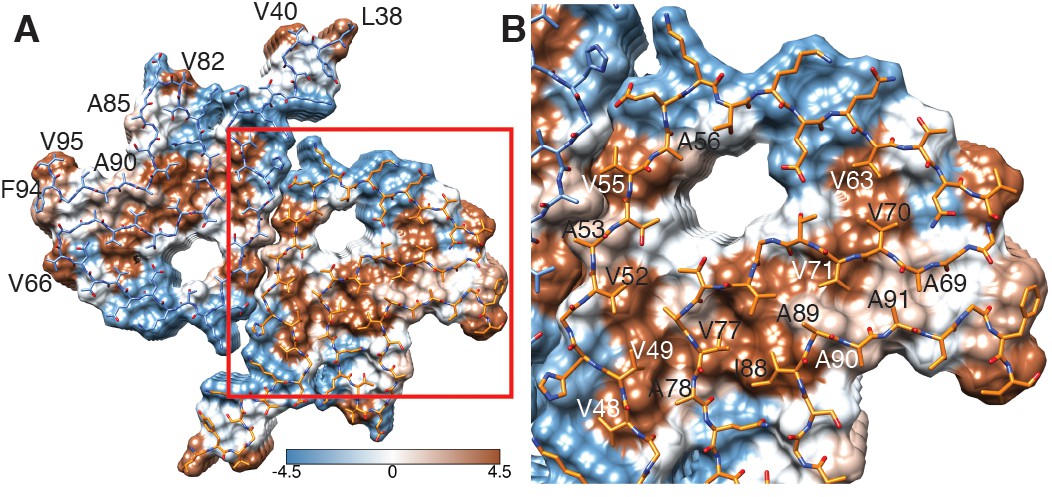
Hydrophobicity of α-Syn(1-121) fibrils.
(A) Top view (fibril axis) of the hydrophobic regions (brown) in a fibril where the hydrophobic pocket at the interface between two protofilaments is evident. Hydrophobicity score from hydrophilic (−4.5, blue) to hydrophobic (4.5, brown) is indicated by the color bar. Hydrophobic residues on the outer surface of the fibril are indicated. (B) Close-up of the region highlighted in (A) indicating the hydrophobic core composed of alanines, valines and a single isoleucine (I88). Residues forming the hydrophilic region (blue) that surrounds the hydrophobic region of the core are also visible.
Figure 4
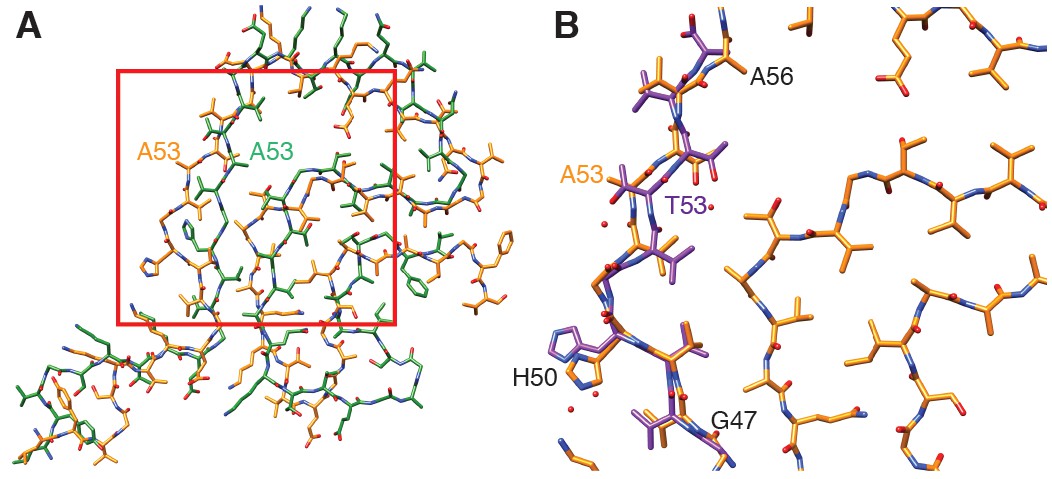
Comparison of α-Syn(1-121) fibrils with previous α-Syn fibril structures.
(A) Overlay with the solid-state NMR structure from Tuttle et al. (2016) (green). Our α-Syn structure is orange in both overlays. (B) Overlay with the preNAC segment obtained by micro-ED by Rodriguez et al. (2015) (purple). The red square in (A) indicates the area of our structure shown in (B). Residue 53 is mutated (i.e. A53T) in the micro-ED structure.
Figure 5
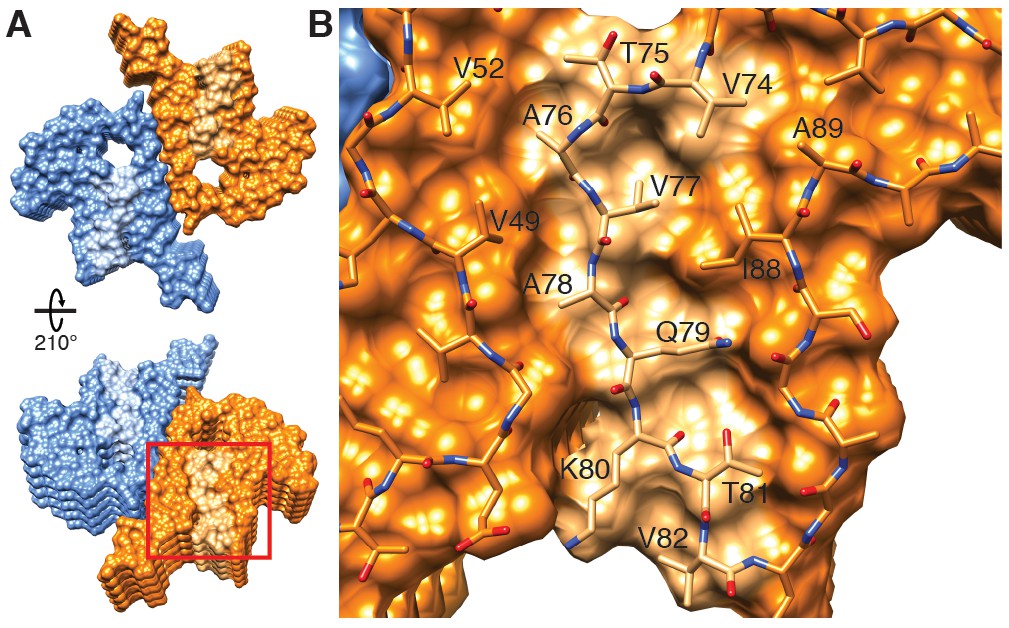
Hydrophobic cleft at the growing end of α-Syn(1-121) fibrils.
(A) Views of opposite ends of α-Syn fibrils with the two protofilaments colored orange and blue. Regions corresponding to the location of the hydrophobic cleft are shown in a lighter shade. (B) Residues forming the hydrophobic cleft, including V49, V52, I88, A89 provide an entry point for residues V74-V82 of an incoming α-Syn molecule (atoms shown). Area shown in panel (B) is marked in panel (A) with a square.
Videos
Video 1
Cryo-EM structure of alpha-synuclein fibril.
Details of the cryo-EM reconstruction of an alpha-synuclein fibril at 3.4 Å resolution, illustrating the interaction between two protofilaments, the 4.9 Å spacing between β-strands of a single protofilament and monomer topology in the protofilament core.
Tables
Table 1
Cryo-EM structure determination and model statistics.
https://doi.org/10.7554/eLife.36402.013| Data collection | |
| Magnification | 165000 x |
| Pixel size (Å) | 0.831 |
| Defocus Range (µm) | −0.8 to −2.5 |
| Voltage | 300 kV |
| Exposure time (s per frame) | 0.2 |
| Number of frames | 50 |
| Total dose (e/Å2) | 69 to 128 |
| Reconstruction | |
| Box size (pixels) | 280 |
| Inter-box distance (pixels) | 28 |
| Micrographs | 118 |
| Manually picked fibrils | 792 |
| Initial extracted segments | 18860 |
| Segments after 2D classification | 18371 |
| Segments after 3D classification | 13390 |
| Resolution after 3D refinement (Å) | 3.8 |
| Final resolution (Å) | 3.42 |
| Estimated map sharpening B-factor (Å2) | −82.6 |
| Helical rise (Å) | 2.45 |
| Helical twist (°) | 179.5 |
| Atomic model | |
| Initial model used (PDB code) | 2N0A |
| Model resolution (Å) FSC threshold | 2.94/4.08 FSC = 0.143/FSC = 0.5 |
| Model resolution range (Å) | 116.34–2.94 |
| Map sharpening B-factor (Å2) | −82.6 |
| Model composition Non-hydrogen atoms Protein residues Ligands | 3960 580 0 |
| B-factors (Å2) (non-hydrogen atoms) Protein Ligand | 29.85 N.A. |
| R.m.s. deviations Bond lengths (Å) Bond angles (°) | 0.008 1.088 |
| Validation MolProbity score Clashscore Poor rotamers (%) | 1.49 1.24 0.00 |
| Ramachandran plot Favored (%) Allowed (%) Disallowed (%) | 85.71 14.29 0.00 |
Download links
A two-part list of links to download the article, or parts of the article, in various formats.
Downloads (link to download the article as PDF)
Open citations (links to open the citations from this article in various online reference manager services)
Cite this article (links to download the citations from this article in formats compatible with various reference manager tools)
Cryo-EM structure of alpha-synuclein fibrils
eLife 7:e36402.
https://doi.org/10.7554/eLife.36402


