Ordered arrangement of dendrites within a C. elegans sensory nerve bundle
- Boston Children’s Hospital, United States
- Harvard Medical School, United States
Figures
Figure 1

A semi-automated method for quantifying dendrite order.
Our analysis pipeline can be divided into three parts: (A) imaging, (B) quantification, and (C) statistics. (A) Schematic showing position of amphid neurons in head and maximum-intensity projection of a fourth larval stage (L4) animal expressing YFP, CFP, and mCherry in AWA, AFD, and ASE, respectively. Nose tip is at top. Arrowheads indicate approximate extent of bundle used for analysis in all experiments. (B) (i) To quantify dendrite order, a brightest-path algorithm first extracts the 3D coordinates of each dendrite. (ii) In cross-section, the dendrites define a triangle (A, AWA; D, AFD; E, ASE). The pairwise distances between dendrites are determined (d1, d2, d3). The longest distance is taken as a proxy for bundle width (d1 in the schematic). The dendrite opposite the longest side is defined as the dendrite ‘in the middle’ of the others (AFD in the schematic). (iii) For visualization, bundle width is plotted at each position along the bundle. The dendrite in the middle is plotted as a color bar (yellow, AWA; blue, AFD; red, ASE). Color bars from age- and genotype-matched individuals are arranged side-by-side to visualize patterns of dendrite order in a population. For simplicity, only n = 6 bundles are illustrated, yielding a distribution at the boxed position of 5 red, 1 blue, 0 yellow; for a typical sample size of n = 18, these would correspond to 15 red, 3 blue, 0 yellow. (C) (i) For statistical testing, the observed distribution (e.g. 15, 3, 0) is compared to a test distribution using Fisher’s 3 × 2 exact test as a test statistic to obtain a nominal ‘true’ p-value. Permutation testing is carried out by merging observed and test distributions and resampling 500 times, to obtain representative p-values for distributions with the same composition that differ only by sampling error. The ‘true’ p-value is ranked relative to these resampled p-values, with lower rankings (1/501) indicating the true distributions differ more than would be expected by sampling error. Rankings below 25/501 or 5/501 represent a corrected p-value of p<0.05 or p<0.01 respectively. (ii) This comparison is carried out at every position along the bundle and the p-value rankings are represented as a log-scale color bar. Pairwise distances, triangles, and p-value rankings at every position along each bundle in this study can be explored at http://heimanlab.com/ibb.
Figure 2 with 1 supplement
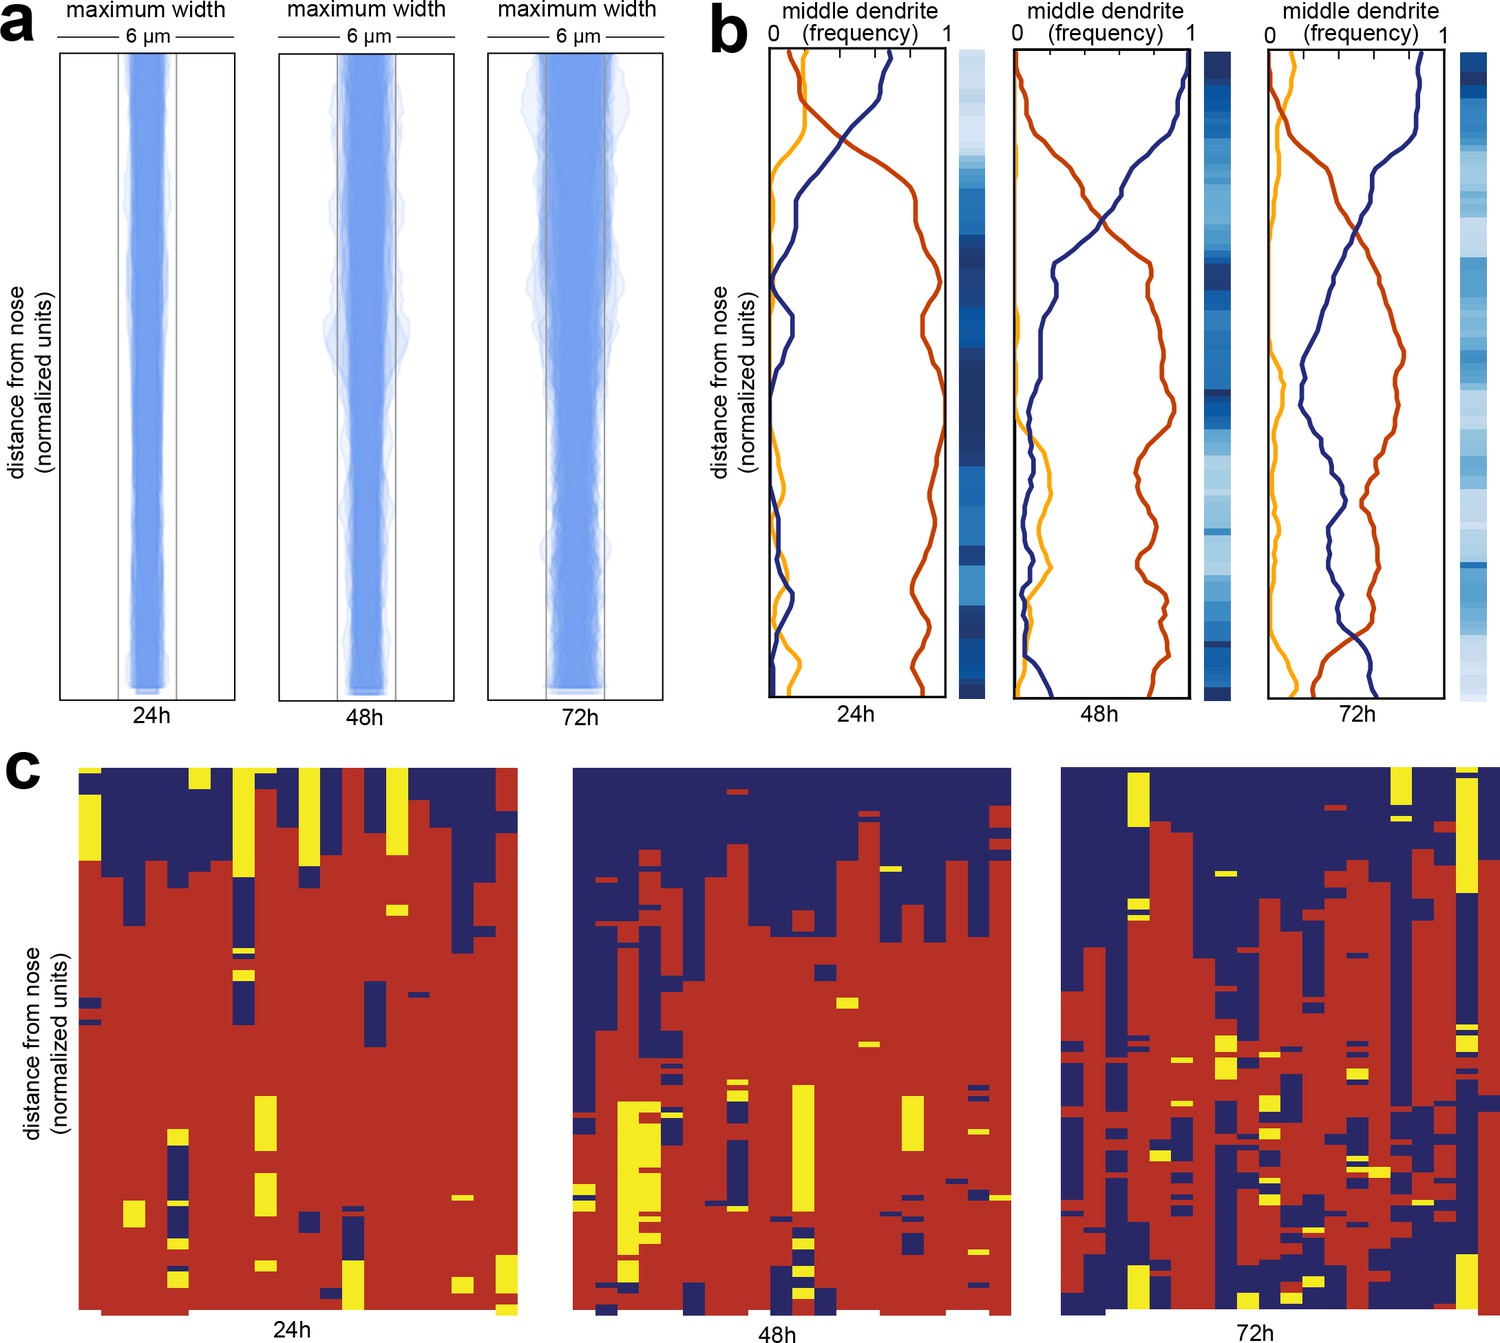
Wild-type dendrite bundles are tightly fasciculated and well ordered.
(A) Maximum distances between AWA, AFD, and ASE dendrites for early stage larvae (24 hr, L2/L3), late stage larvae (48 hr, L4), and young adults (72 hr, one-day adults). Light gray bars, 2 µm width; entire box, 6 µm width. (B) Summary plots showing the fraction of animals with AWA (yellow), AFD (blue), or ASE (red) dendrites in the middle at each position along the bundle for 24 hr, 48 hr, and 72 hr time points. Blue color bars show statistical difference from a random distribution (ranked p-values, shading as in Figure 1Cii); darker shades represent greater difference from random. See Figure 2—figure supplement 1B for comparison with chi-squared test p-values. (C) Population plots showing dendrite ‘in the middle’ for 24 hr, 48 hr, and 72 hr time points (AWA, yellow; AFD, blue; ASE, red); same data as in (B). Each column represents one animal. n = 20 at each time point.
Figure 2—figure supplement 1
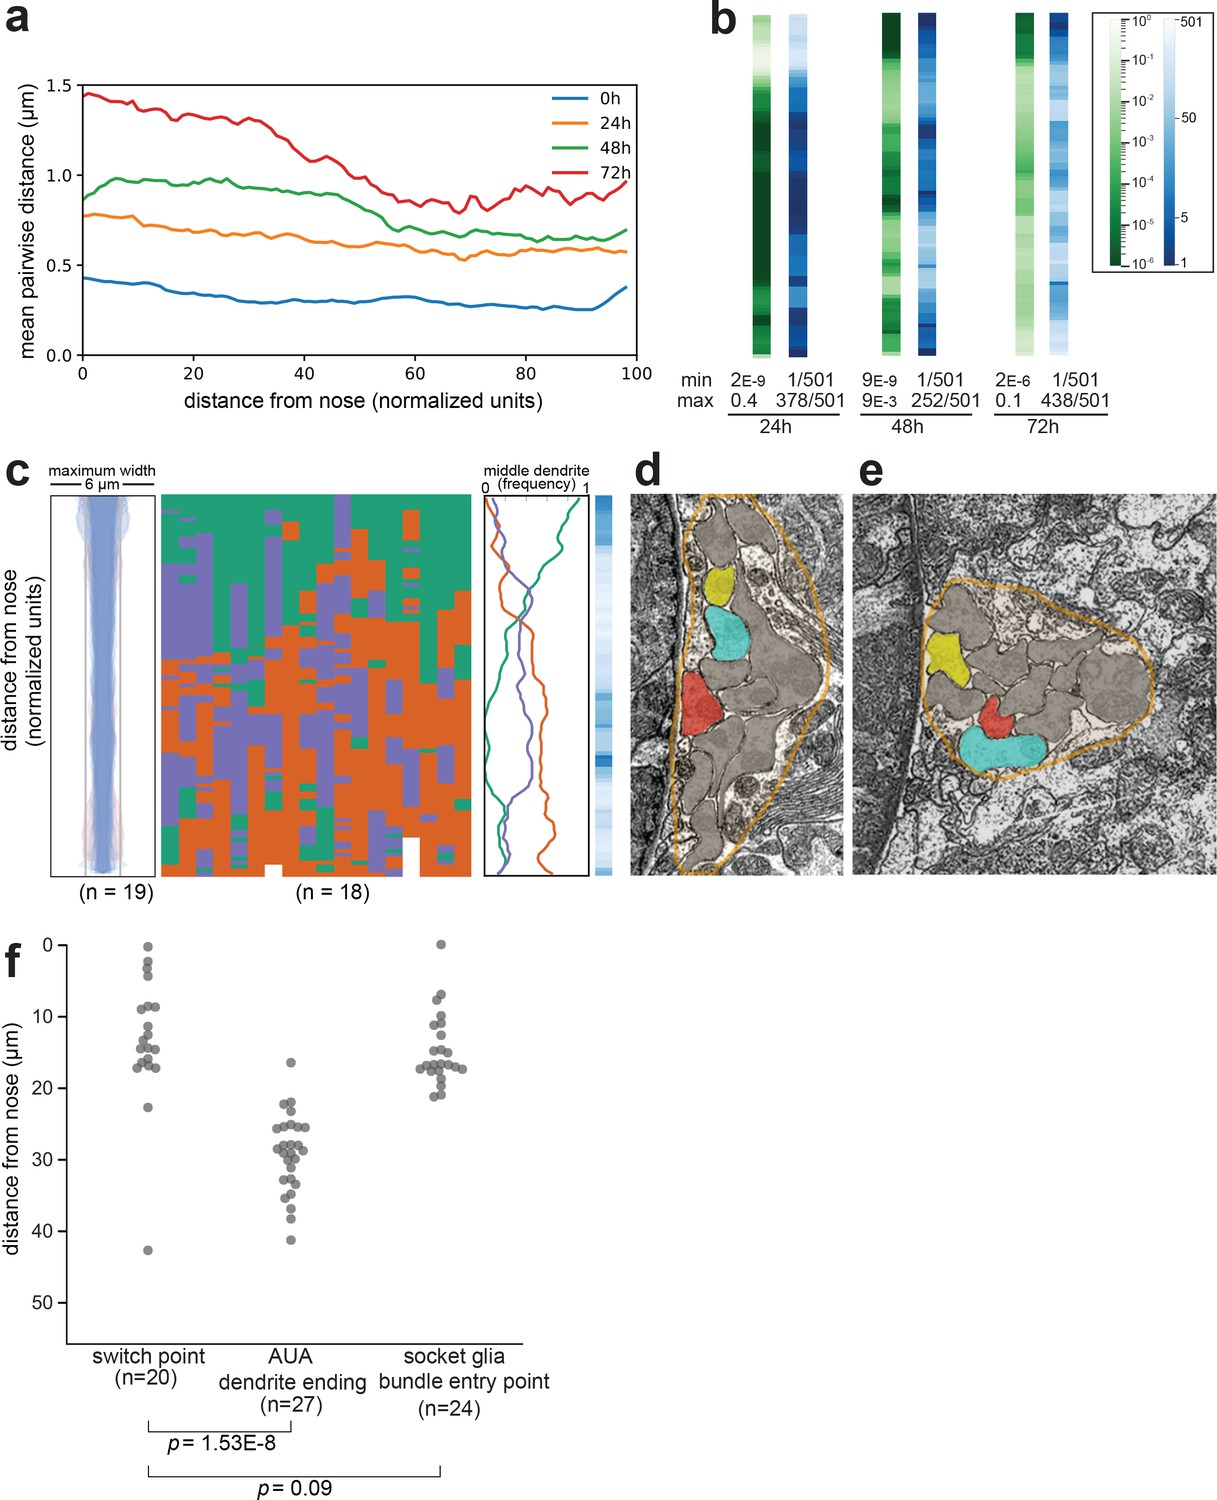
Dendrite order in wild-type animals.
(A) Mean pairwise distances between dendrites in 0 hr (L1), 24 hr (L2/L3), 48 hr (L4), and 72 hr (adult) animals. For comparison, the theoretical resolution limit under our imaging conditions is ~0.2 µm and the practical limit when imaging live intact animals is greater. At each position along the bundle, n = 20 animals with three labeled dendrites (i.e. 60 sets of pairwise measurements) per timepoint. (B) Comparison of chi-squared (green) and ranked p-value (blue) methods for quantifying statistical differences between wild-type and random populations (see Methods). Data represent wild-type animals at 24 hr, 48 hr, and 72 hr time points (same dataset as Figure 2). For each method, the minimum (least similar to random) and maximum (most similar to random) scores along the bundle are indicated. (C) Dendrite bundle width, dendrite order population plot, and summary plot for wild-type 48 hr (L4 stage) animals obtained using a different set of three neurons: green, AWA:YFP; purple, AWC:CFP; red, ASG:mCherry. n = 19. (D, E) Electron micrographs from ‘Slideable Worm’ (SW) (Altun and Hall, 2005) showing sections from an adult animal close to the nose (D, SW slice 18) and farther along the bundle (E, SW slice 50). Amphid dendrites are traced in gray except AFD (blue), AWA (yellow), ASE (red). The overall shape of the amphid bundle is traced in orange (approximately 6 µm across in both images). The switch from AFD (blue) to ASE (red) as the middle dendrite can be compared to the change in overall compactness of the bundle. (F) Swarmplot of measurements from wild-type L4 animals showing distances from the dendrite endings to the switch point (left column), from the nose tip to the end of AUA (middle column), and from the dendrite endings to the position where the amphid socket (AMso) joins the amphid bundle (right column).
© 2005, WormAtlas. Figure 2—figure supplement 1D and E reproduced with permission from http://wormatlas.org/SW/SW.php/index.html (Altun and Hall, 2005)
Figure 3 with 1 supplement
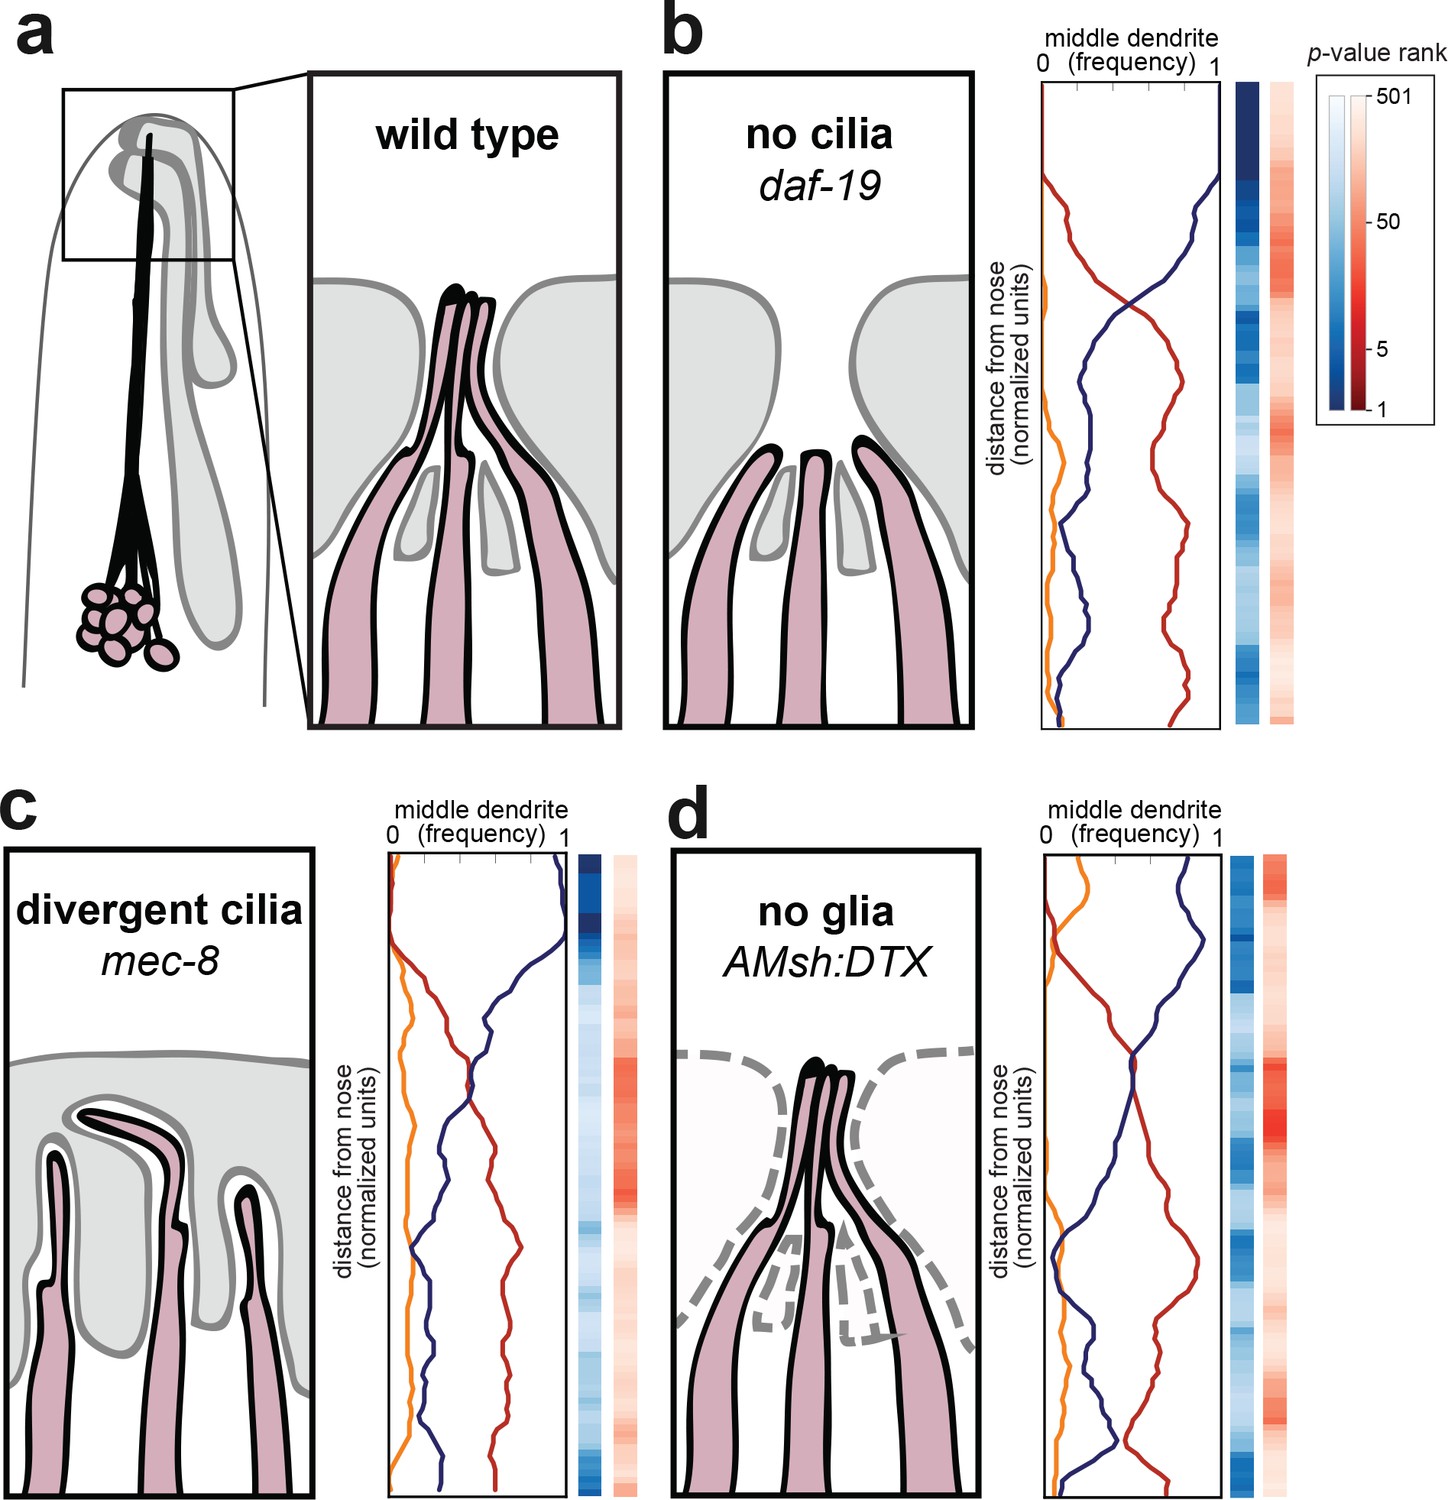
Amphid cilia and sheath glia are not required for dendrite order.
(A) Schematic of wild-type amphid neurons (dark pink) and glial cells (gray). Inset: Amphid dendrites protrude into the sheath glial cell and terminate in cilia. (B–D) Dendrite order summary plots for 48 hr (L4) animals with (B) no cilia (daf-19(m86);daf-12(sa204), n = 19); (C) divergent cilia (mec-8(u74), n = 19) or (D) no sheath glia (AMsh:DTX, transgene consisting of diphtheria toxin A under control of amphid sheath glial specific promoter, n = 18). Color bars, p-value rankings as indicated in key. Blue bars show statistical difference from random (darker shading, less random); red bars show statistical difference from wild type (darker shading, less like wild type).
Figure 3—figure supplement 1
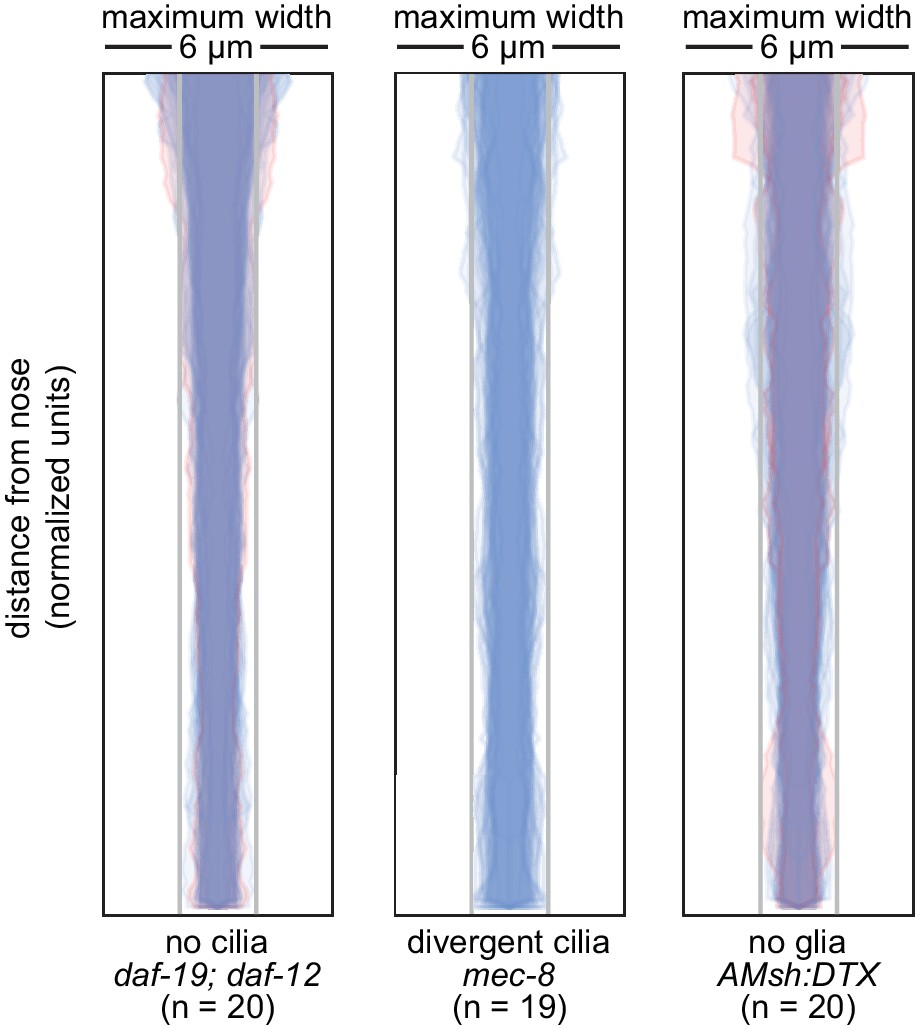
Loss of cilia or glia does not disrupt fasciculation.
Bundle width plots for 48 hr (L4) animals with no cilia (daf-19(m86);daf-12(sa204), n = 20); divergent cilia (mec-8(u74), n = 19) or no sheath glia (AMsh:DTX, transgene consisting of diphtheria toxin A under control of amphid sheath glial specific promoter, n = 20). Same animals as Figure 3.
Figure 4 with 1 supplement

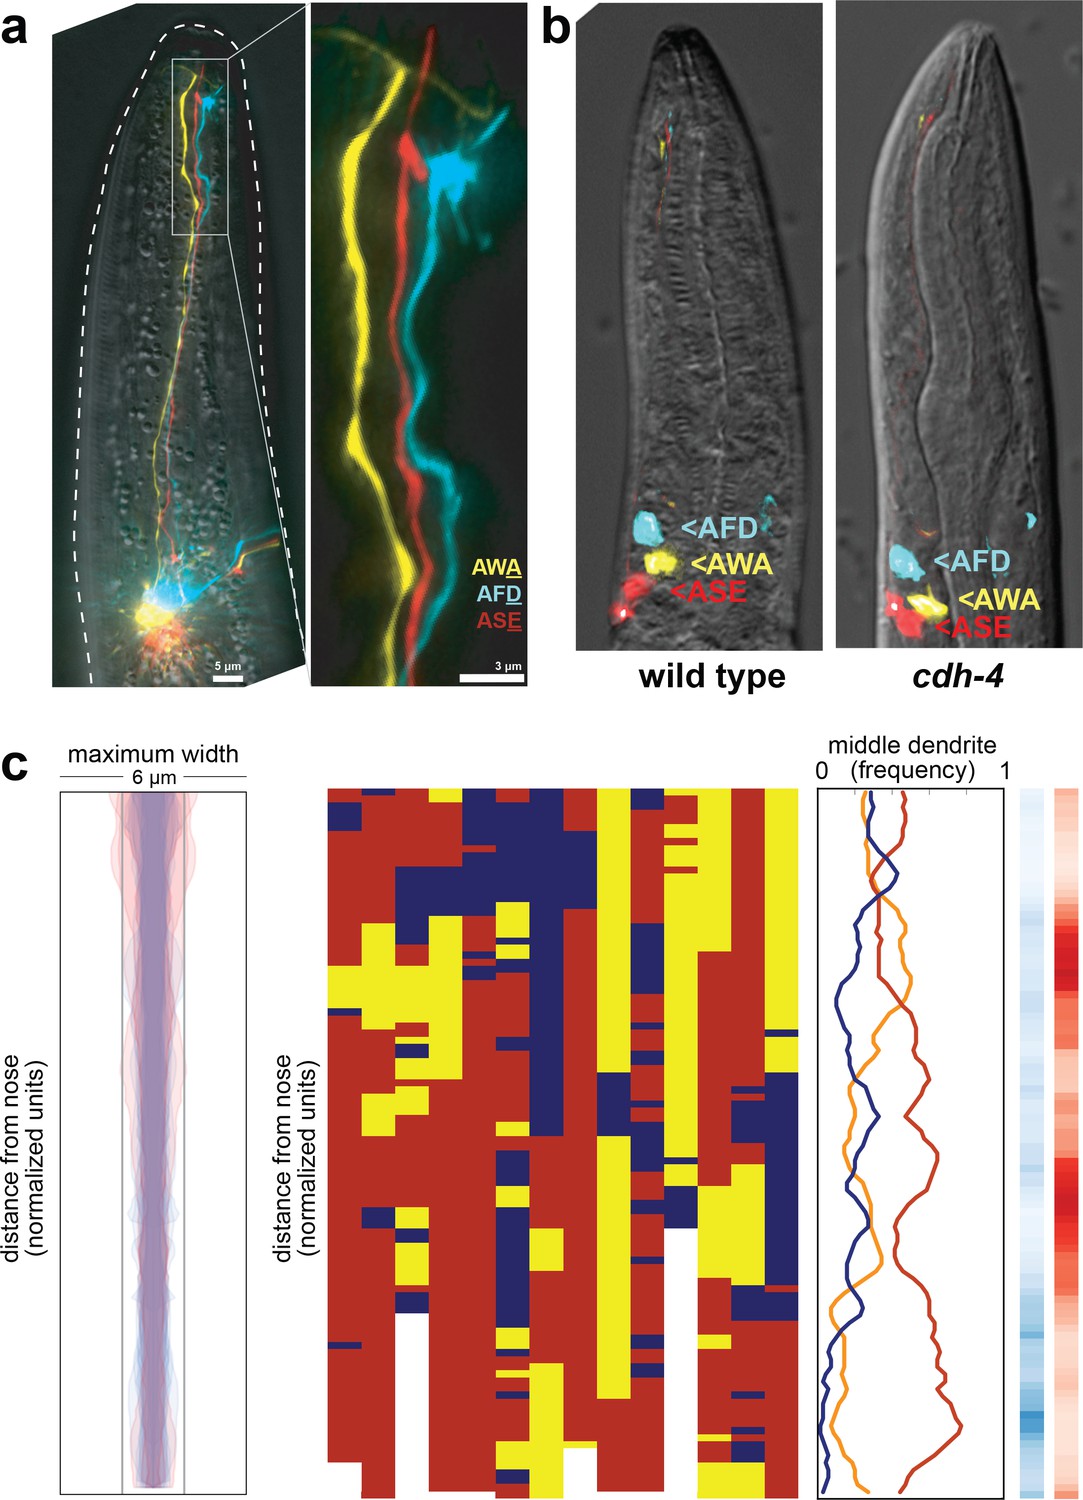
cdh-4 mutants exhibit loss of dendrite order.
(A) Schematic CDH-4 protein structure. TM, transmembrane segment; EGF-like, epidermal growth factor-like domain. (B) Maximum-intensity projection of 48 hr (L4) animal showing tightly-fasciculated dendrites with an altered order, compare to Figure 1A. (C) Bundle width plots for cdh-4 (48 hr, L4; n = 21). Five individuals with defasciculated dendrites (see Figure 4—figure supplement 1A) are overlaid in pink and were excluded from further analysis. All other animals (n = 16) are overlaid in blue. (D) Population plots and summary plots showing dendrite order for these animals (n = 16). p-value rankings as in Figure 3: blue, cdh-4 vs. random; red, cdh-4 vs. wild type; darker shading represents greater differences between the populations.
Figure 4—figure supplement 1
Fasciculation and dendrite order phenotypes in cdh-4 mutants.
(A) Maximum-intensity projection of 48 hr (L4) animal showing grossly defasciculated dendrites near the nose, compare to Figures 1A and 4B. (B) Cell body positions of AFD (blue), AWA (yellow), and ASE (red) neurons in wild-type (left) and cdh-4 (right) animals shortly after hatching (L1 stage). n = 5 per genotype. (C) Bundle width (n = 17) and population and summary plots of dendrite order (n = 14) in 24 hr (L2/L3) cdh-4 animals. Bundle widths of three animals with defasciculated dendrites are overlaid in pink. p-value rankings as in Figure 3: blue, cdh-4 vs. random; red, cdh-4 vs. wild type; darker shading represents greater differences between the populations.
Figure 5 with 2 supplements
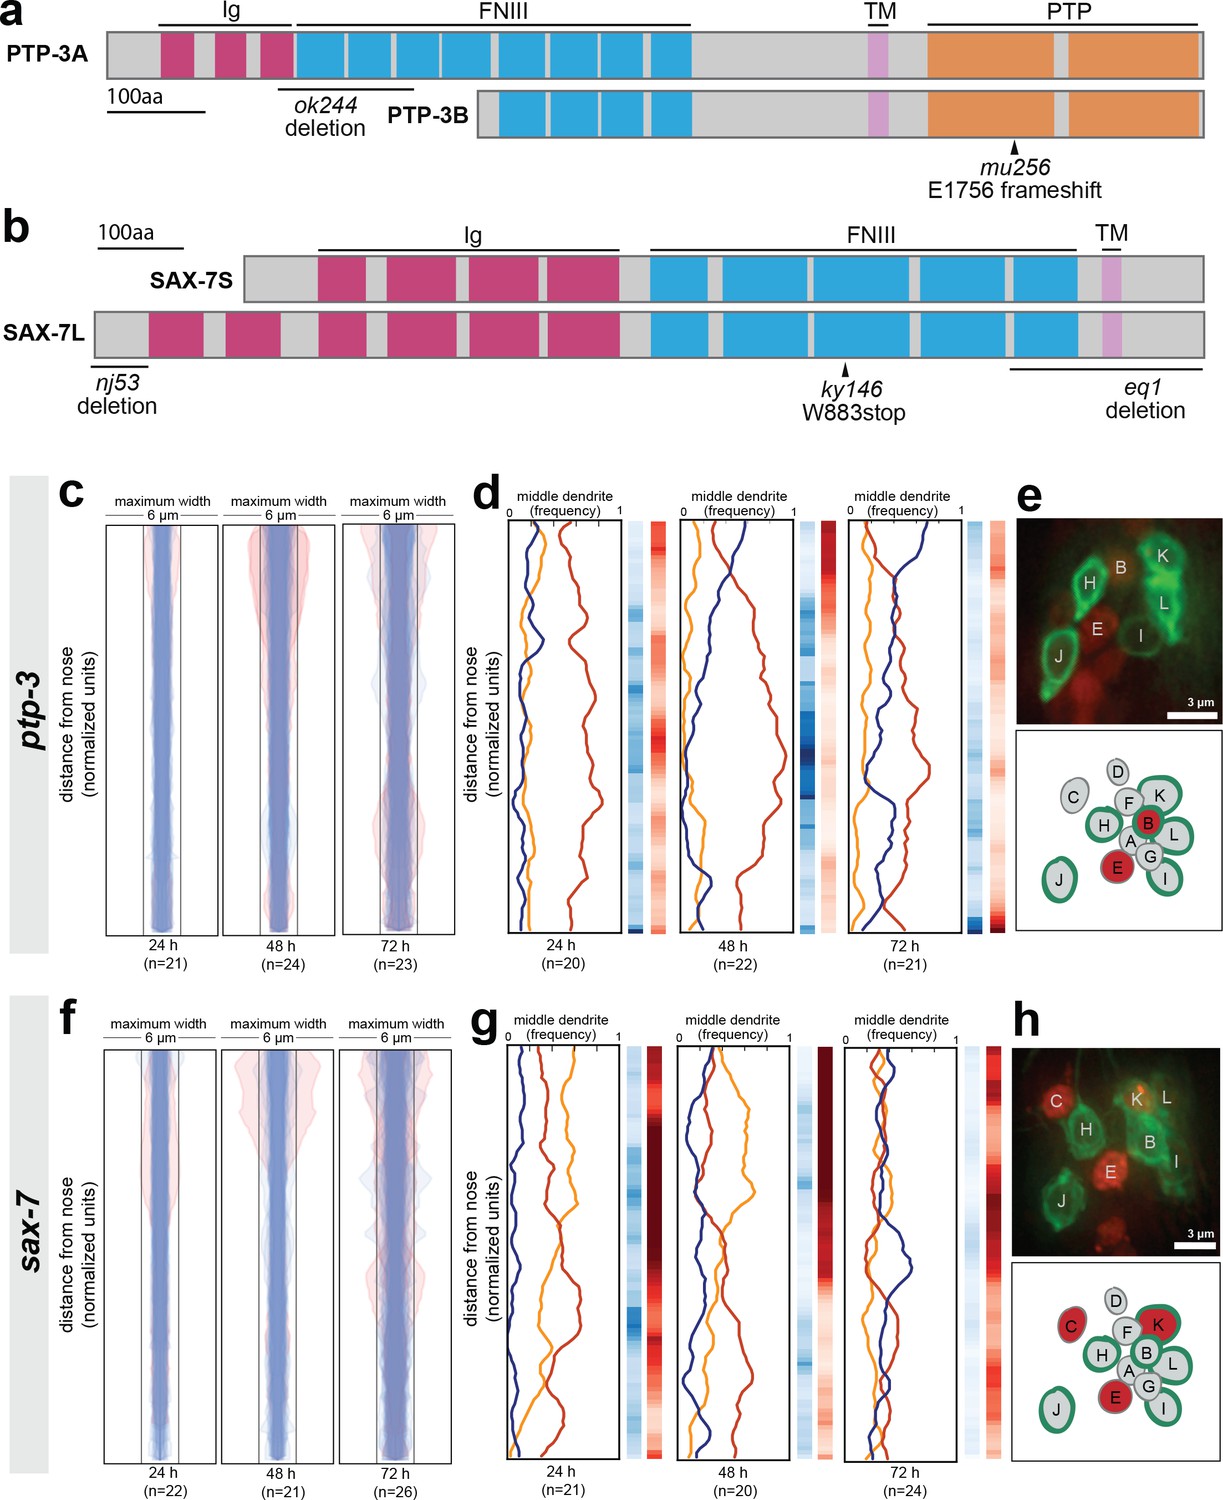
Loss of either ptp-3 or sax-7 alters dendrite order in young animals.
(A–B) Schematic protein structures for isoforms of (A) PTP-3 and (B) SAX-7. TM, transmembrane segment; FNIII, Fibronectin Type III domain; Ig, immunoglobulin-like domain; PTP, protein tyrosine phosphatase domain. (C, D, F, G) Bundle width plots and dendrite order summary plots for (C, D) ptp-3(mu256) and (F, G) sax-7(ky146) at the developmental stages indicated. Animals with defasciculated dendrites are overlaid in pink on bundle width plots and were excluded from further analysis. (E, H) Expression patterns of (E) ptp-3b promoter and (H) sax-7S promoter driving nuclear mCherry (red). Dye-filling (green) was used to label six defined neurons as anatomical landmarks, and remaining neurons were identified by nuclei positions. Maximum-intensity projection images of L1-stage animals, top; schematic showing defined relative positions of amphid nuclei, bottom. A, AWA; B, AWB; C, AWC; D, AFD; E, ASE; F, ADF; G, ASG; H, ASH; I, ASI; J, ASJ; K, ASK; L, ADL.
Figure 5—figure supplement 1
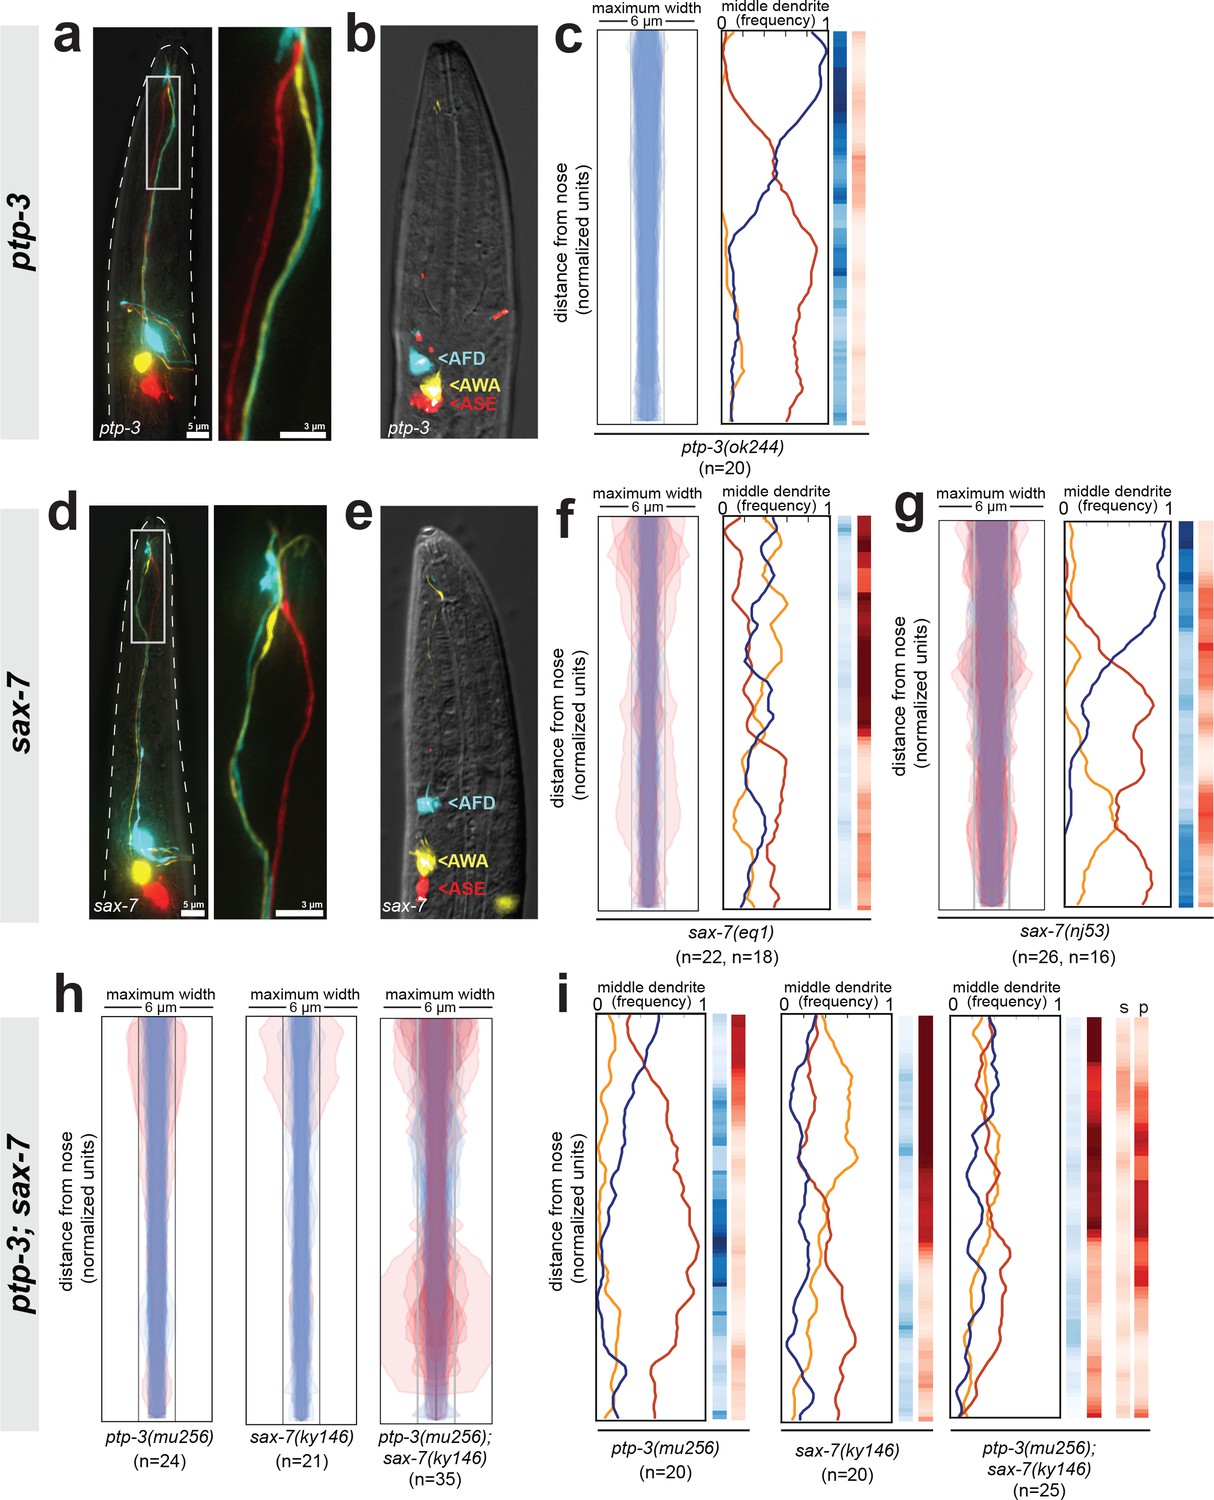
Fasciculation and dendrite order phenotypes in ptp-3, sax-7, and ptp-3; sax-7 mutants.
(A, D) Maximum-intensity projection images showing examples of defasciculation in (A) ptp-3(mu256) and (D) sax-7(ky146). Blue, AFD; yellow, AWA; red, ASE. (B, E) Cell body positions of AFD (blue), AWA (yellow), and ASE (red) neurons in (B) ptp-3(mu256) and (E) sax-7(ky146) animals shortly after hatching (L1 stage). n = 5 per genotype. AFD cell body is mispositioned in some sax-7 animals as previously reported (Sasakura et al., 2005) but the relative order of cell bodies is normal, compare to Figure 4—figure supplement 1B. (C, F, G) Bundle width plots and dendrite order summary plots for (C) ptp-3(ok244) which is predicted to disrupt only the PTP-3A isoform; (F) sax-7(eq1) which is predicted to disrupt both SAX-7 isoforms, similar to sax-7(ky146); and (G) sax-7(nj53) which is predicted to disrupt only SAX-7L and may lead to increased expression of SAX-7S (Sasakura et al., 2005). For each strain, p-value rankings are shown as in Figure 3: blue, indicated strain vs. random; red, indicated strain vs. wild type; darker shading represents greater differences between the populations. (H) Bundle width and (I) dendrite order summary plots comparing ptp-3(mu256) and sax-7(ky146) mutants with the ptp-3(mu256); sax-7(ky146) double mutant. For bundle width plots, individuals with defasciculated dendrites are overlaid in pink and were excluded from further analysis. For each strain, p-value rankings are shown as described above (blue, strain vs. random; red, strain vs. wild type) except the double mutant is also compared to the sax-7 (red, s) and ptp-3 (red, p) single mutants. All data are from 48 hr (L4) stage animals.
Figure 5—figure supplement 2
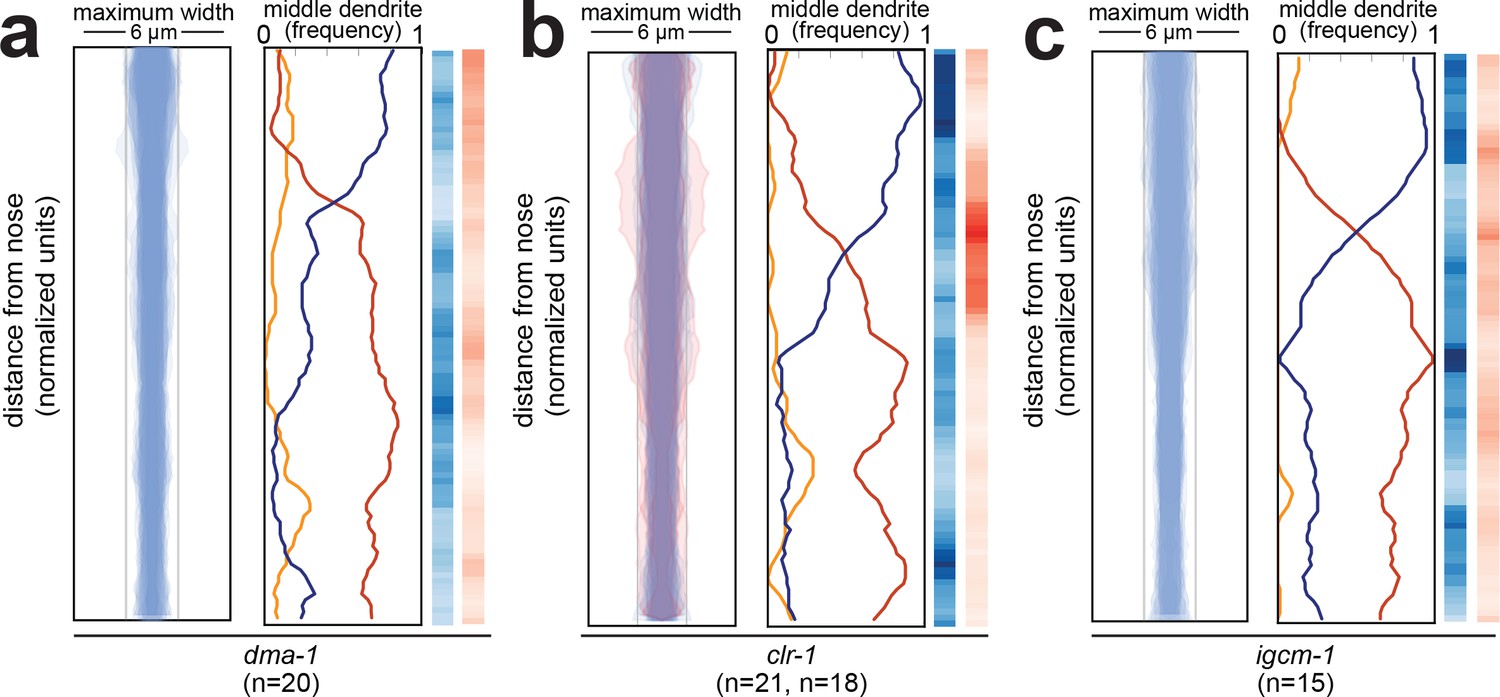
Fasciculation and dendrite order phenotypes in mutants disrupting SAX-7-interacting factors.
Bundle width and dendrite order summary plots for mutants disrupting factors that interact physically or genetically with SAX-7 or its homologs in other contexts (A) dma-1(wy686), (B) clr-1(e1745), (C) igcm-1(ok711). For bundle width plots, individuals with defasciculated dendrites are overlaid in pink and were excluded from further analysis. For each strain, p-value rankings are shown as described above (blue, mutant vs. random; red, mutant vs. wild type). All data are from 48 hr (L4) stage animals.
Figure 6
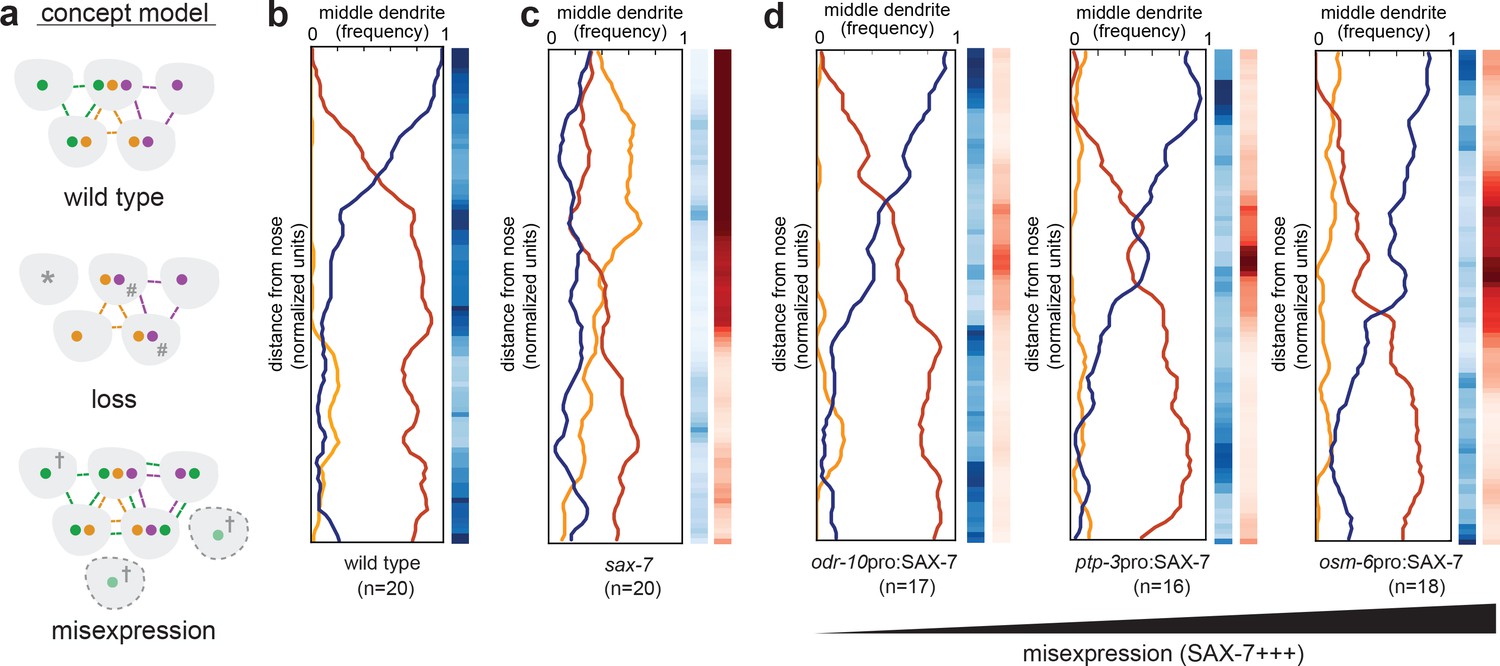
Misexpression of SAX-7 in all amphid neurons alters dendrite order.
(A) Concept model illustrating how differential expression of adhesion molecules (green, orange, purple) might lead to a stereotyped arrangement of dendrites (gray). In this version, loss of the green adhesion molecule might cause defasciculated dendrites (*) and more variable order due to dendrites becoming equivalent (#). Misexpression of the green adhesion molecule might lead to more variable order or to a different order due to altered partner preferences (†). (B–D) Dendrite order summary plots and statistical tests comparing (B) wild type (same data as Figure 2B), (C) sax-7(ky46) (same data as Figure 5G), and (D) misexpression of SAX-7S cDNA (SAX-7+++) under control of the indicated promoters: odr-10pro, strong expression in a single amphid neuron (AWA); ptp-3pro, low-level expression in several amphid neurons plus strong expression in ASE and AWB (see Figure 5E); osm-6pro, strong expression in most amphid neurons (see Figure 5E,H). 48 hr (L4) animals. p-value rankings as in Figure 3: blue, indicated strain vs. random; red, indicated strain vs. wild type; darker shading represents greater differences between the populations.
Tables
Table 1
Candidate screen to identify factors required for amphid dendrite fasciculation.
Candidate genes were selected from the literature based on known roles in axon fasciculation/guidance, enrichment in amphid neurons (aenriched in AWB or AFD, [Colosimo et al., 2004]), or physical interaction with SAX-7, as shown. Animals bearing the designated alleles were subjected to dye-filling, which brightly labels six amphid neurons (AWB, ASH, ASI, ASJ, ASK, ADL), and scored with a fluorescence stereomicroscope for defasciculated amphid bundles. Two mutants exhibited gross head morphology defects concomitant with defasciculation and were not pursued further (bgross head morphology defects).
| Candidate gene | Protein information and references | Allele(s) | Animals with defasciculated amphid bundles (percent, n = 50) |
|---|---|---|---|
| Mutants with known axon fasciculation/guidance defects | |||
| dig-1 | Immunoglobulin (Ig) superfamily; among largest secreted proteins in any animal (~1300 kDa) (Burket et al., 2006; Bénard et al., 2006) | n1321 | 24 |
| ptp-3 | LAR family protein tyrosine phosphatase (Ackley et al., 2005; Ch'ng et al., 2003) | mu256 | 14 |
| ok244 | 0 | ||
| sax-7a | L1 family/Neuroglian (Sasakura et al., 2005; Wang et al., 2005; Zallen et al., 1999) | ky146 | 12 |
| vab-1 | sole Eph receptor in C. elegans (George et al., 1998; Mohamed and Chin-Sang, 2006; Zallen et al., 1999) | dx31 | 10b |
| sax-3 | Robo (Slit receptor) (Zallen et al., 1998; Zallen et al., 1999) | ky123 | 8 b |
| cdh-4 a | Fat-like cadherin (Schmitz et al., 2008) | rh310 | 6 |
| unc-40 a | DCC (Netrin receptor) (Hedgecock et al., 1990) | e271 | 2 |
| fmi-1 a | Cadherin family (Najarro et al., 2012; Steimel et al., 2010) | rh308 | 0 |
| dgn-1 a | Dystroglycan family (Johnson et al., 2006; Johnson and Kramer, 2012) | cg121 | 0 |
| syg-1 a | IrreC/IRRE family (Shen and Bargmann, 2003) | ky652 | 0 |
| casy-1 | Calsyntenin family (Kim and Emmons, 2017) | ok739 | 0 |
| Other adhesion molecules enriched in amphid neurons | |||
| nrx-1 a | Neurexin family (Haklai-Topper et al., 2011) | wy778 | 2 |
| plx-2 a | Plexin (Semaphorin receptor) (Ikegami et al., 2004; Nakao et al., 2007) | ev773 | 0 |
| nlr-1 a | Neurexin/Caspr family (Haklai-Topper et al., 2011) | tm2050 | 0 |
| ptp-4 a | protein tyrosine phosphatase (Thompson et al., 2013) | gk715362 | 0 |
| rig-3 a | Ig superfamily (C. elegans Deletion Mutant Consortium, 2012) | ok2156 | 0 |
| scd-2 a | Receptor tyrosine kinase (C. elegans Deletion Mutant Consortium, 2012) | ok565 | 0 |
| igcm-1 a | Ig superfamily (C. elegans Deletion Mutant Consortium, 2012) | ok711 | 0 |
| Factors that physically interact with SAX-7 | |||
| dma-1 a | Leucine-rich repeat family (Liu and Shen, 2011) | wy686 | 0 |
| mnr-1 | Fam151 family (Dong et al., 2013; Salzberg et al., 2013) | wy758 | 0 |
Additional files
-
Supplementary file 1
Strains used in this study
- https://doi.org/10.7554/eLife.35825.014
-
Supplementary file 2
Transgenes used in this study
- https://doi.org/10.7554/eLife.35825.015
-
Supplementary file 3
Plasmids used in this study
- https://doi.org/10.7554/eLife.35825.016
-
Transparent reporting form
- https://doi.org/10.7554/eLife.35825.017
Download links
A two-part list of links to download the article, or parts of the article, in various formats.
Downloads (link to download the article as PDF)
Open citations (links to open the citations from this article in various online reference manager services)
Cite this article (links to download the citations from this article in formats compatible with various reference manager tools)
Ordered arrangement of dendrites within a C. elegans sensory nerve bundle
eLife 7:e35825.
https://doi.org/10.7554/eLife.35825


