Neurexin directs partner-specific synaptic connectivity in C. elegans
- University of Massachusetts Medical School, United States
- Assumption College, United States
Figures
Figure 1 with 2 supplements
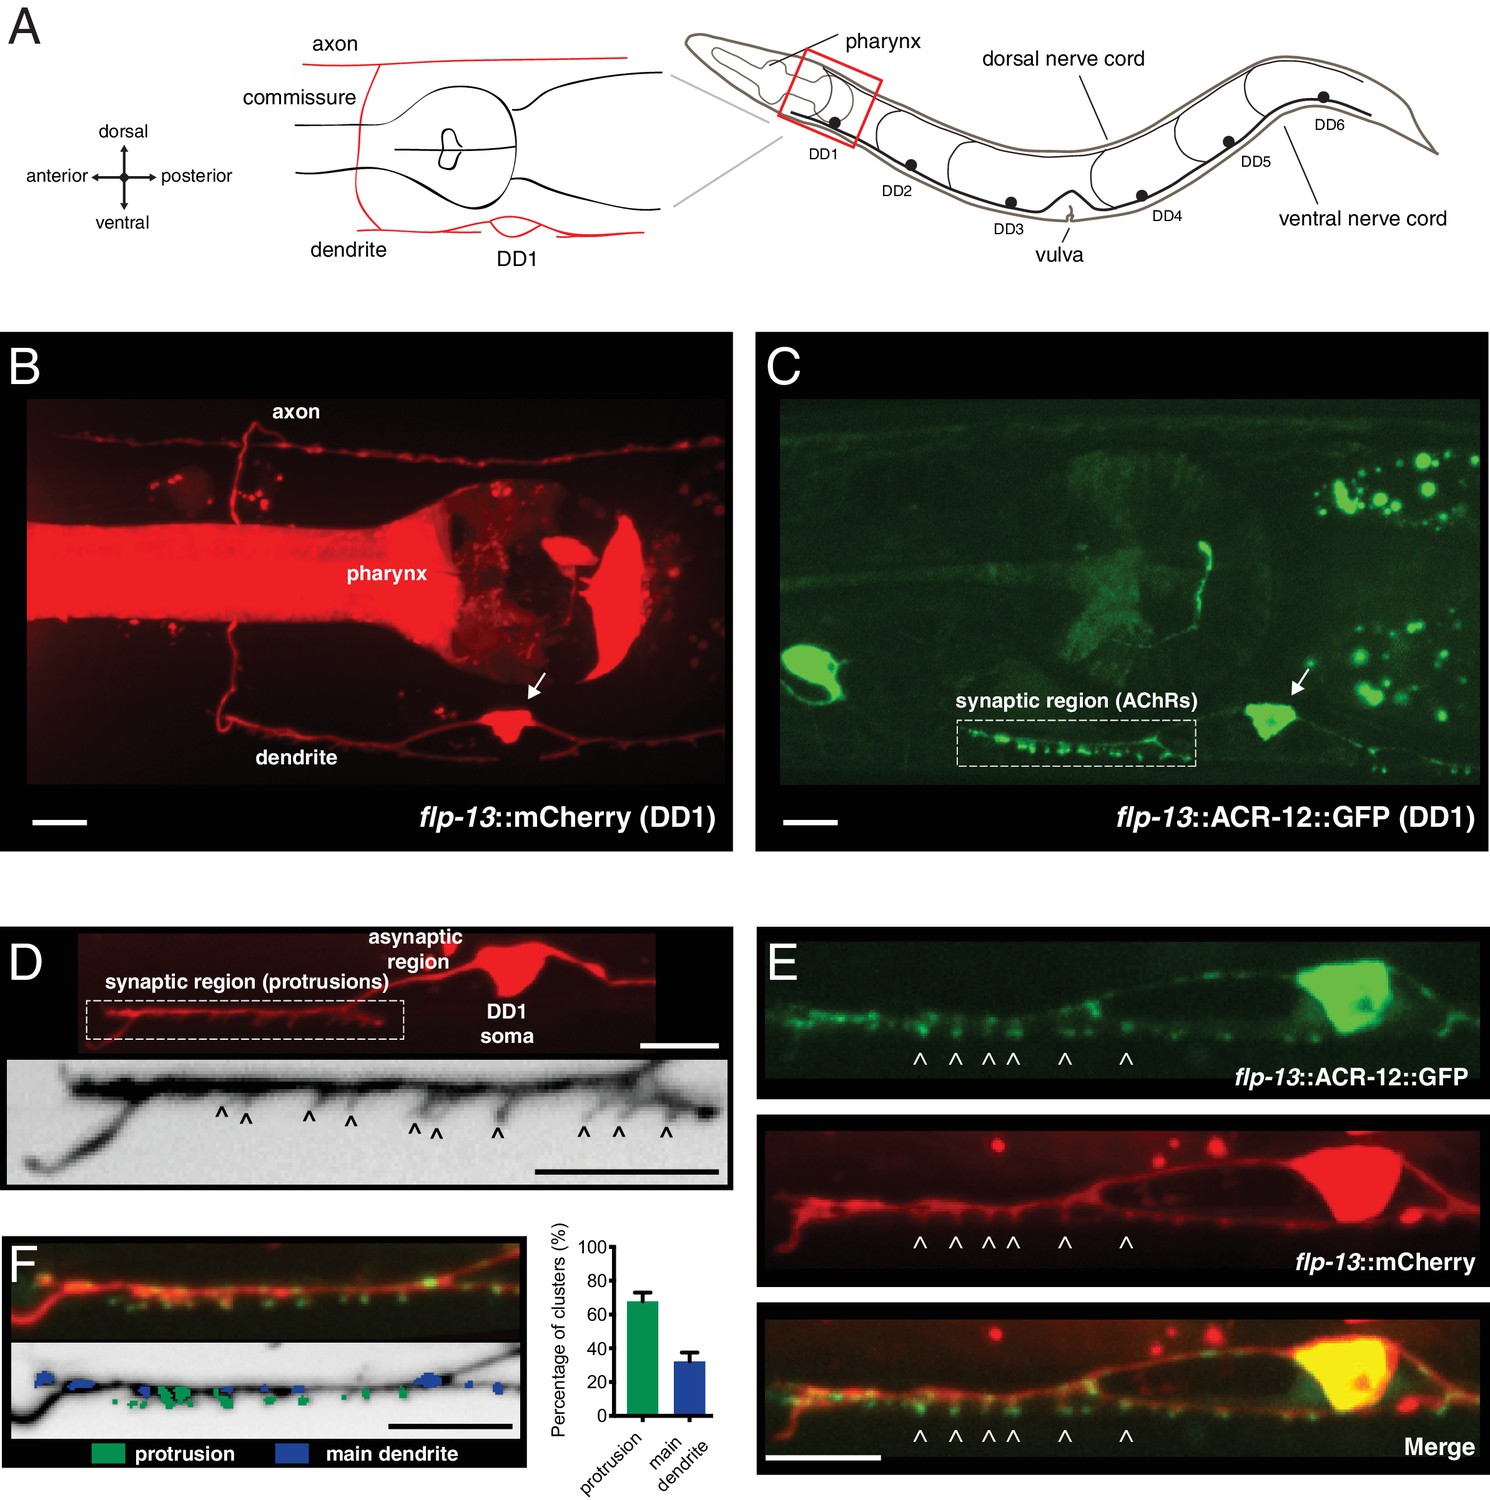
Characterization of post-synaptic specializations in the DD neurons.
(A) Diagrams of C. elegans showing the six DD GABAergic neurons in the ventral nerve cord and expanded view of DD1. After the L1/L2 transition, the DD neurons exclusively make dorsal synaptic outputs onto muscles (axon), while receiving a majority of synaptic inputs on the ventral side (dendrite). (B) Morphology of the DD1 neuron, visualized by expression of the flp-13::mCherry transcriptional reporter. Pharyngeal fluorescence indicates expression of the lgc-11::mCherry co-injection marker. Arrow indicates DD1 cell body. For this and all subsequent figures, images of L4 animals are shown unless otherwise noted. (C) Cholinergic ACR-12 receptors (flp-13::ACR-12::GFP) are localized to a defined region of the DD1 dendritic compartment, labeled as the synaptic region (boxed). Arrow indicates DD1 cell body. (D) Top, confocal image of the DD1 dendritic region visualized by expression of flp-13::mCherry. Bottom, inverted image showing expanded view of the synaptic region containing dendritic protrusions (indicated by arrowheads). (E) Confocal images of DD1 soma and synaptic region with coexpression of flp-13::ACR-12::GFP and flp-13::mCherry. Arrowheads indicate ACR-12 clusters located at the tips of dendritic protrusions. (F) Left, representative confocal image showing the distribution of ACR-12::GFP clusters. ACR-12::GFP receptor clusters associated with either protrusions (green) or the main dendritic shaft (blue) are indicated. Right, the percentage of clusters classified into each category (142 receptor clusters from 11 animals were analyzed). Scale bars, 5 μm (B–F).
-
Figure 1—source data 1
Raw values for synaptic vs asynaptic ACR-12::GFP receptor clusters.
- https://doi.org/10.7554/eLife.35692.006
-
Figure 1—source data 2
Raw values for wild type spine length, numbers of spines and ACR-12 receptor clusters throughout development.
Relates to Figure 1—figure supplements 1 and 2.
- https://doi.org/10.7554/eLife.35692.007
Figure 1—figure supplement 1
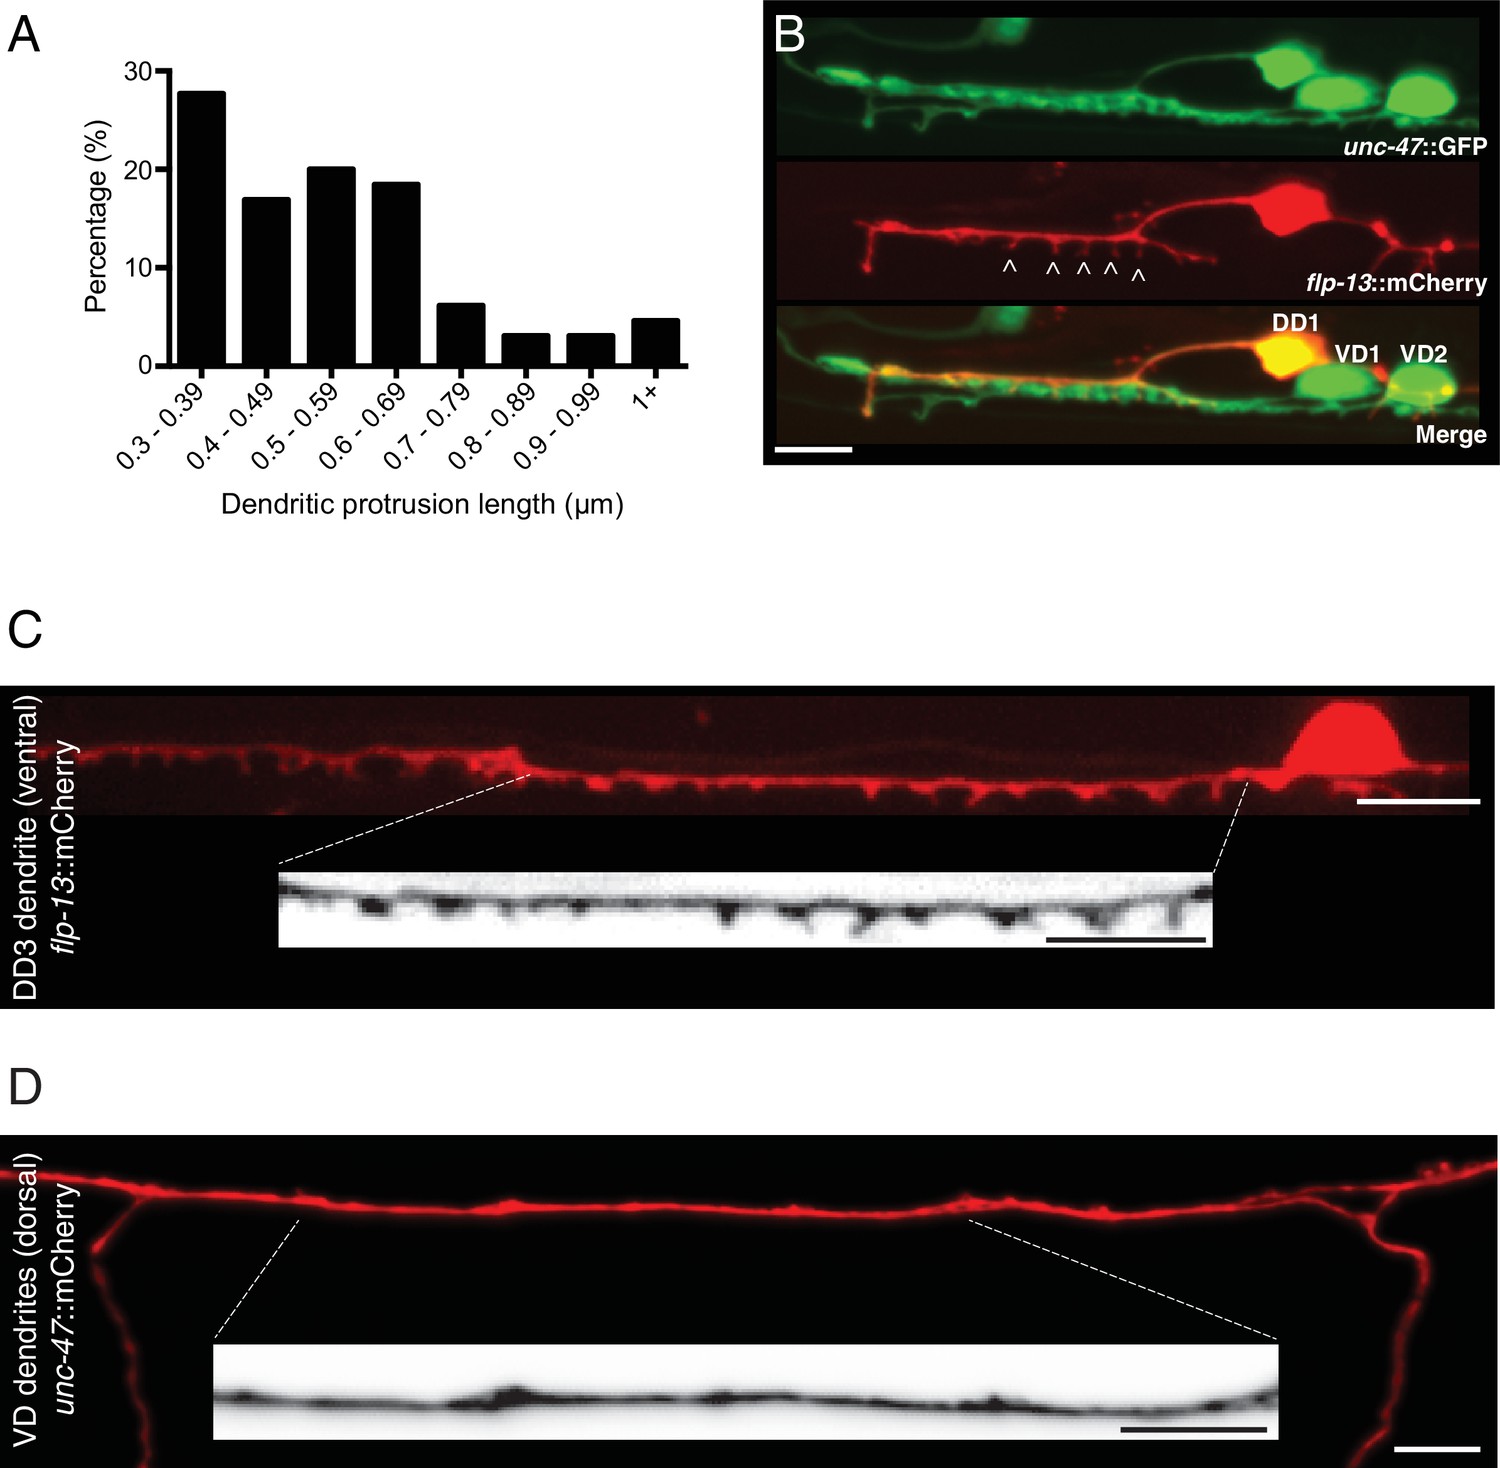
Spine-like protrusions are located on DD dendrites.
(A) Distribution of dendritic protrusion lengths. 65 protrusions from 11 L4 animals expressing flp-13::mCherry are included in the analysis. (B) DD1 and surrounding ventral cord region in an animal coexpressing flp-13::mCherry with unc-47::GFP. Spine-like protrusions are only evident with DD-specific labeling (flp-13). VD and DD cell bodies are indicated in the merge image. (C) Representative confocal image of spine-like protrusions in the DD3 dendrite (flp-13::mCherry) in wild type. Inverted image shows expanded view of the DD3 dendrite (indicated by dashed box). (D) Representative confocal image of VD dendrites (unc-47::mCherry) for an adult wild type animal. Inverted image shows expanded view of the dendritic region (indicated by dashed box). Scale bars, 5 μm (B–D).
Figure 1—figure supplement 2

Spine-like protrusions increase developmentally in a correlated manner with ACR-12 receptor clusters.
Quantification of the number of DD1 spine-like protrusions (red) or receptor clusters (green) at the indicated time points after hatch. Protrusions and receptor clusters from ≥10 animals were analyzed for each time point. ***p<0.001, ****p<0.0001, ANOVA with Tukey’s multiple comparisons test, spines/receptor clusters compared at time points 28 and 52 hr post hatch.
Figure 2 with 1 supplement
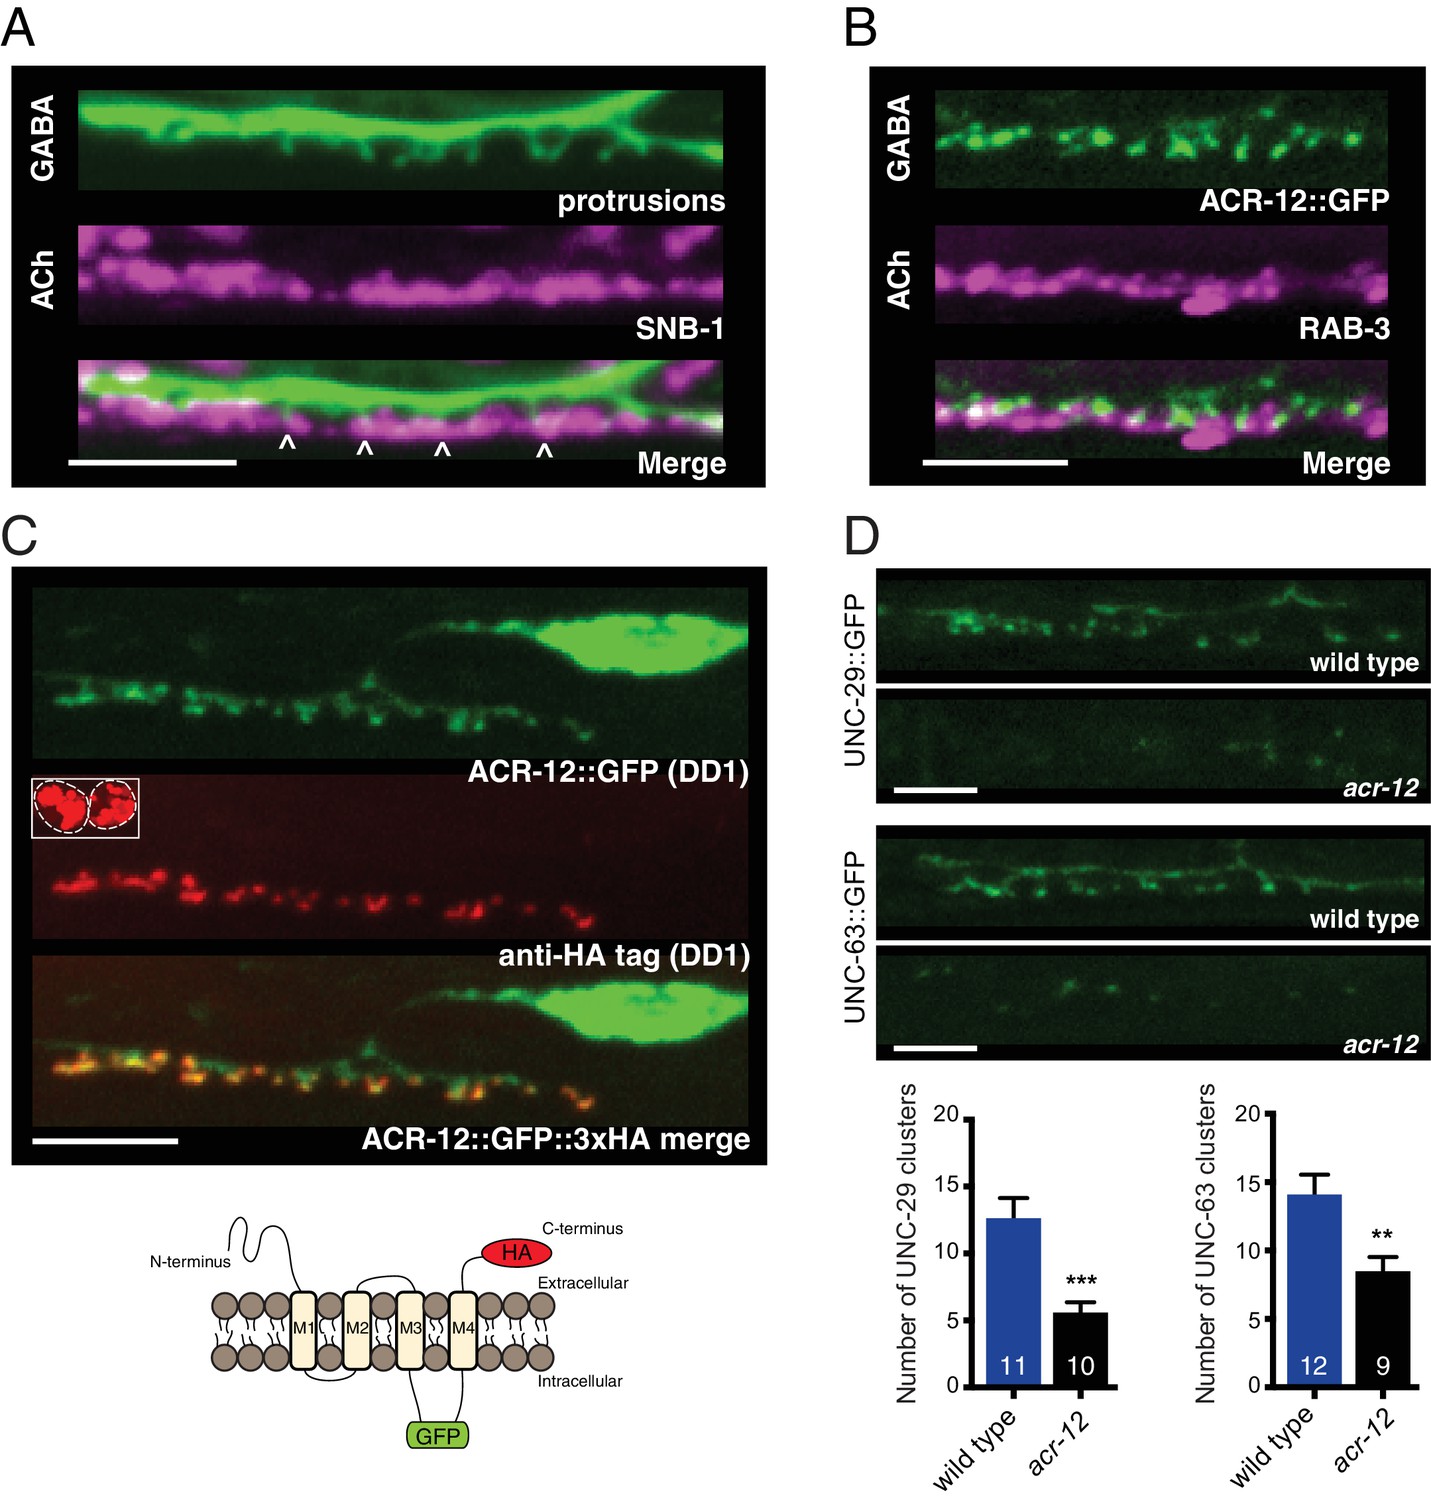
Heteromeric ACR-12 receptors are localized at the cell surface opposite sites of release.
(A) Confocal images of presynaptic (acr-2::SNB-1::GFP) and postsynaptic (flp-13::mCherry) domains in the DD1 synaptic region. Note violet/green coloring to more clearly depict presynaptic structures and protrusions (arrowheads). (B) Confocal images showing apposition of pre- and post-synaptic components with coexpression of the cholinergic synaptic vesicle marker acr-2::mCherry::RAB-3 (violet) and the AChR reporter ACR-12::GFP (green) in the DD1 synaptic region. (C) Top, confocal images showing ACR-12 receptor clusters as visualized by GFP fluorescence (green) or anti-HA antibody fluorescence (red) 6 hr following antibody injection. Note the extracellular location of the HA epitope tag (schematic below), enabling selective visualization of synaptic receptor clusters at the cell surface. Inset, anti-HA uptake by coelomocytes indicating successful injection. (D) Top, confocal images of UNC-29::GFP and UNC-63::GFP clusters in the DD1 dendrite (flp-13 promoter) in wild type or acr-12(ok367) mutants. Bottom, quantification of the average number of UNC-29::GFP and UNC-63::GFP clusters in the DD1 dendrite for wild type and acr-12(ok367) mutants. Each bar represents the mean ± SEM. For this and all subsequent figures, numbers in bars indicate the n for each genotype. **p<0.01, ***p<0.001, student’s t-test. Scale bars, 5 μm (A–D).
-
Figure 2—source data 1
Raw values for UNC-29::GFP and UNC-63::GFP receptor cluster number.
- https://doi.org/10.7554/eLife.35692.010
-
Figure 2—source data 2
Raw values for ACR-12::GFP receptor cluster number and normalized UNC-29::GFP and UNC-63::GFP fluorescence intensity.
Relates to Figure 2—figure supplement 1.
- https://doi.org/10.7554/eLife.35692.011
Figure 2—figure supplement 1

Mutations in specific AChR subunits and accessory proteins disrupt ACR-12 synaptic delivery and clustering.
(A) Confocal images of the DD1 cell body and synaptic region for a wild type animal expressing flp-13::ACR-12::GFP::3xHA. Animals were injected with anti-GFP antibodies conjugated to Alexa594 fluorophore and imaged six hours later. Inset, anti-GFP uptake by coelomocytes indicating successful injection, but lack of synaptic ACR-12 labeling due to intracellular location of GFP moiety. Scale bar, 5 μm. (B) Quantification of the average number of ACR-12::GFP clusters in the DD1 synaptic region for the genotypes indicated. For B and C, rescue refers to specific expression of the wild type cDNAs indicated in GABAergic neurons (unc-47 promoter). Each bar represents the mean ± SEM. ****p<0.0001 compared to wild type, ####p<0.0001 compared to the indicated mutant genotype, ANOVA with Tukey’s multiple comparisons test. (C) Confocal images of ACR-12::GFP in the DD1 synaptic region for the genotypes indicated. Scale bar, 5 μm. (D–E) Quantification of the total UNC-29::GFP (D) or UNC-63::GFP (E) fluorescence in the DD1 synaptic region (flp-13 promoter) normalized to wild type control for the genotypes indicated. **p<0.01, student’s t-test.
Figure 3 with 4 supplements
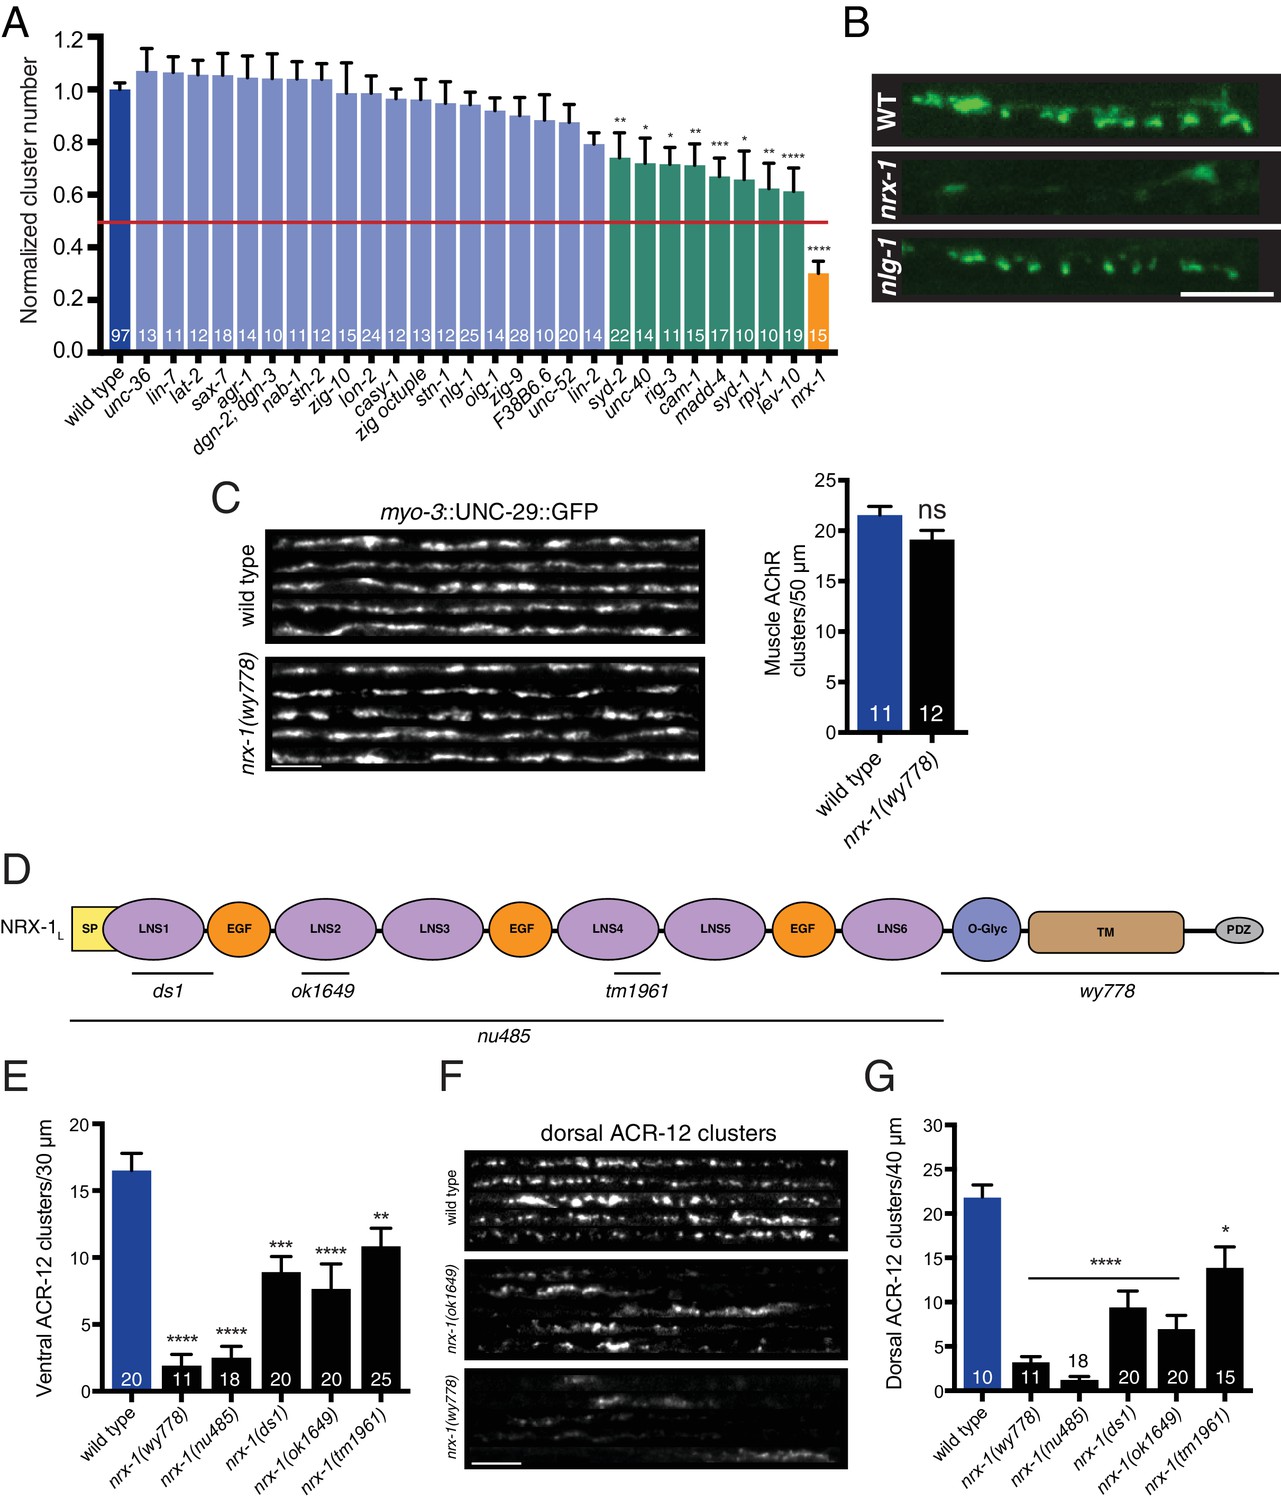
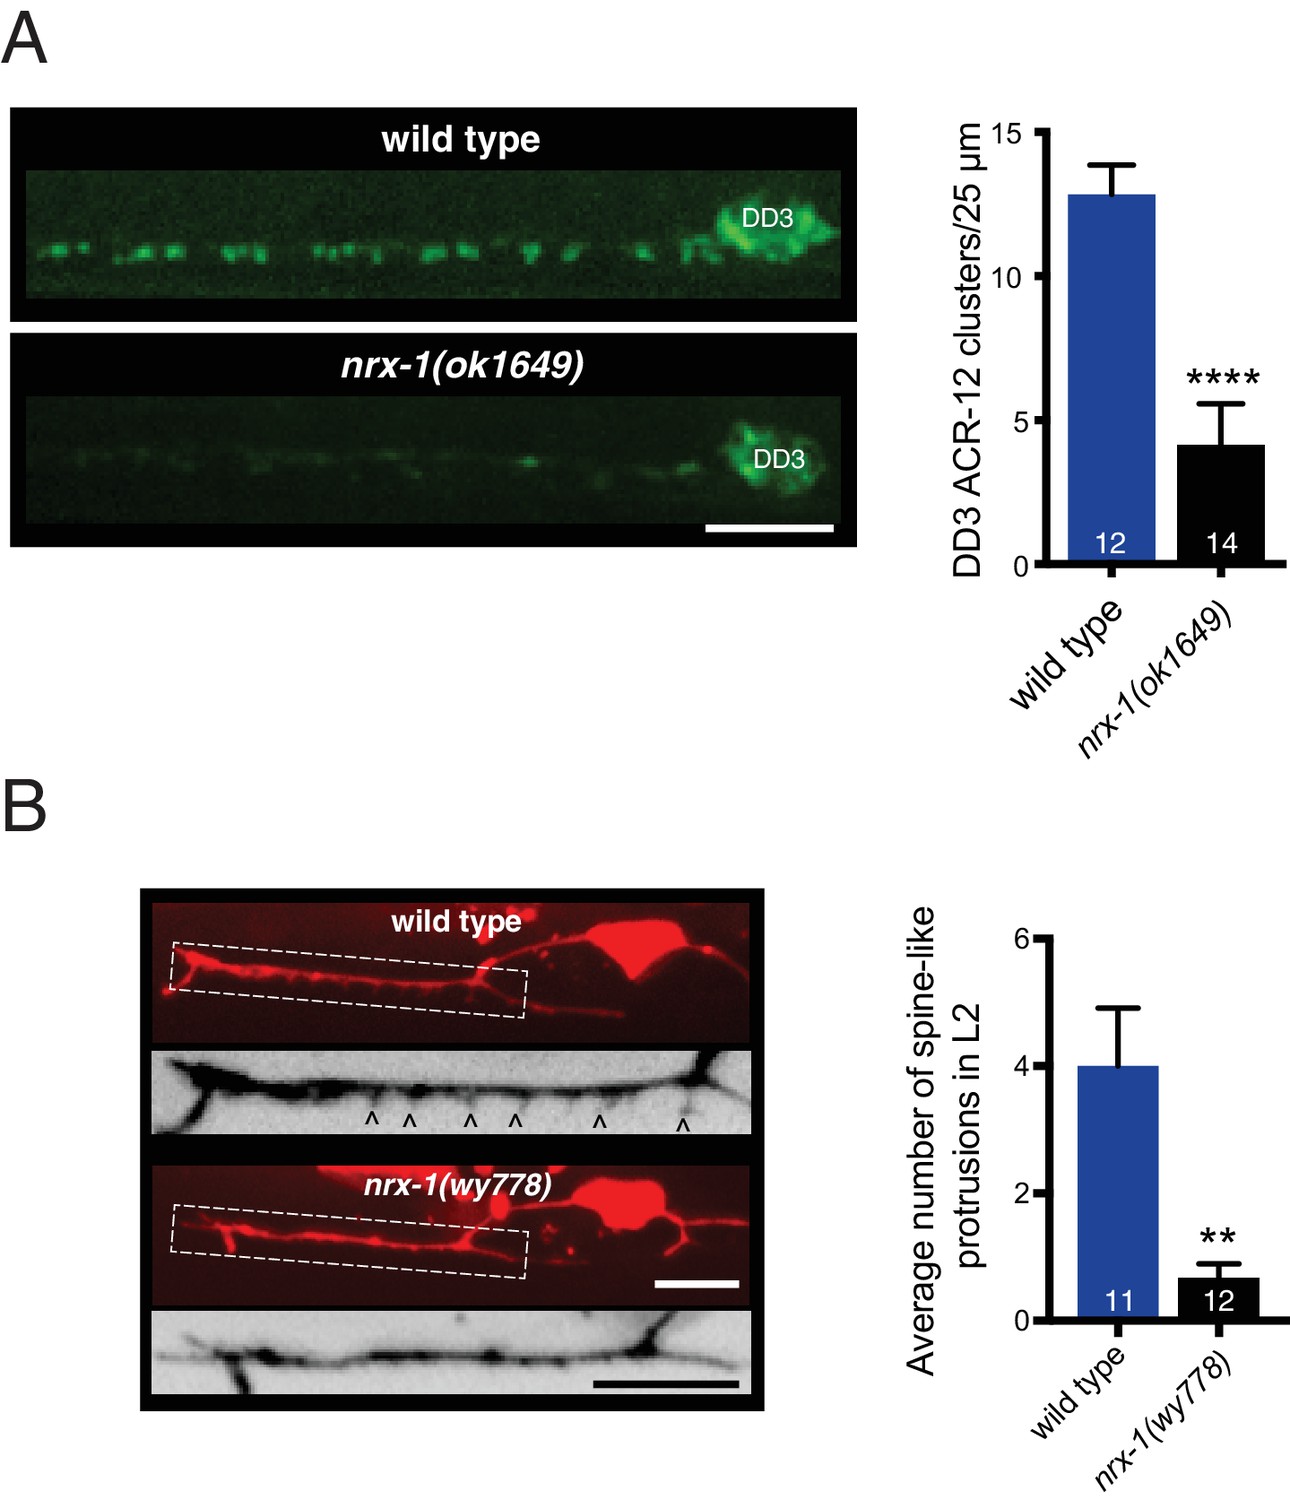
nrx-1/neurexin is required for AChR localization in GABAergic motor neurons, but not muscles.
(A) Quantification of ACR-12::GFP clusters in the synaptic region of the DD1 dendrite for the genotypes indicated, normalized to wild type. Red line indicates 50% reduction in puncta number. Colored bars indicate wild type (blue), no effect (light blue), modest effect (green), and severe clustering defects (orange). *p<0.05, **p<0.01, ***p<0.001, ****p<0.0001, ANOVA with Dunnett’s multiple comparisons test. (B) Representative confocal images showing ACR-12::GFP clusters in the synaptic region of the DD1 dendrite for wild type (WT), nrx-1(ok1649), and nlg-1(ok259) mutants. Scale bar, 5 μm. (C) Left, representative confocal images of the dorsal nerve cord region from five wild type and nrx-1(wy778) adult animals expressing myo-3::UNC-29::GFP to label muscle AChRs. Scale bar, 5 μm. Right, quantification of UNC-29::GFP clusters in a 50 μm region of the posterior dorsal nerve cord. (D) Domain structure of the NRX-1 long isoform (NRX-1L). Deletion regions are indicated (black line). N-terminal signal peptide (SP), extracellular LNS, EGF, transmembrane (TM), PDZ binding (PDZ) domains, and O-linked glycosylation site are shown. (E) Quantification of ACR-12 receptor clusters (unc-47::ACR-12::GFP) in the ventral nerve cord for the genotypes indicated. **p<0.01, ***p<0.001, ****p<0.0001, ANOVA with Dunnett’s multiple comparisons test. (F) Representative confocal images showing dorsal nerve cord ACR-12 receptor clusters for five wild type, nrx-1(ok1649), and nrx-1(wy778) animals expressing unc-47::ACR-12::GFP. Scale bar, 5 μm. (G) Quantification of ACR-12 receptor clusters (unc-47::ACR-12::GFP) in the dorsal nerve cord for the genotypes indicated. *p<0.05, ****p<0.0001, ANOVA with Dunnett’s multiple comparisons test.
-
Figure 3—source data 1
Raw values for normalized ACR-12::GFP receptor clusters, muscle UNC-29::GFP receptor clusters, and ventral/dorsal ACR-12::GFP receptor clusters in nrx-1mutants.
- https://doi.org/10.7554/eLife.35692.017
-
Figure 3—source data 2
Raw values for UNC-29::GFP and UNC-63::GFP receptor cluster number, normalized wild type and nrx-1 dendrite fluorescence, and SNB-1::GFP clusters.
Relates to Figure 3—figure supplements 1, 2 and 3.
- https://doi.org/10.7554/eLife.35692.018
Figure 3—figure supplement 1
Description of genes surveyed in candidate-based genetic screen.
Description of genes surveyed in Figure 3A and their relation to mammalian genes. Candidates predominantly encode scaffold and cell-cell interaction proteins previously implicated in synapse formation.
Figure 3—figure supplement 2
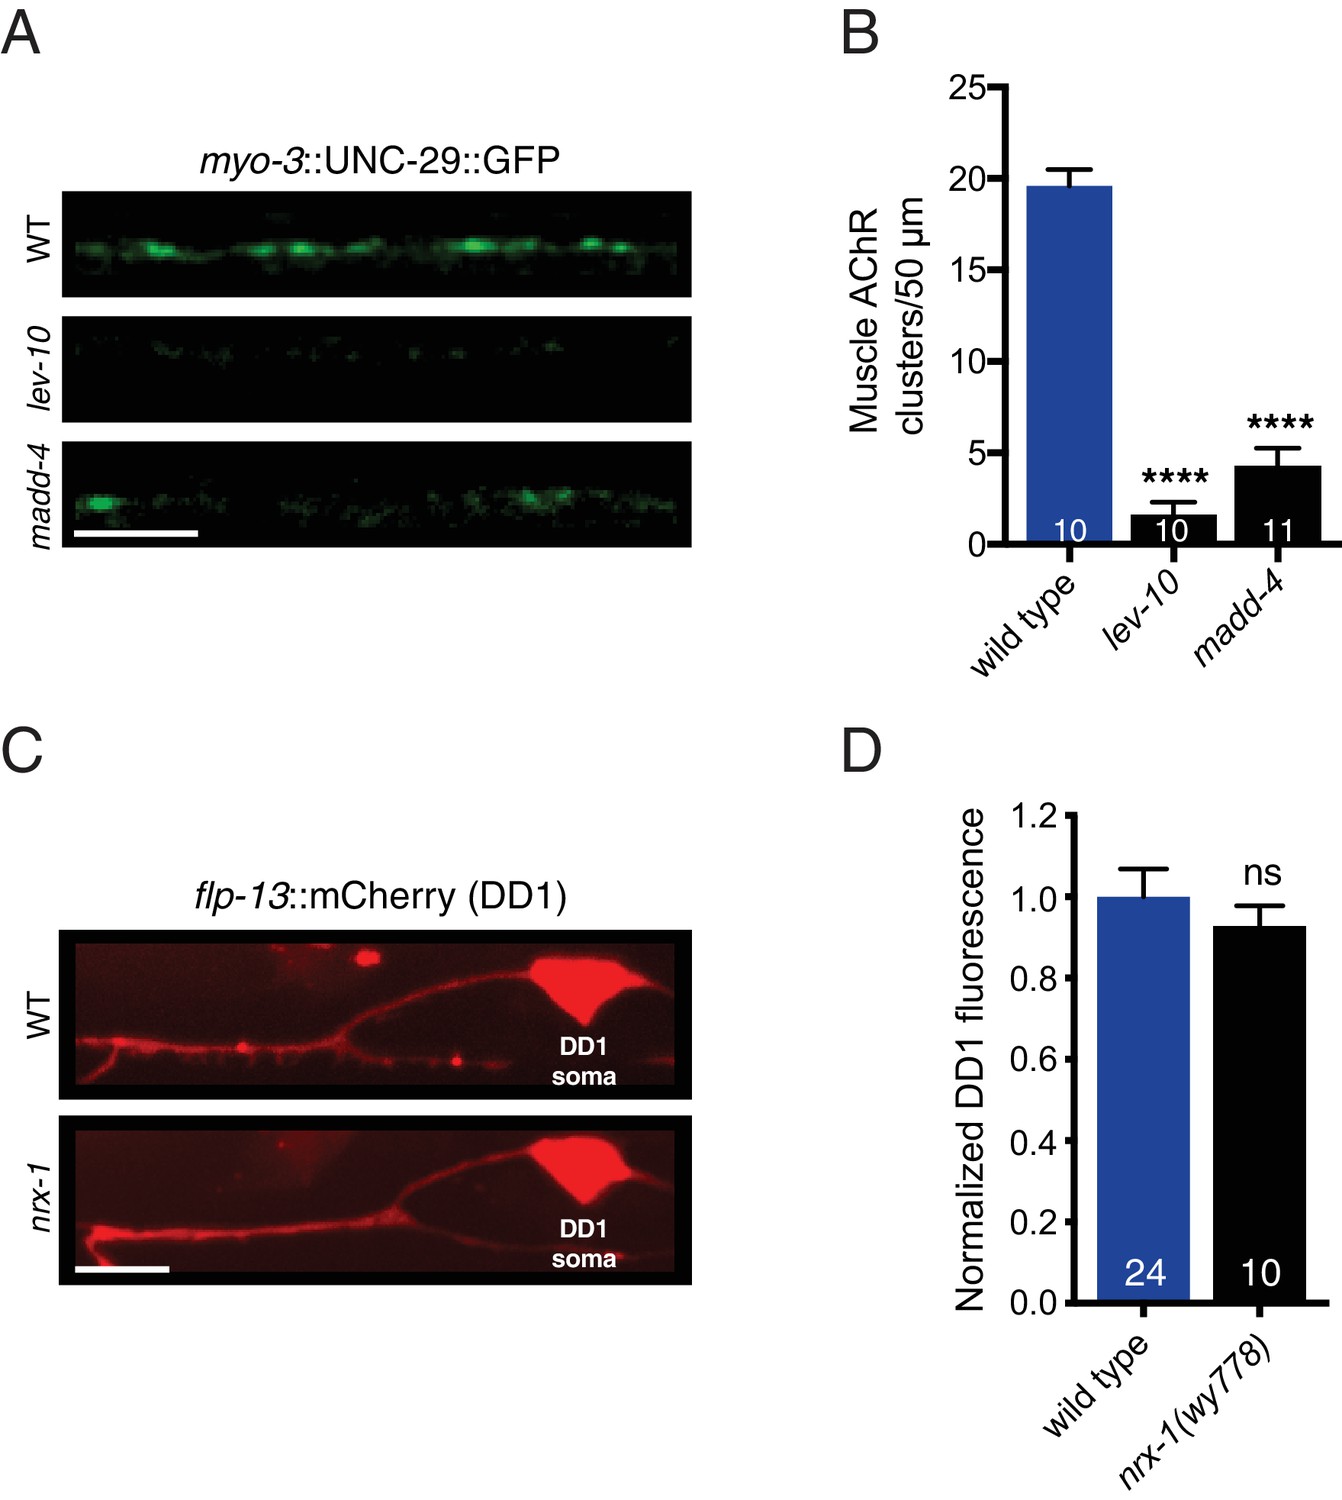
LEV-10 and MADD-4 are required for muscle L-AChR clustering, and nrx-1 deletion does not disrupt transgene expression.
(A) Representative confocal images of the adult dorsal nerve cord region in wild type (WT), lev-10(ok2111), and madd-4(ok2854) mutants expressing myo-3::UNC-29::GFP. Scale bar, 5 μm. (B) Quantification of muscle UNC-29::GFP clusters in a 50 μm region of the posterior dorsal nerve cord. ****p<0.0001, ANOVA with Dunnett’s multiple comparisons test. (C) Representative confocal images of flp-13::mCherry DD1 fluorescence in wild type (WT) and nrx-1(wy778) mutant. Scale bar, 5 μm. (D) Quantification of flp-13::mCherry fluorescence in the DD1 dendrite for the genotypes indicated, normalized to wild type control. ns = not significant, student’s t-test.
Figure 3—figure supplement 3
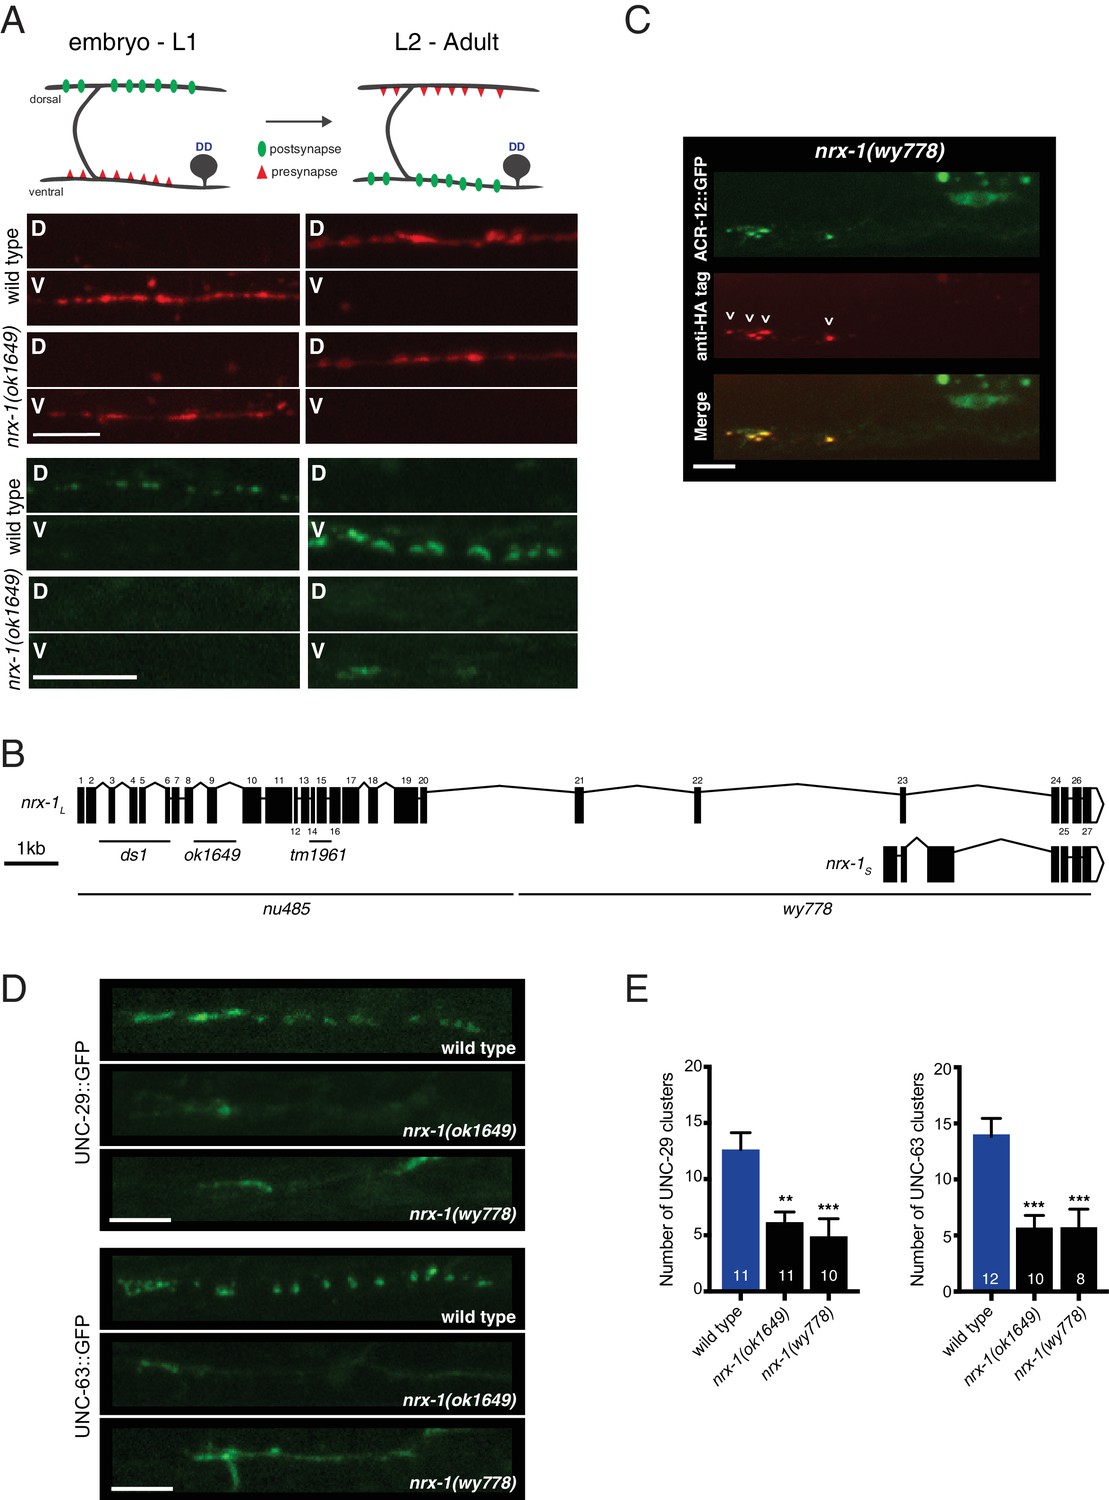
Loss of functional nrx-1 disrupts ACR-12 AChR localization, but nrx-1 is not required for AChR membrane insertion or synaptic remodeling.
(A) Top, schematic depicting pre-synaptic (red) and post-synaptic (green) remodeling of DD motor neurons during development. Bottom, confocal images of wildtype and nrx-1(ok1649) mutants imaged before (<14 hr after hatch) and after (approximately 20 hr after hatch) the remodeling process. The presynapse is labeled with flp-13::mCherry::RAB-3 (red), while the postsynapse is labeled with flp-13::ACR-12::GFP (green). D indicates dorsal, V indicates ventral. Scale bars, 5 μm. (B) Schematic representation of the nrx-1 locus, including long (nrx-1L) and short (nrx-1S) isoforms. Regions affected by available deletions are indicated (black lines). Exons (shaded boxes) are numbered and connected by lines representing introns. (C) Confocal images of the DD1 cell body and synaptic region for nrx-1(wy778) mutants expressing flp-13::ACR-12::GFP::3xHA. Animals were injected with anti-HA AlexaFluor594 antibodies (red) to label surface receptors and imaged six hours later. Scale bar, 5 μm. (D) Confocal images of UNC-29::GFP (top) and UNC-63::GFP (bottom) in the DD1 synaptic region (flp-13 promoter) for the genotypes indicated. Scale bars, 5 μm. (E) Quantification of UNC-29::GFP (left) and UNC-63::GFP (right) clusters in the synaptic region of the DD1 dendrite in wild type and nrx-1 mutants. Control data are the same as in Figure 2D. **p<0.01, ***p<0.001, ANOVA with Dunnett’s multiple comparisons test.
Figure 3—figure supplement 4
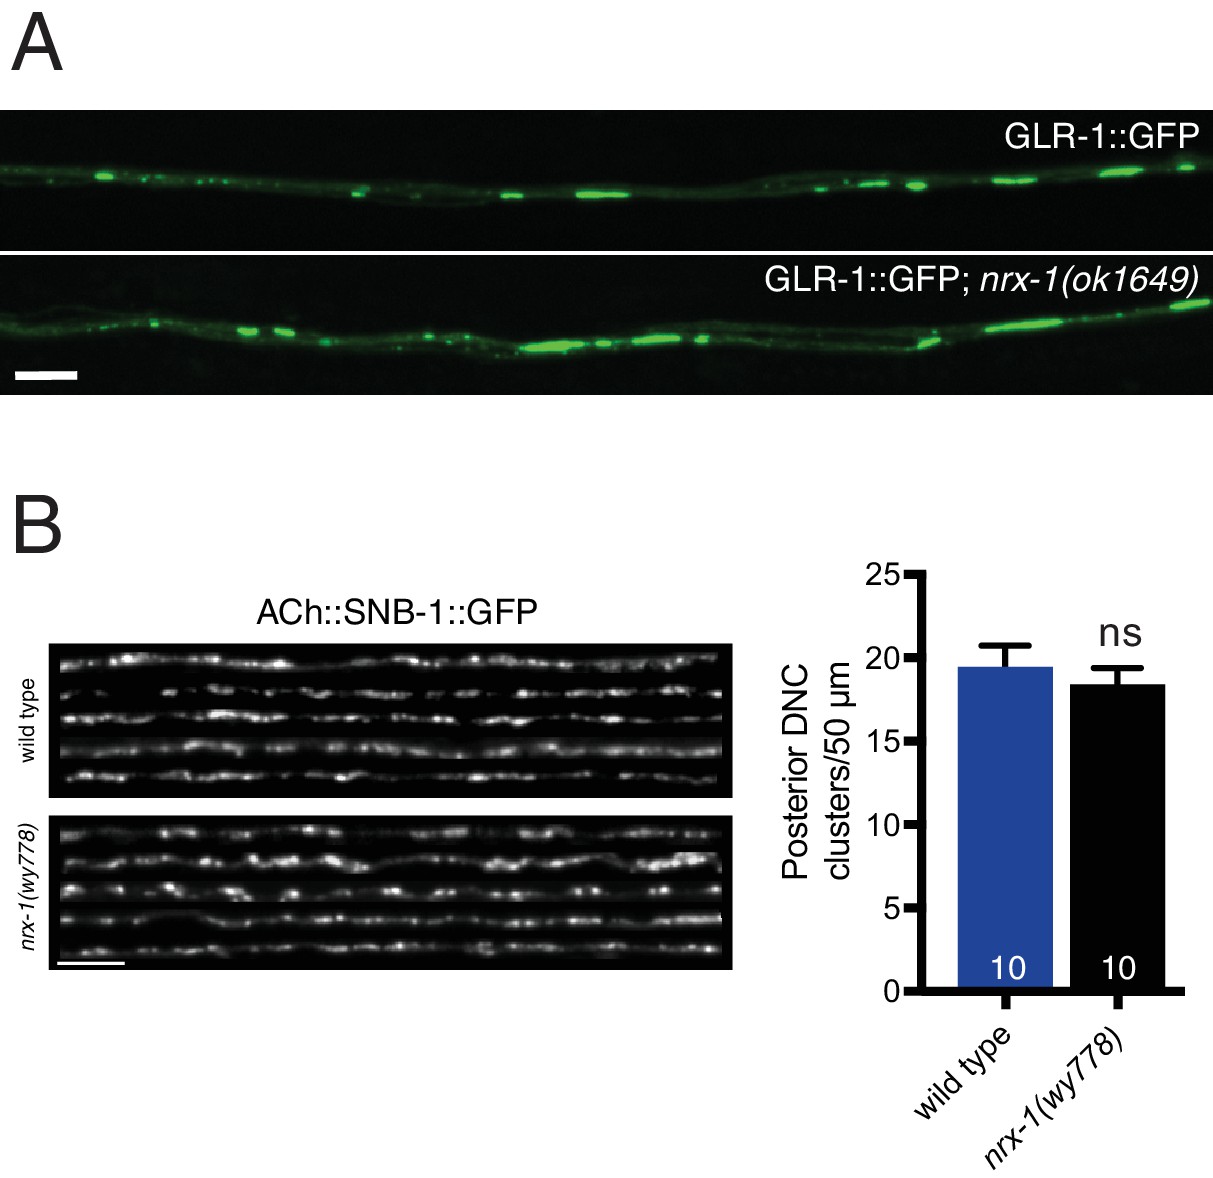
Neurexin is not essential for AMPAR localization or synaptic vesicle clustering in cholinergic motor neurons.
(A) Representative confocal images of GLR-1::GFP in the anterior ventral nerve cord of adult animals. Scale bar, 5 μm. (B) Left, representative confocal images of the dorsal nerve cord from five wild type and nrx-1(wy778) adult animals expressing acr-2::SNB-1::GFP. Scale bar, 5 μm. Right, quantification of SNB-1::GFP clusters in a 50 μm region of the posterior dorsal nerve cord. ns = not significant, student’s t test.
Figure 4 with 1 supplement

Synaptic architecture is dependent on nrx-1/neurexin.
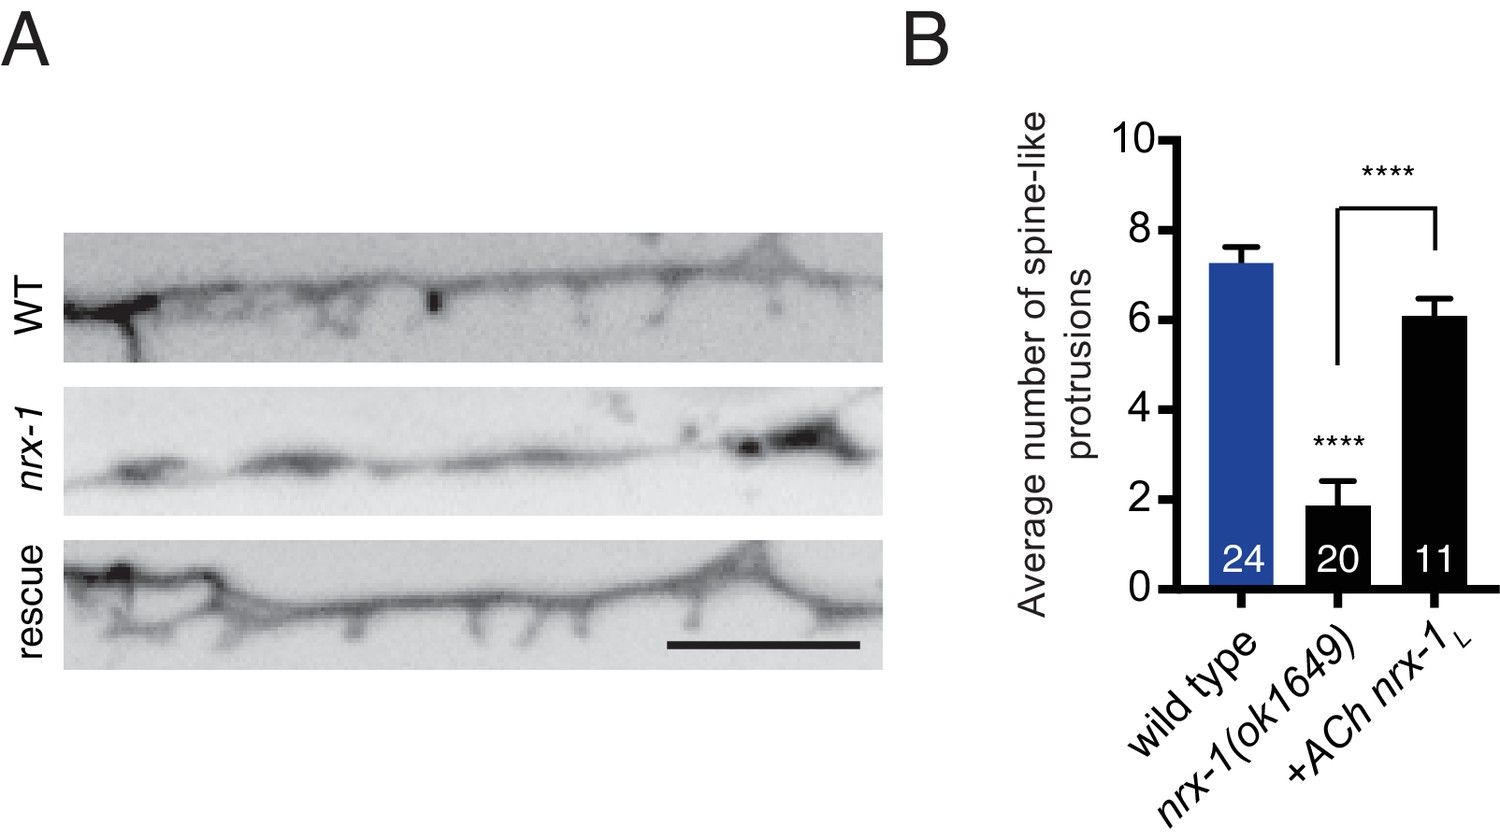
(A) Fluorescent confocal images of spine-like protrusions in the synaptic region of the DD1 dendrite (flp-13::mCherry) for the genotypes indicated. Inverted images show expanded views of the synaptic regions (indicated by dashed boxes in fluorescent images). Scale bar, 5 μm. (B) Quantification of spine-like protrusions in the DD1 dendrite for the genotypes indicated. ****p<0.0001, ANOVA with Dunnett’s multiple comparisons test. (C) Left, fluorescent confocal images of spine-like protrusions (arrowheads) in the DD3 neuron dendrite (flp-13::mCherry) for wild type and nrx-1(wy778) mutants. Inverted images show expanded views of the DD3 dendrites (indicated by dashed boxes in fluorescent images). Scale bars, 5 μm. Right, quantification of spine-like protrusions in the DD3 dendrite (25 μm region anterior to the cell body) for wild type and nrx-1(wy778) mutants. ****p<0.0001, student’s t-test.
-
Figure 4—source data 1
Raw values for spine-like protrusion number.
- https://doi.org/10.7554/eLife.35692.021
-
Figure 4—source data 2
Raw values for adult ACR-12::GFP receptor cluster number in DD3 and DD1 spine-like protrusion number at L2.
Relates to Figure 4—figure supplement 1.
- https://doi.org/10.7554/eLife.35692.022
Figure 4—figure supplement 1
NRX-1 is required for ACR-12 receptor clustering and spine outgrowth in DD motor neurons.
(A) Left, representative confocal images of ACR-12::GFP clusters in the dendrite of the DD3 neuron (flp-13 promoter) for wild type and nrx-1(ok1649) mutants. Scale bar, 5 μm. Right, quantification of ACR-12::GFP receptor clusters in the DD3 dendrite (25 μm region anterior to the cell body) for wild type and nrx-1(ok1649) mutants. ****p<0.0001, student’s t-test. (B) Left, representative confocal images of the DD1 synaptic region in second larval stage wild type and nrx-1(wy778) mutants expressing flp-13::mCherry. Arrowheads indicate spine-like protrusions. Inverted images show expanded views of the synaptic regions (indicated by dashed boxes in fluorescent images). Scale bars, 5 μm. Right, quantification of DD1 spine-like protrusions in second larval stage animals for wild type and nrx-1(wy778) mutants. **p<0.01, student’s t test.
Figure 5 with 3 supplements
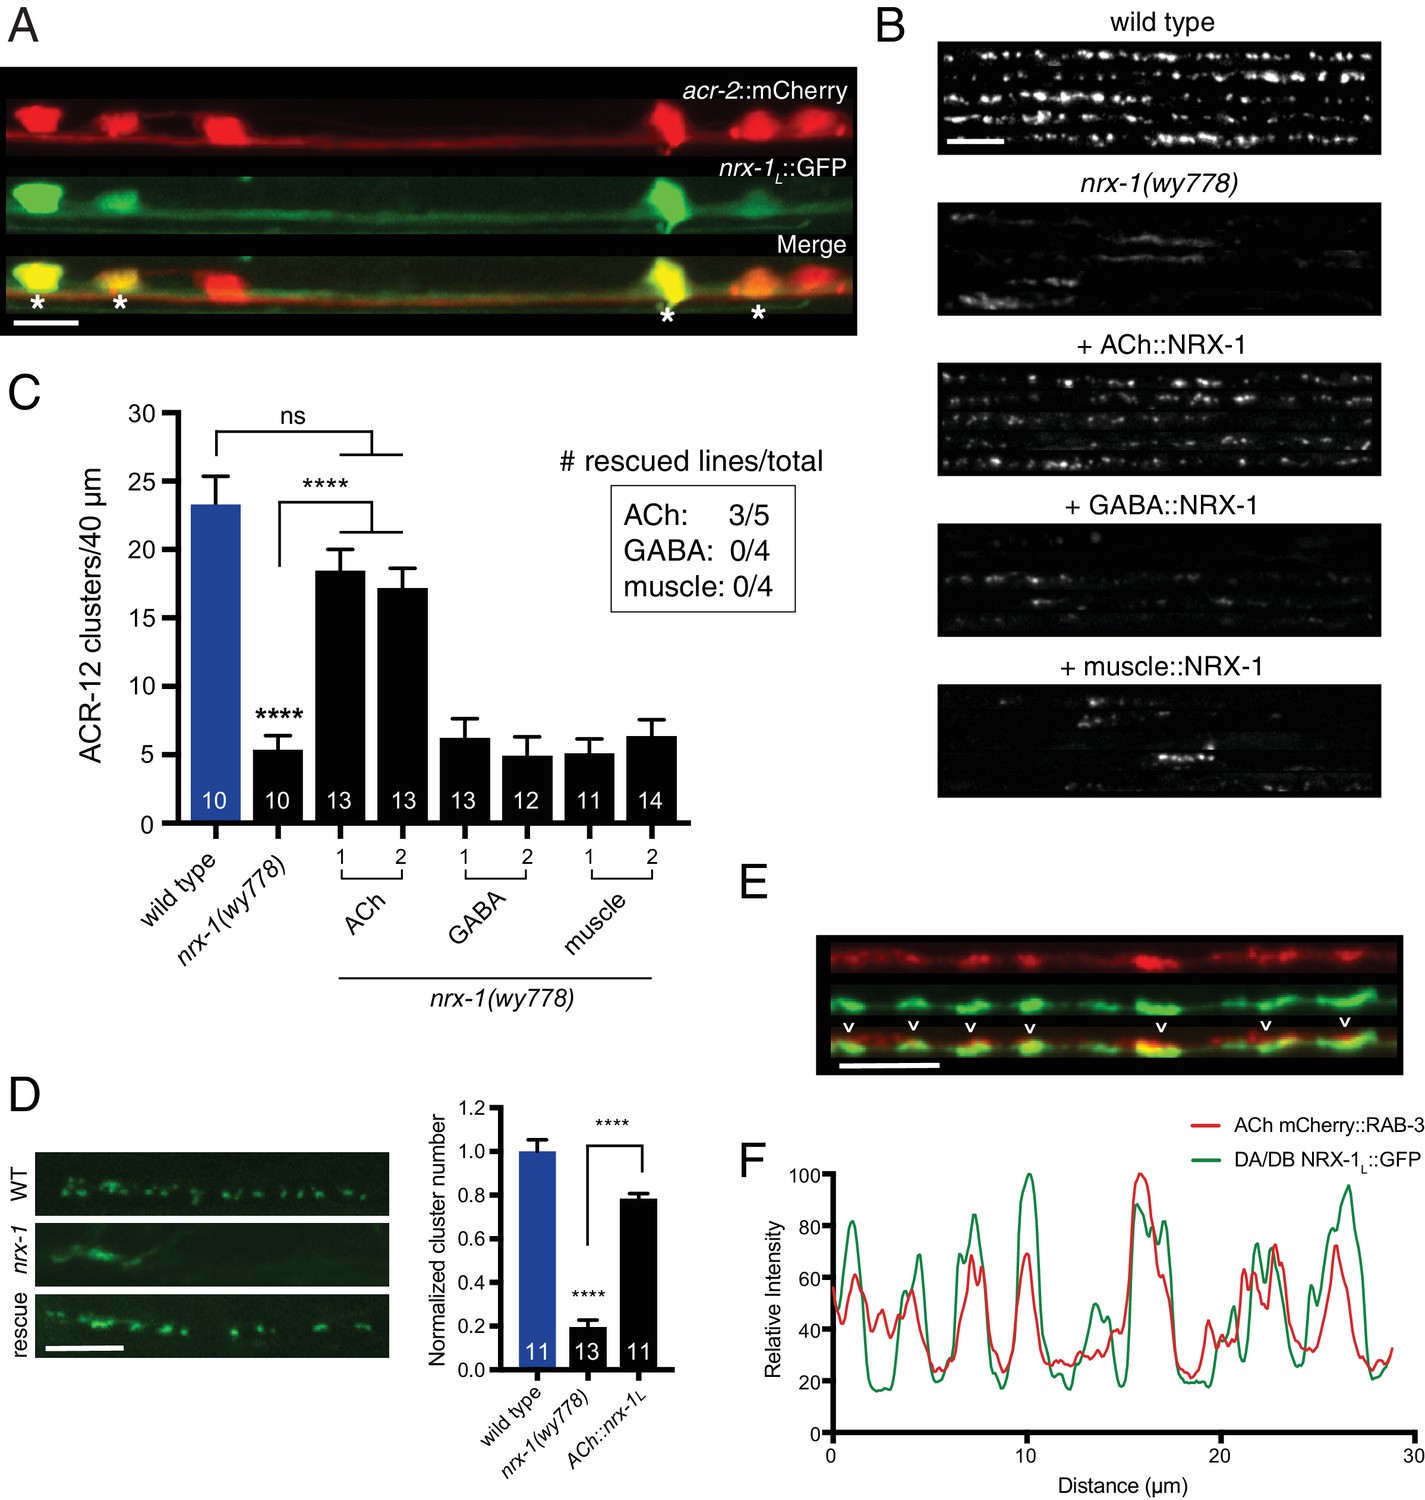
Cell-specific expression of neurexin in cholinergic motor neurons restores ACR-12 localization to synapses.
(A) Confocal images of the ventral nerve cord in a transgenic strain expressing nrx-1L::GFP together with the cholinergic motor neuron marker acr-2::mCherry. Asterisks indicate coexpression. Scale bar, 5 μm. (B) Confocal images of the dorsal nerve cord (unc-47::ACR-12::GFP) for the genotypes indicated. For each, five representative images are shown. In B and C, rescue was evaluated by cholinergic (unc-17β promoter), GABAergic (unc-47 promoter), or muscle-specific (myo-3 promoter) expression of a NRX-1L minigene in nrx-1(wy778) mutants. Scale bar, 5 μm. (C) Quantification of ACR-12::GFP receptor clusters in the dorsal nerve cord for the genotypes indicated. ****p<0.0001, ns = not significant, ANOVA with Tukey’s multiple comparisons test. Two transgenic lines are shown for each rescue construct. Inset, number of rescuing lines/total transgenic lines tested for each construct. (D) Left, confocal images of ACR-12::GFP clusters in the DD1 synaptic region for the genotypes indicated. Rescue refers to cholinergic expression (ufEx1114, line #1 in Figure 5C) of NRX-1L in nrx-1(wy778) mutants. Scale bar, 5 μm. Right, quantification of ACR-12::GFP clusters in the DD1 synaptic region for the genotypes indicated, normalized to control (ufEx441). ****p<0.0001, ANOVA with Tukey’s multiple comparisons test. (E) Confocal images of the dorsal nerve cord in an adult animal expressing NRX-1L::GFP (unc-129 promoter) with mCherry::RAB-3 (acr-2 promoter). Colocalization is indicated by arrowheads. Scale bar, 5 μm. (F) Line scans showing relative fluorescent intensity of NRX-1L::GFP (green) and mCherry::RAB-3 (red) for a 30 μm region of the dorsal nerve cord.
-
Figure 5—source data 1
Raw values for ACR-12::GFP receptor cluster number with expression of neurexin rescuing constructs and for colocalization of mCherry::Rab-3 and NRX-1::GFP fluorescence.
- https://doi.org/10.7554/eLife.35692.027
-
Figure 5—source data 2
Raw values for spine-like protrusions and ACR-12::GFP receptor clustering with rescue constructs, and for NRX-1::GFP fluorescence in indicated mutants.
Relates to Figure 5—figure supplements 1, 2 and 3.
- https://doi.org/10.7554/eLife.35692.028
Figure 5—figure supplement 1
NRX-1 acts presynaptically to regulate spine outgrowth.
(A) Inverted images of spine-like protrusions in the synaptic region of the DD1 dendrite (flp-13::mCherry) for the genotypes indicated. Rescue refers to cholinergic expression (ufEx1114) of NRX-1L in nrx-1(ok1649) mutants. Scale bar, 5 μm. (B) Quantification of spine-like protrusions in the DD1 dendrite for the genotypes indicated. Control data are the same as in Figure 4B. ****p<0.0001, ANOVA with Tukey’s multiple comparisons test.
Figure 5—figure supplement 2
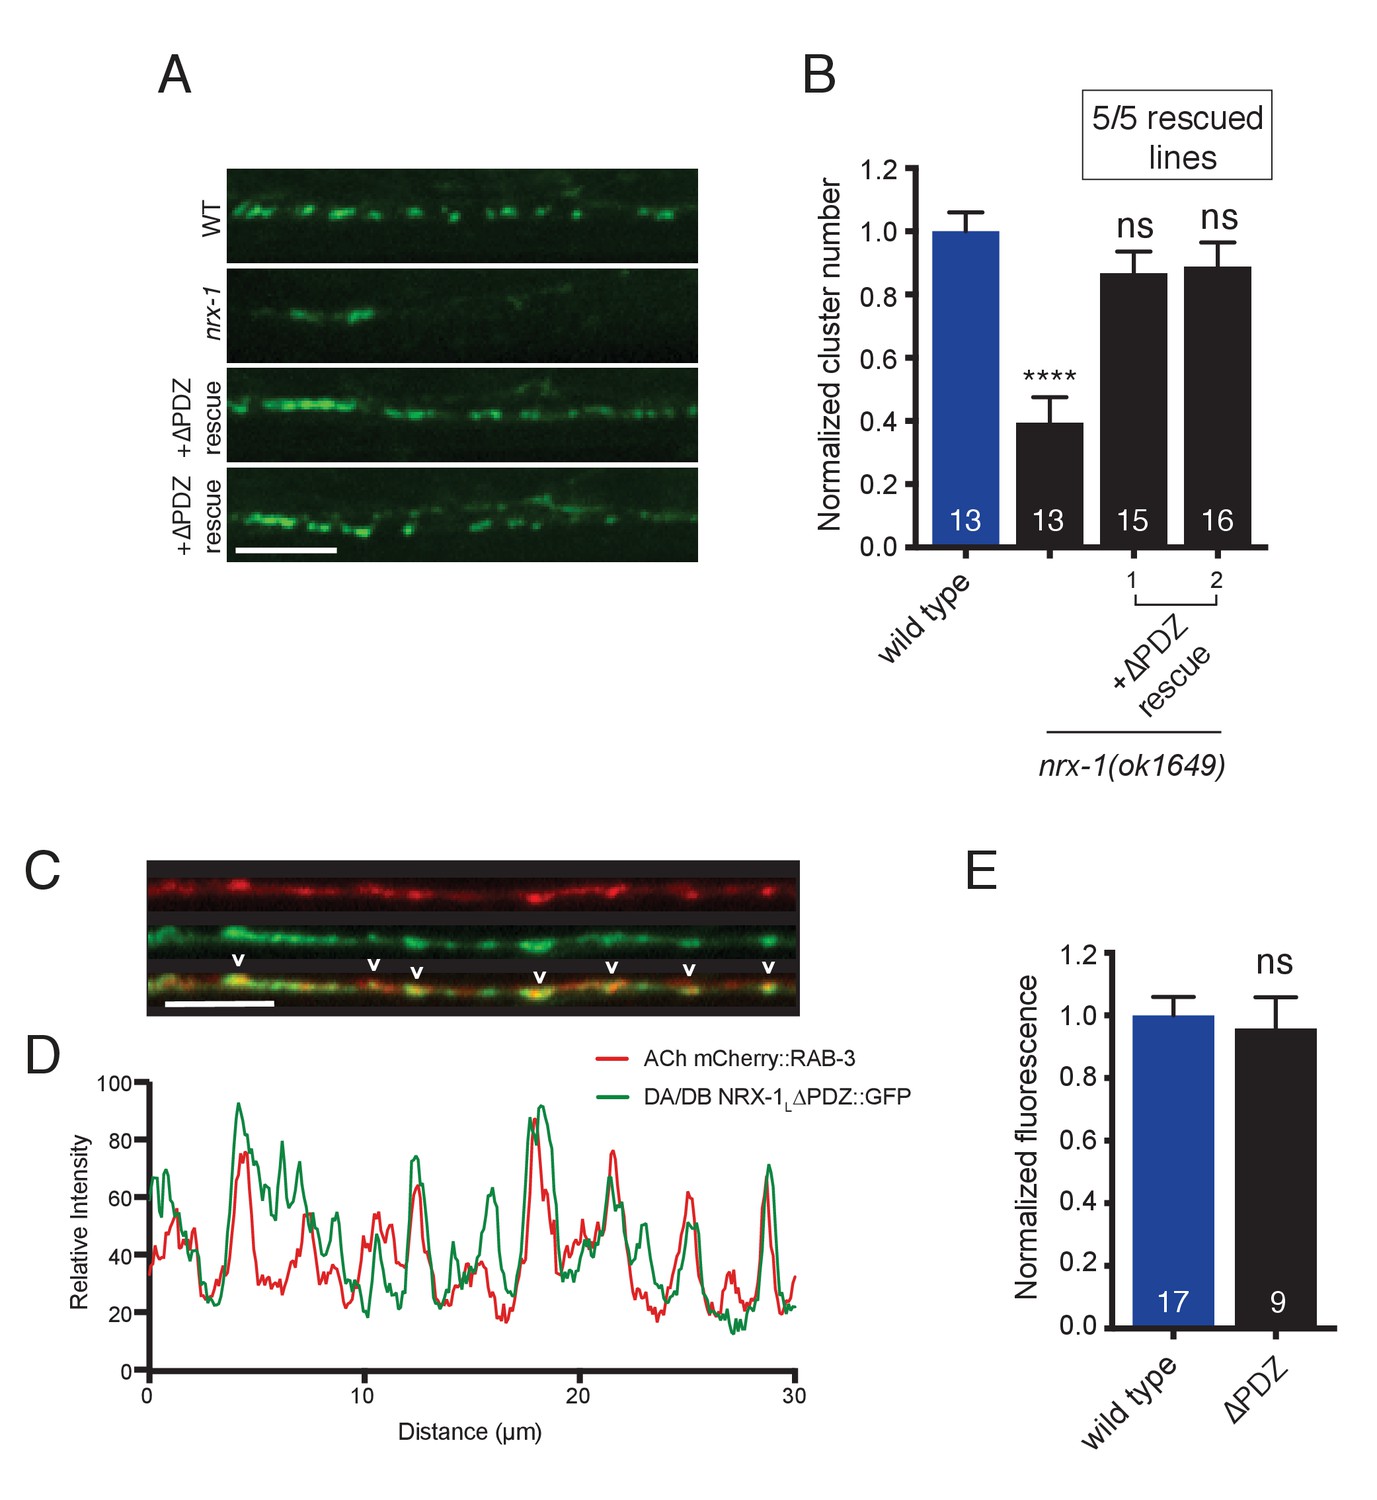
NRX-1 protein lacking the PDZ binding motif rescues ACR-12 receptor clustering defects in nrx-1 mutants and localizes to cholinergic axon terminals.
(A) Representative confocal images showing ACR-12::GFP clusters in the synaptic region of the DD1 dendrite for the genotypes indicated. In A and B, +ΔPDZ rescue refers to cholinergic-specific (unc-17β promoter) expression of a NRX-1L rescuing construct lacking the PDZ domain (nrx-1LΔPDZ) in nrx-1(ok1649) mutants. Scale bar, 5 μm. (B) Quantification of ACR-12::GFP receptor clusters in the synaptic region of the DD1 dendrite for the genotypes indicated, normalized to wild type control. ****p<0.0001, ns = not significant compared with wild type, ANOVA with Tukey’s multiple comparisons test. Two representative transgenic lines are shown. Inset, number of rescuing lines/total transgenic lines tested. (C) Confocal images of the dorsal nerve cord in an adult animal expressing NRX-1LΔPDZ::GFP (unc-129 promoter) with mCherry::RAB-3 (acr-2 promoter). Colocalization is indicated by arrowheads. Scale bar, 5 μm. (D) Line scans showing relative fluorescent intensity of NRX-1LΔPDZ::GFP (green) and mCherry::RAB-3 (red) for a 30 μm region of the dorsal nerve cord. (E) Quantification of normalized NRX-1L::GFP or NRX-1LΔPDZ::GFP fluorescence in the dorsal nerve cord (unc-129 promoter). ns = not significant, student’s t-test.
Figure 5—figure supplement 3
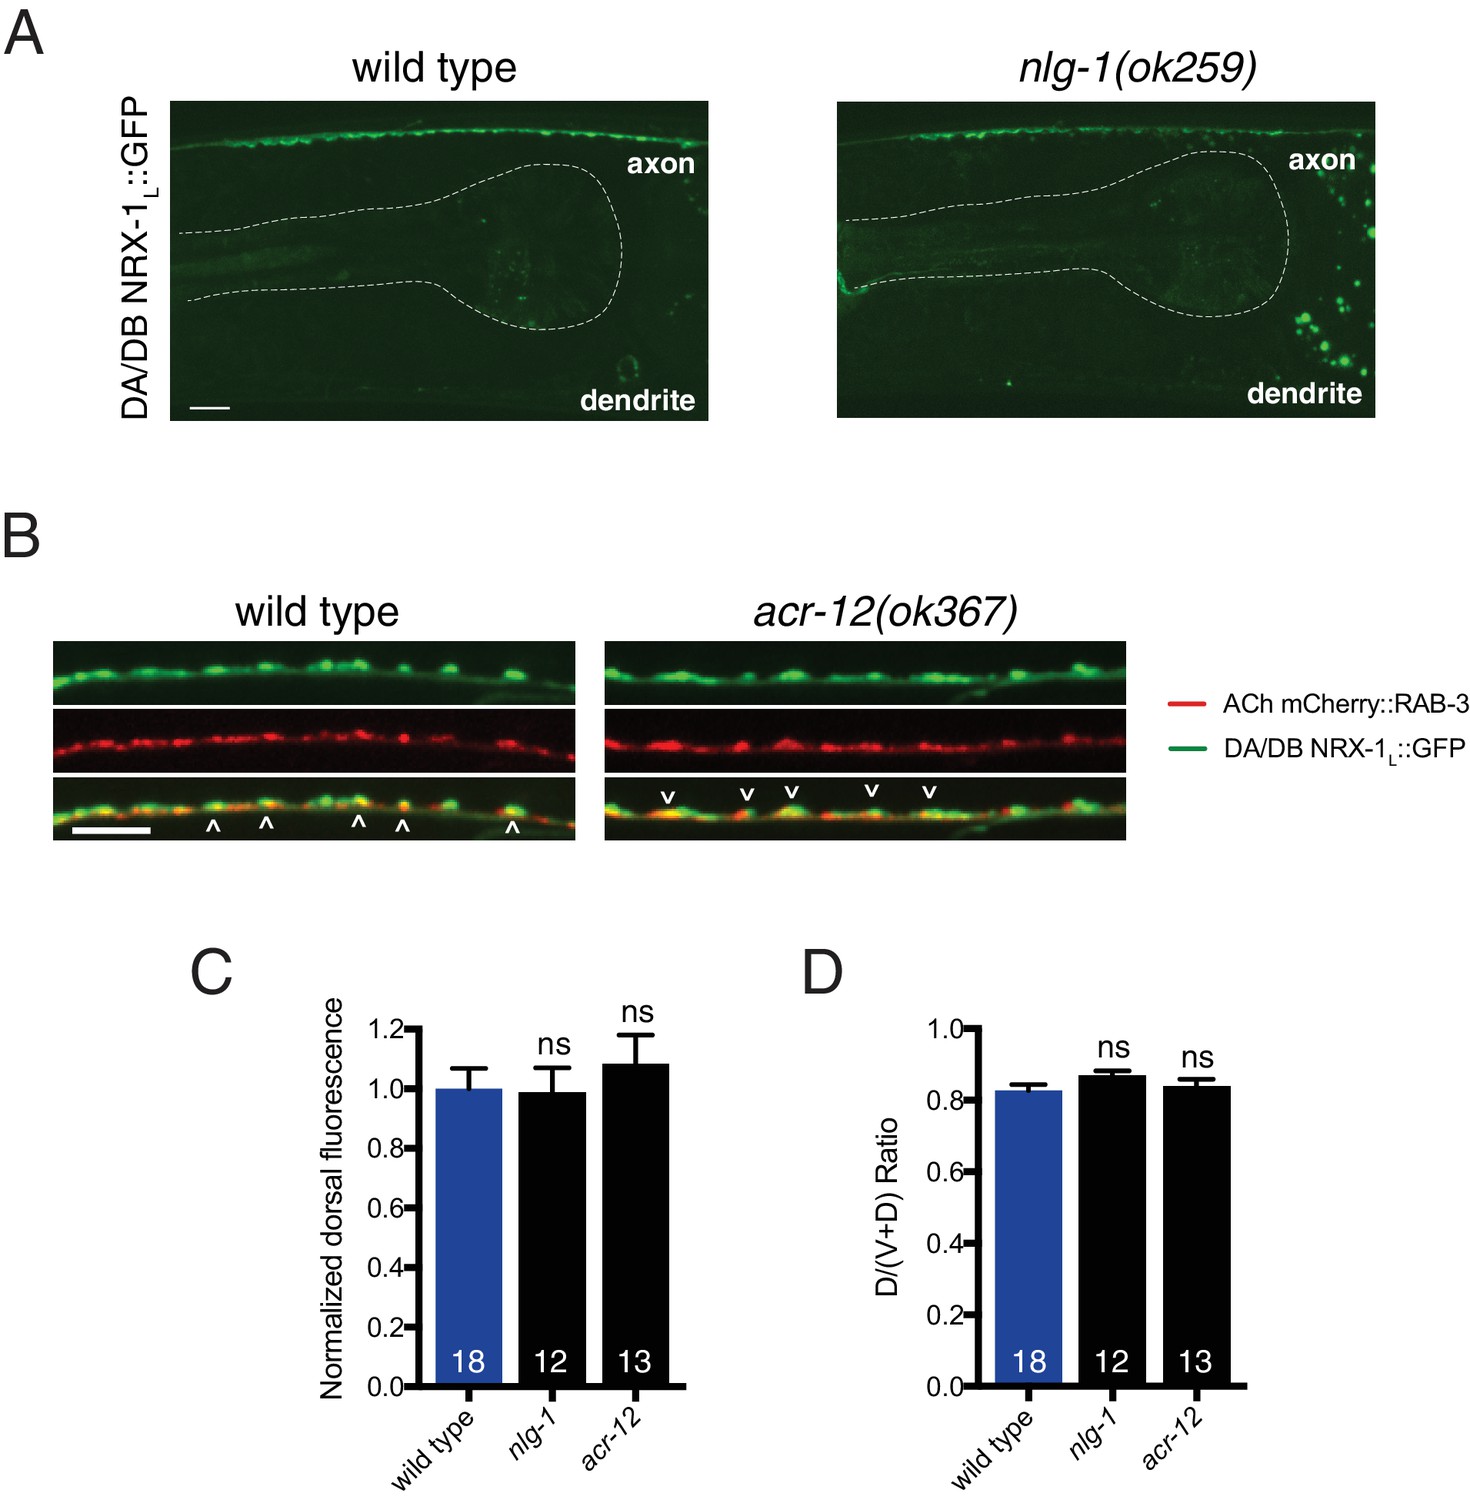
Loss of nlg-1 or acr-12 does not affect NRX-1 localization to cholinergic axons.
(A) Confocal images of NRX-1L::GFP in the dorsal nerve cord of wild type or nlg-1(ok259) mutant. Pharynx is outlined by white dashed line. Scale bar, 5 μm. (B) Confocal images of the dorsal nerve cord in adult animals expressing NRX-1L::GFP (unc-129::NRX-1L::GFP) with mCherry::RAB-3 (acr-2::mCherry::RAB-3) in wild type and acr-12(ok367) mutant. Colocalization is indicated by arrowheads. Scale bar, 5 μm. (C) Quantification of NRX-1L::GFP normalized fluorescence intensity in a 25 μm region of the anterior dorsal nerve cord in wild type, nlg-1(ok259), and acr-12(ok367) mutants. ns = not significant, ANOVA with Tukey’s multiple comparisons test. (D) Quantification of NRX-1L::GFP fluorescence in a 25 μm region of the anterior dorsal nerve cord relative to the total (ventral and dorsal) fluorescence intensity for the genotypes indicated, normalized to wild type. ns = not significant, ANOVA with Tukey’s multiple comparisons test.
Figure 6
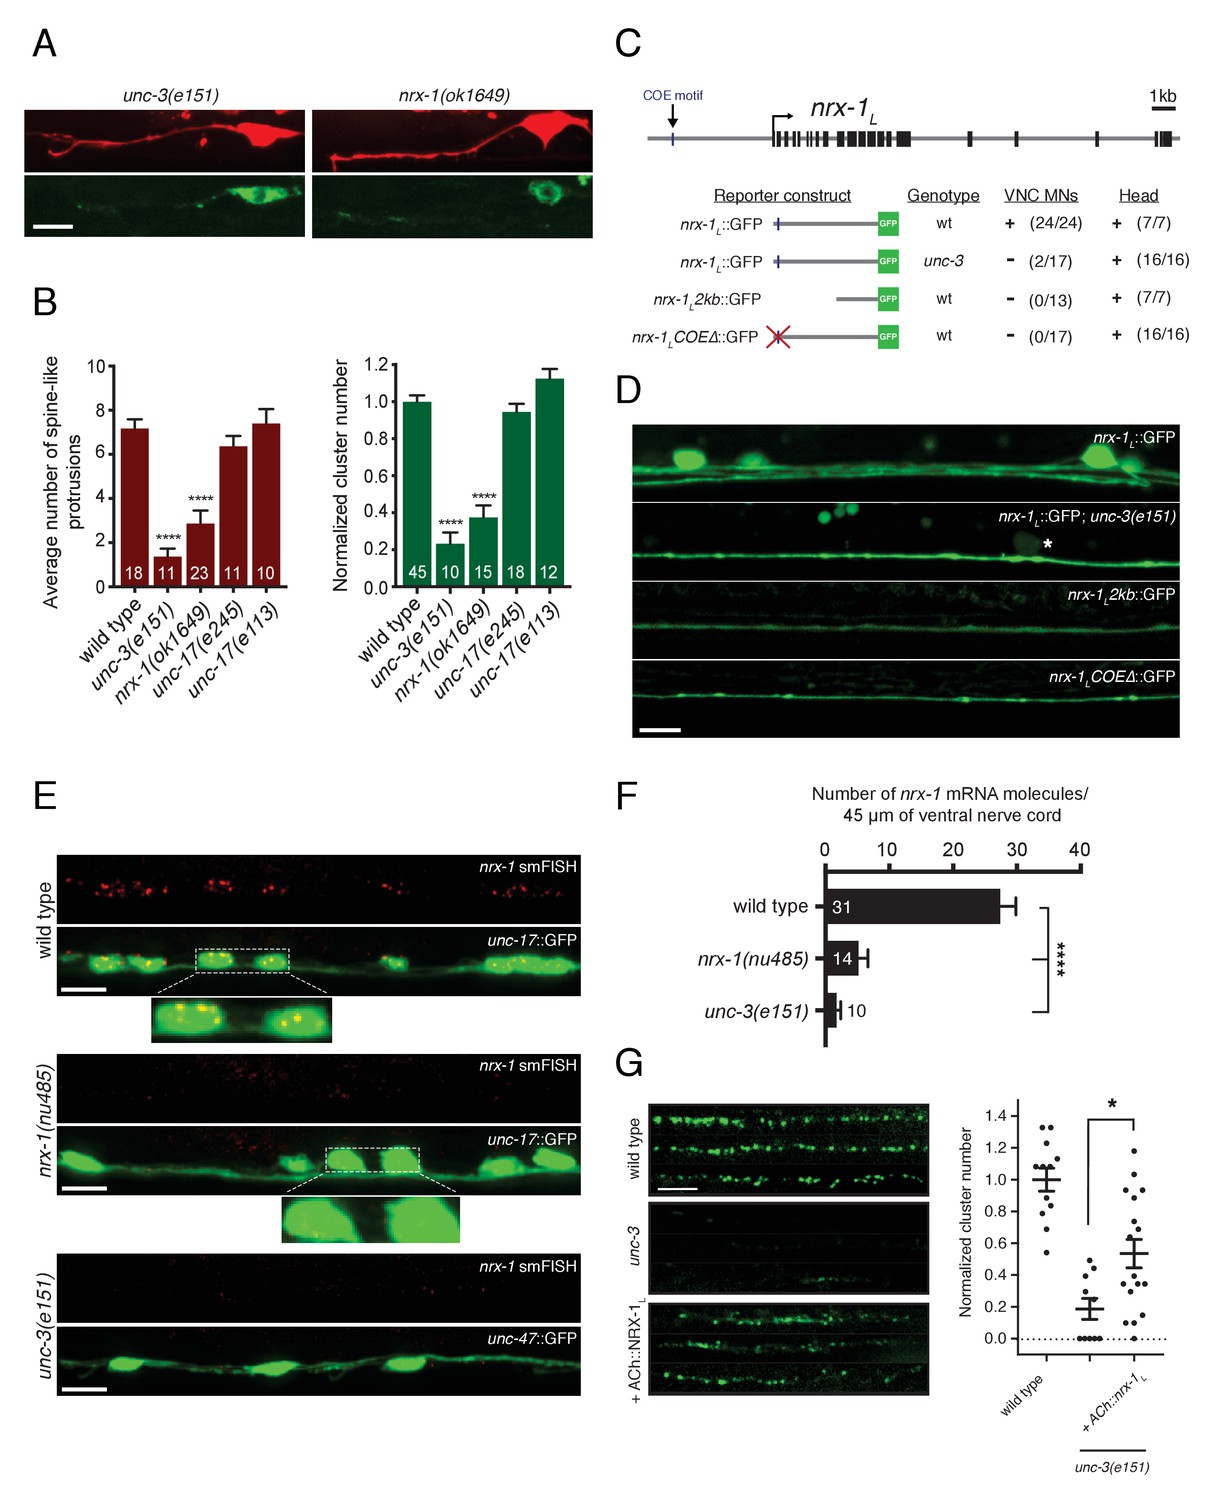
Transcriptional control of neurexin expression in ACh motor neurons by UNC-3.
(A) Confocal images of the DD1 synaptic region and cell soma in nrx-1(ok1649) and unc-3(e151) mutants expressing flp-13::mCherry (upper) or flp-13::ACR-12::GFP (lower). Note the absence of spine-like protrusions and ACR-12 receptor clusters for both genotypes. Although we also note variable defects in neurite extension in unc-3 mutants, reductions in spine-like protrusions and ACR-12 clusters are clearly evident when neurite extension appears unaffected. Notably, flp-13::mCherry fluorescence is not altered by mutation of unc-3, arguing against unc-3 regulation of the flp-13 promoter. (B) Left, quantification of spine-like protrusions in the DD1 dendrite for the genotypes indicated. ****p<0.0001, ANOVA with Dunnett’s multiple comparisons test. Right, quantification of ACR-12::GFP clusters in the DD1 synaptic region for the genotypes indicated, normalized to control (ufIs126). ****p<0.0001, ANOVA with Dunnett’s multiple comparisons test. (C) Mutational analysis of the regulatory region of the nrx-1L promoter. Upper, genomic organization of the nrx-1 locus. Black boxes, exons. Blue line, COE motif upstream of the nrx-1 start site. Lower, schematics of promoter regions fused with GFP (green) corresponding to the images in D. (+) indicates strong expression in ventral nerve cord or head neurons of fourth larval stage animals, (-) indicates lack of expression. Number of animals with GFP expression in either ventral nerve cord or head neurons is indicated in parentheses. (D) Confocal images of nrx-1L::GFP expression in the ventral nerve cord for the genotypes indicated. Note the decreased nrx-1L::GFP fluorescence in unc-3(e151) mutants, with expression from a truncated (2 kb) promoter (nrx-1L2kb), or with disruption of the COE motif (nrx-1LCOEΔ). The remaining fluorescent signal is associated with processes originating from head neurons. (E) Fluorescent in situ hybridization (FISH) signals indicating nrx-1 mRNA abundance in wild type, nrx-1(nu485), and unc-3(e151) mutant animals expressing unc-17::GFP or unc-47::GFP to visualize the ventral nerve cord. mRNA molecules are labeled by CAL Fluor Red 590 Dye conjugated probes and appear as red dots. Insets, expanded views of mRNA labeling associated with cholinergic motor neuron cell bodies. (F) Quantification of nrx-1 mRNA molecules per 45 μm segment of the ventral nerve cord for the genotypes indicated. ****p<0.0001, ANOVA with Dunnett’s multiple comparisons test. (G) Left, representative confocal images showing ACR-12::GFP clusters in the dorsal nerve cord for three wild type, unc-3(e151) or unc-3 rescue animals expressing unc-47::ACR-12::GFP. Rescue refers to cholinergic-specific (unc-3 promoter) expression of NRX-1L in unc-3(e151) mutants (ACh::nrx-1L). Right, scatterplot of ACR-12 receptor cluster number in a 40 μm region of the dorsal nerve cord for the genotypes indicated, normalized to control. n ≥ 10 for each genotype. *p<0.05, ANOVA with Tukey’s multiple comparisons test. Scale bars, 5 μm (A, D–E, G).
-
Figure 6—source data 1
Raw values for spine-like protrusion and ACR-12::GFP receptor cluster number, and for nrx-1 mRNA FISH signal.
- https://doi.org/10.7554/eLife.35692.030
Figure 7 with 1 supplement
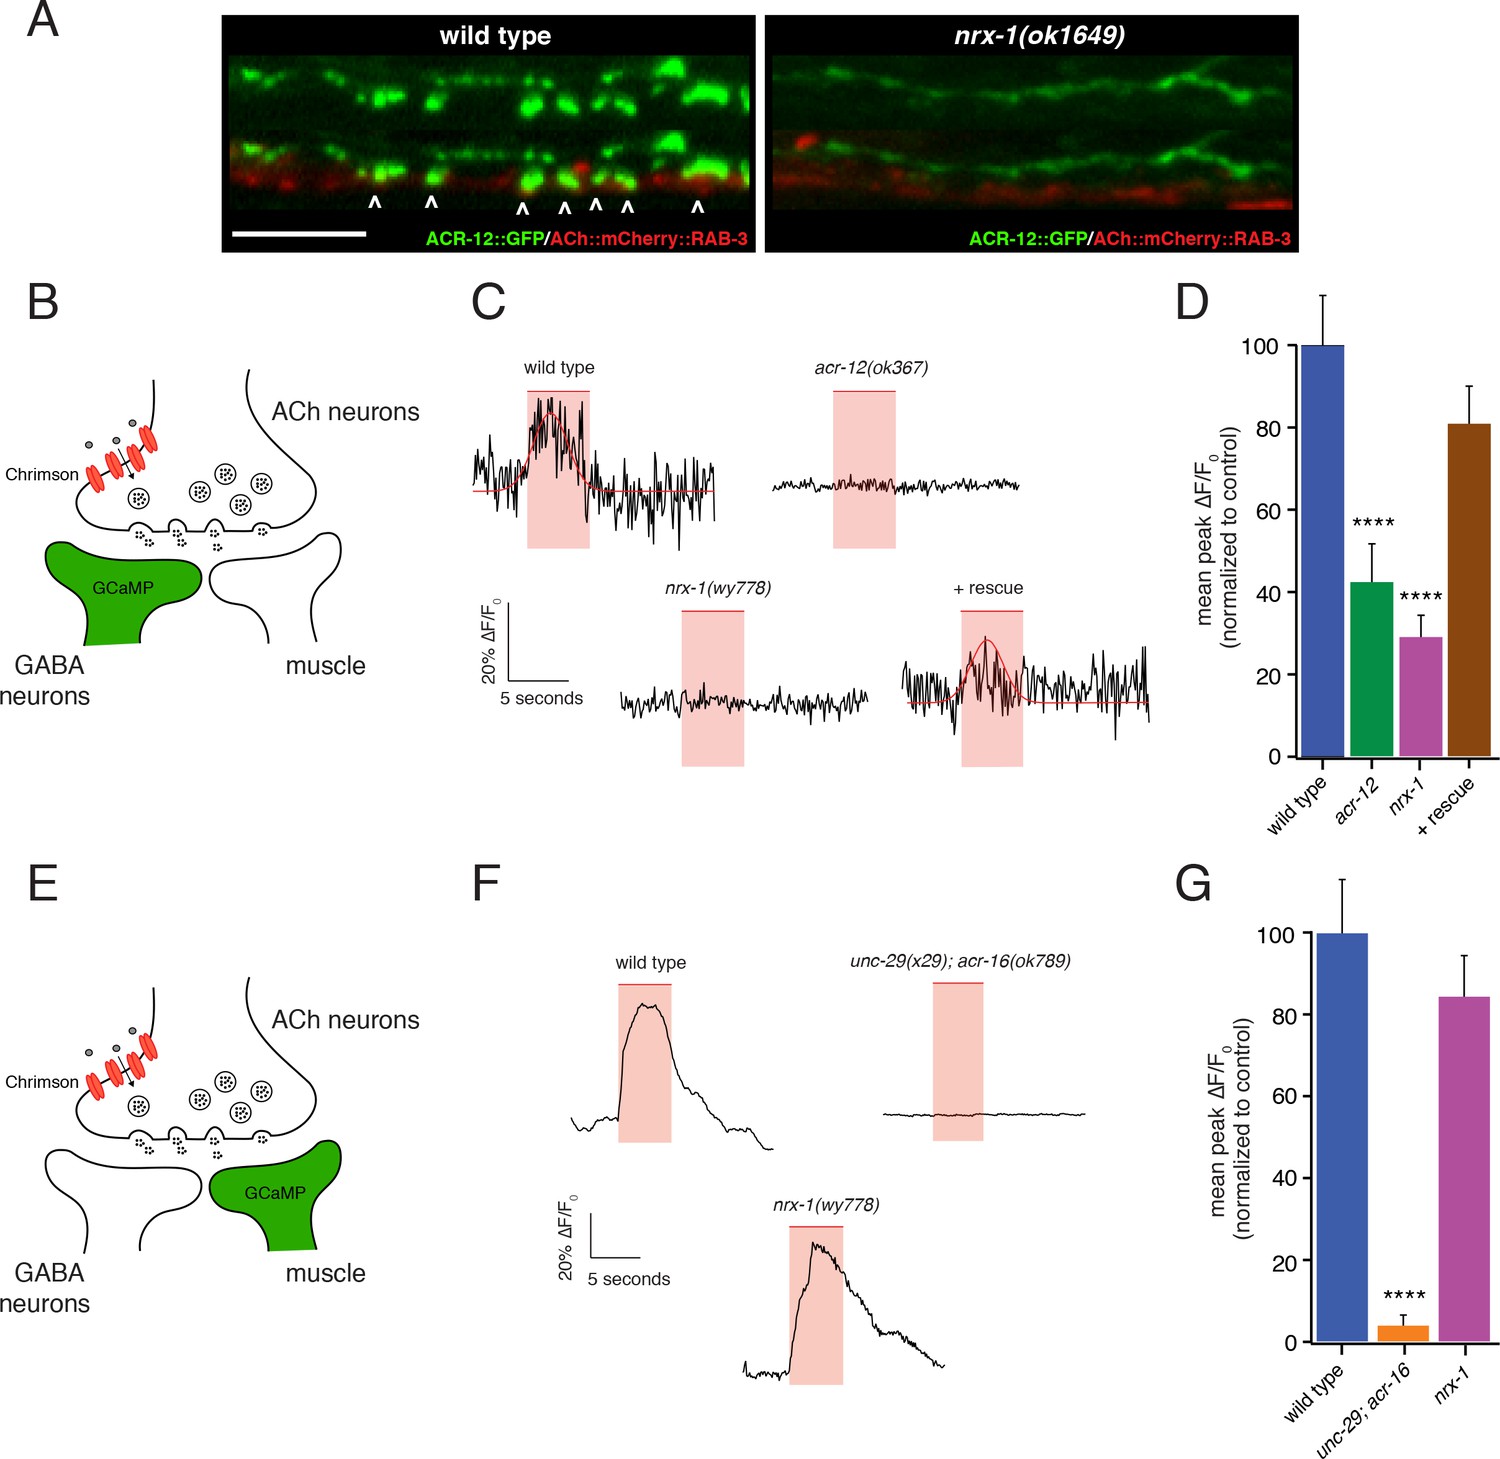
nrx-1 mutants show functional defects in synaptic connectivity.
(A) Confocal images of pre-synaptic (acr-2::mCherry::RAB-3) and post-synaptic (flp-13::ACR-12::GFP) specializations in the DD1 synaptic region for the genotypes indicated. Arrowheads indicate receptor-bearing spiny protrusions extending into the presynaptic region of cholinergic axons in wild type. Note gap between the pre- and post- synaptic regions in nrx-1(ok1649) mutants. Scale bar, 5 μm. (B) Cartoon depicting specific expression of Chrimson (acr-2::Chrimson) in cholinergic neurons together with GCaMP (ttr-39::GCaMP6s::SL2::mCherry, green) in GABAergic neurons, applies to C-D. (C) Representative calcium transients in GABAergic motor neurons evoked by light stimulation (red shaded region) of cholinergic neurons for the genotypes indicated. Rescue refers to cholinergic expression of NRX-1L in nrx-1(wy778) mutants (C–D). Red line indicates Gaussian fit to the wild type and rescue traces. (D) Quantification of the mean peak ΔF/F0 upon Chrimson stimulation for the genotypes indicated, normalized to control (ufIs155; ufIs157). ****p<0.0001, ANOVA with Dunnett’s multiple comparisons test. (E) Cartoon depicting specific expression of Chrimson (acr-2::Chrimson) in cholinergic neurons together with GCaMP (myo-3::NLSwCherry::SL2::GCaMP6s, green) in muscles, applies to F-G. (F) Representative calcium transients in muscle cells evoked by light stimulation (red shaded region) of cholinergic motor neurons for the genotypes indicated. (G) Quantification of the mean peak ΔF/F0 upon Chrimson stimulation for the genotypes indicated, normalized to control (zfEx813; ufIs157). ****p<0.0001, ANOVA with Dunnett’s multiple comparisons test.
-
Figure 7—source data 1
Raw values for calcium imaging peak fluorescence and normalized peak fluorescence.
- https://doi.org/10.7554/eLife.35692.033
-
Figure 7—source data 2
Raw values for body bend amplitude ratio during movement.
Relates to Figure 7—figure supplement 1.
- https://doi.org/10.7554/eLife.35692.034
Figure 7—figure supplement 1
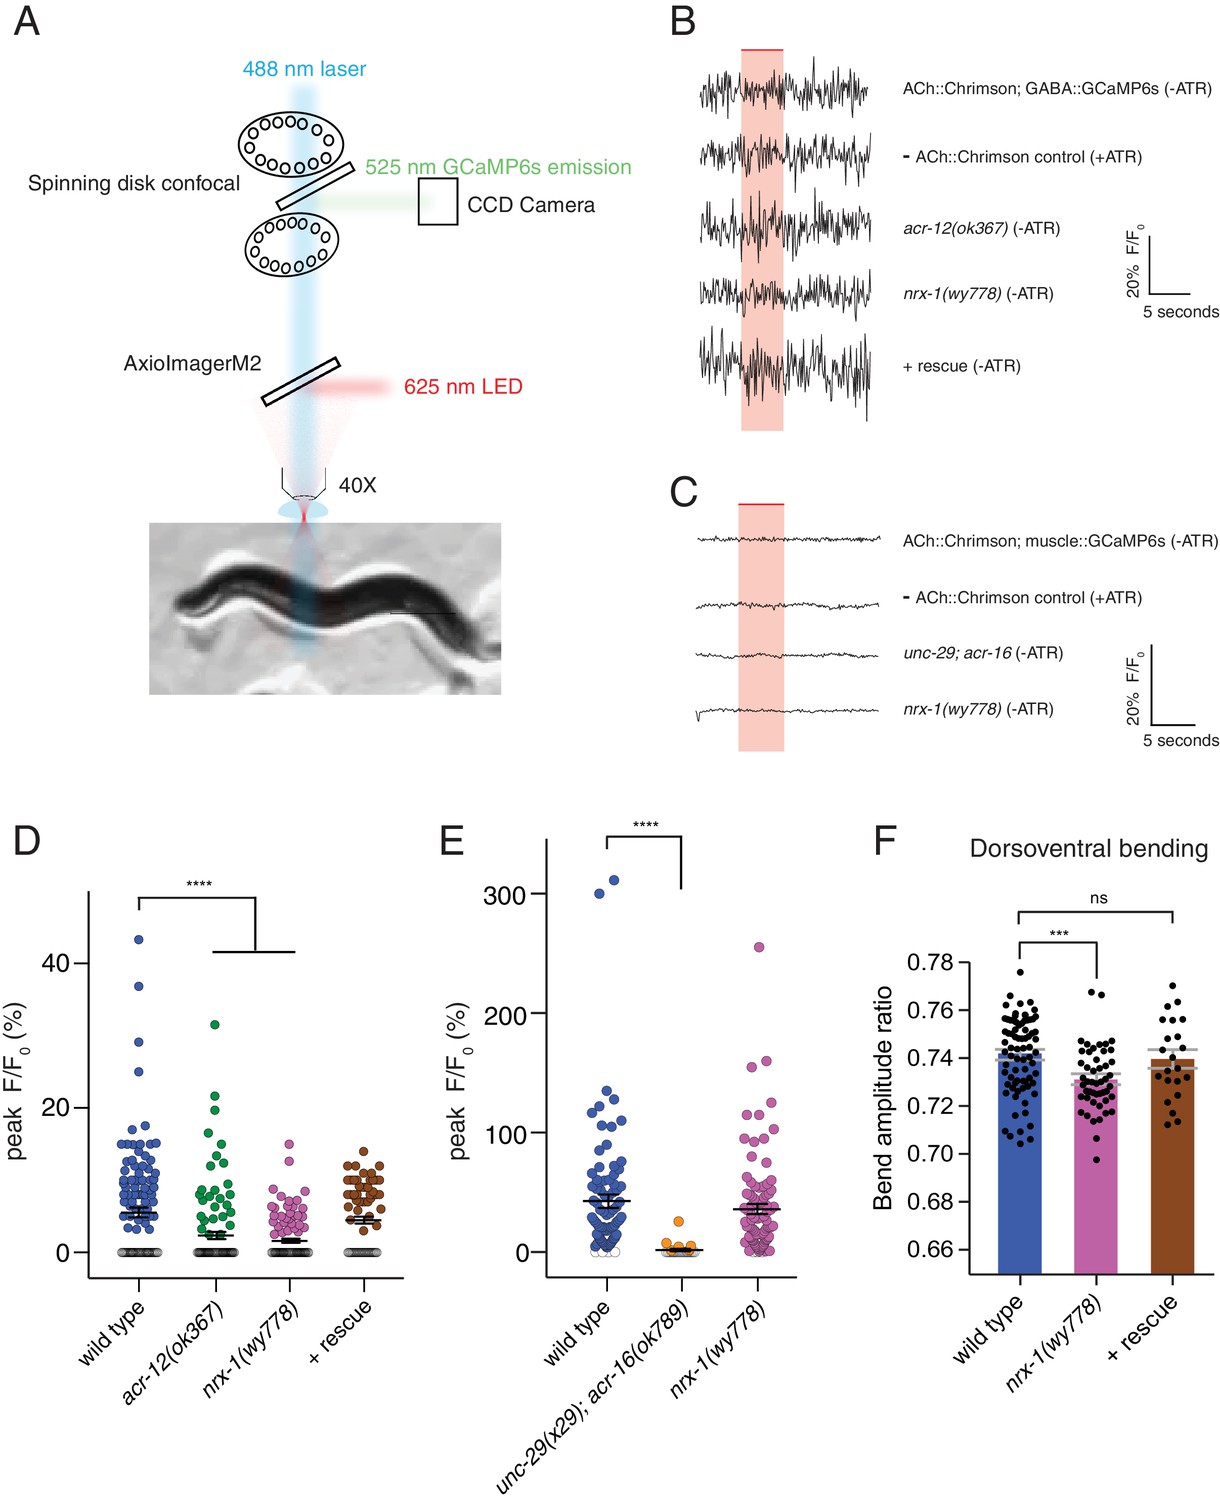
nrx-1 mutants have defects in transmission onto GABAergic neurons and abnormalities in dorsoventral bending.
(A) Simplified schematic of experimental setup for calcium imaging studies. GCaMP6s fluorescence was recorded in GABAergic neurons or body wall muscle cells in a single focal plane over a 20 s recording (Figure 7). Chrimson stimulation was elicited using a 625 nm LED. GCaMP excitation (488 nm) and emission (525 nm) acquisition and Chrimson activation were achieved using a 556 nm short-pass dichroic beam splitter inserted into the light path. (B–C) Representative calcium transients in GABAergic neurons (B) or muscle cells (C) evoked by light stimulation (red shaded region) of cholinergic motor neurons (acr-2::Chrimson) for the genotypes indicated. ATR, all-trans retinal. Rescue refers to cholinergic expression of NRX-1L in nrx-1(wy778) mutants. (D–E) Scatterplots of peak evoked calcium responses (ΔF/F0, closed circles) in GABAergic neurons (D) or muscle cells (E) for the genotypes indicated. ΔF/F0 of 0 indicates a failure and is represented by open circles. Black bars indicate mean ± SEM. ****p<0.0001, ANOVA with Dunnett’s multiple comparisons test. (F) Ratio of maximum dorsoventral bending amplitude measured using automated worm track analysis (see Materials and methods) (Yemini et al., 2013). Rescue refers to cholinergic expression of NRX-1L in nrx-1(wy778) mutants. Each data point indicates an individual worm analyzed, and gray bars indicate mean ± SEM. n > 20 for each genotype. ***p<0.001, ns = not significant, compared to wild type control, ANOVA with Dunnett’s multiple comparisons test.
Figure 8
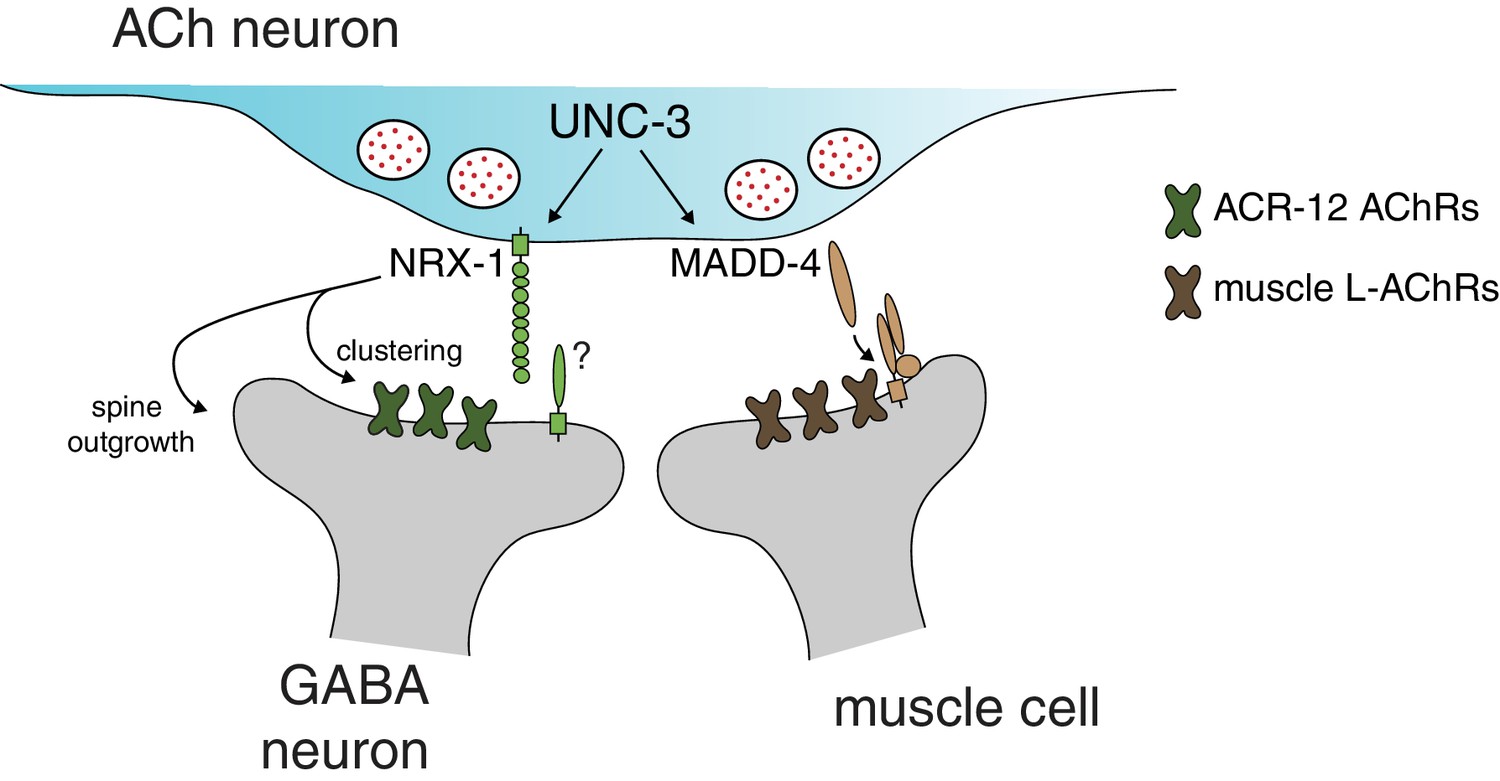
Distinct molecular scaffolds direct partner-specific connectivity.
Distinct molecular scaffolds coordinate post-synaptic development in GABAergic neurons vs muscle. NRX-1/neurexin located at sites of presynaptic cholinergic release acts to coordinate ACR-12 receptor localization (green) and spine outgrowth in GABA neurons. A complex of proteins direct receptor clustering (brown) at the neuromuscular junction (Gally et al., 2004; Gendrel et al., 2009; Pinan-Lucarré et al., 2014; Rapti et al., 2011). NRX-1 and MADD-4 (Kratsios et al., 2015) expression in cholinergic neurons is transcriptionally co-regulated with neurotransmitter identity by the COE transcription factor UNC-3.
Additional files
-
Supplementary file 1
Strain list.
- https://doi.org/10.7554/eLife.35692.036
-
Supplementary file 2
Plasmid list.
- https://doi.org/10.7554/eLife.35692.037
-
Supplementary file 3
Primer list.
- https://doi.org/10.7554/eLife.35692.038
-
Transparent reporting form
- https://doi.org/10.7554/eLife.35692.039
Download links
A two-part list of links to download the article, or parts of the article, in various formats.
Downloads (link to download the article as PDF)
Open citations (links to open the citations from this article in various online reference manager services)
Cite this article (links to download the citations from this article in formats compatible with various reference manager tools)
Neurexin directs partner-specific synaptic connectivity in C. elegans
eLife 7:e35692.
https://doi.org/10.7554/eLife.35692


