Differential inputs to striatal cholinergic and parvalbumin interneurons imply functional distinctions
- The Salk Institute for Biological Studies, United States
Figures
Figure 1 with 2 supplements
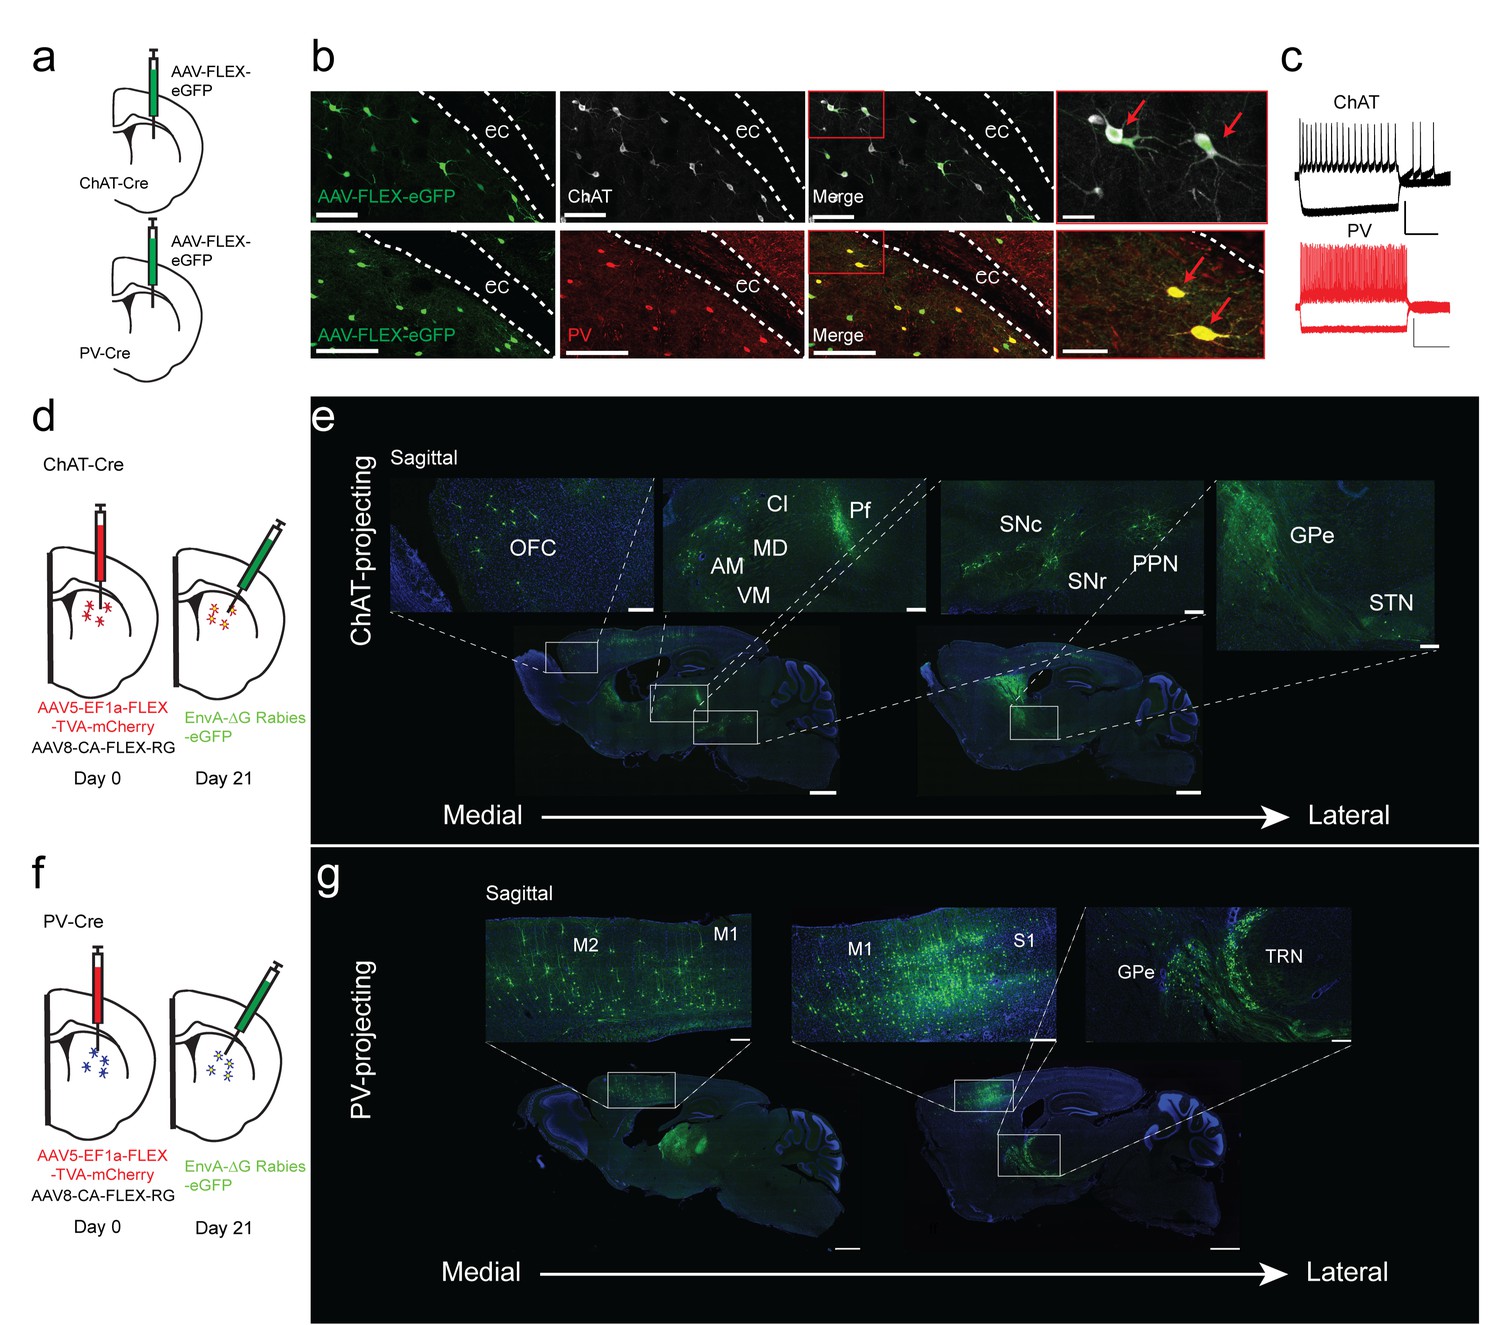
Monosynaptic tracing reveals the inputs to striatal ChAT and PV interneurons.
(a) Schematic of Cre-dependent AAV-eGFP viral injection in ChAT-Cre or PV-Cre mice. (b) AAV-eGFP expression is highly colocalized with ChAT and PV immunostaining, respectively. Scale bars, 100 µm. inset (red box), scale bar 25 µm. Red arrows denote colocalization. ec, external capsule. (c) Representative traces of (top) ChAT and (bottom) PV interneuron to hyperpolarizing and depolarizing current injection (step −250 pA,+250 pA). Scale bars, 250 ms, 50 mV. (d) Schematic of Cre-dependent AAV helper viruses and modified rabies virus injections in ChAT-Cre mice. (e) Series of representative sagittal sections containing inputs to ChAT interneurons. (f) Schematic of Cre-dependent AAV helper viruses and modified rabies virus injections in PV-Cre mice. (g) Series of representative sagittal sections containing inputs to PV interneurons. Only the injection hemisphere is shown. Scale bars, 1 mm; inset scale bars; 500 µm. Brain regions are highlighted in white lettering. OFC, orbital frontal cortex; M1, primary motor cortex; M2, secondary motor cortex; S1, primary somatosensory cortex; GPe, globus pallidus external segment; Cl, central lateral thalamic nuclei; Pf, parafascicular thalamic nucleus; AM, anteromedial thalamic nucleus; MD, mediodorsal thalamic nucleus; VM, ventromedial thalamic nucleus; STN, subthalamic nucleus, SNc, substantia nigra pars compacta; SNr, substantia nigra pars reticulata; PPN, pedunculopontine nucleus; TRN, thalamic reticular nucleus. The following figure supplements are available for Figure 1: Figure 1—figure supplement 1 and Figure 1—figure supplement 2 for additional coronal images and starter cell quantification, respectively.
Figure 1—figure supplement 1
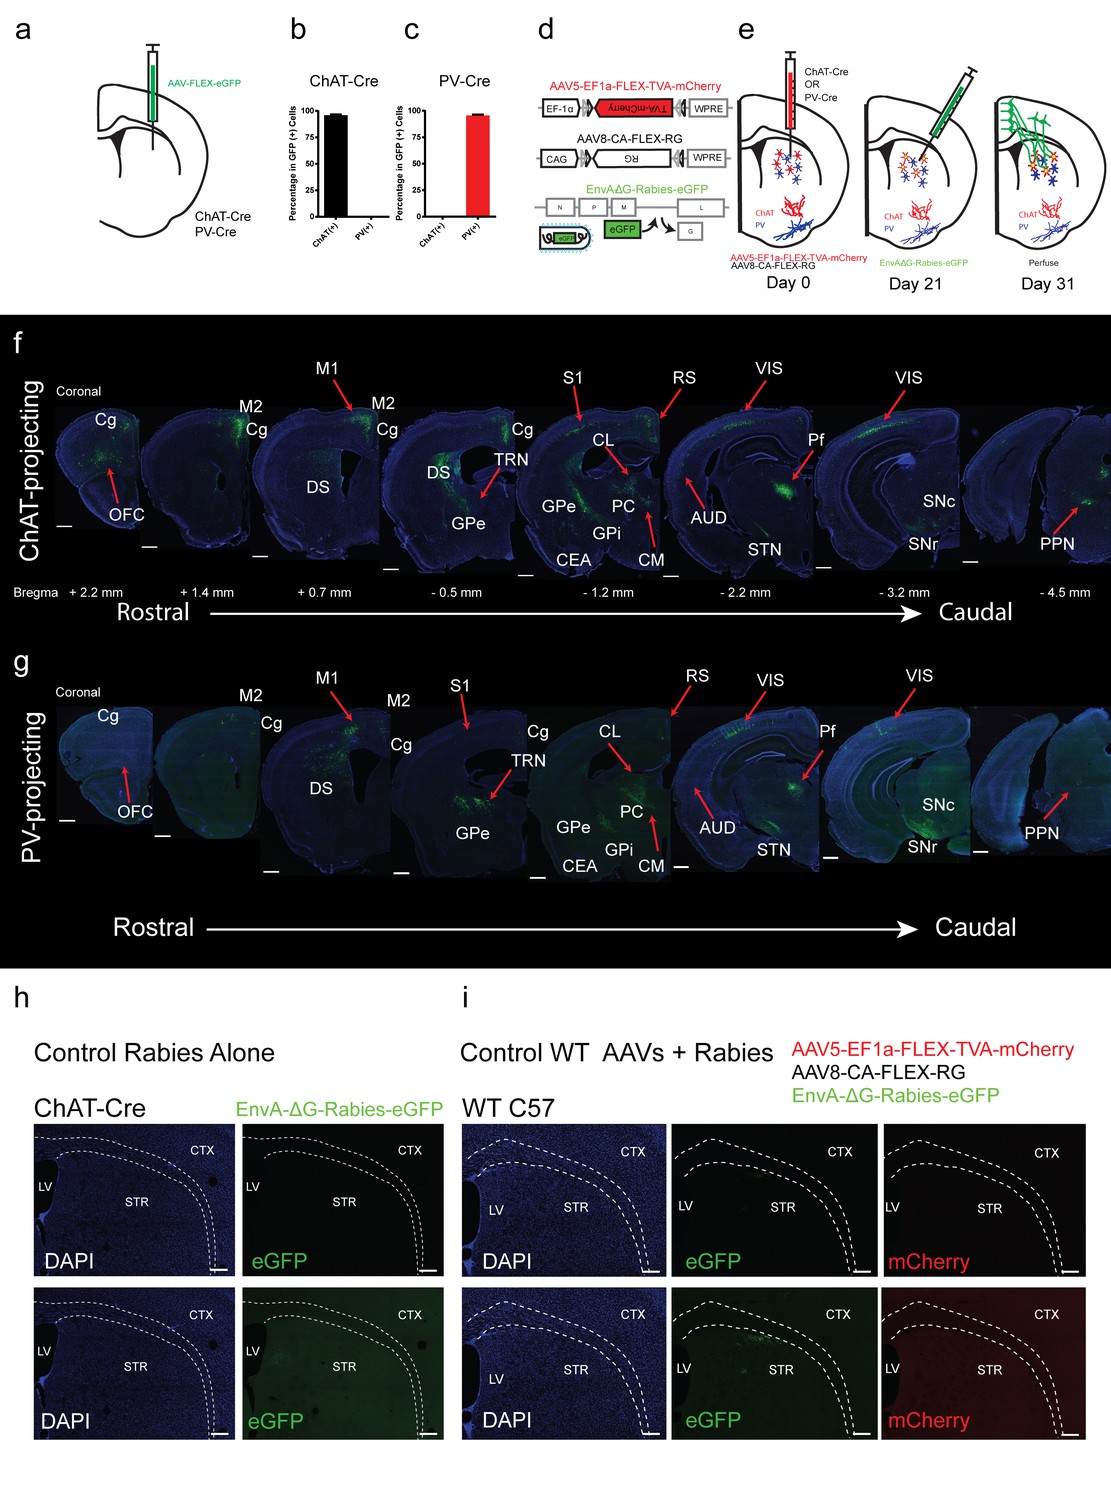
Overview of inputs to ChAT and PV interneurons.
(a) Schematic of Cre-dependent AAV eGFP injection in striatum of ChAT-Cre or PV-Cre mouse. (b) Quantification of ChAT immunostaining and eGFP expression colocalization. (c) Quantification of PV immunostaining and eGFP expression colocalization. Mean ± SEM. (d) Schematic of recombinant Cre-dependent AAV helper viruses and pseudotyped modified rabies virus. (e) Experimental methodology and timeline of viral injections. (f) Series of representative coronal sections with modified rabies virus eGFP monosynaptic inputs to dorsal striatal ChAT interneurons. (g) Series of representative coronal sections with modified rabies virus eGFP monosynaptic inputs to dorsal striatal PV interneurons. Only the hemisphere ipsilateral to the injection site is shown. Scale bar, 500 µm. Areas of expression are highlighted in white lettering. Red arrows denote significant input differences in ChAT and PV neurons. OFC, orbital frontal cortex; Cg, cingulate cortex; M1, primary motor cortex; M2, secondary motor cortex; DS, dorsal striatum; S1, primary somatosensory cortex; S2, secondary somatosensory cortex; GPe, globus pallidus external segment; GPi, globus pallidus internal segment; CEA, central amygdala; CL, central lateral thalamic nuclei; PC, paracentral thalamic nuclei; CM, central medial thalamic nucleus; Pf, parafascicular thalamic nucleus; STN, subthalamic nucleus, RS, retrosplenial cortex; AUD, auditory cortex; VIS, visual cortex; SNc, substantia nigra pars compacta; SNr, substantia nigra pars reticulata; PPN, pedunculopontine nucleus; TRN, thalamic reticular nucleus. (h) (top) dG-Rabies injection alone in a ChAT-Cre mouse does not lead to eGFP expression. (top) same gain settings as f-g. (bottom) high gain settings. (i) Injection of helper viruses and dG-Rabies in a wildtype mouse does not yield significant expression of mCherry or eGFP. (top) same gain settings as f-g. (bottom) high gain settings. Scale bar, 200 µm. LV = lateral ventricle, STR = striatum, CTX = cortex.
Figure 1—figure supplement 2
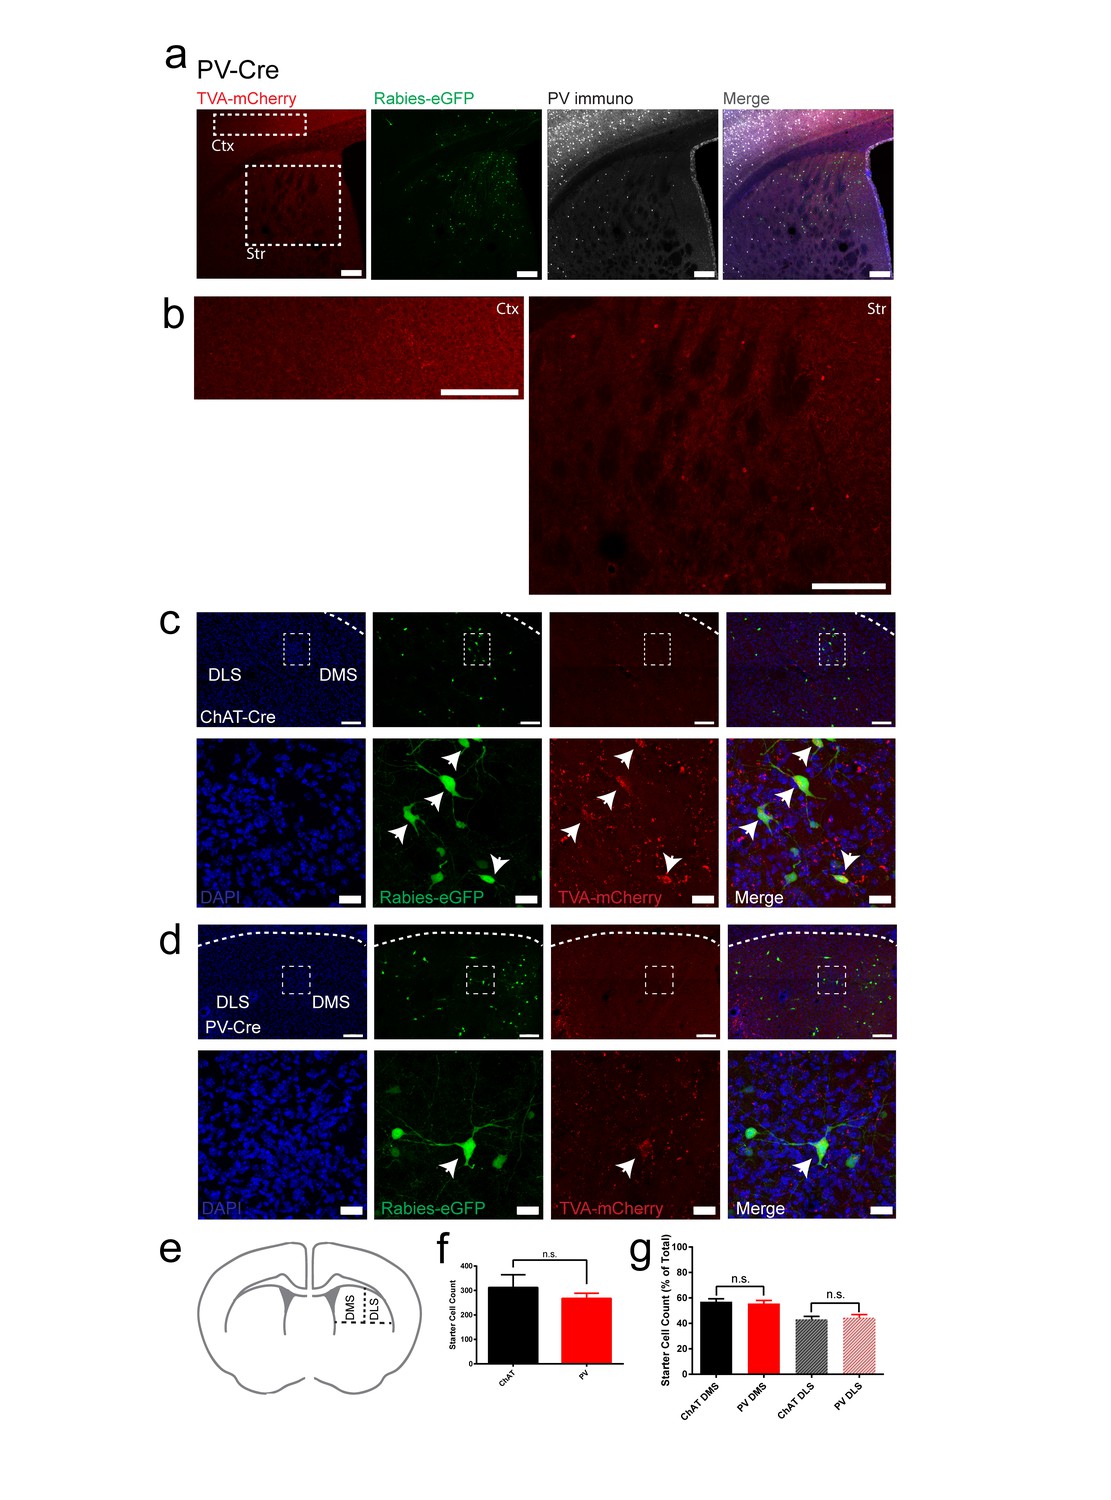
ChAT and PV starter cells are restricted to dorsal striatum, similar in total number and are distributed equally across dorsal medial and dorsal lateral striatal subdivisions.
(a) Expression of TVA-mCherry positive starter cells, rabies-eGFP and immunostaining for PV in dorsal striatal injection site. Scale bar, 100 um. (b) Magnified inset of cortex (Ctx) and dorsal striatum (Str) from (a). Scale bar, 100 um. All PV-Cre rabies tracing brains were confirmed to not express TVA-mCherry positive starter cells in cortex. (c) Expression of Rabies-eGFP and TVA-mCherry in the dorsal striatum of a ChAT-Cre mouse near the injection site. (top) 20x image of dorsal striatum. Scale bar, 100 µm. White dotted rectangle inset (below) 40x image from above. Scale bar, 20 µm. Neurons with both eGFP and mCherry expression are considered starter cells (white arrowheads). (d) Expression of Rabies-eGFP and TVA-mCherry in the dorsal striatum of a PV-Cre mouse near the injection site. (top) 20x image of dorsal striatum. Scale bar, 100 µm. White dotted rectangle inset (below) 40x image from above. Scale bar, 20 µm. (e) Area of dorsal striatum where counts were collected and bisection of dorsal medial (DMS) and dorsal lateral (DLS) striatum. (f) Total number of starter cells in dorsal striatum from a sample of rostral to caudal slices. (g) Starter cell count for dorsal medial and dorsal lateral subdivisions presented as a percentage of total starter cells. n.s. = not significant.
Figure 2 with 2 supplements
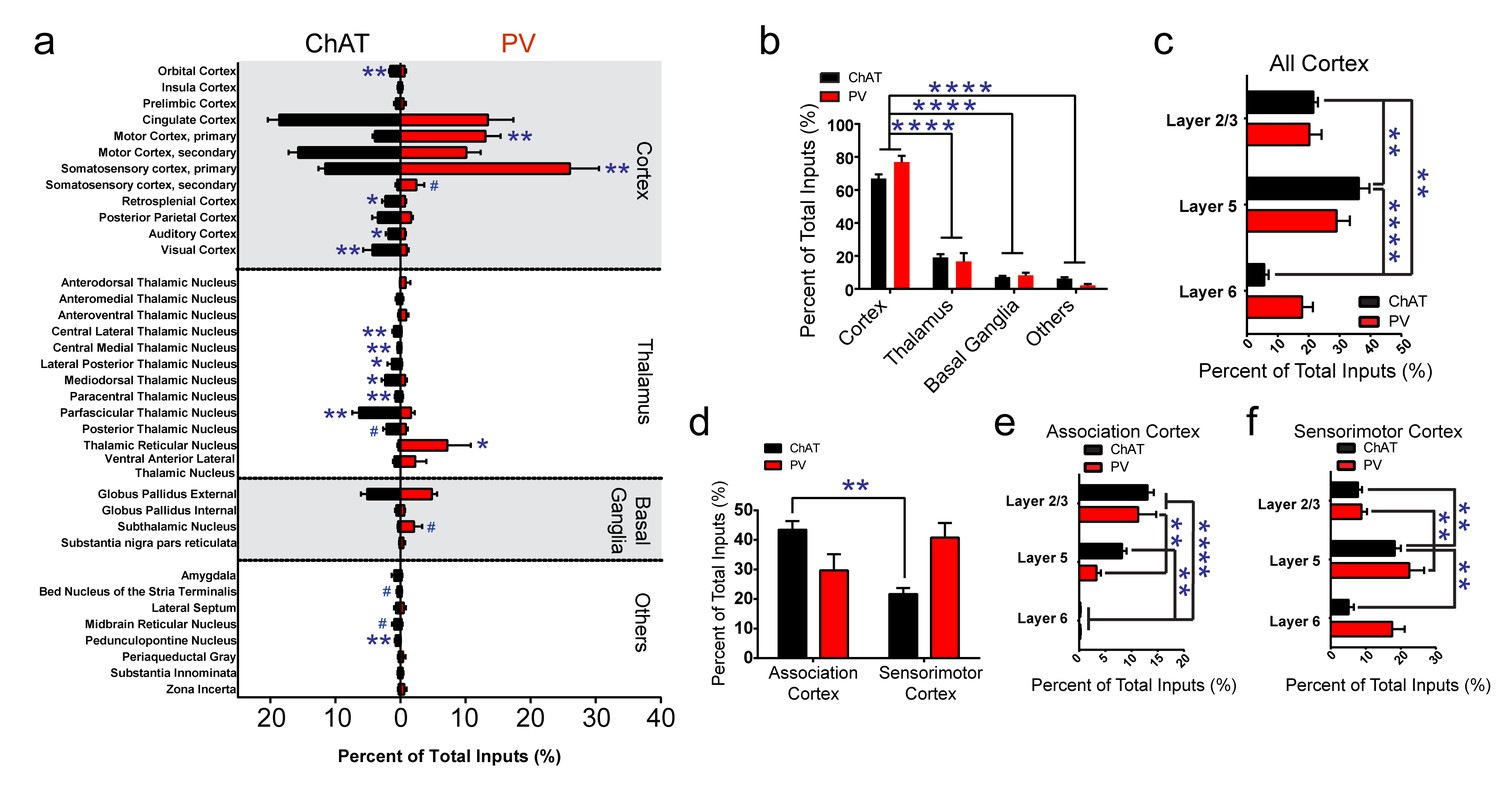
Summary of brain-wide direct inputs to striatal ChAT and PV interneurons.
(a) Major input regions (>0.4% of total inputs) to ChAT (black bar) and PV (red bar) interneurons. A complete set of all inputs to ChAT and PV interneurons is shown in Figure 2—figure supplement 1. (b) ChAT and PV interneurons receive predominately cortical innervation (two-way ANOVA, F(3,36) = 325.1, p<0.0001). (c) Cortical laminar distribution of all inputs to ChAT and PV interneurons. ChAT interneurons receive a significant bulk of inputs from layer five compared to other cortical layers (two-way ANOVA, Sidak’s, 5 vs. 6, p<0.0001; 2/3 vs. 6, p=0.0019; 2/3 vs. 5, p=0.0041). (d) Sorted association and sensorimotor cortex inputs to ChAT and PV interneurons (see Materials and methods). ChAT interneurons receive a greater percentage of associative versus sensorimotor inputs (two-way ANOVA, Sidak’s, p=0.0001). (e) Association cortex laminar distribution is biased to superficial layers. ChAT interneurons receive more associative layer 2/3 than layer six projections and more layer 5 than six projections (two-way ANOVA, Sidak’s, layer 2/3 vs. 6, p<0.0001, layer 5 vs. 6, p=0.0012). PV interneurons also receive more associative layer 2/3 than layer 5 and 6 projections (two-way ANOVA, Sidak’s, layer 2/3 vs. 6, p<0.0001, layer 2/3 vs 5, p=0.0029). (f) Sensorimotor cortex laminar distribution is biased to deep layers. ChAT interneurons receive more sensorimotor layer five projections than layer 2/3 or layer six projections (two-way ANOVA, Sidak’s, layer 5 vs. 6, p=0.0010, layer 2/3 vs. 5, p=0.0086). PV interneurons receive more sensorimotor layer 5 than layer 2/3 projections (two-way ANOVA, Sidak’s, layer 2/3 vs. 5, p=0.0018). All figures mean ± SEM. In blue, *p≤0.05, **p≤0.01, ****p≤0.0001, # p<0.08. The following figure supplements are available for Figure 2: Figure 2—figure supplements 1 and 2.
Figure 2—figure supplement 1
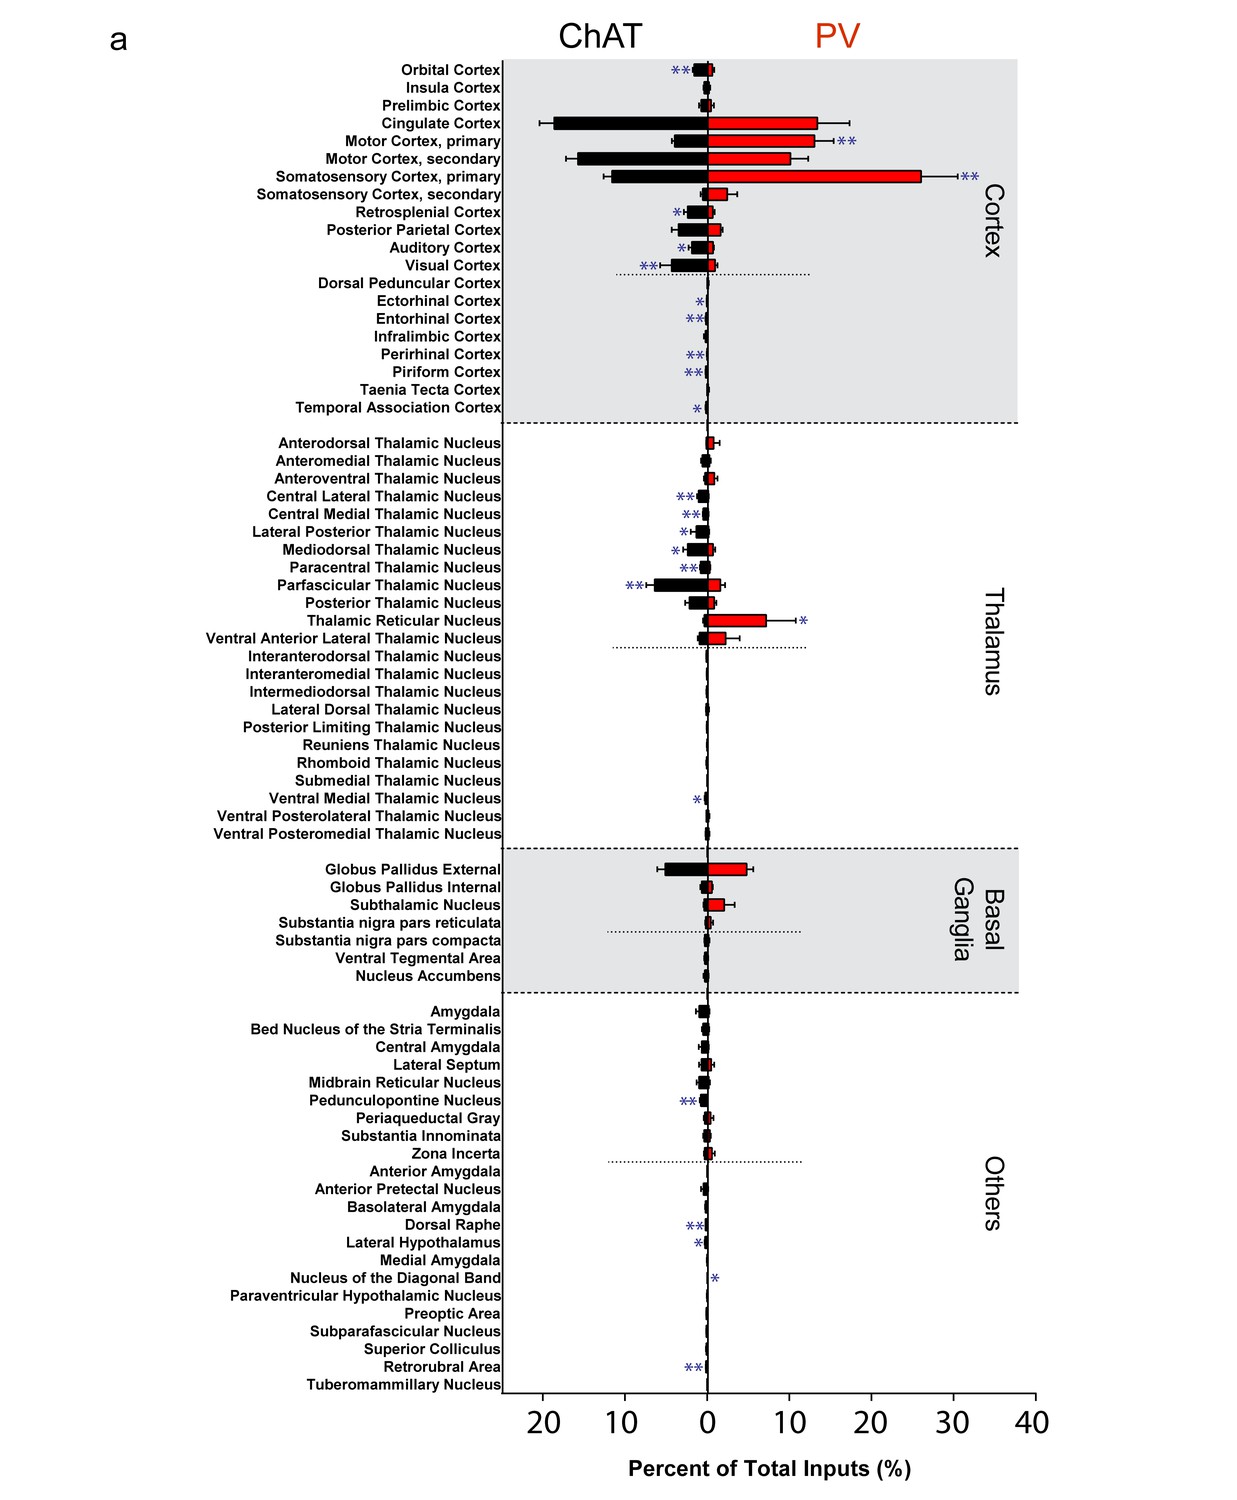
Complete list of all inputs to ChAT and PV interneurons.
(a) All major (>0.4%) and minor (<0.4%) inputs to striatal ChAT (black) and PV (red) interneurons. Short dashed line represents division between major and minor inputs. Mean ± SEM. In blue, *p≤0.05; **p≤0.01.
Figure 2—figure supplement 2
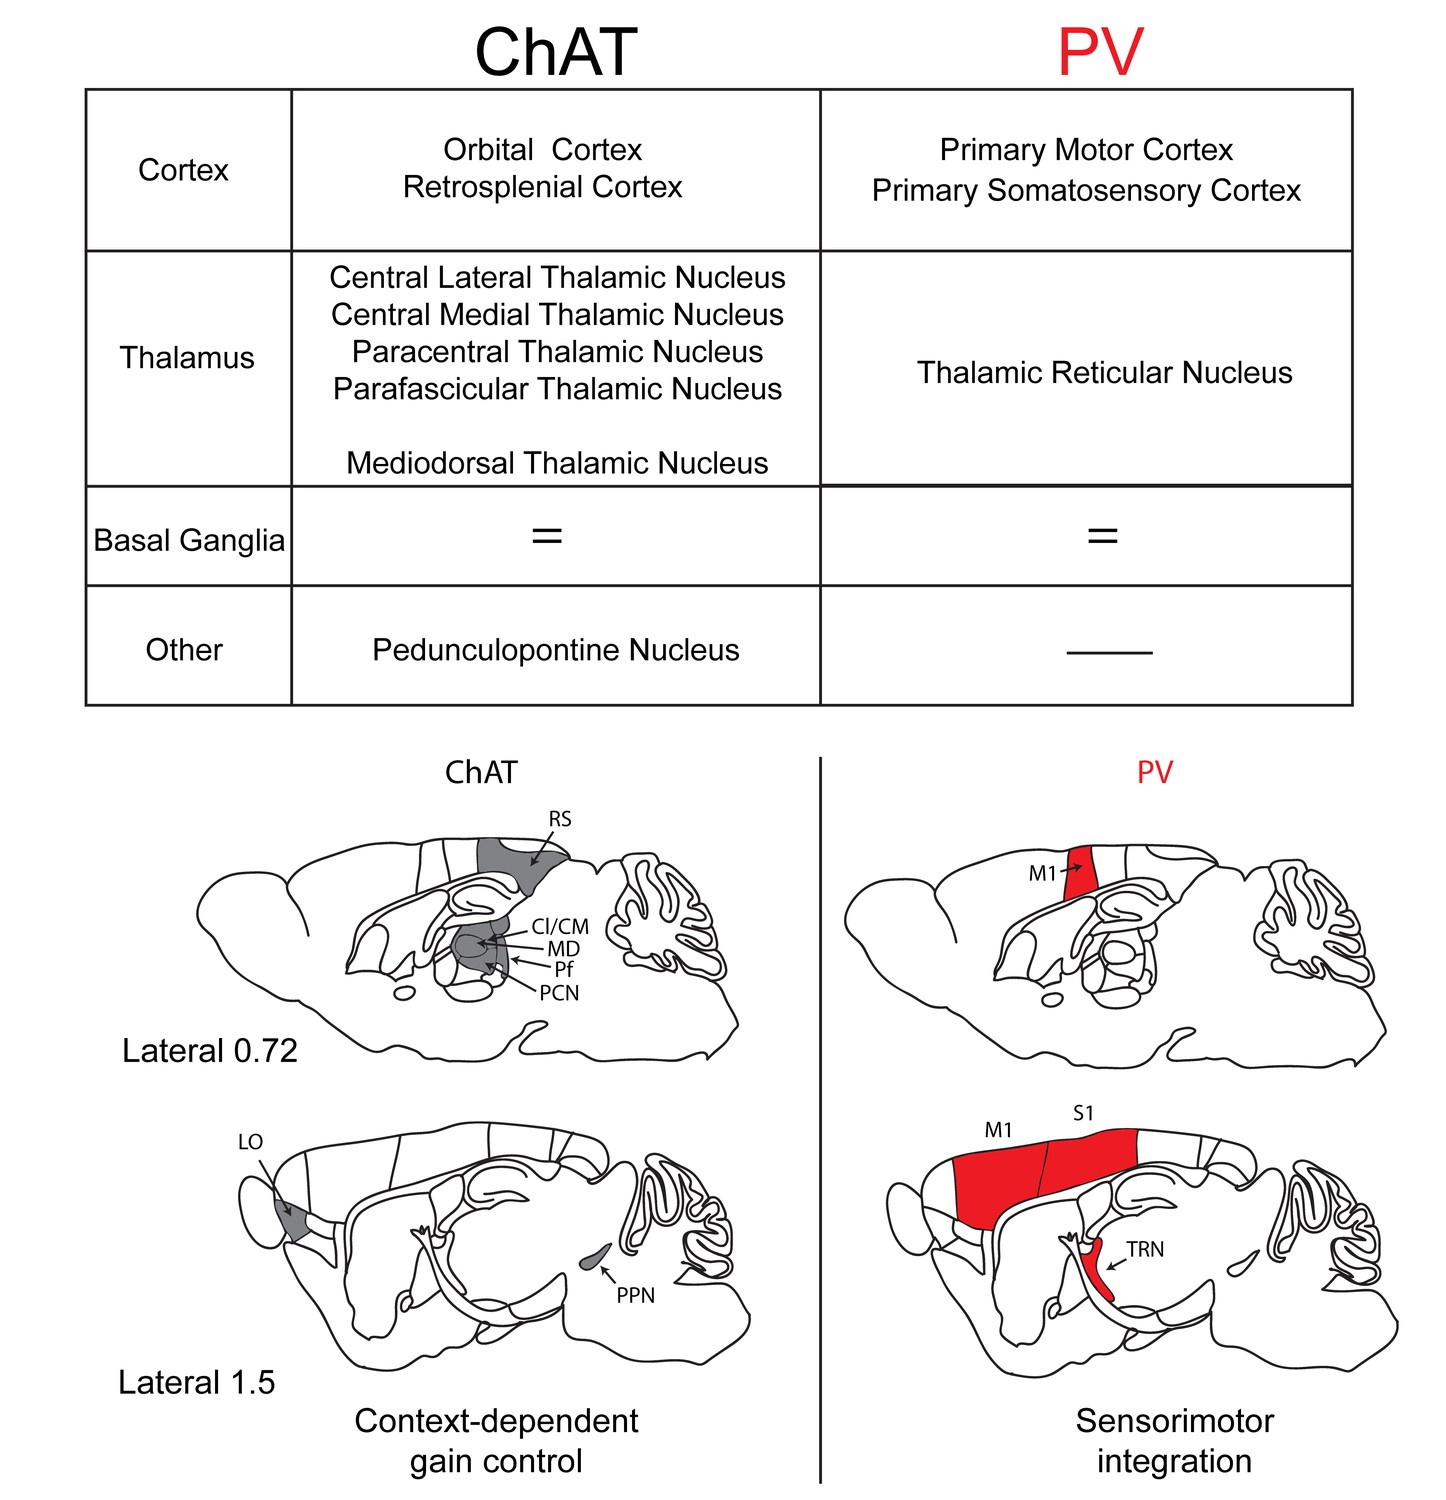
Summary of the inputs and proposed function of striatal ChAT and PV interneurons.
Striatal ChAT interneurons receive preferential inputs from orbital cortex, retrosplenial cortex, intralaminar thalamic nuclei, mediodorsal thalamus and the pedunculopontine nucleus and might be associated with state-dependent gain control of actions. PV interneurons receive dominant inputs from primary motor cortex, primary somatosensory cortex and the thalamic reticular nucleus and might be associated with sensorimotor learning.
Figure 3 with 3 supplements

A projection from thalamic reticular nucleus to striatal PV interneurons.
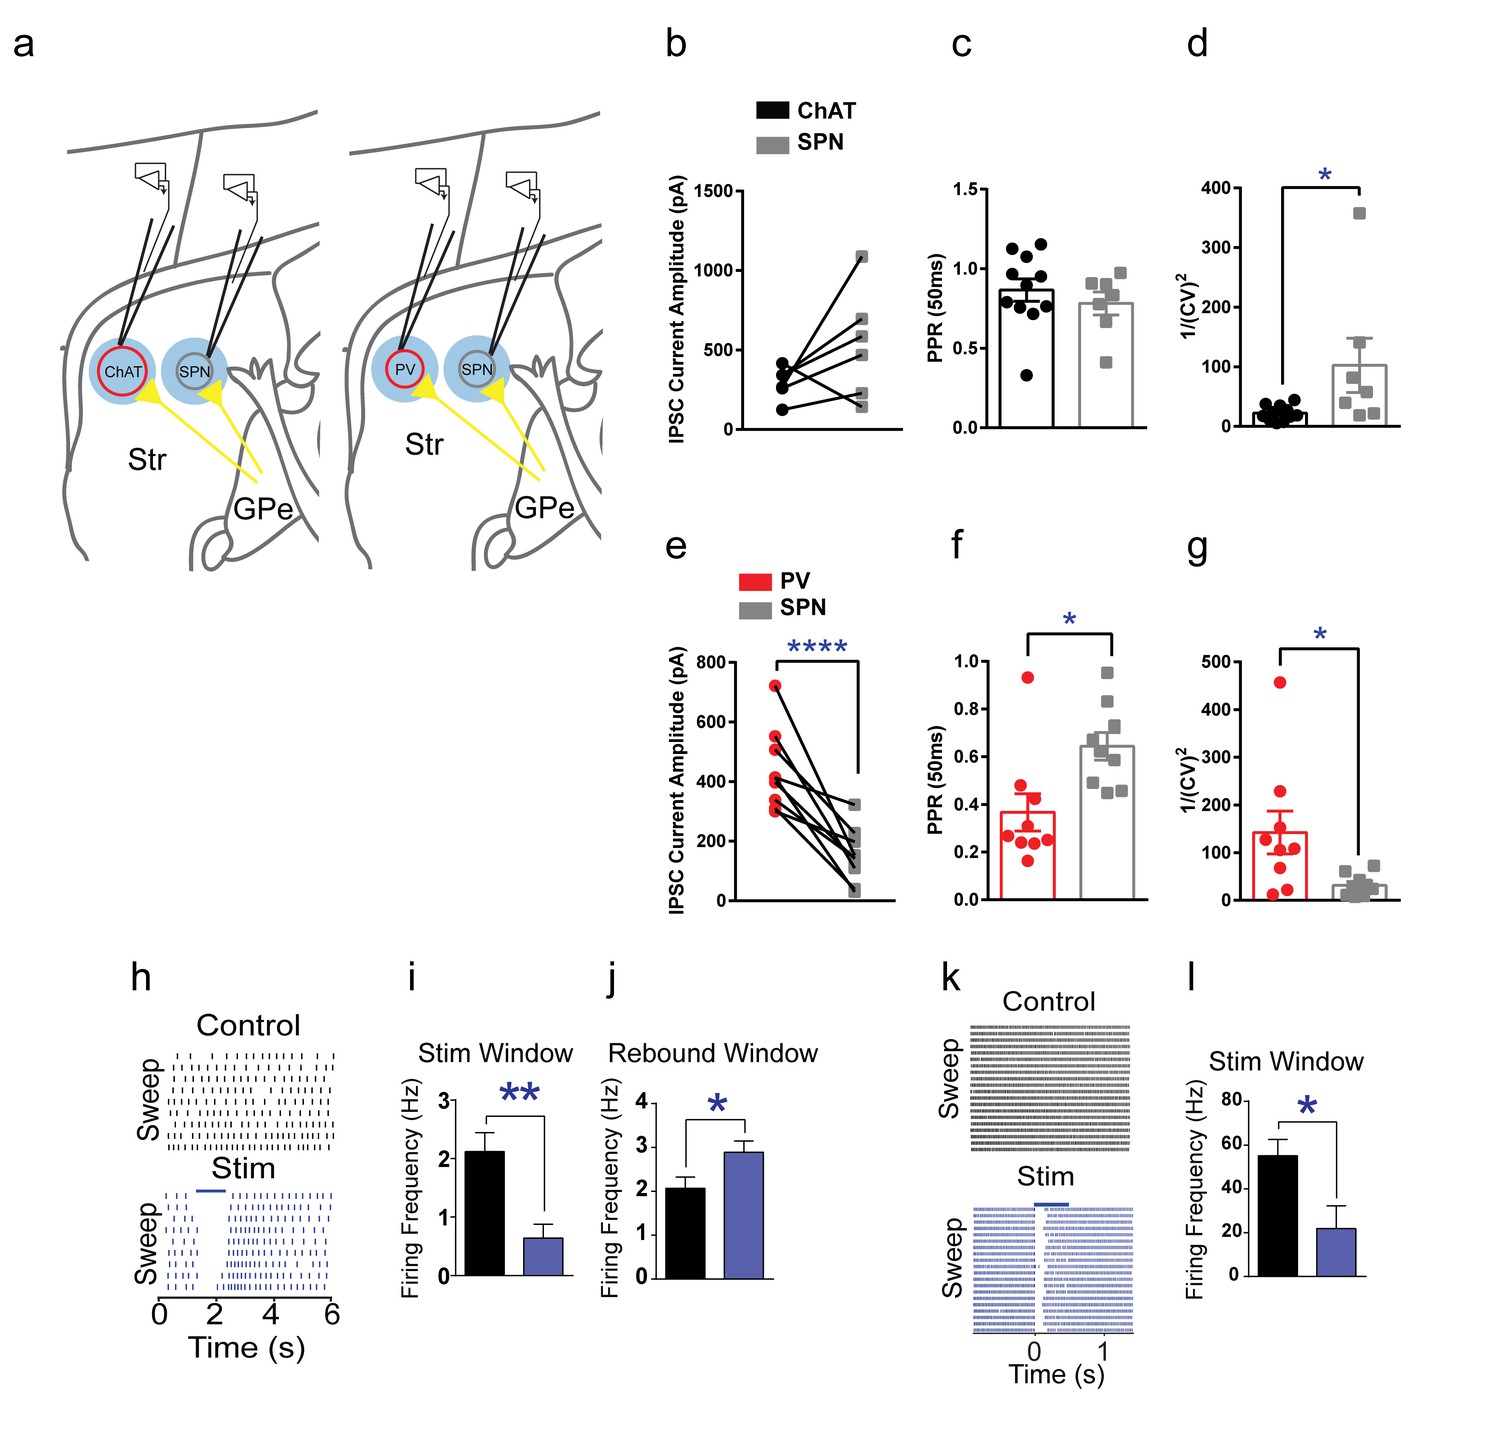
(a) PV interneurons receive a thalamic reticular nucleus (TRN) projection. (b) Rabies-eGFP positive neurons in TRN colocalize with PV immunostaining. Scale bar, 50 µm. Thal = thalamus. (c) Anterograde viral injection scheme to validate TRN to PV interneuron projection. (d) (left) Cre-dependent AAV eGFP is injected in TRN and Cre-dependent AAV tdTomato injected in the dorsal striatum of a PV-Cre mouse. Scale 200 µm. (right) 63x image of eGFP positive terminals on PV interneuron (red) somas and proximal dendrites (white arrows). Scale 10 µm. (e) A convergent intersectional viral approach to trace TRN projections to striatum. (f) (left) Expression of eYFP in anterior TRN cell bodies and axons seen projecting to dorsal thalamus. Note lack of expression in neighboring GPe. Scale bar, 200 µm. (right) Following PV immunostaining, eYFP fibers (yellow-green) from TRN were observed in close apposition to PV cell somas (red). Scale bar, 20 µm. (g) (left) Slice preparation to functionally validate TRN to PV interneuron projections. (right) Overlays of DIC and red channel epifluorescence at 10x (top) and 40x (bottom). Scale bars 200 µm, 20 µm. (h) Whole-cell recordings of paired light evoked IPSCs (50 ms ISI) following TRN terminal stimulation. IPSCs are blocked with GABAAR antagonist, picrotoxin (50 µM). Scale bars, 25 ms, 100 pA. PV (+) cells are held at −70 mV. (i) Striatal PV interneurons showed a fast latency, reliable light evoked IPSC, which is absent in the neighboring SPNs. (j) Individual IPSC current amplitudes of connected cells. (k) One second constant blue laser TRN axon stimulation is sufficient to suppress current injection-induced spiking in a PV interneuron. Scale bars, 500 ms, 25 mV. (l) Optogenetic stimulation of TRN terminals in the striatum was paired with extracellular neuronal recordings using a multi-electrode array. (m–n) Exemplar (top) spike raster and (bottom) firing frequency perievent time histogram (PETH) from a SPN exhibiting slow latency light-evoked inhibition (m), or exhibiting slow latency light-evoked excitation (n). Inset (red): Average single unit waveforms of a putative SPN. Scale bars 0.2 ms, 50µV. (o) Approximately 40% (83/205) of neurons show light-induced firing rate modulation. Half of the responsive SPN population (44/83) exhibited delayed inhibition (red), while others (39/83) exhibited slow latency excitation (blue). See Figure 3—figure supplement 3 for putative PV interneuron light-evoked responses. The following figure supplements are available for Figure 3: Figure 3—figure supplements 1–3.
Figure 3—figure supplement 1
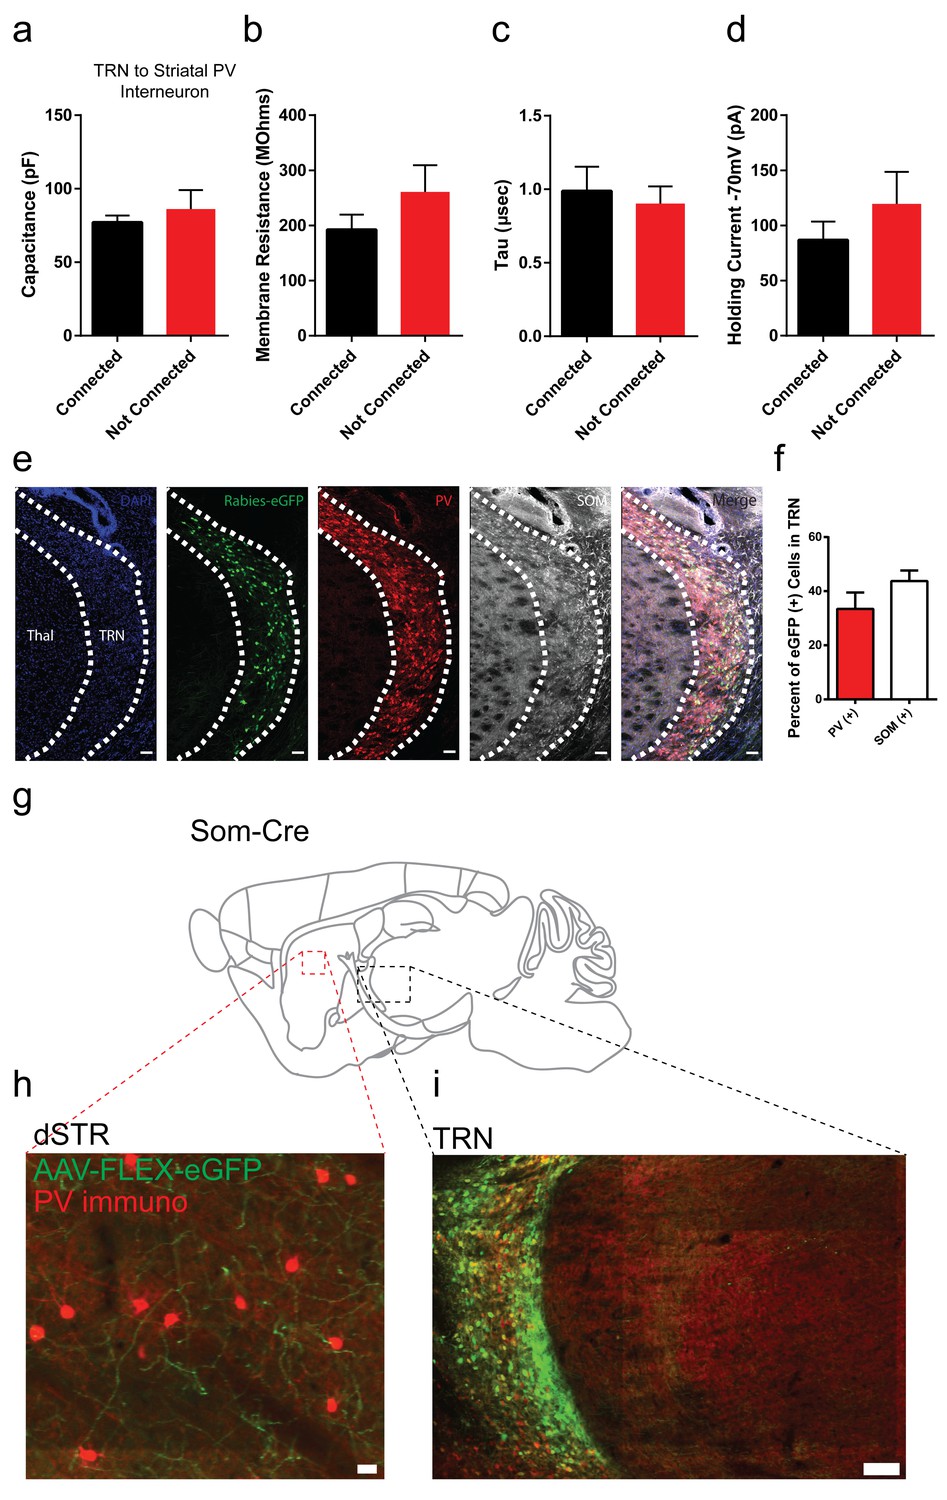
Membrane properties of striatal PV interneurons are similar between TRN connected or non-connected cells.
Rabies positive eGFP cells in TRN colocalize with parvalbumin and somatostatin immunostaining. Somatostatin (Som) positive TRN neurons send projections to striatum. (a–d) Capacitance, membrane resistance, decay tau and holding current of TRN-connected or TRN non-connected PV striatal neurons is not significantly different (two-tailed t-test, p=0.5008, 0.2262, 0.6925, 0.3311). (e) Sagittal image of rabies-eGFP positive neurons in TRN with immunostaining for parvalbumin (red) and somatostatin (grey). Scale bar, 50 µm. Thal = thalamus. (f) Quantification of rabies-eGFP colocalization in TRN with parvalbumin (PV) and somatostatin (SOM) immunostaining. (g) Cartoon sagittal mouse brain slice from a Somatostatin-IRES-Cre mouse. (h) Image of dorsal striatum with Cre-dependent AAV-eGFP terminals from TRN (green) near immunopositive PV interneurons (red). Scale bar, 20 µm. (i) Image of TRN with Cre-dependent AAV-eGFP expression (green) and PV immunostaining (red). Scale bar, 100 µm.
Figure 3—figure supplement 2
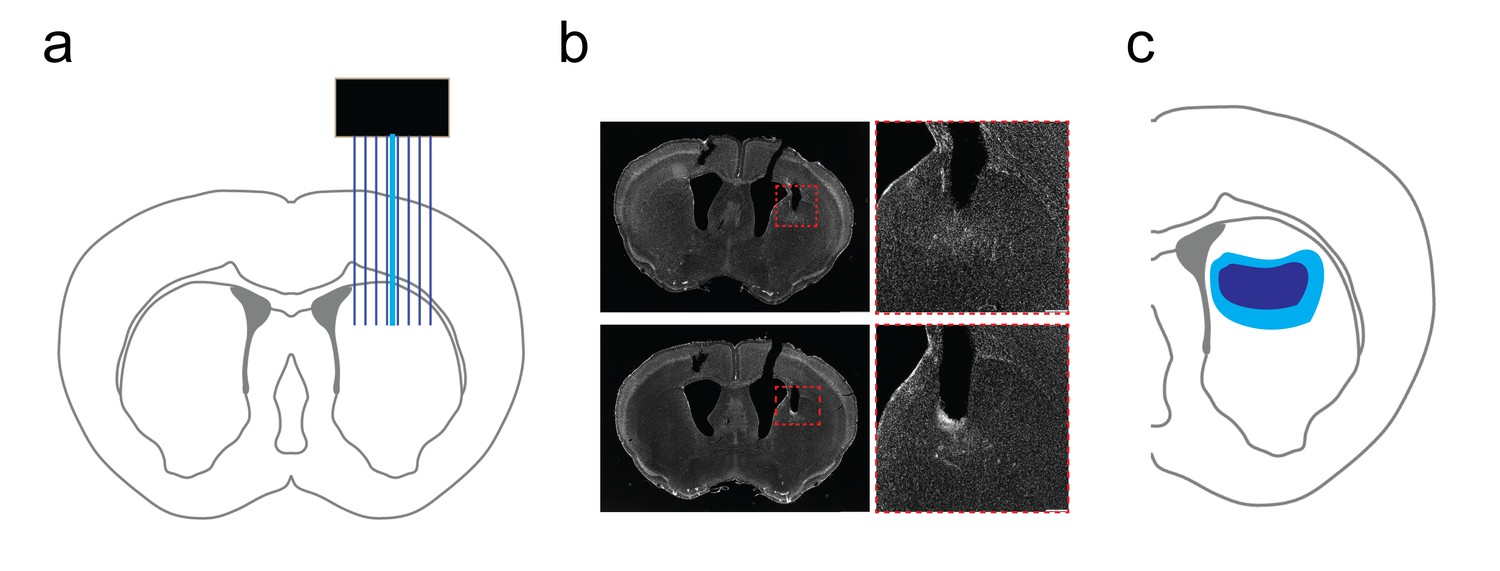
Verification of dorsal striatal in vivo recording array placement.
(a) Cartoon schematic of multichannel array placement with optical fiber for light delivery in dorsal striatum. (b) Grayscale DAPI stained images of striatal slices (left) following in vivo recording with optogenetic stimulation. Scale bar, 1 mm. (Right) inset image of recording area in dashed red box on left. Scale bar, 200 µm. Note the track marking the dorsal boundary of the recording area. (c) Graphical representation of minimum (dark blue) and maximal (light blue) territories for in vivo array placement in dorsal striatum.
Figure 3—figure supplement 3
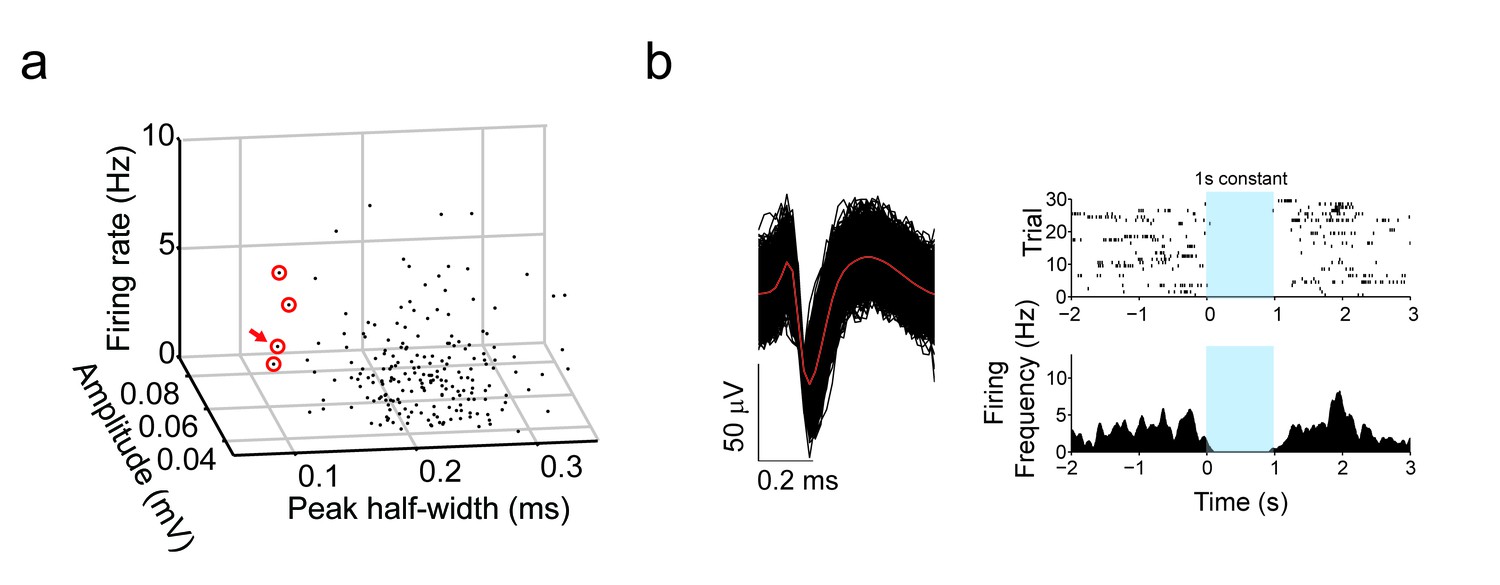
TRN terminal stimulation inhibits putative striatal fast-spiking (PV) interneurons.
(a) 3D plot of all recorded units by peak half-width (ms), amplitude (mV) and firing rate (Hz). Putative PV interneurons sorted by narrow half widths (<0.12 ms). Red circles denotes putative fast spiking interneurons. Red arrow denotes putative fast spiking interneuron in shown in (b). (b) Example of (left) narrow spike waveform of putative fast-spiking (PV) interneurons from in vivo recordings in dorsal striatum of PV-Cre mice (n = 4). Red line denotes average superimposed on individual trials (black). (right, top) Individual trials raster plot of spiking with 1 s constant laser stimulation of TRN terminals in striatum. Blue window represents stimulation period. (right, bottom) Perievent time histograms of spiking (PETH) with 1 s constant laser stimulation of TRN terminals in striatum.
Figure 4 with 2 supplements

Functional projections of GPe to striatal ChAT and PV interneurons.
(a) Experimental approach to label GPe inputs with ChR2 and express tdTomato in ChAT or PV interneurons. (b) Averaged paired-pulse (50 ms ISI) light-evoked IPSCs in striatal ChAT interneuron (black), PV interneuron (red) and SPN (grey) following GPe terminal stimulation in striatum. Cells are held at −10 mV in the presence of AMPAR (10 µM CNQX) and NMDAR (50 µM DL-APV) antagonists. IPSCs are blocked by the GABAAR antagonist picrotoxin (100 µM) (light blue trace). Scale bars, 100 ms, 200 pA. See Figure 4—figure supplement 2 for detailed quantification. (c) The ChAT/SPN paired IPSC ratio is lesser than the PV/SPN paired IPSC ratio (Mann Whitney Test, p=0.0076). (d–e) ChAT interneuron tonic firing is paused by light-evoked stimulation of striatal GPe terminals, evident from single trace (d) and the firing rate PETH (e). Scale bars, 1 s, 20 mV. Dark line represents mean and shading denotes SEM in PETH. GPe terminal stimulation promotes ChAT tonic firing activity pause (two-tailed t-test, p=0.0014) and subsequent rebound (two-tailed t-test, p=0.0469). See Figure 4—figure supplement 2h–j for multiple trial raster and quantification. (f–g) Suppression of spiking activity in striatal PV interneurons following GPe terminal stimulation for single trace (f), and the firing rate PETH (g). Scale bars, 250 ms, 25 pA. Quantification of suppression of PV interneuron spiking activity by GPe terminal stimulation (two-tailed t-test, p=0.0401). See Figure 4—figure supplement 2k,l for multiple trial raster and quantification. (h) In vivo recording of striatal SPNs during optogenetic stimulation of GPe terminals in striatum. (i–j) Representative SPNs showing excitation (i) or inhibition (j) during optogenetic GPe terminal stimulation. Inset (red): Average single unit waveforms of a putative SPN. Scale bars 0.2 ms, 50µV. (k) Pie chart of light modulated SPNs firing activity following GPe laser stimulation. The following figure supplements are available for Figure 4: Figure 4—figure supplements 1 and 2.
Figure 4—figure supplement 1
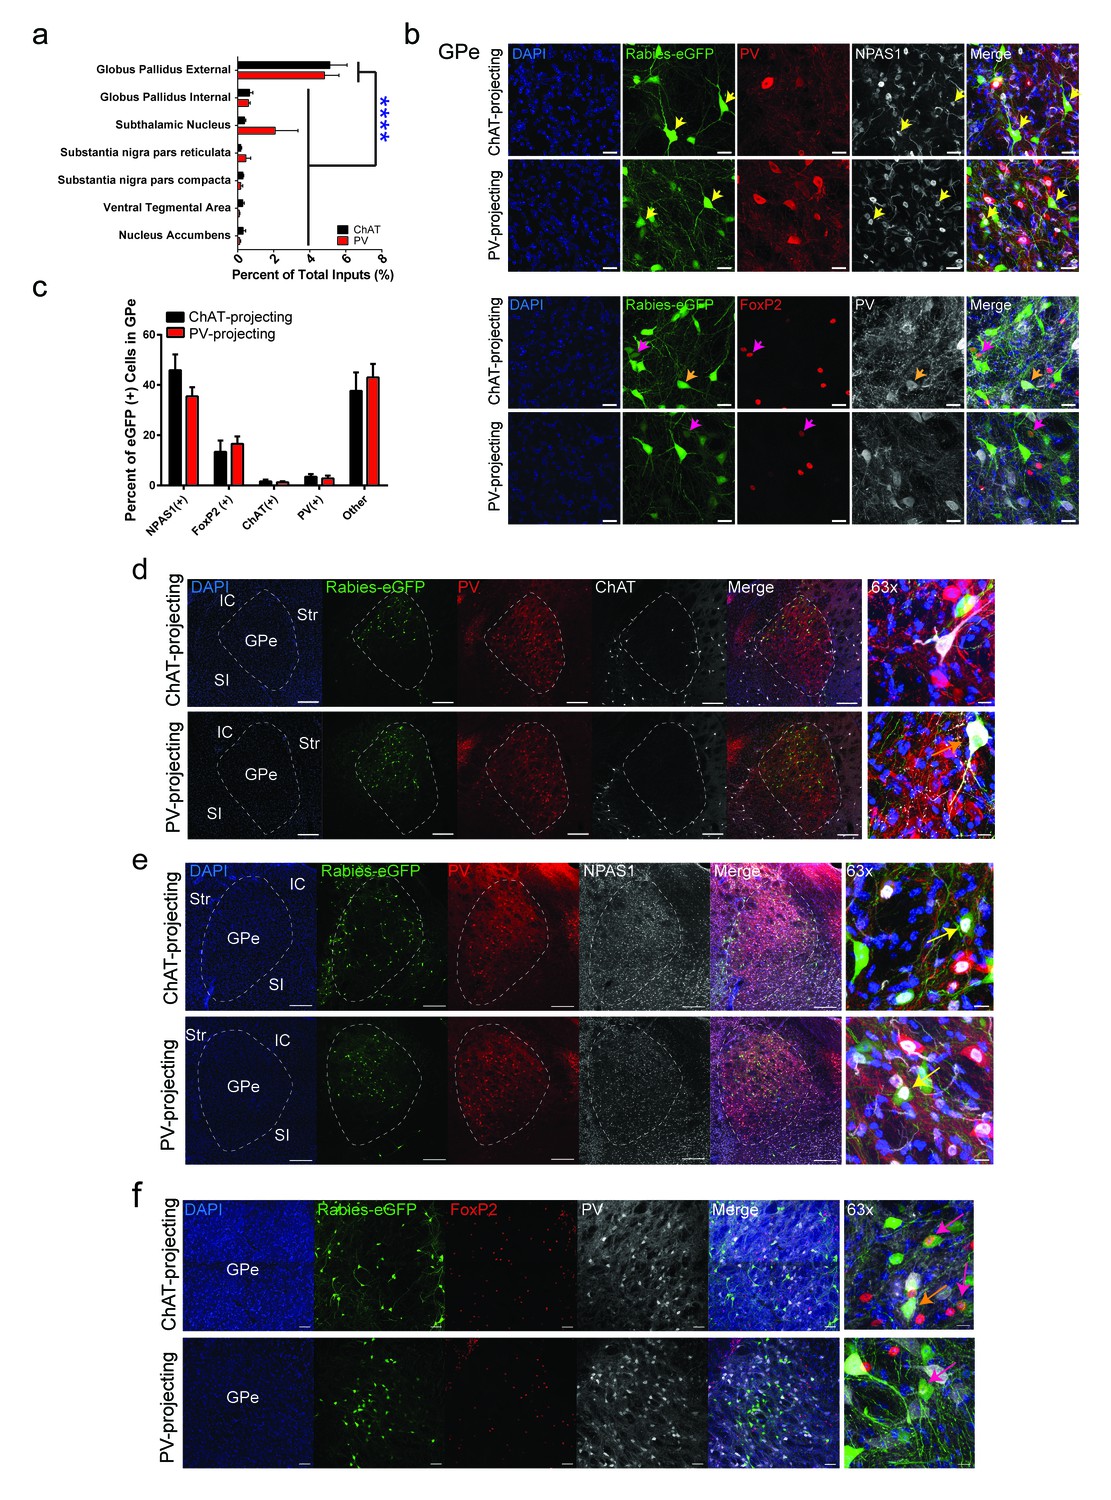
Cell-type identity of GPe projections to striatal ChAT and PV interneurons.
(a) GPe is the predominant basal ganglia input to ChAT and PV interneurons (two-way ANOVA, F (6,63)=27.27, p<0.0001). (b–c) (top) Few GPe rabies-eGFP neurons colocalize with immunostaining for PV, while a population of GPe rabies-eGFP neurons colocalized with the transcription factor, (top) NPAS1 or (bottom) FoxP2. Scale bars, 20 µm. Yellow arrowheads denote rabies-eGFP and NPAS1 colocalized neurons. Pink arrowheads denote rabies-eGFP and FoxP2 colocalized neurons. Orange arrowheads denote rabies-eGFP and PV colocalized neurons. (d) Few GPe rabies-eGFP neurons colocalize with immunostaining for PV and ChAT. Orange arrows denote colocalized rabies-eGFP expression with ChAT. IC, internal capsule; Str, striatum; GPe, globus pallidus external segment; SI, substantia innominata. Scale bars, 200 µm.; 63x scale, 20 µm. (e) A population of GPe rabies-eGFP neurons colocalize with the transcription factor NPAS1. Yellow arrows denote colocalized rabies-eGFP expression with NPAS1 immunostaining. Scale bars, 200 µm; 63x scale, 20 µm. (f) A population of rabies-eGFP GPe neurons colocalize with FoxP2 immunostaining. Pink arrows denote colocalized rabies-eGFP expression with FoxP2 immunostaining, while orange arrows denote colocalized rabies-eGFP and PV immunostaining. Scale bar, 50 µm; 63x scale, 10 µm.
Figure 4—figure supplement 2
GPe functional inhibitory connectivity to ChAT interneurons, PV interneurons and SPNs.
(a) Cartoon schematic showing whole-cell recordings from pairs of interneurons and neighboring SPNs following light-evoked GPe terminal stimulation. (b) IPSCs from pairs of tdTomato (+) ChAT interneurons and neighboring tdTomato (-) SPNs. (c) Paired-pulse ratio (ISI, 50 ms) of ChAT and SPNs IPSCs. (d) 1/(CV)2 measure of trial-to-trial IPSC amplitude variance is larger in SPNs compared to ChAT (Mann Whitney test, p=0.0114). (e) PV IPSC amplitude is significantly larger than paired neighboring SPNs (two-tailed t-test, p<0.0001). (f) Significantly reduced paired-pulse ratio PV IPSCs (50 ms) versus paired neighboring SPNs suggests an increased probability of release (two-tailed t-test, p=0.0114). (g) 1/(CV)2 measure of trial-to-trial IPSC amplitude variance is larger in PV versus SPNs (two-tailed t-test, p=0.014). (h) ChAT interneuron tonic firing is paused by light-evoked stimulation of striatal GPe terminals, evident over multiple trials. (i–j) Statistic results of GPe terminal stimulation on ChAT firing activity pause (i, two-tailed t-test, p=0.0014) and rebound (j, two-tailed t-test, p=0.0469). (k) Suppression of spiking activity in striatal PV interneurons following GPe terminal stimulation over multiple trials. (l) Quantification of suppression of PV interneuron spiking activity by GPe terminal stimulation (two-tailed t-test, p=0.0401).
Figure 5

Excitatory projections from pedunculopontine nucleus to striatal ChAT interneurons.
(a) Rabies-labeled projections to striatal ChAT interneurons from the PPN are not cholinergic. Note no colocalized eGFP (green) and ChAT immunostaining (red). scp, superior cerebellar peduncle. Scale bars, 200 µm. (b) Viral injection scheme to anterogradely verify the PPN projections to striatum. (c) (left) Sagittal image of eYFP terminal expression following injection of AAV-ChR2-eYFP in PPN. Scale bar, 1 mm (top). (right) Sagittal image of PPN injection site with AAV-ChR2-eYFP expression. Scale bar, 100 µm. Note many eYFP fibers from PPN target on tdTomato expressing ChAT interneurons (orange and pink arrowheads). Scale bar, 200 µm (left), 20 µm (right). (d) Diagram for functional validation of PPN projections to striatum in brain slices. (e) DIC and epifluorescent images of patched dorsal striatal ChAT and neighboring SPN neurons. Scale bar, 200 µm (DIC), 50 µm (epifluorescent). (f) Example average current trace at −70 mV or 0 mV under control (black), after blocking AMPAR and NMDAR currents (yellow) or blocking GABAAR currents (grey). Scale bar, 25 ms, 25 pA. (g) Percentage of ChAT and SPN neurons exhibiting fast latency (<6 ms) excitatory (blue), inhibitory (red) or both (blue/red stripes) currents following PPN terminal stimulation.
Tables
Key resources table
| Reagent type (species) or resource | Designation | Source or reference | Identifiers | Additional information |
|---|---|---|---|---|
| Strain, strain background (Mus musculus) | ChAT-IRES-Cre | Jackson Labs | stock #006410; RRID:IMSR_JAX:006410 | maintained on a C57BL6/J background |
| Strain, strain background (Mus musculus) | PV-Cre | Jackson Labs | stock #008069; RRID:IMSR_JAX:008069 | maintained on a C57BL6/J background |
| Strain, strain background (Mus musculus) | Sst-IRES-Cre | Jackson Labs | stock #028864; RRID:IMSR_JAX:028864 | maintained on a C57BL6/J background |
| Strain, strain background (Adeno-associated virus) | AAV5-TVA-mCherry | UNC Viral Vector Core | RRID: SCR_002448 | 3–4.3 × 10¹² particles/mL |
| Strain, strain background (Adeno-associated virus) | AAV8-CA-RG | UNC Viral Vector Core | RRID: SCR_002448 | 1.2–4.3 × 10¹² particles/mL |
| Strain, strain background (Adeno-associated virus) | (EnvA) SAD-∆G Rabies-eGFP | Salk Vector Core | RRID: SCR_014847 | 1.6–6.55 × 10⁸ particles/mL |
| Strain, strain background (Adeno-associated virus) | AAV9-Ef1a-DIO-ChR2 (H134R)-eYFP | University of Penn Viral Vector Core | RRID: SCR_015406 | two × 1012 particles/mL |
| Strain, strain background (Adeno-associated virus) | AAV9-FLEX-tdTomato | University of Penn Viral Vector Core | RRID: SCR_015406 | two × 1012 particles/mL |
| Strain, strain background (Adeno-associated virus) | AAVretro-EF1a-Flp | UNC Viral Vector Core | RRID: SCR_002448 | two × 1012 particles/mL |
| Strain, strain background (Adeno-associated virus) | AAV9-hsyn-Con-Fon-hChR2-eYFP | UNC Viral Vector Core | RRID: SCR_002448 | two × 1012 particles/mL |
| Strain, strain background (Adeno-associated virus) | AAV9-FLEX-eGFP | University of Penn Viral Vector Core | RRID: SCR_015406 | two × 1012 particles/mL |
| Strain, strain background (Adeno-associated virus) | AAV9-hsyn-ChR2-eYFP | University of Penn Viral Vector Core | RRID: SCR_015406 | two × 1012 particles/mL |
| Antibody | anti-PV (mouse,monoclonal) | MilliporeSigma | P3088; RRID: AB_477329 | 1/1000 |
| Antibody | anti-PV (rabbit, polyclonal) | Abcam | ab11427; RRID: AB_298032 | 1/1000 |
| Antibody | anti-ChAT (goat, polyclonal) | MilliporeSigma | AB144P; RRID: AB_2079751 | 1/100 |
| Antibody | anti-NPAS1 (rabbit, polyclonal) | GeneTex | GTX105876; RRID: AB_424768 | 1/500 |
| Antibody | anti-mCherry (mouse, monoclonal) | Takara Bio USA, Inc (Clontech Labs) | 632543; RRID: AB_2307319 | 1/250 |
| Antibody | anti-eGFP (rabbit, polyclonal) | Thermo Fisher Scientific | A11122; RRID: AB_1074875 | 1/400 |
| Antibody | anti-somatostatin (rabbit, polyclonal) | Protos Biotech Corp | NP106SST | 1/300 |
| Antibody | anti-FoxP2 (rabbit, polyclonal) | Sigma | HPA000382; RRID: AB_1078908 | 1/1000 |
| Antibody | donkey anti-mouse 488 (secondary) | Jackson Immunoresearch | 715-545-150; RRID: AB_2340846 | 1/250 |
| Antibody | donkey anti-mouse CY3 (secondary) | Jackson Immunoresearch | 715-165-150; RRID: AB_2340813 | 1/250 |
| Antibody | donkey anti-mouse CY5 (secondary) | Jackson Immunoresearch | 715-175-150; RRID: AB_2340819 | 1/250 |
| Antibody | donkey anti-rabbit 488 (secondary) | Jackson Immunoresearch | 711-545-152; RRID: AB_2313584 | 1/250 |
| Antibody | donkey anti-rabbit CY3 (secondary) | Jackson Immunoresearch | 711-165-152; RRID: AB_2307443 | 1/250 |
| Antibody | donkey anti-rabbit CY5 (secondary) | Jackson Immunoresearch | 711-175-152; RRID: AB_2340607 | 1/250 |
| Antibody | donkey anti-goat 488 (secondary) | Jackson Immunoresearch | 705-545-147; RRID: AB_2336933 | 1/250 |
| Antibody | donkey anti-goat CY3 (secondary) | Jackson Immunoresearch | 705-165-147; RRID: AB_2307351 | 1/250 |
| Antibody | donkey anti-goat CY5 (secondary) | Jackson Immunoresearch | 705-175-147; RRID: AB_2340415 | 1/250 |
| Chemical compound, drug | NBQX disodium salt hydrate | MilliporeSigma | N183 | 10 uM (final) |
| Chemical compound, drug | DL-APV | MilliporeSigma | A5282 | 50 uM (final) |
| Chemical compound, drug | Picrotoxin | MilliporeSigma | P1675 | 50–100 uM (final) |
| Chemical compound, drug | NMDG | MilliporeSigma | M2004 | |
| Chemical compound, drug | HCl | MilliporeSigma | H1758 | |
| Chemical compound, drug | KCl | MilliporeSigma | P9541 | |
| Chemical compound, drug | NaH2PO4 | MilliporeSigma | S3139 | |
| Chemical compound, drug | NaHCO3 | MilliporeSigma | S6014 | |
| Chemical compound, drug | Glucose | MilliporeSigma | G5767 | |
| Chemical compound, drug | Sodium L-Ascorbate | MilliporeSigma | A4034 | |
| Chemical compound, drug | Sodium Pyruvate | MilliporeSigma | P2256 | |
| Chemical compound, drug | Thiourea | MilliporeSigma | T8656 | |
| Chemical compound, drug | MgSO4 | MilliporeSigma | M2643 | |
| Chemical compound, drug | CaCl2 | MilliporeSigma | 223506 | |
| Chemical compound, drug | MgCl2 | MilliporeSigma | M9272 | |
| Chemical compound, drug | KMeSO4 | MilliporeSigma | 83000 | |
| Chemical compound, drug | HEPES | MilliporeSigma | H4034 | |
| Chemical compound, drug | EGTA | MilliporeSigma | 3777 | |
| Chemical compound, drug | Mg-ATP | MilliporeSigma | A9187 | |
| Chemical compound, drug | Na-GTP | MilliporeSigma | G8877 | |
| Chemical compound, drug | CsCl | MilliporeSigma | C4036 | |
| Chemical compound, drug | CsMeSO3 | MilliporeSigma | C1426 | |
| Chemical compound, drug | QX-314 | MilliporeSigma | L5783 | |
| Chemical compound, drug | TEA-Cl | MilliporeSigma | T2265 | |
| Software, algorithm | MATLAB | RRID: SCR_001622 | ||
| Software, algorithm | GraphPad Prism 6 | RRID: SCR_002798 | ||
| Software, algorithm | Adobe Illustrator CS6 | RRID: SCR_010279 | ||
| Software, algorithm | pClamp9 | RRID: SCR_011323 | ||
| Software, algorithm | Fiji/Imagej | RRID: SCR_002285 | ||
| Other | Allen Reference Atlas | RRID: SCR_013286 |
Additional files
-
Source code 1
MATLAB script for perievent time histogram (PETH) plot.
Plot PETH of ChAT or PV interneuron firing rates aligned to laser on (time zero).
- https://doi.org/10.7554/eLife.35657.016
-
Transparent reporting form
- https://doi.org/10.7554/eLife.35657.017
Download links
A two-part list of links to download the article, or parts of the article, in various formats.
Downloads (link to download the article as PDF)
Open citations (links to open the citations from this article in various online reference manager services)
Cite this article (links to download the citations from this article in formats compatible with various reference manager tools)
Differential inputs to striatal cholinergic and parvalbumin interneurons imply functional distinctions
eLife 7:e35657.
https://doi.org/10.7554/eLife.35657


