Allosteric regulators selectively prevent Ca2+-feedback of CaV and NaV channels
- Johns Hopkins University, United States
- University of Maryland, United States
- Columbia University, United States
Figures
Figure 1 with 1 supplement
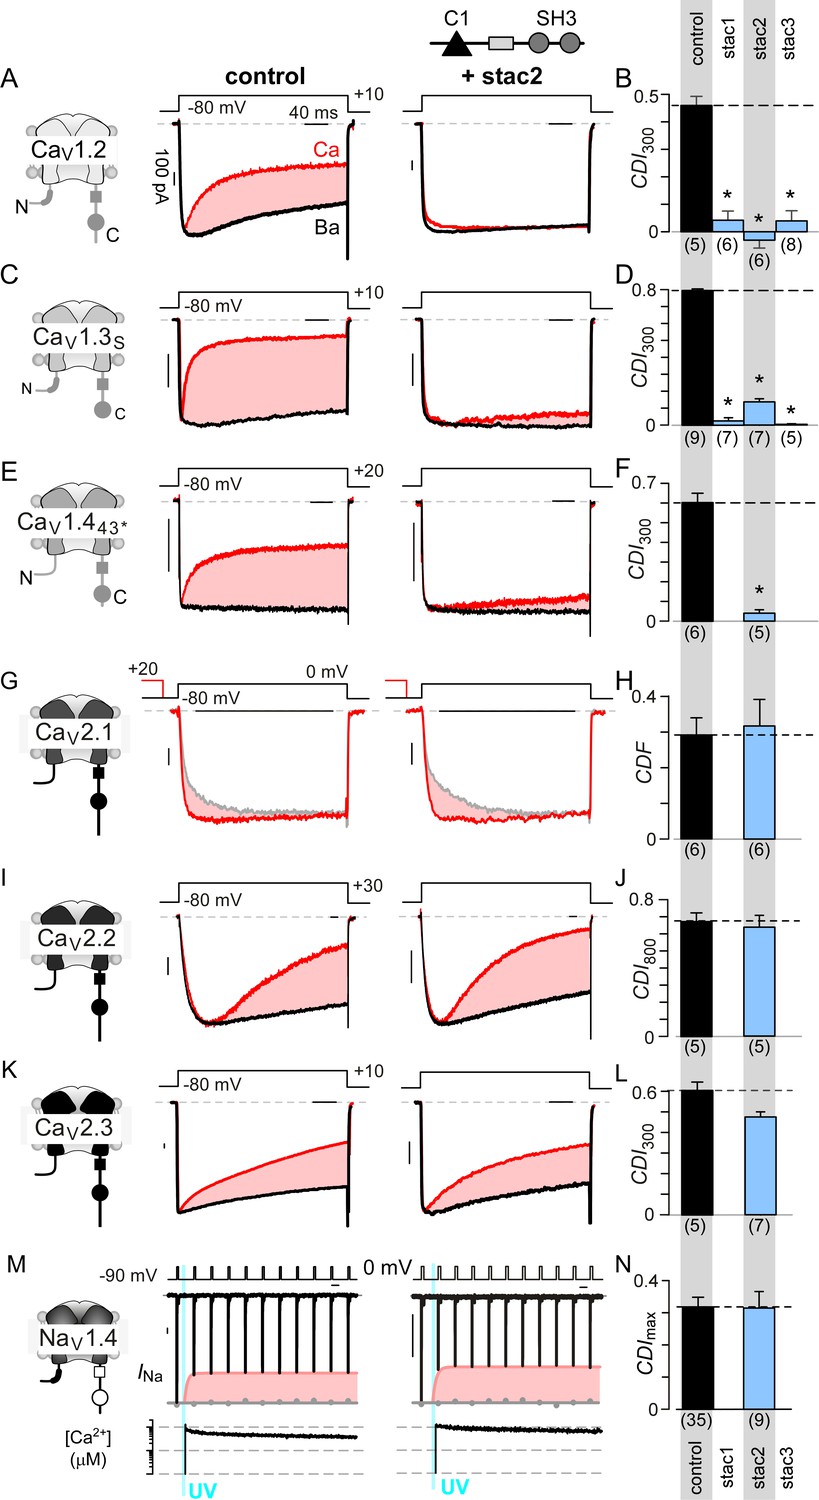
Stac specifically abolishes Ca2+/CaM-regulation in CaV1 channels.
(A) Stac2 diminishes CDI of CaV1.2. Left, cartoon schematic shows CaV1.2. Middle, exemplar current traces evoked in response to +10 mV voltage-step shows robust CDI (rose shaded area) evident as enhanced current decay with Ca2+ (red) versus Ba2+ (black) as the charge carrier. Right, stac2 abolishes CDI. Steady-state levels of inactivation are assessed as the fraction of peak current remaining following 300 ms depolarization (rCa and rBa) and CDI = 1 – rCa/rBa. (B) Bar graph displays population data of CDI300 for CaV1.2 in the absence and in the presence of stac1, stac2, or stac3. Dashed line shows baseline CDI in the absence of stac for comparison. Each bar, mean ±S.E.M. obtained from specified number of cells (n). (C–D) Stac isoforms suppress CDI of CaV1.3S, the canonical short variant, as confirmed by both exemplar traces (C) and population data (D). Format as in (A) and (B). (E–F) Stac2 abolishes CDI of CaV1.443* assessed in response to +20 mV test pulse. Format as in (A) and (B). (G–H) Stac2 spares CDF of CaV2.1, as evaluated using a prepulse protocol. An isolated test pulse to 0 mV elicits Ca2+ currents with biphasic activation (gray, G). With a + 20 mV prepulse, channels are partially facilitated and the slow component of activation is reduced (red, G). The area between the two current traces (ΔQ), divided by τslow, yields facilitation (g). Bar graph plots, CDF = gCa – gBaH). Each bar, mean ±S.E.M from specified number of cells (n). (I–J) Stac2 spares CDI of CaV2.2 assessed in response to +30 mV test pulse. Here, CDI is evaluated following 800 ms of depolarization to accommodate slow inactivation kinetics, yielding CDI800. Format as in (A) and (B). (K–L) Stac2 spares CDI of CaV2.3. Format as in (A) and (B). (M–N) Stac2 spares CDI of NaV1.4. Both in the absence and presence of stac, NaV1.4 peak currents decline following a Ca2+ step (rose fit) (M). Gray dots, peak currents before uncaging. CDI = 1 – average peak INa of last three to four responses after Ca2+ uncaging / peak INa before uncaging. Bar graph plots maximal CDI observed with Ca2+ steps > 5 μM (N). Each bar, mean ±S.E.M.
Figure 1—figure supplement 1
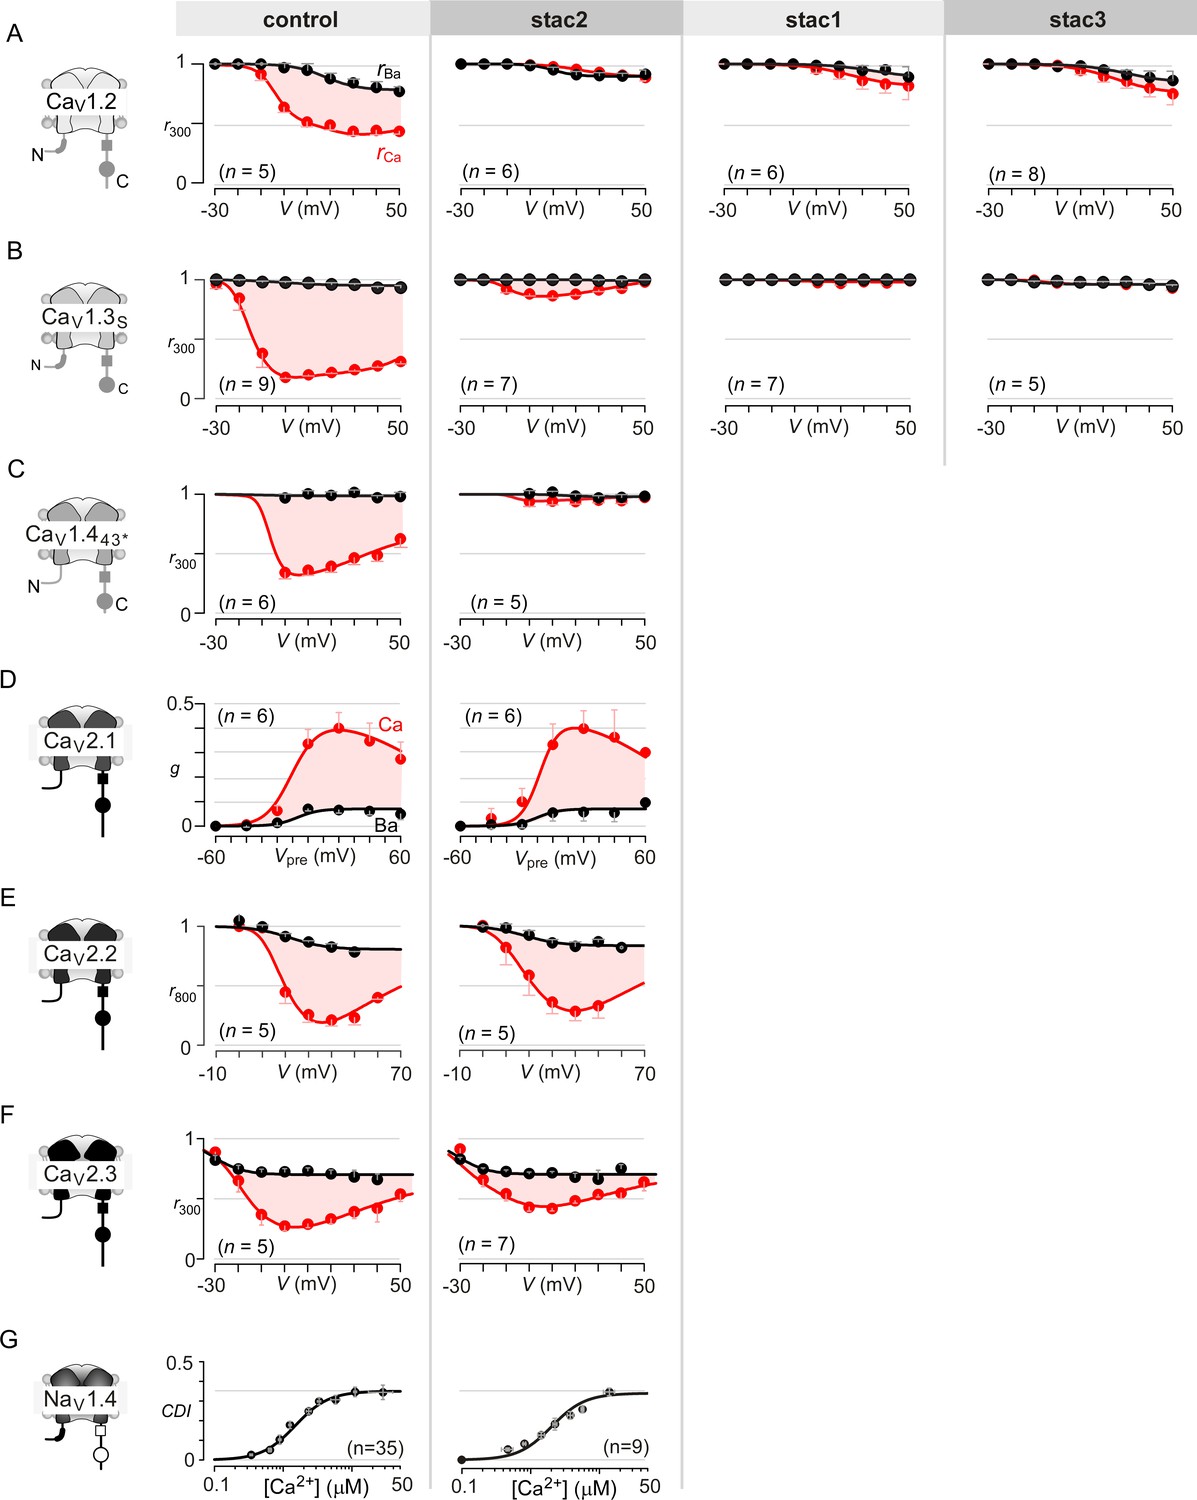
Extended data highlight selectivity of stac in modulating CaV1 versus CaV2 and NaV1 channels.
(A) Stac1-3 isoforms strongly diminish CDI of CaV1.2 (schematized in the far left subpanel). In the absence of stac, CaV1.2 exhibits robust CDI (red shaded area, middle left subpanel). Co-expression of stac2 (middle), stac1 (middle right), and stac3 (far right), all suppress CDI. The steady-state extent of inactivation in Ca2+ (red) and Ba2+ (black), here, is estimated by the metric r300, the ratio of current remaining at 300 ms to peak current during a depolarizing pulse, plotted as a function of voltage. Each symbol, mean ±S.E.M. from specified number of cells (n). (B) Stac1-3 isoforms suppress CDI of CaV1.3. Format as in (A). (C) Stac2 co-expression abolishes CDI of CaV1.443* alternatively spliced variant. Format as in (A). (D) Stac2 does not alter CDF of CaV2.1. A prepulse protocol is used to estimate CDF. A step depolarization to 0 mV evokes an inward current containing rapid and slow components caused by a superposition of voltage activation and CDF. With a preceding voltage step to 20 mV, sufficient Ca2+ enters to partially facilitate the channels, such that the subsequent step to 0 mV has a markedly blunted slow component (Figure 1G). The area between the two current traces (ΔQ), divided by τslow, yields the parameter g, an estimate of facilitation triggered by the prepulse. Here, g plotted as a function of prepulse potentials reveals a U-shaped dependence of Ca2+-dependent facilitation. Facilitation is similar in the absence (middle subpanel) and presence of stac2 (right subpanel). (E) Stac2 does not suppress CDI of CaV2.2. The steady-state extent of inactivation in Ca2+ (red) and Ba2+ (black), here, is estimated by the metric r800, the ratio of current remaining at 800 ms to peak current during a depolarizing pulse, plotted as a function of voltage. Robust CDI is detected under both control conditions (middle subpanel) and stac2 co-expression (right subpanel). (F) Similarly, CDI of CaV2.3 is not greatly affected. Format as in (A). (G) Stac2 spares CDI of NaV1.4. Mean data for CDI are plotted versus Ca2+-step amplitude. CDI = 1 − average peak INa of last three to four responses after Ca2+uncaging/peak INa before uncaging. Symbols, mean ±S.E.M. of ∼four uncaging events compiled from denoted number of cells (n).
Figure 2 with 1 supplement
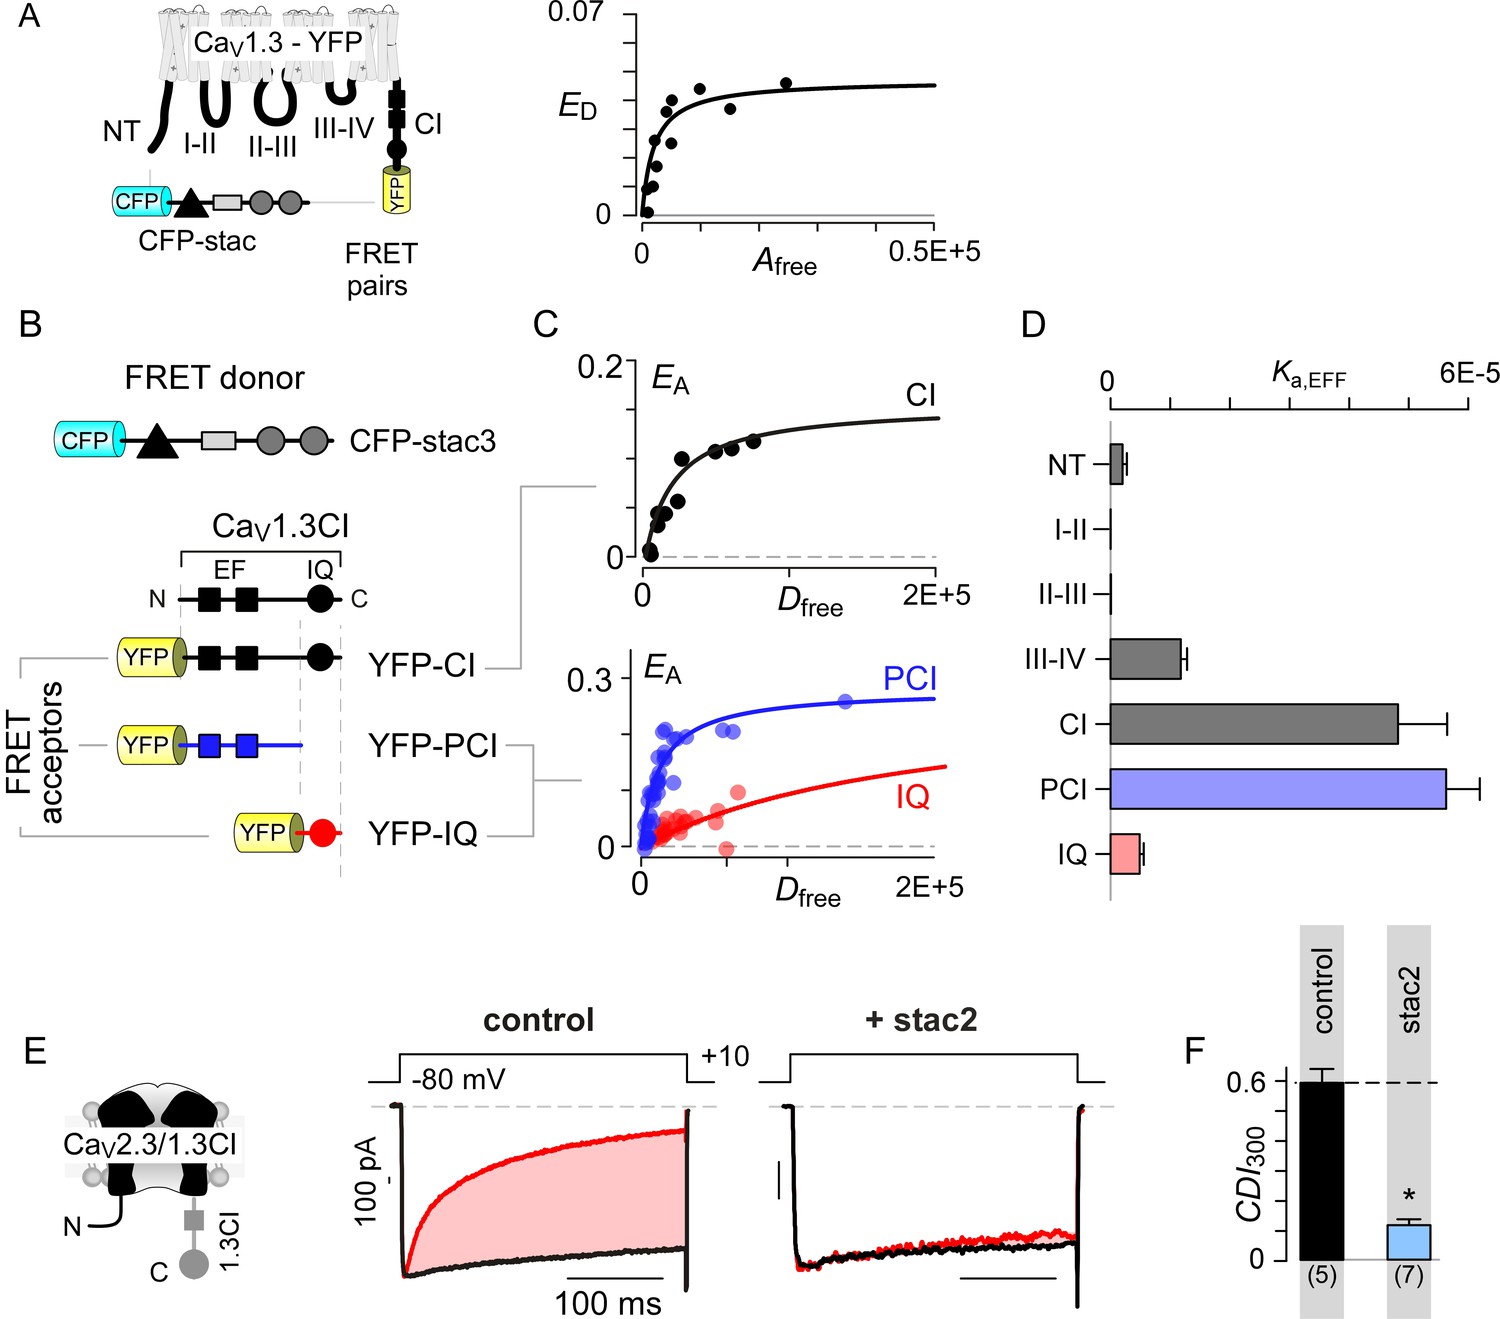
Stac interacts with the channel carboxy-terminus.
(A) Live-cell FRET 2-hybrid assay shows high-affinity interaction between CFP-tagged stac3 with YFP-tethered holo-CaV1.3 channels in the presence of auxiliary β2A and α2δ subunits. (B) Cartoon shows FRET pairs, CFP-stac3 with YFP-CI, YFP-PCI, and YFP-IQ of CaV1.3. (C) FRET-binding curves show robust binding of stac3 to both the CI and PCI segment while binding to IQ is weaker. (D) Bar graph summarizes the relative association constant, Ka,EFF, of stac2 binding to major channel intracellular domains. (E–F) Transferring CaV1.3S CI to CaV2.3 (CaV2.3/1.3 CI) unveils latent stac2-mediated suppression of CDI. Format as in Figure 1A – B.
Figure 2—figure supplement 1
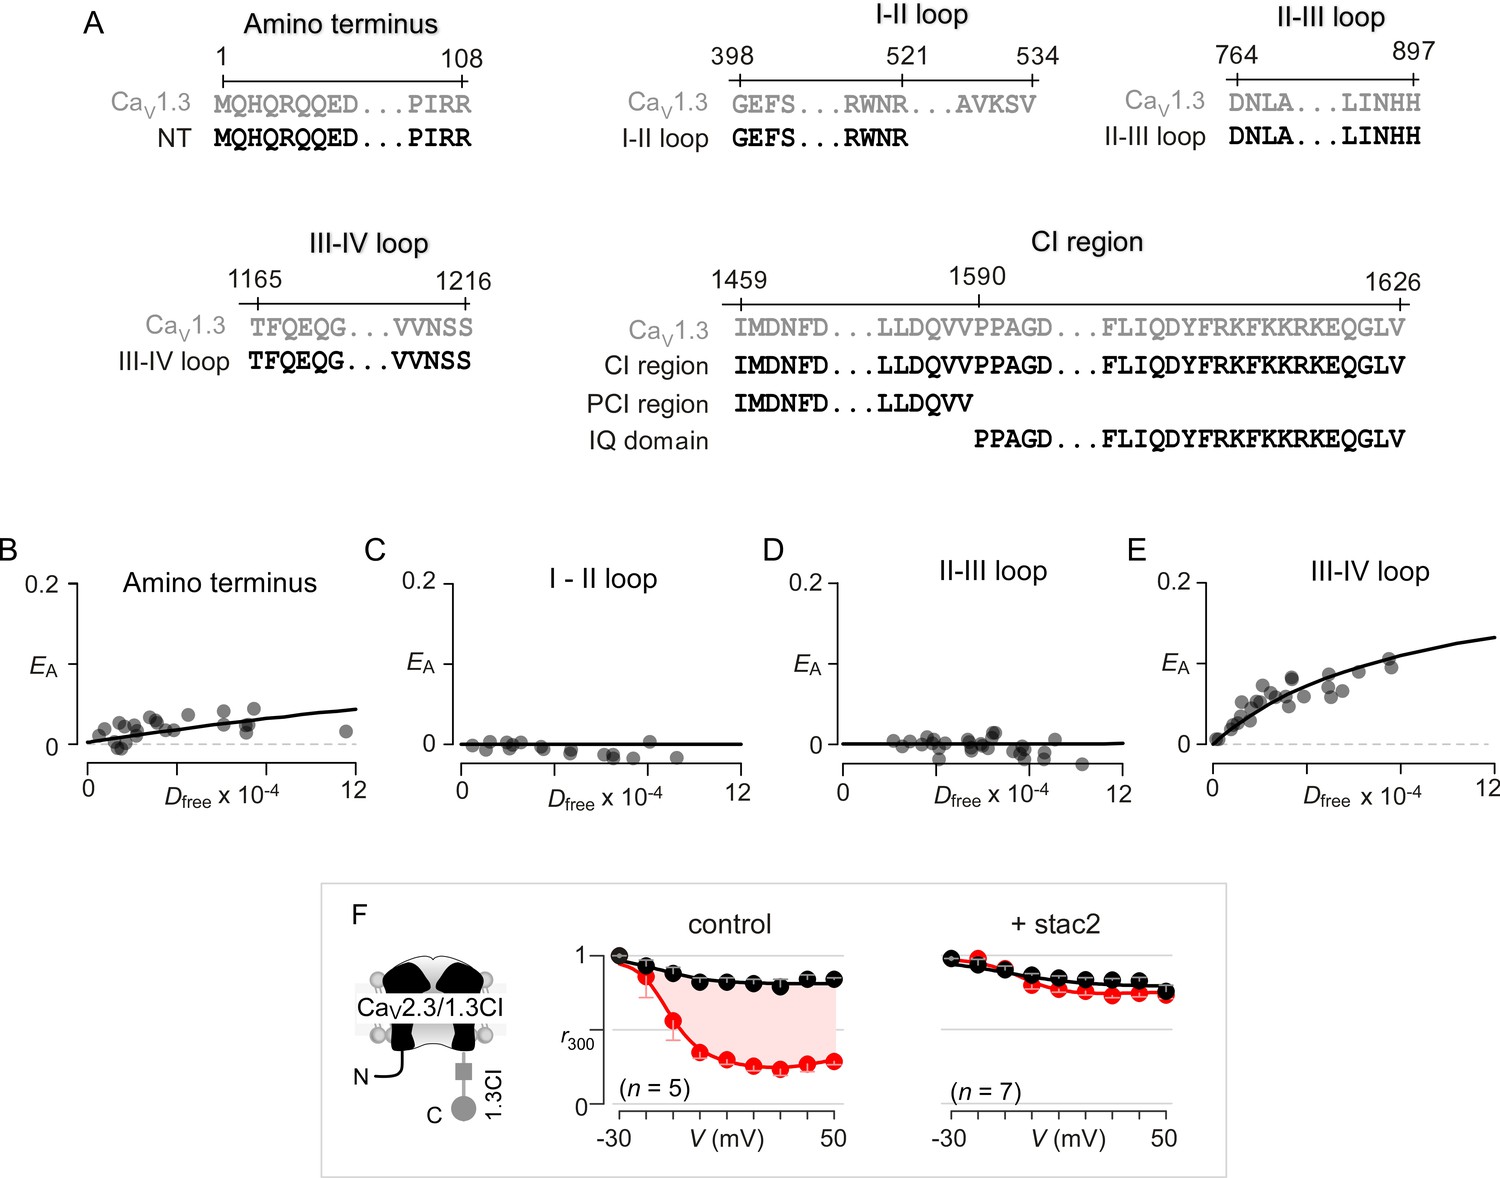
Systematic FRET 2-hybrid scan of major intracellular loops of CaV1.3 with stac.
(A) Schematic depicts design of YFP-tagged CaV1.3 intracellular loop constructs (NT, I-II loop, II-III loop, III-IV loop, CI region, PCI region, IQ domain). The exact sequence of the N- and C-termini of each peptide as well as locations on the CaV1.3 α subunit are denoted. (B–E) FRET 2-hybrid binding curves for stac3 interaction with various channel intracellular loops (black symbol and fit). Each symbol denotes FRET measurements from a single cell. Stac3 binds very weakly to the amino terminal (NT) peptide (B) that includes the CaM-binding segment, NSCaTE. Both the I-II (C) and the II-III loop peptides (D) also showed little or no FRET binding. By contrast, the III-IV loop peptide bound appreciably to stac3 (E). (F) Transfer of CI module of CaV1.3 onto CaV2.3 confers stac modulation. Format as in Figure 1—figure supplement 1A. In the absence of stac2, CaV2.3/1.3 CI exhibits robust CDI triggered by local Ca2+ isolated using 10 mM BAPTA (middle subpanel). Stac2 abolishes CDI of CaV2.3/1.3 CI (right subpanel).
Figure 3 with 1 supplement
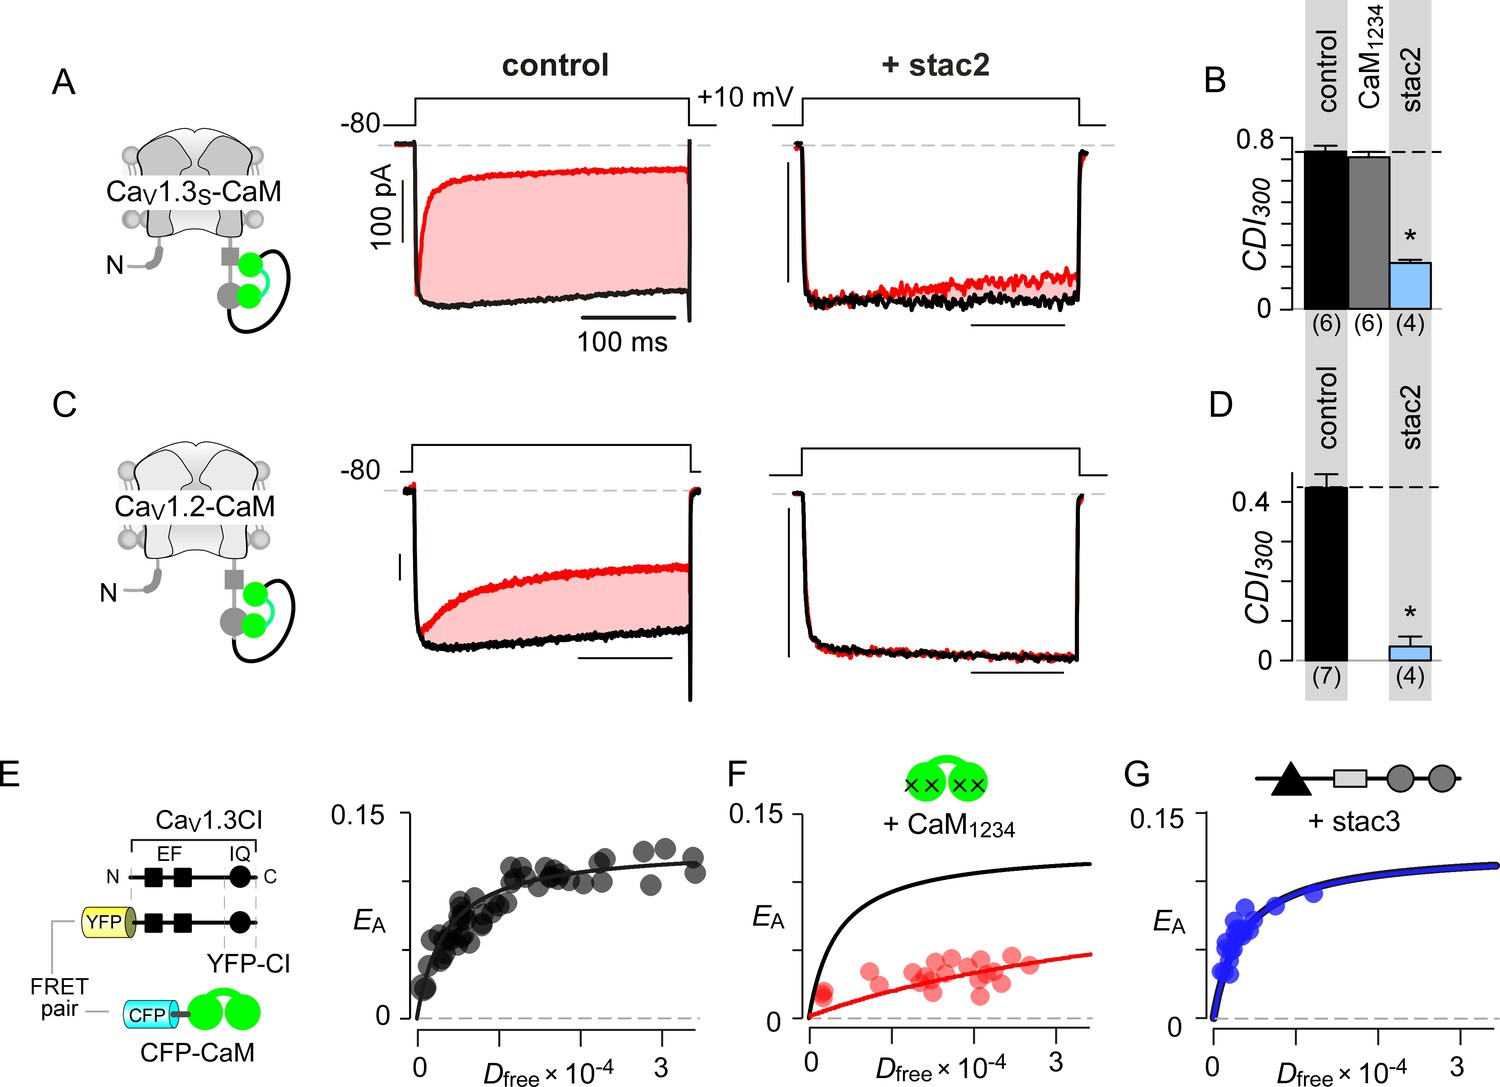
Allosteric regulation of stac by interaction with the channel carboxy-terminus.
(A–B) Stac2 suppresses CDI of CaV1.3S tethered to CaM. In contrast, fusion of CaM protects CaV1.3S from competitive inhibitors such as CaM1234. Format as in Figure 1A–B. (C–D) Stac2 suppresses CDI of CaV1.2 tethered to CaM. Format as in Figure 1A–B. (E) FRET 2-hybrid assay shows the high-affinity interaction of YFP-tagged CaV1.3 CI to CFP-tagged CaM with relative dissociation constant Kd,EFF ~4000 ± 291 Dfree units. (F) Co-expression of untagged CaM1234 with FRET pairs YFP-tagged CaV1.3 CI and CFP-tagged CaM results in a marked reduction in FRET efficiency. (G) Co-expression of untagged stac3 spares the binding of YFP-tagged CaV1.3 CI with CFP-tagged CaM, yielding an identical EA-Dfree relationship to that in the absence of stac3 (E).
Figure 3—figure supplement 1
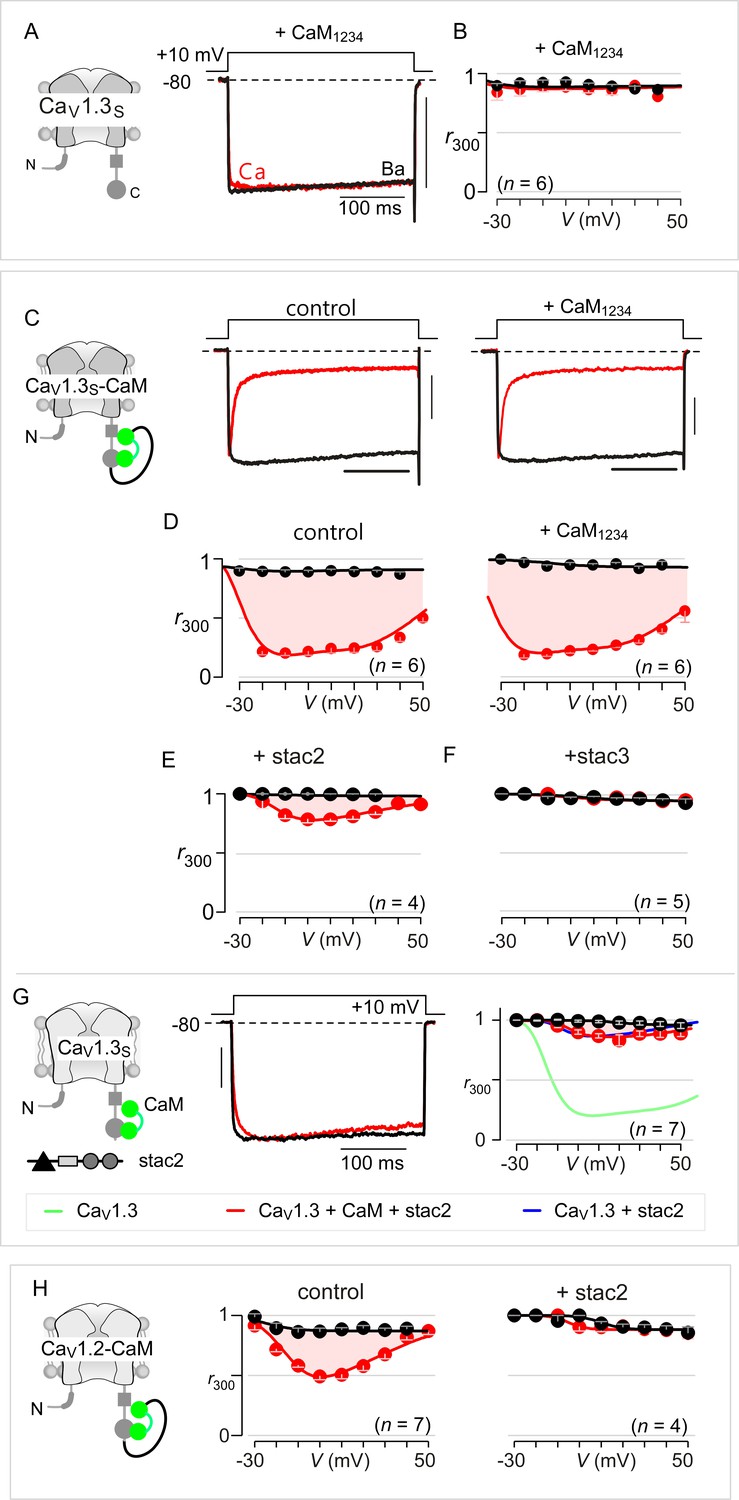
Extended data show that stac acts concurrently with CaM.
(A) Dominant-negative CaM1234 lacking Ca2+-binding to all four EF hands abolishes strong CDI of CaV1.3S. Left, cartoon schematizes CaV1.3S variant. Right, CDI of CaV1.3S is absent in the presence of CaM1234. Here, CaM1234 competitively replaces prebound wildtype CaM to suppress CDI. (B) Population data of r300 confirm the abolition of CDI for CaV1.3S upon co-expression of CaM1234. Format as in Figure 1—figure supplement 1A. (C) Fusion of CaMWT protects CaV1.3S from CaM1234, a competitive inhibitor of CDI. Exemplar currents show robust CDI of CaV1.3S-CaM under both control conditions and in the presence of CaM1234. Control data here reproduced from main text Figure 3A for symmetry. (D) Population data of r300 confirm the presence of CDI for CaV1.3S-CaM despite overexpression of CaM1234. Format as in Figure 1—figure supplement 1A. These results demonstrate that CaM-fusion can protect CaV1.3 from competitive inhibition of CDI. (E–F) Co-expression of stac2 (E) and stac3 (F) abolishes CDI of CaV1.3S-CaM. (G) Stac2 diminishes CDI of CaV1.3 despite CaM overexpression. (H) Population data of r300 demonstrate that stac2 abolishes CDI of CaV1.2 with CaM tethered to the carboxy-terminus (CaV1.2-CaM).
Figure 4 with 3 supplements
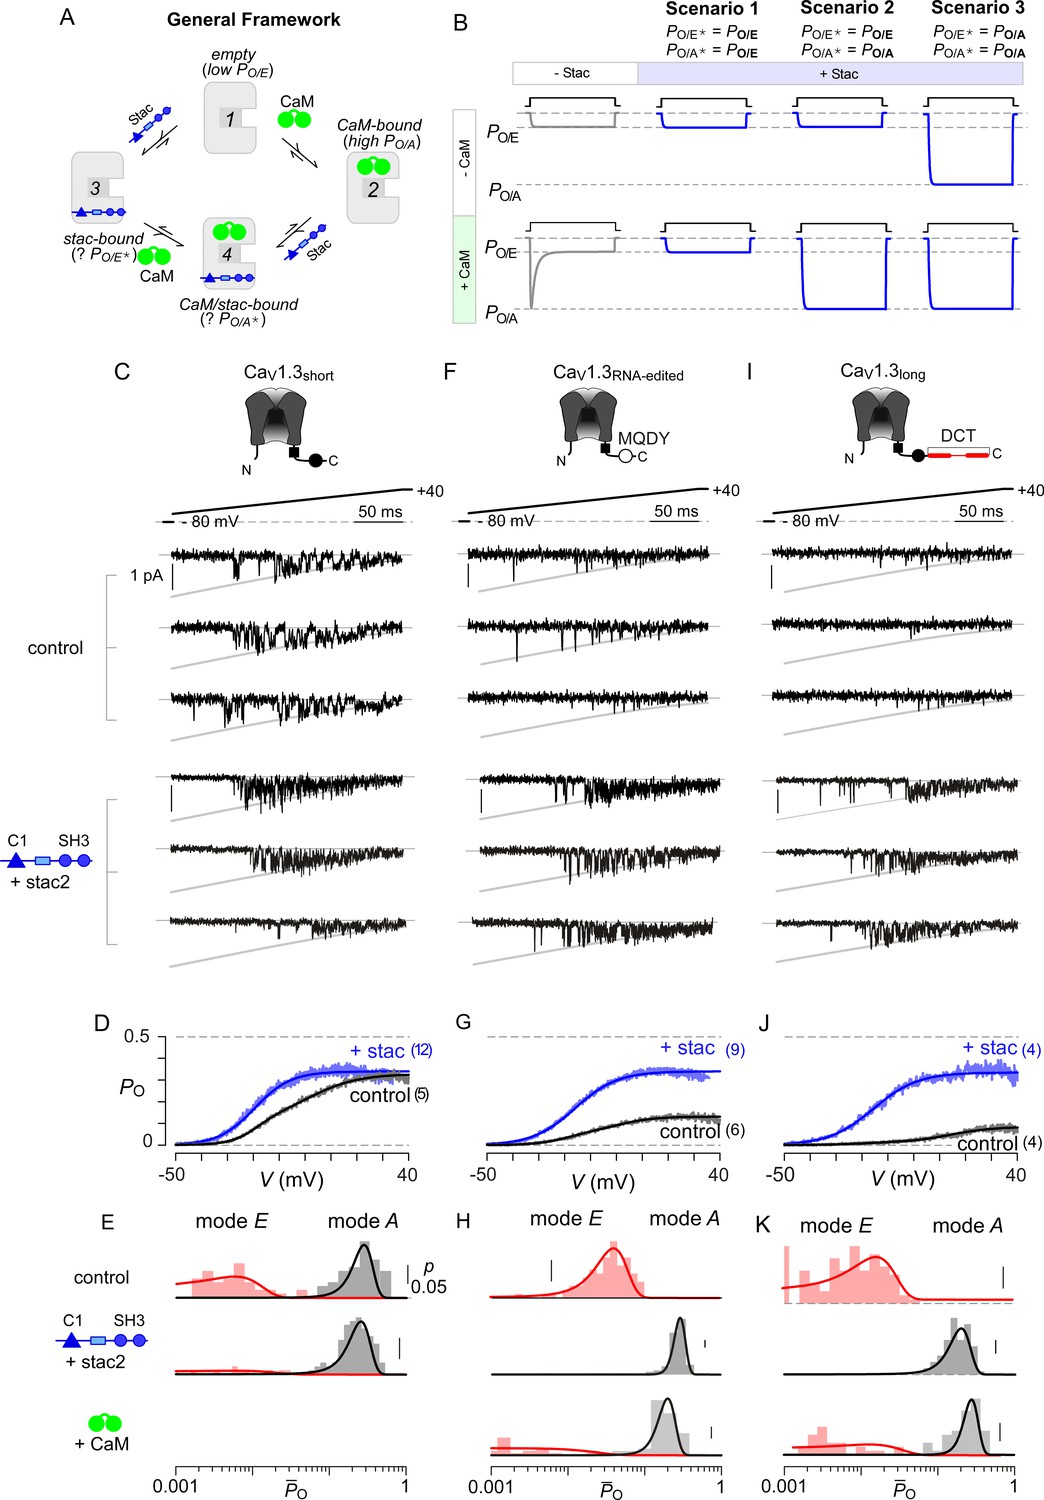
Stac enhances the PO of CaV1.3.
(A) A general four-state scheme for stac and CaM modulation. (1) CaV1.3S devoid of CaM and stac possess a low baseline PO (PO/E). (2) Without stac, apoCaM binding to CaV1.3S upregulates baseline PO (PO/A). Baseline PO of CaV1.3S bound to stac in the absence (configuration 3, PO/E*) and the presence of apoCaM (configuration 4, PO/A*) are unknown. (B) Schematic outlines three mechanistic possibilities for stac binding to CaV1 and their functional outcomes. Scenario 1, stac uniformly suppresses PO of CaV1 (PO/E) and abolishes CDI. Scenario 2, apoCaM tunes baseline PO of CaV1 despite concurrent stac binding. Stac, nonetheless, abrogates CDI. Scenario 3, stac uniformly upregulates the baseline PO of CaV1 and abolishes CDI (PO/A). (C) Top, cartoon shows the canonical CaV1.3S variant with a high apoCaM binding affinity. Single-channel analysis of recombinant CaV1.3S in the absence (middle) and presence of stac (bottom). In both panels, the unitary Ba2+ currents during voltage-ramp are shown between −50 mV and +40 mV (slanted gray lines, GHK fit). Robust CaV1.3 openings are detected in the absence and presence of stac. (D) Average single-channel PO-voltage relationship for CaV1.3S obtained from multiple patches in the absence (gray) and presence of stac2 (blue). Error bars indicate ±S.E.M. for specified number of patches and 80–150 stochastic records per patch. (E) Histogram shows distribution of single-trial average PO (O) for the voltage range -30 mV ≤ V ≤ +25 mV under control (top), stac-bound (middle), and CaM-bound (bottom) conditions. O-distribution is bimodal in the absence of stac corresponding to high PO (gray) and low PO (rose) gating modes. With stac, O-distribution is largely restricted to the high PO mode. (F–H) Single-channel analysis of a recombinant CaV1.3RNA-edited variant reveals a marked upregulation in the baseline PO in the presence of stac compared with control conditions in which apoCaM preassociation is weak. Absent stac or CaM, single-trial O-distribution is restricted to the low PO limits, With either stac or CaM, the high PO gating mode re-emerges. Format as in (C–E). (I–K) Stac also upregulates the baseline PO of CaV1.3L, an alternatively spliced variant, by stabilizing the high PO gating configuration. Format as in (C–E).
Figure 4—figure supplement 1
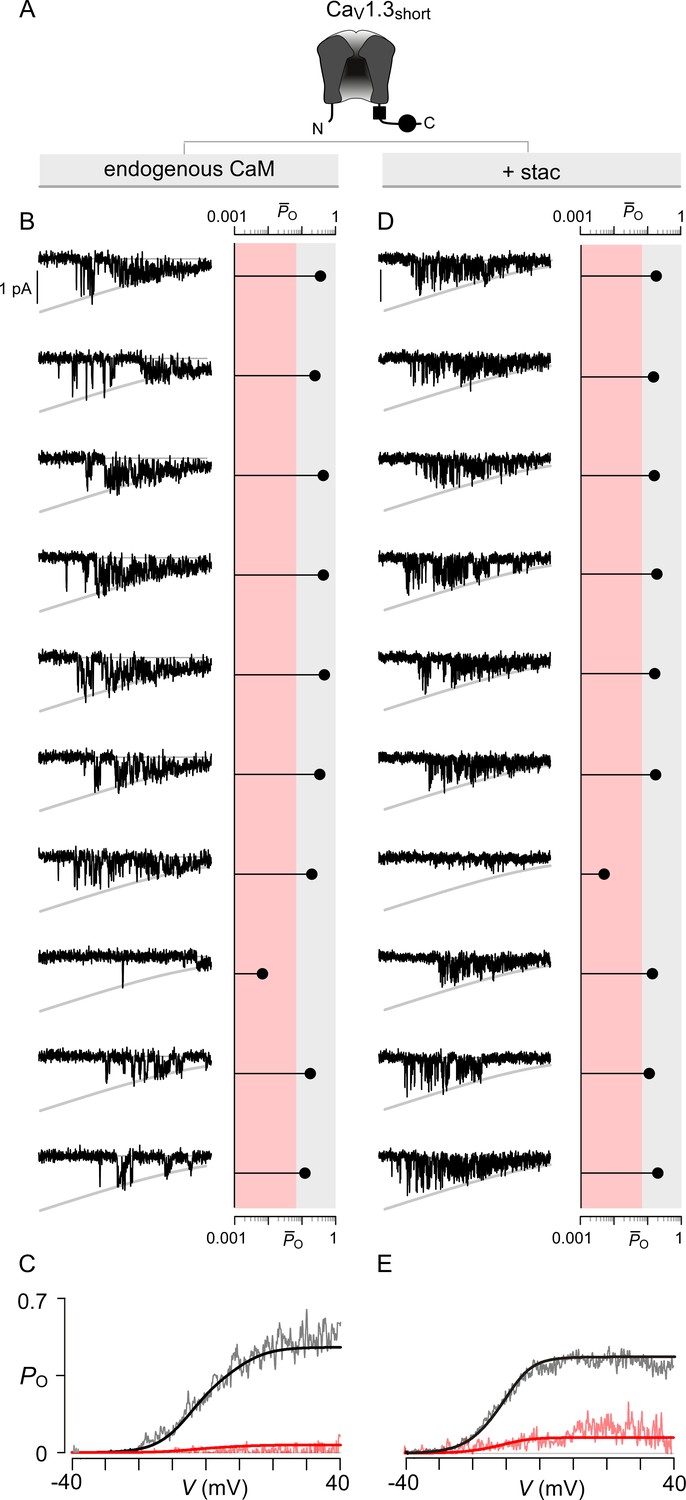
Extended data show that stac2 preferentially biases a high PO gating mode for CaV1.3.
(A) Cartoon schematizes CaV1.3S. (B) Left, 10 sequential single-channel trials of CaV1.3S under endogenous levels of CaM illustrate high PO gating mode with rare sojourns into a low PO gating mode. Here, traces show Ba2+ currents elicited every 12 s in response to a voltage ramp shown between -40 mV and +40 mV. Right, diary plot displays single trial average PO computed for the voltage-range -30 mV ≤ V ≤ +25 mV ( (-30 ≤ V ≤ 25)). Dashed line discriminates traces to low PO (red shaded area) or high PO (gray shaded area) categories as previously established. (C) Average PO at each voltage calculated for all traces within the high PO range (gray region in (B)) and the low PO range (red shaded region in (B)). These relationships estimate the PO-V relationship for high PO and low PO gating modes. (D–E) In the presence of stac2, CaV1.3S preferentially adopts the high PO gating configuration. Format as in (B–C).
Figure 4—figure supplement 2
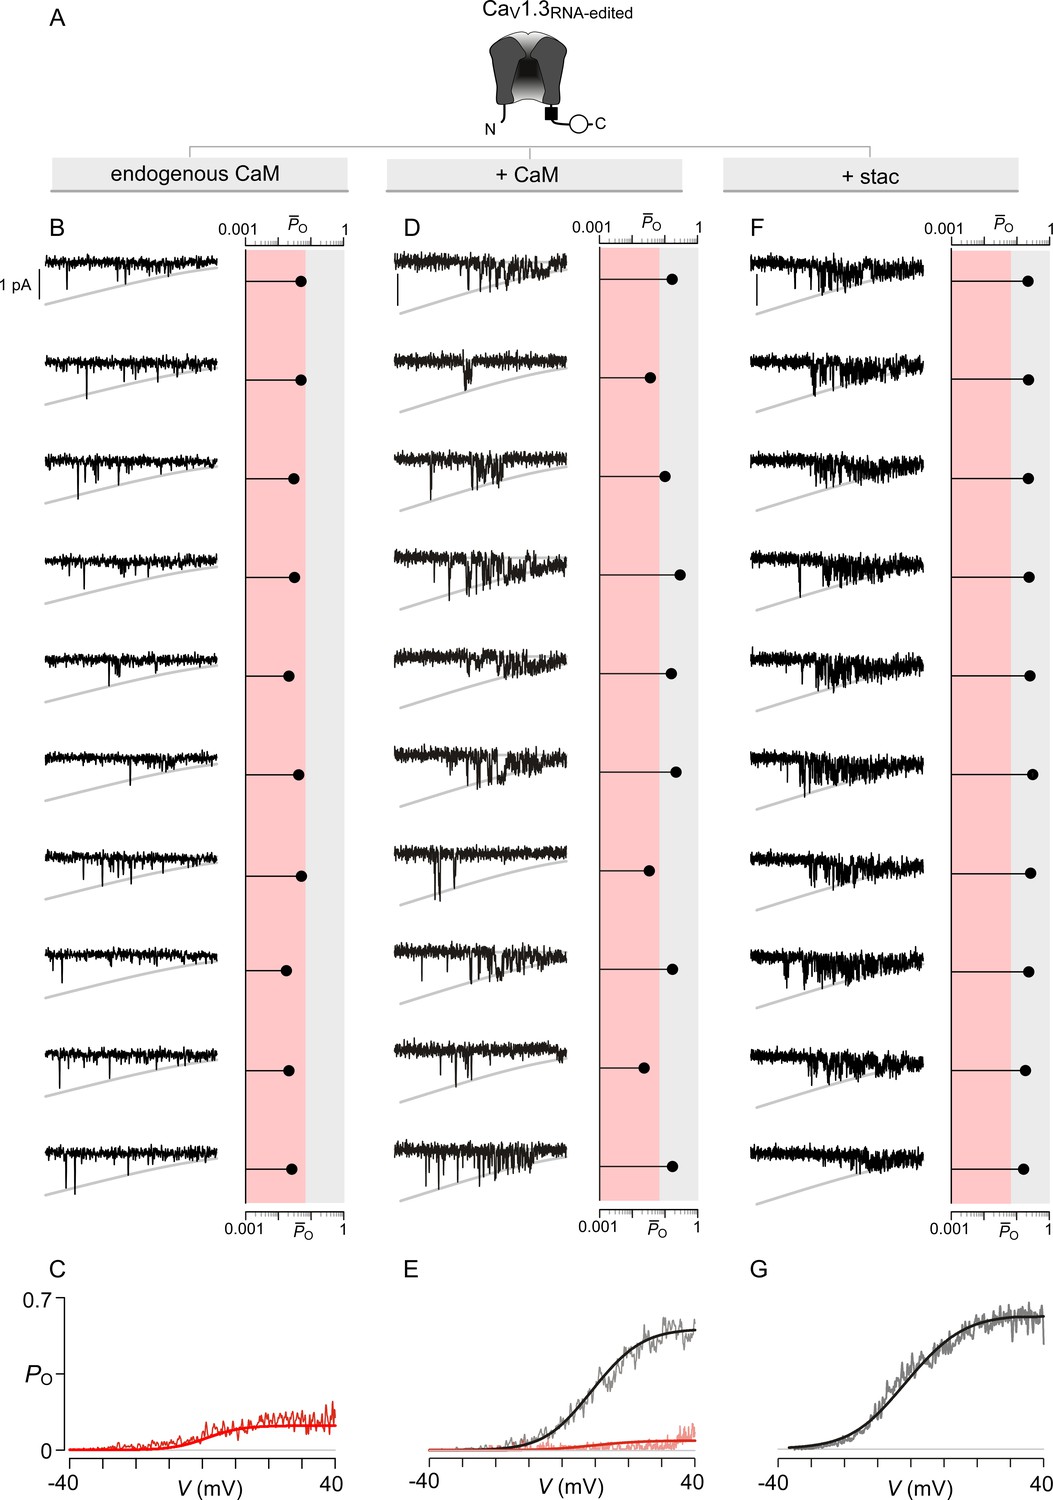
Extended data show that stac2 and CaM enhance the PO of CaV1.3RNA-edited variant via discreet transitions into a high PO gating mode.
(A) Cartoon schematizes CaV1.3RNA-edited. RNA-editing results in a methionine substitution of the central isoleuicine residue, resulting in sharply diminished CaM binding. Functionally, CaM binding enhances the PO of CaV1.3RNA-edited. (B–C) Under endogenous levels of CaM, CaV1.3RNA-edited exhibits a uniformly low PO as evident from individual trials. The average PO – V relation is consistent with that for the low PO gating mode. Format as in Figure 4—figure supplement 1B–C. (D–E) CaM overexpression enhances the PO of CaV1.3RNA-edited variant. Exemplar traces depict channels switching between discrete high and low PO gating modes. A PO-V relationship for high PO and low PO gating modes is evident. Format as in Figure 4—figure supplement 1B–C. (F–G) Similar to CaM, stac2 overexpression also enhances the PO of CaV1.3RNA-edited variant by stabilizing the high PO gating mode. Exemplar traces depict channels largely adopting the high gating mode. Format as in Figure 4—figure supplement 1B–C.
Figure 4—figure supplement 3
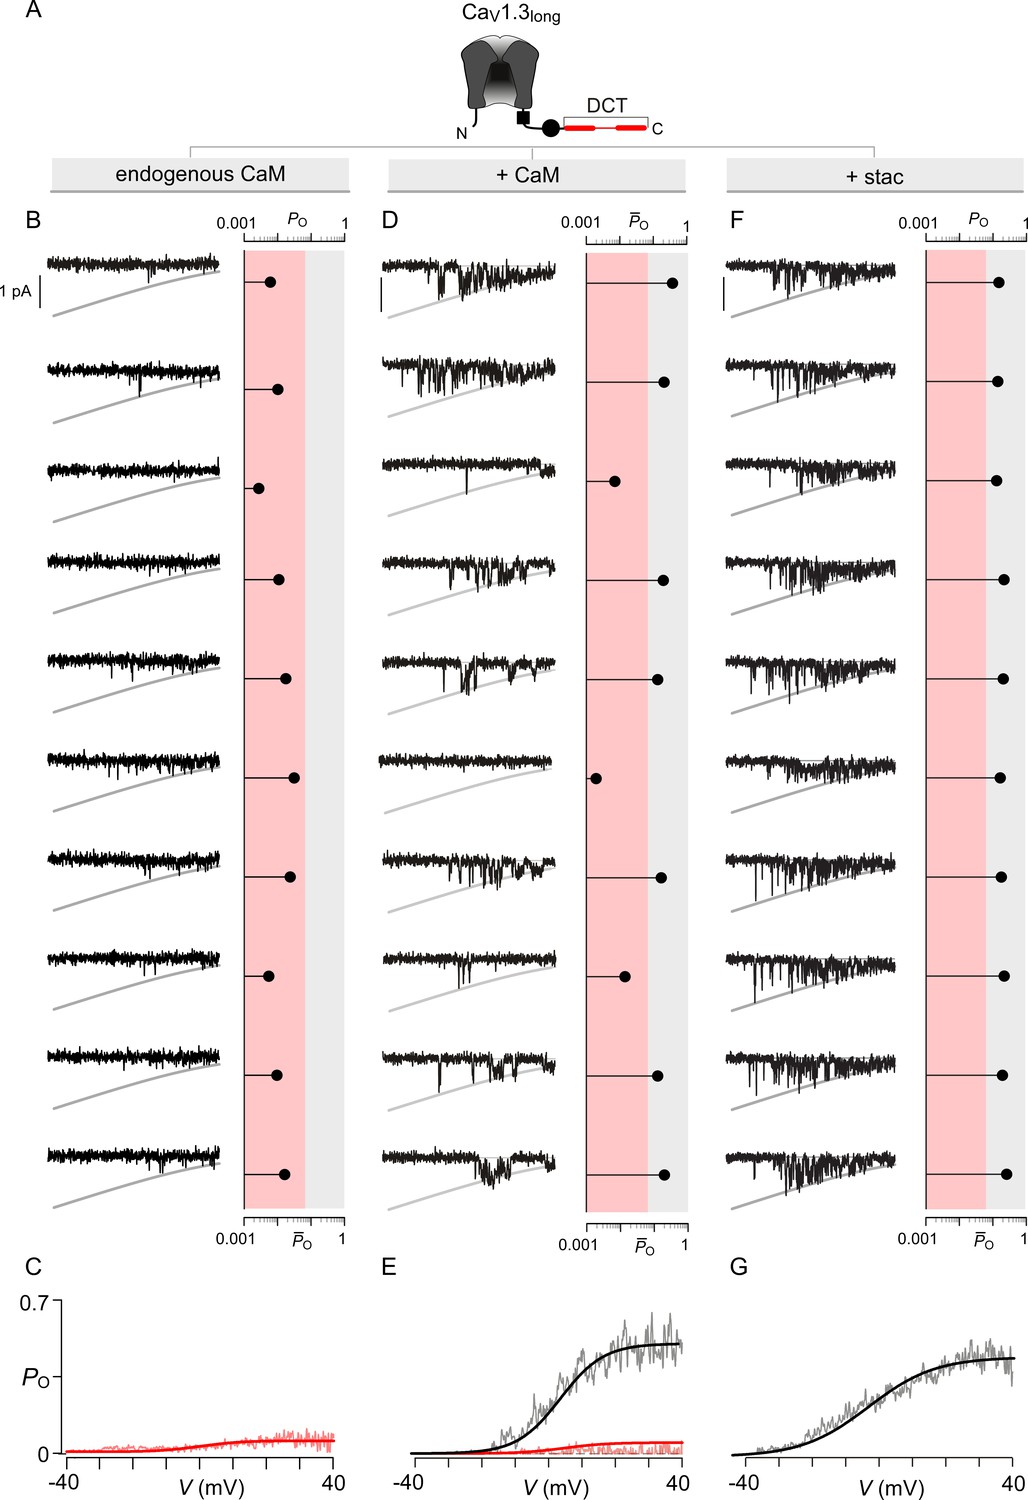
Extended data show that both stac2 and CaM enhance the PO of CaV1.3L variant.
(A) Cartoon schematizes CaV1.3L. The long-splice variant includes a distal carboxy-tail (DCT) that interacts with the IQ domain and competitively displaces CaM. (B–C) Under endogenous levels of CaM, CaV1.3L exhibits a uniformly low PO as evident from individual trials. The average PO – V relation is consistent with that for the low PO gating mode. Format as in Figure 4—figure supplement 1B–C. (D–E) CaM overexpression enhances the PO of CaV1.3L variant. Exemplar traces depict channels switching between discrete high and low PO gating modes. Format as in Figure 4—figure supplement 1B–C. (F–G) Similar to CaM, stac2 overexpression also enhances the PO of CaV1.3L variant by stabilizing the high PO gating mode. Exemplar traces depict channels largely adopting the high gating mode. Format as in Figure 4—figure supplement 1B–C.
Figure 5 with 2 supplements
Stac U-domain is a minimal effect domain for suppression of CaV1 CDI.
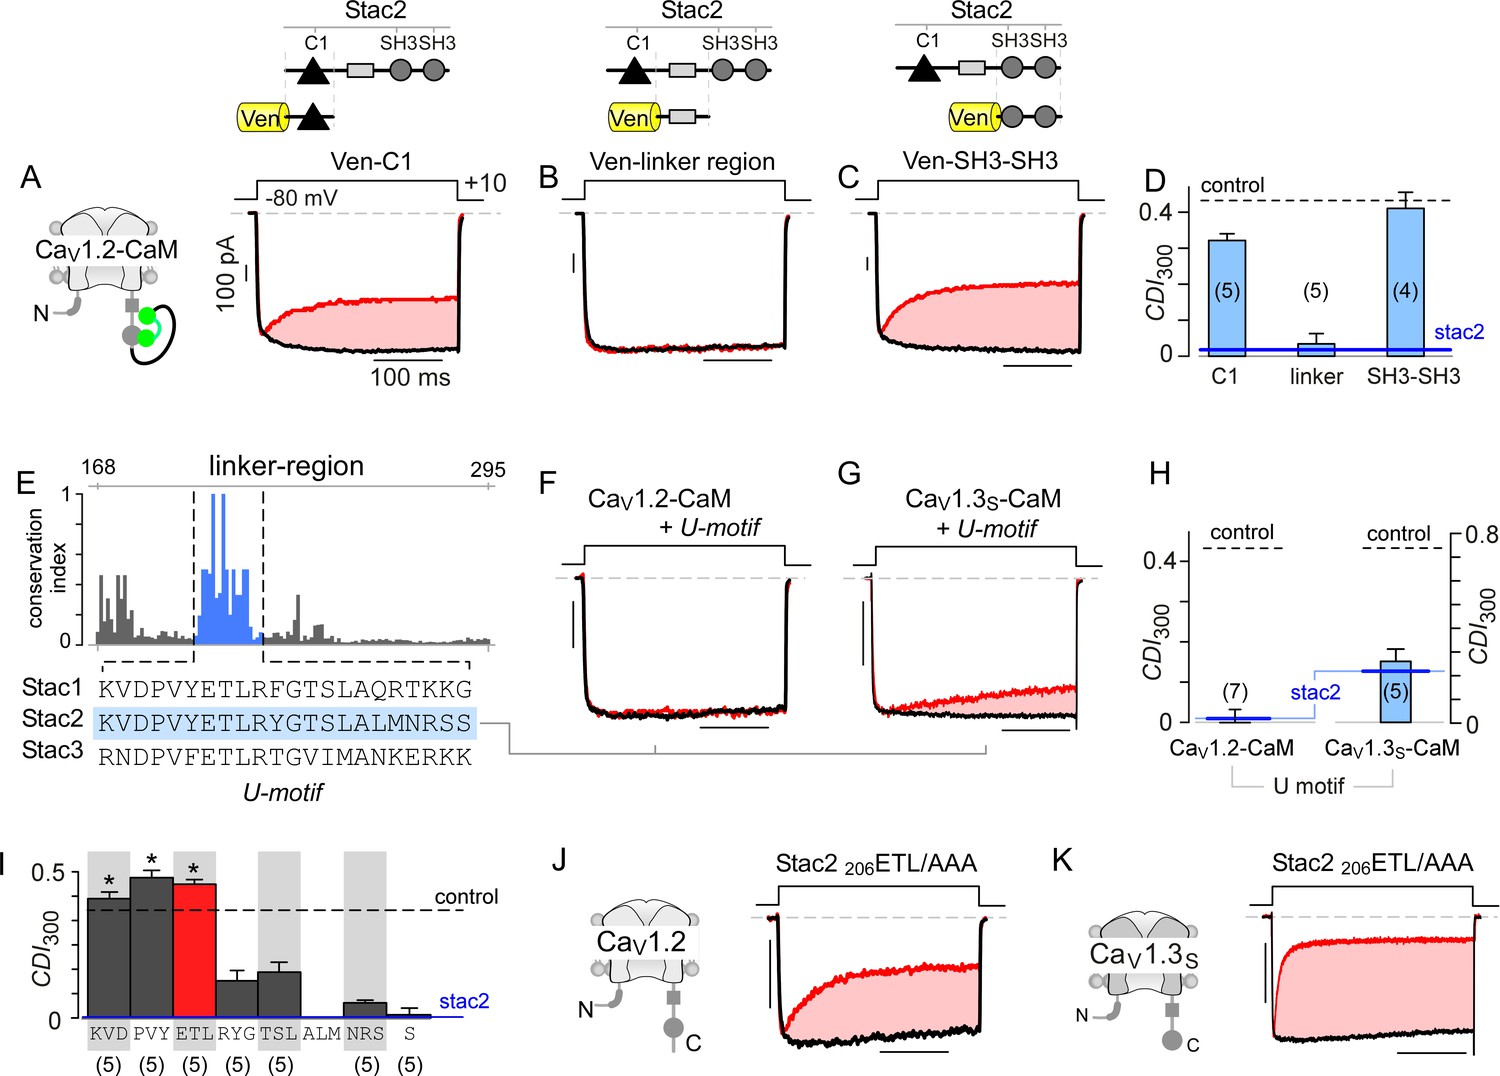
(A–C) To localize an effector motif for stac2, CDI of CaV1.2-CaM was quantified in the presence of three stac subdomains: (1) C1, (2) linker region, and (3) SH3-SH3. Exemplar traces in response to a +10 mV voltage-step depolarization show robust CDI of CaV1.2-CaM in the presence of C1 (A), and SH3-SH3 (C) domains. Co-expression of the linker-region is sufficient to suppress CDI of CaV1.2-CaM (B). Format as in Figure 1A. (D) Bar graph summarizes population data for CaV1.2-CaM CDI in the presence of the three stac subdomains. Each bar, mean ±S.E.M of CDI300 at +10 mV from specified number of cells. CDI levels in the presence (solid blue line) and absence (dashed gray line) of full-length stac2 is reproduced for comparison. (E) Bar graph shows degree of conservation for the linker region across 770 orthologs of stac2. A well conserved subsegment termed U-domain is shaded blue. (F–G) Co-expression of U-domain is sufficient to abolish CDI of CaV1.2-CaM (F) and CaV1.3-CaM (G). Format as in Figure 1A. (H) Bar graph displays population data for CDI of CaV1.2-CaM and CaV1.3-CaM in the presence of U-domain. Each bar, mean ±S.E.M of CDI300 at +10 mV from specified number of cells. Dashed line, baseline CDI for both channels in the absence of stac2. Blue line, CDI of both channels in the presence of full-length stac2. (I) Systematic alanine scanning mutagenesis of the U-domain reveals critical determinants for stac-mediated suppression of CaV1.2 CDI. For comparison, CaV1.2 CDI in the presence (blue line) and absence (black dashed line) of stac2 are shown. Stac2 mutants 200KVD/AAA, 203PVY/AAA, 206ETL/AAA fully abolish stac2-mediated CDI suppression. (J) Exemplar currents show that stac2 mutant 206ETL/AAA eliminates stac’s ability to suppress CaV1.2 CDI. Format as in Figure 1A. (K) Stac2 206ETL/AAA also fails to inhibit CDI of CaV1.3S. Format as in Figure 1A.
Figure 5—figure supplement 1
Extended data demonstrate that the U-motif is a minimal domain for suppressing CDI of CaV1.2 and CaV1.3.
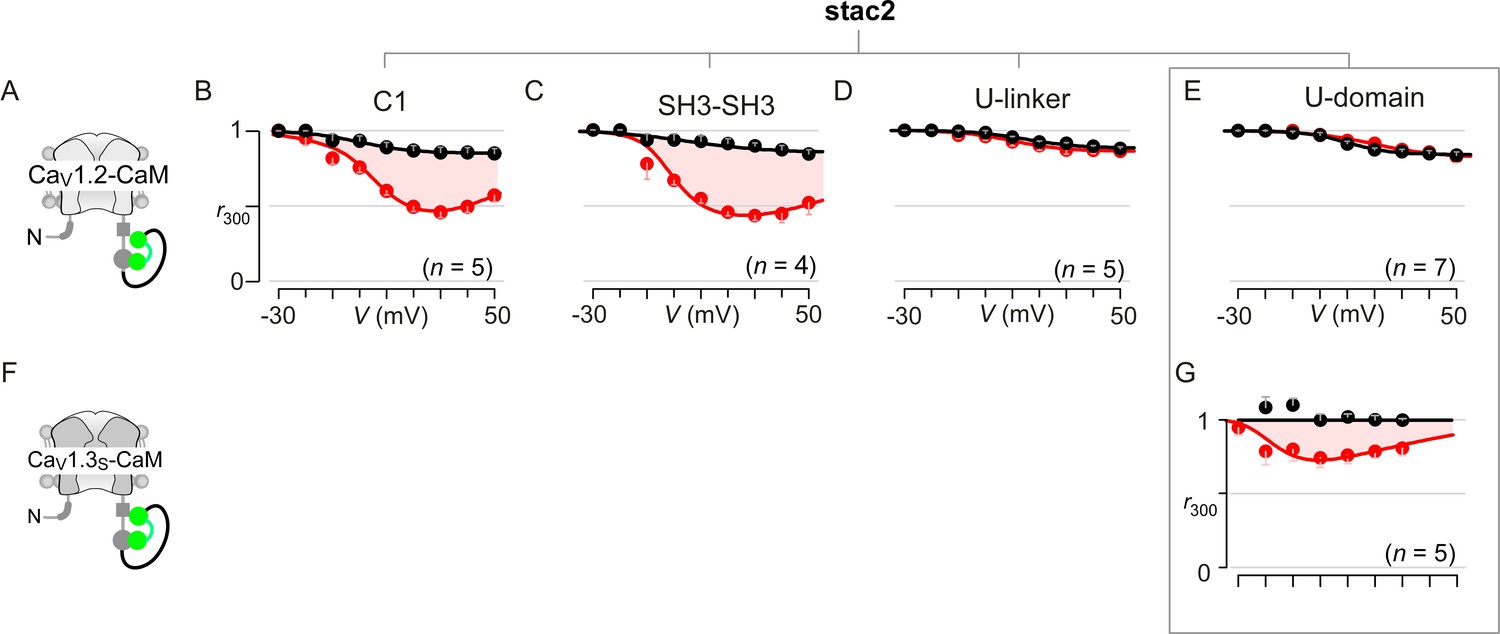
(A–C) Population data confirm that co-expression of either the cysteine-rich domain (C1; B) or dual SH3 domains (SH3-SH3; C) of stac2 in isolation spares CDI of CaV1.2-CaM (cartoon in A). Format as in Figure 1—figure supplement 1A. Each symbol, mean ±S.E.M. of r300 values obtained from the specified number of cells (n). Here, tethered CaM was used to protect from potential competitive displacement of CaM by stac2 subdomains. (D–E) Population data confirm that the U-linker that connects the C1 and dual SH3 domains is sufficient to suppress CDI of CaV1.2-CaM, fully recapitulating the effect of stac on CaV1 channels (D). The well-conserved minimal U-motif from stac2 is also sufficient to fully suppress CDI of CaV1.2-CaM (E). Format as in Figure 1—figure supplement 1A. Each symbol, mean ±S.E.M. of r300 values. (F) Cartoon shows CaV1.3S-CaM. (G) Stac2 U-domain also diminished CDI of CaV1.3S-CaM as evident from population data of r300 values. Residual CDI here (red shaded area) is reminiscent of that observed with full-length stac2 and CaV1.3S-CaM (Figure 3—figure supplement 1E).
Figure 5—figure supplement 2
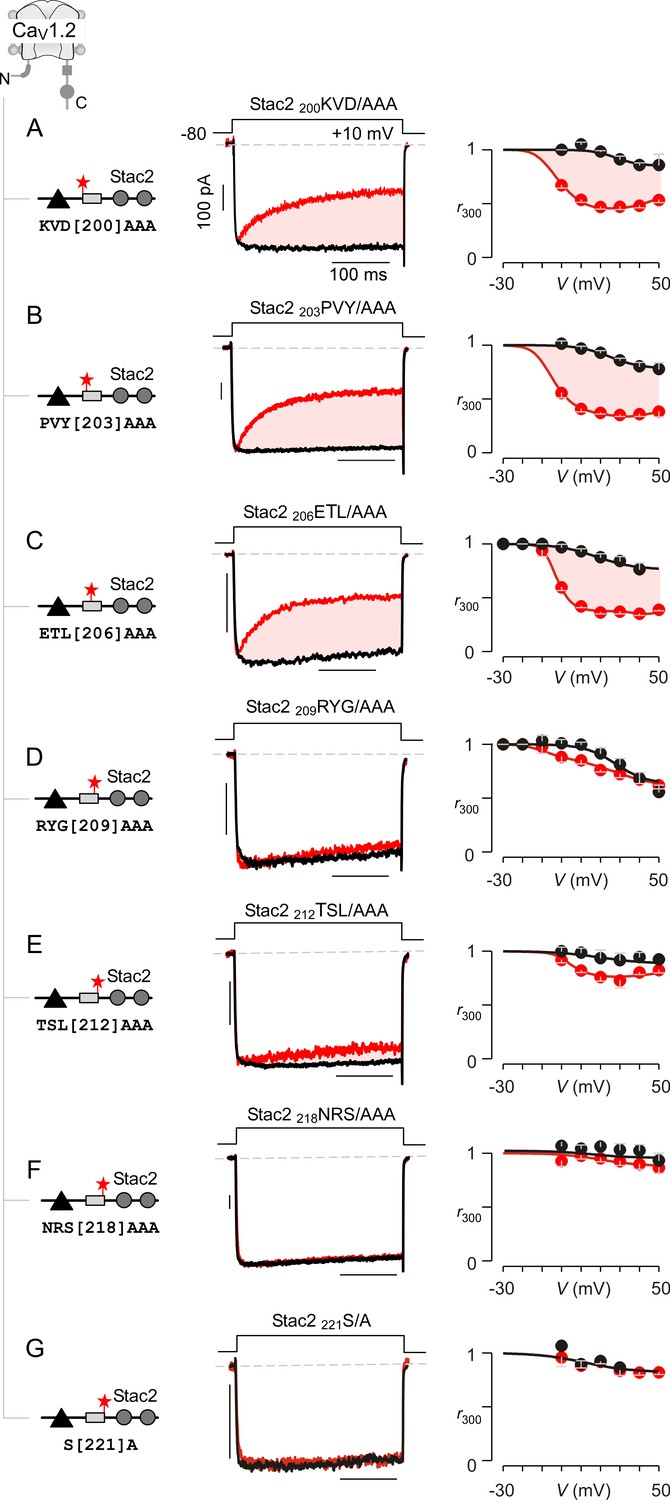
Systematic alanine scanning mutagenesis of minimal U-motif reveals structural determinants for stac modulation of CaV1.
(A) Triple alanine substitution of residues 200KVD202 abolishes stac modulation of CaV1.2. In comparison to stac2 that fully suppresses CDI of CaV1.2, co-expression of stac2 200KVD/AAA spares strong CDI of CaV1.2 suggesting that residues 200KVD202are critical for stac modulation. Left, cartoon schematizes the location of 200KVD/AAA mutation on full-length stac2. Middle, exemplar current traces show robust CDI of CaV1.2 in the presence of stac2 200KVD/AAA. Right, population data showing r300 values as a function of voltage for Ca2+ (red) and Ba2+ currents (black). Each symbol, mean ±S.E.M. from five cells. (B–C) Triple alanine substitution of stac2 residues 203PVY205 and 206ETL208 abolishes stac modulation of CaV1.2 as evident from strong CDI present despite overexpression of mutant stac. Format as in (A). (D–G) CaV1.2 CDI is suppressed by stac2 despite alanine substitution of residues, 209RYG211D), 212TSL214 (E), 218NRS220(F), and 221S (G), suggesting that these residues are not necessary for stac modulation of CaV1 channels. Format as in (A).
Figure 6 with 2 supplements
Synthetic U-domain peptide is sufficient for physiological perturbations.
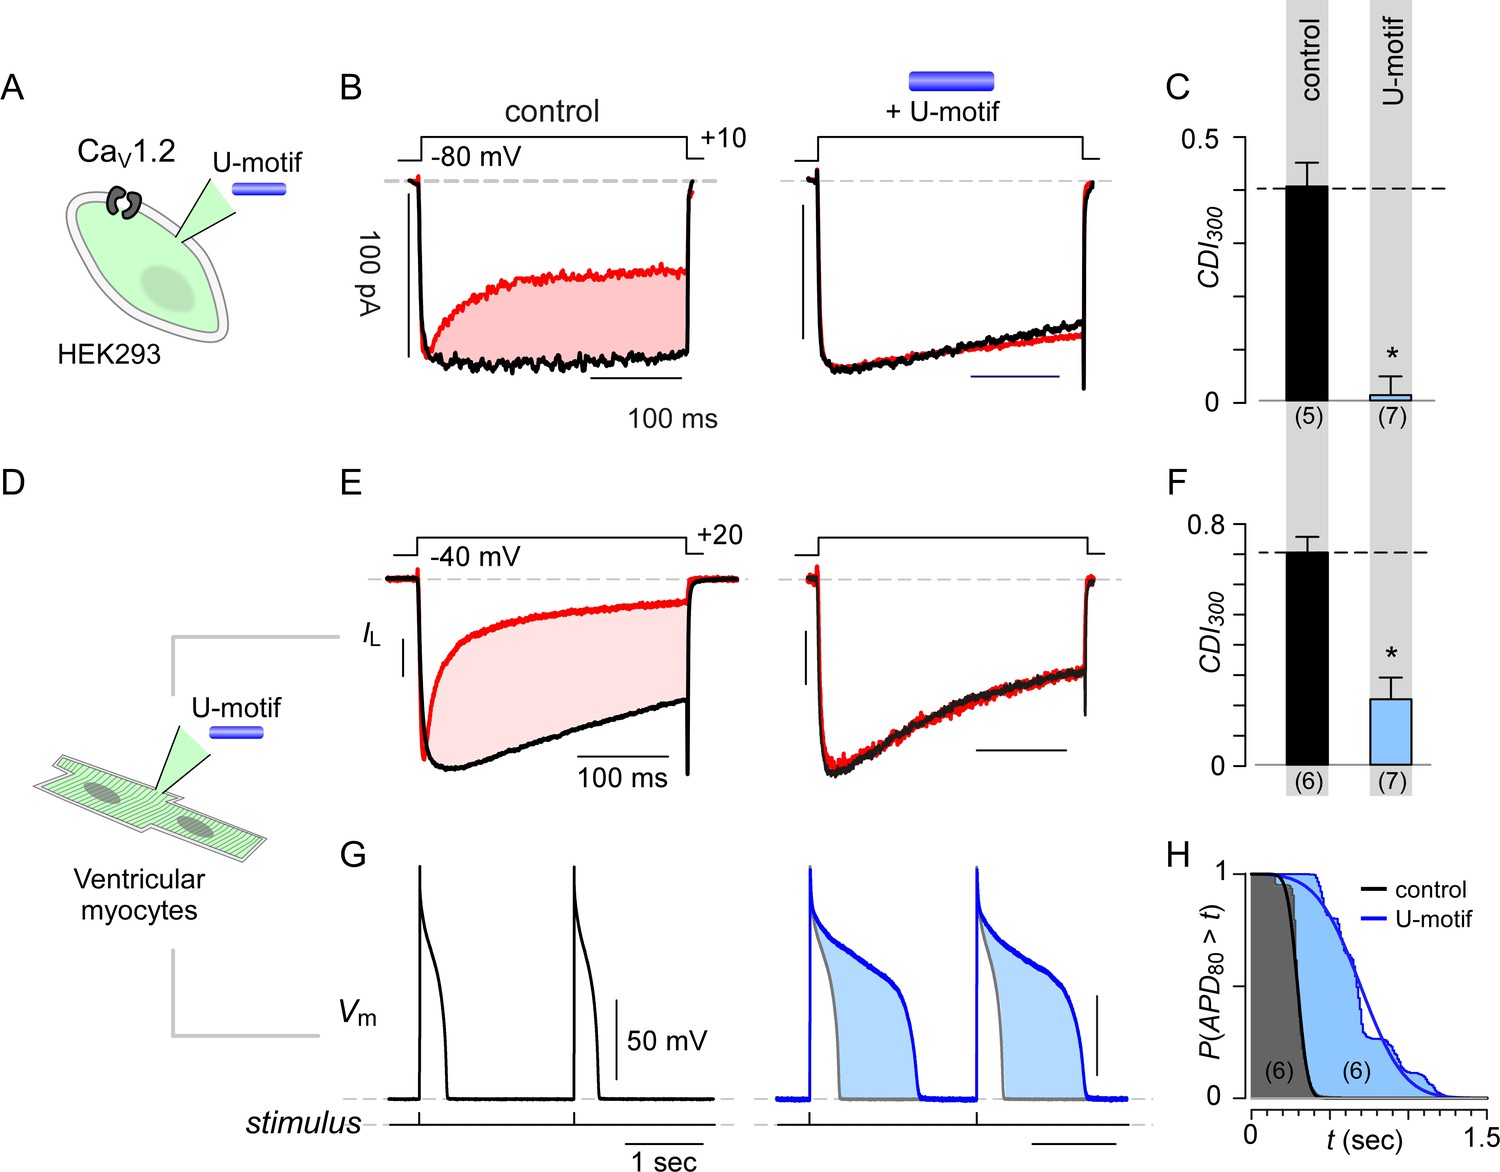
(A) Schematic illustrates pipette dialysis of custom synthesized U-domain peptide in CaV1.2 heterologously expressed in HEK293 cells, a strategy that emulates acute elevation of cytosolic stac2 levels. (B–C) Exemplar traces and population data confirm that pipette dialysis of U-domain suppresses CDI of recombinant CaV1.2 in HEK293 cells. Format as in Figure 1A–B. Control relation in (C) is duplicated from Figure 1B. (D–F) Pipette dialysis of U-domain abolishes CDI of endogenous L-type current in freshly dissociated ventricular myocytes from adult guinea pigs as evident from exemplar traces and bar graph summary of population data. To eliminate T-type current, the cells were depolarized to −40 mV for a period of 100 ms. Format as in (A-–C). (G) Exemplar action potential traces of aGPVMs paced at 0.5 Hz with (blue) and without (black) 0.5 μM U-domain in the internal solution. In the presence of U-domain, the action potentials are markedly prolonged (blue shaded area) consistent with a loss of CDI of native L-type current. (H) Complement of cumulative distribution (P(APD80 >t) of action potential durations (APD80) obtained in the presence (blue) and absence (black) of U-domain in the internal solution.
Figure 6—figure supplement 1
Baseline expression of stac in cardiac myocytes.
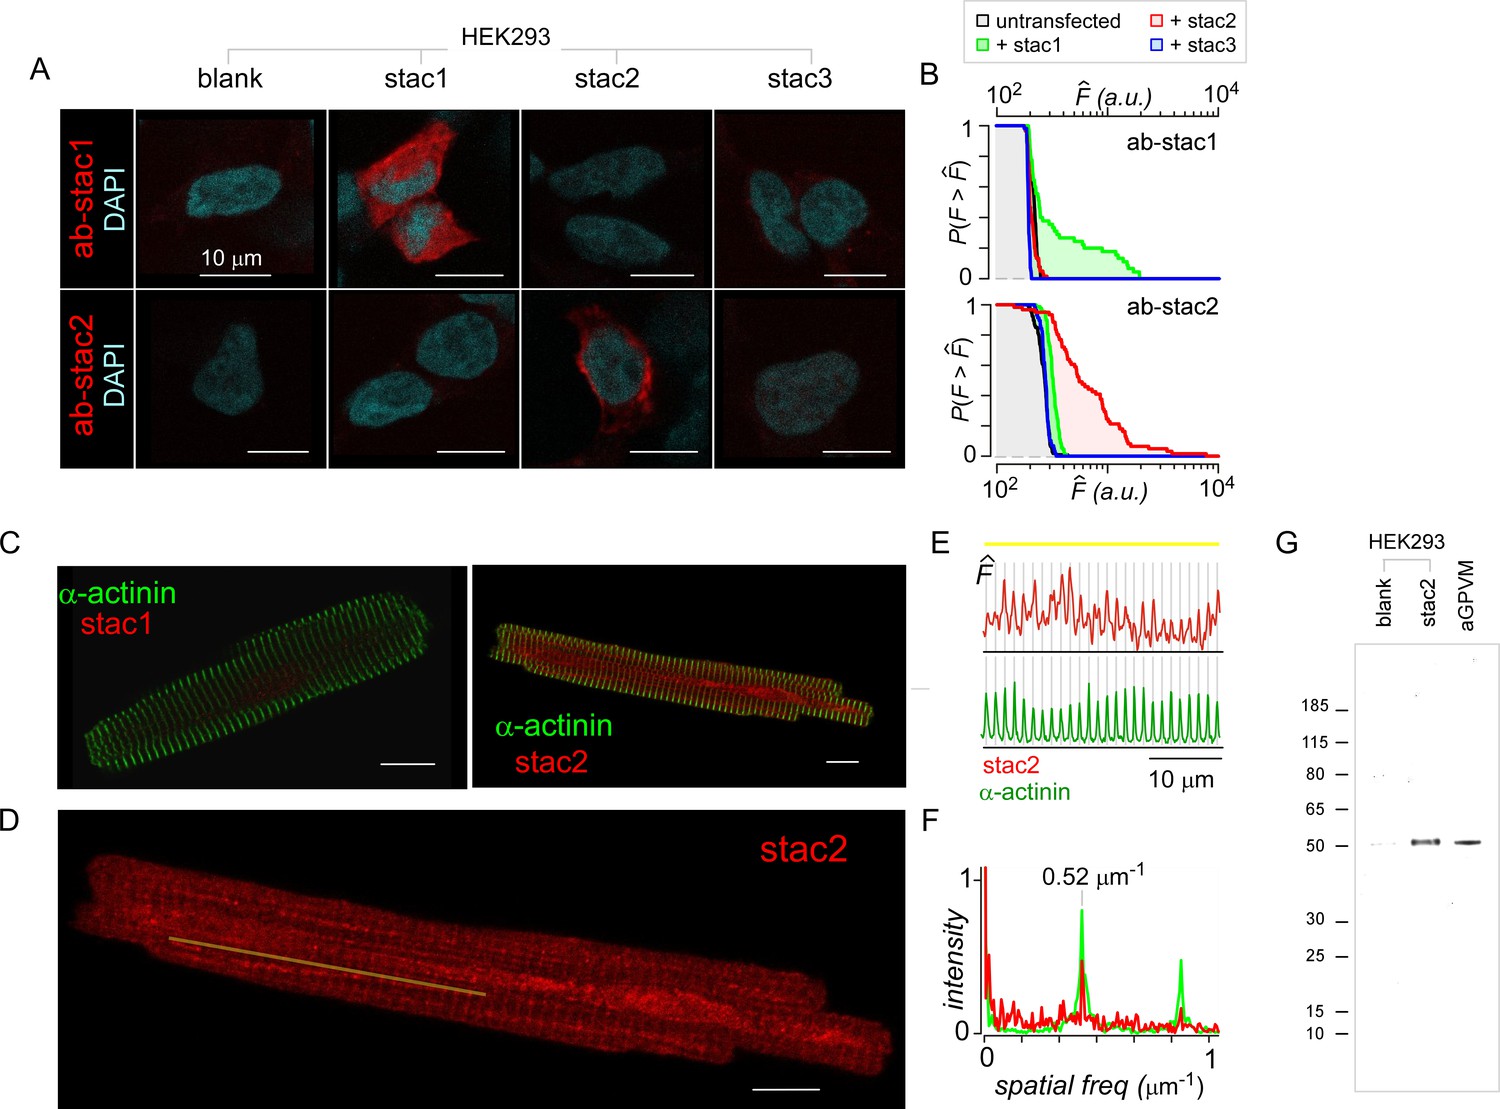
(A) HEK293 transfected with stac1-3 (top) and immunostained with DAPI (cyan) and stac1 (red, top) or stac2 (red, bottom) antibodies confirm selectivity of stac antibodies. (B) Population analysis shows the complement of the cumulative distribution of fluorescence intensities () from 80 to 100 individual HEK293 cells stained with either stac1 (top) or stac2 (bottom) antibodies. Black line, untransfected cells. Data from cells transfected with recombinant stac1, stac2, or stac3 are shown in green, red, and blue, respectively. When probed with stac1 antibody, only cells transfected with exogenous stac1 show appreciable fluorescence above background. Similarly, when probed with stac2 antibody, only cells transfected with exogenous stac2 show fluorescence intensities above background level. (C) Acutely dissociated aGPVM immunostained with α-actinin (green) and stac1 (red, left) and stac2 (red, right). Images representative of three fields of views for stac1 and seven fields of view for stac2. (D) Stac2 immunostaining reveals weak t-tubular localization in aGPVM. Image reproduced from panel C. Yellow line, line-scan used in (E). (E) Fluorescence intensity of stac2 (red, top) and α-actinin (green, bottom) across the line-scan shown in (D) from left to right. Vertical lines correspond to location of the peak fluorescence intensity for α-actinin. (F) Spatial Fourier transform of line scans subpanel shows prominent spatial frequency of 0.52 µm−1 with both α-actinin (green) and stac2 (red). (G) Immunoblotting with stac2 antibody shows stac2 expression,~50 kDa band, in HEK293 cells transfected with recombinant stac2, but not in untransfected HEK293 cells. Analysis of freshly dissociated aGPVM confirms basal stac2 expression. Image representative of five independent biological replicates.
Figure 6—figure supplement 2
Pipette dialysis of U-motif as a peptide abolishes CDI of both recombinant and native L-type currents in ventricular myocytes.
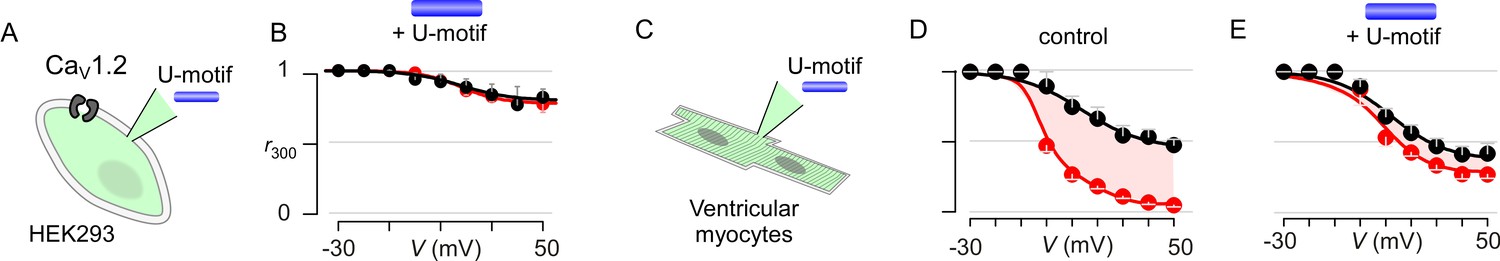
(A) Cartoon schematic shows pipette dialysis of U-motif into HEK293 cells expressing recombinant CaV1.2. (B) Pipette dialysis of minimal effector stac2 U-motif suppresses Ca2+/CaM regulation. Format as in Figure 1—figure supplement 1A. (C) Cartoon schematic shows pipette dialysis of U-motif into freshly dissociated adult guinea pig ventricular myocytes that feature endogenous L-type currents. (D) Population data show that endogenous L-type Ca2+-current in ventricular myocytes elicits strong CDI. Format as in Figure 1—figure supplement 1A. Each symbol, mean ±S.E.M. from six cells. (E) In comparison to control conditions, pipette dialysis of minimal effector stac2 U-motif strongly diminishes Ca2+/CaM regulation of endogenous Ca2+ current in ventricular myocytes. Format as in Figure 1—figure supplement 1A.
Figure 7 with 1 supplement
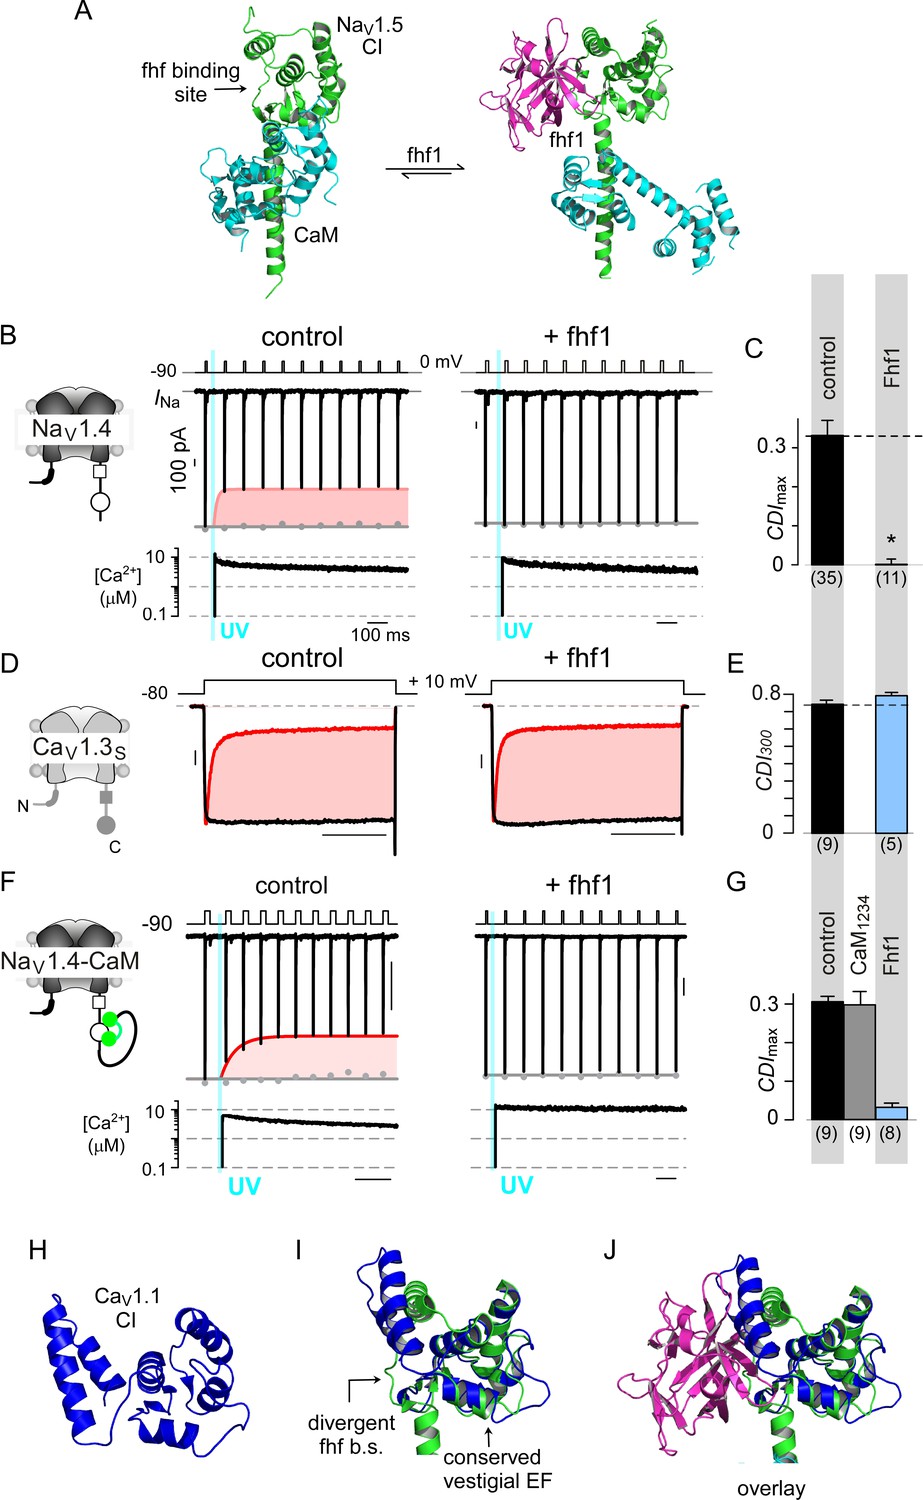
Fhf uses an allosteric mechanism to abrogate Ca2+-feedback of NaV1.4.
(A) Structural comparison of NaV1.5 CI (green) in the presence of CaM alone (cyan, left) or both CaM (cyan) and fhf1b (purple). Fhf binding changes baseline conformation of CaM on NaV1 CI. (B–C) Co-expression of fhf1b abolishes CDI in NaV1.4 evoked via Ca2+ photo-uncaging. Format as in Figure 1M–N. Control data are reproduced from Figure 1M–N for comparison. (D–E) In sharp contrast, strong overexpression of fhf1b does not alter CDI of CaV1.3S. Format as in Figure 1A–B. Control data reproduced from Figure 1D for comparison. (F–G) Fhf1 suppresses CDI of NaV1.4 tethered to CaM. Fusion of CaM protects NaV1.4 from competitive inhibitors such as CaM1234 (G). Format as in Figure 1M–N. (H) Structure of CaV1.1 upstream CI elements (blue) composed of dual vestigial EF hands and preIQ segments isolated from cryo-EM structure of CaV1.1 (PDBID, 5GJV). This domain is the primary interface for stac interaction in the CaV1 CI. (I) Structural overlay of upstream CI elements of CaV1.1 (PDBID, 5GJV) and NaV1.5 (PDBID, 4DCK) shows highly conserved dual vestigial EF hand segments while the fhf binding site is structurally divergent. (J) The divergence in the fhf binding interface in CaV1.1 in comparison to NaV1.5 would introduce a steric clash that prohibits fhf binding to CaV channels.
Figure 7—figure supplement 1
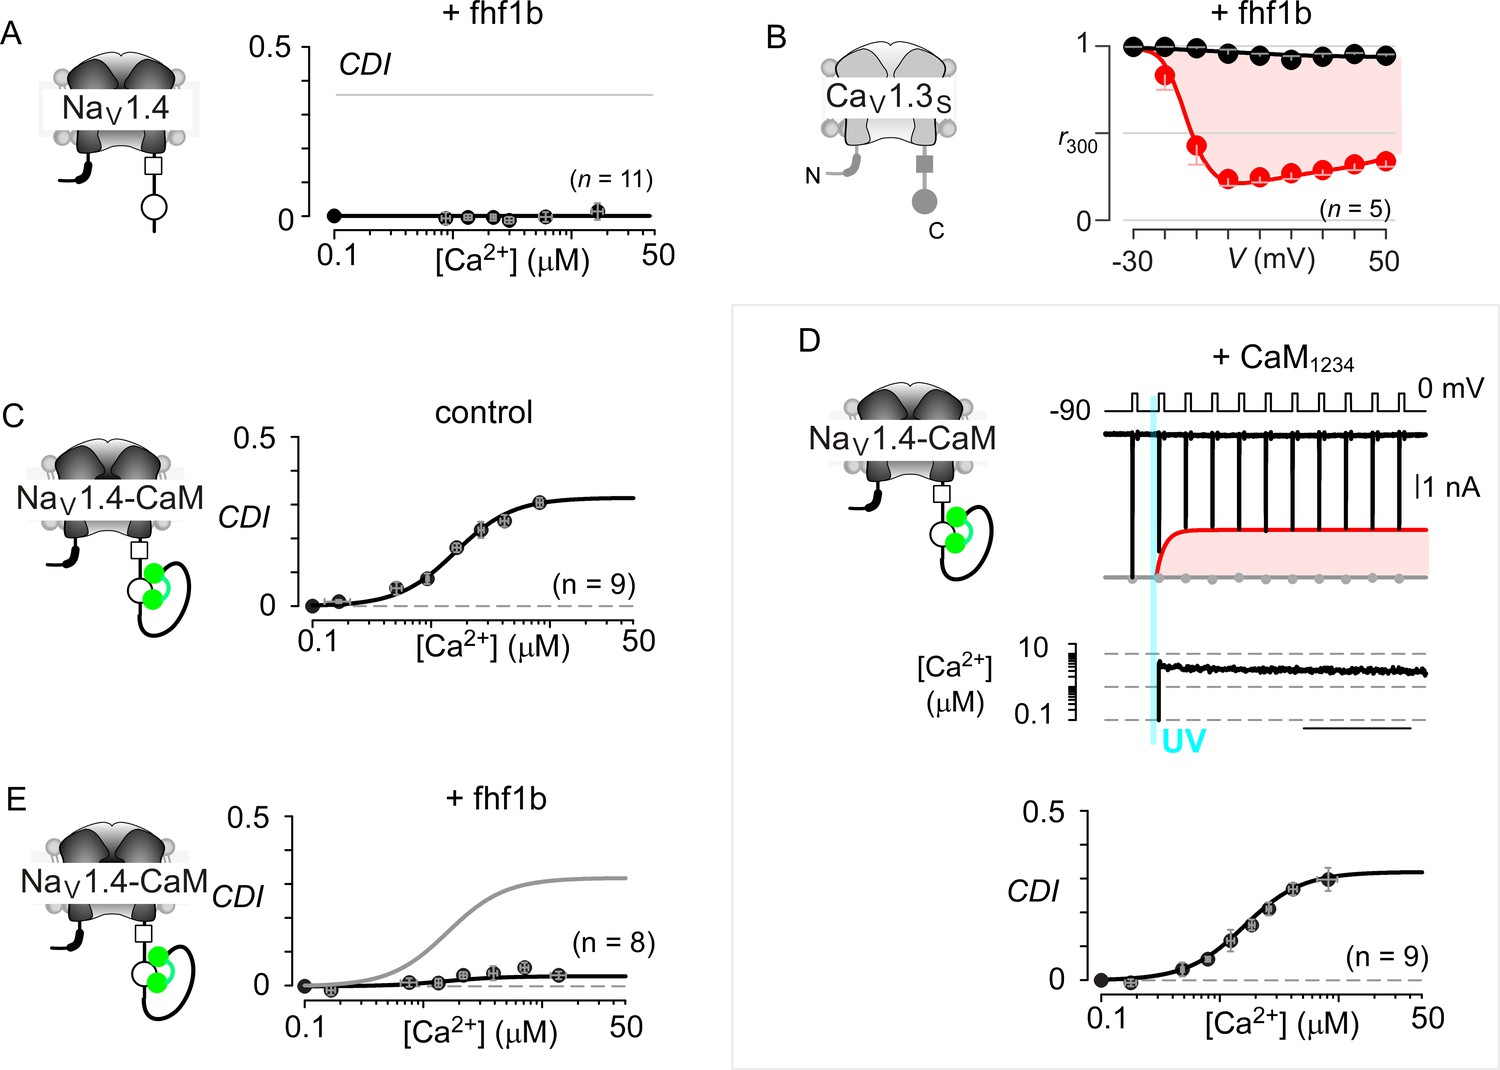
Extended data confirm the selectivity of fhf in modulating NaV versus CaV channels.
(A) Population data show that Fhf1 abolishes CDI of NaV1.4 channels. Mean data for CDI are plotted versus Ca2+-step amplitude. Symbols, mean ±S.E.M. of around four uncaging events compiled from denoted number of cells. (B) Fhf does not alter CDI of CaV1.3S demonstrating selectivity of fhf1 in modulating NaV channels. Strong CDI of CaV1.3S persists in the presence of fhf as confirmed by population data of r300 values. (C) NaV1.4 fused to CaM (NaV1.4-CaM) exhibits strong CDI identical to untethered channels as illustrated by identical fit reproduced from (A). (D) Fusion of CaMWT protects NaV1.4 from CaM1234, a competitive inhibitor of CDI. Exemplar currents shows robust CDI of NaV1.4-CaM in the presence of CaM1234. Format as in Figure 1M and (A). (E) Fhf1b suppresses CDI of NaV1.4-CaM confirming the dominance of fhf over CaM in modulation of NaV1.4. Format as in (A).
Figure 8 with 1 supplement
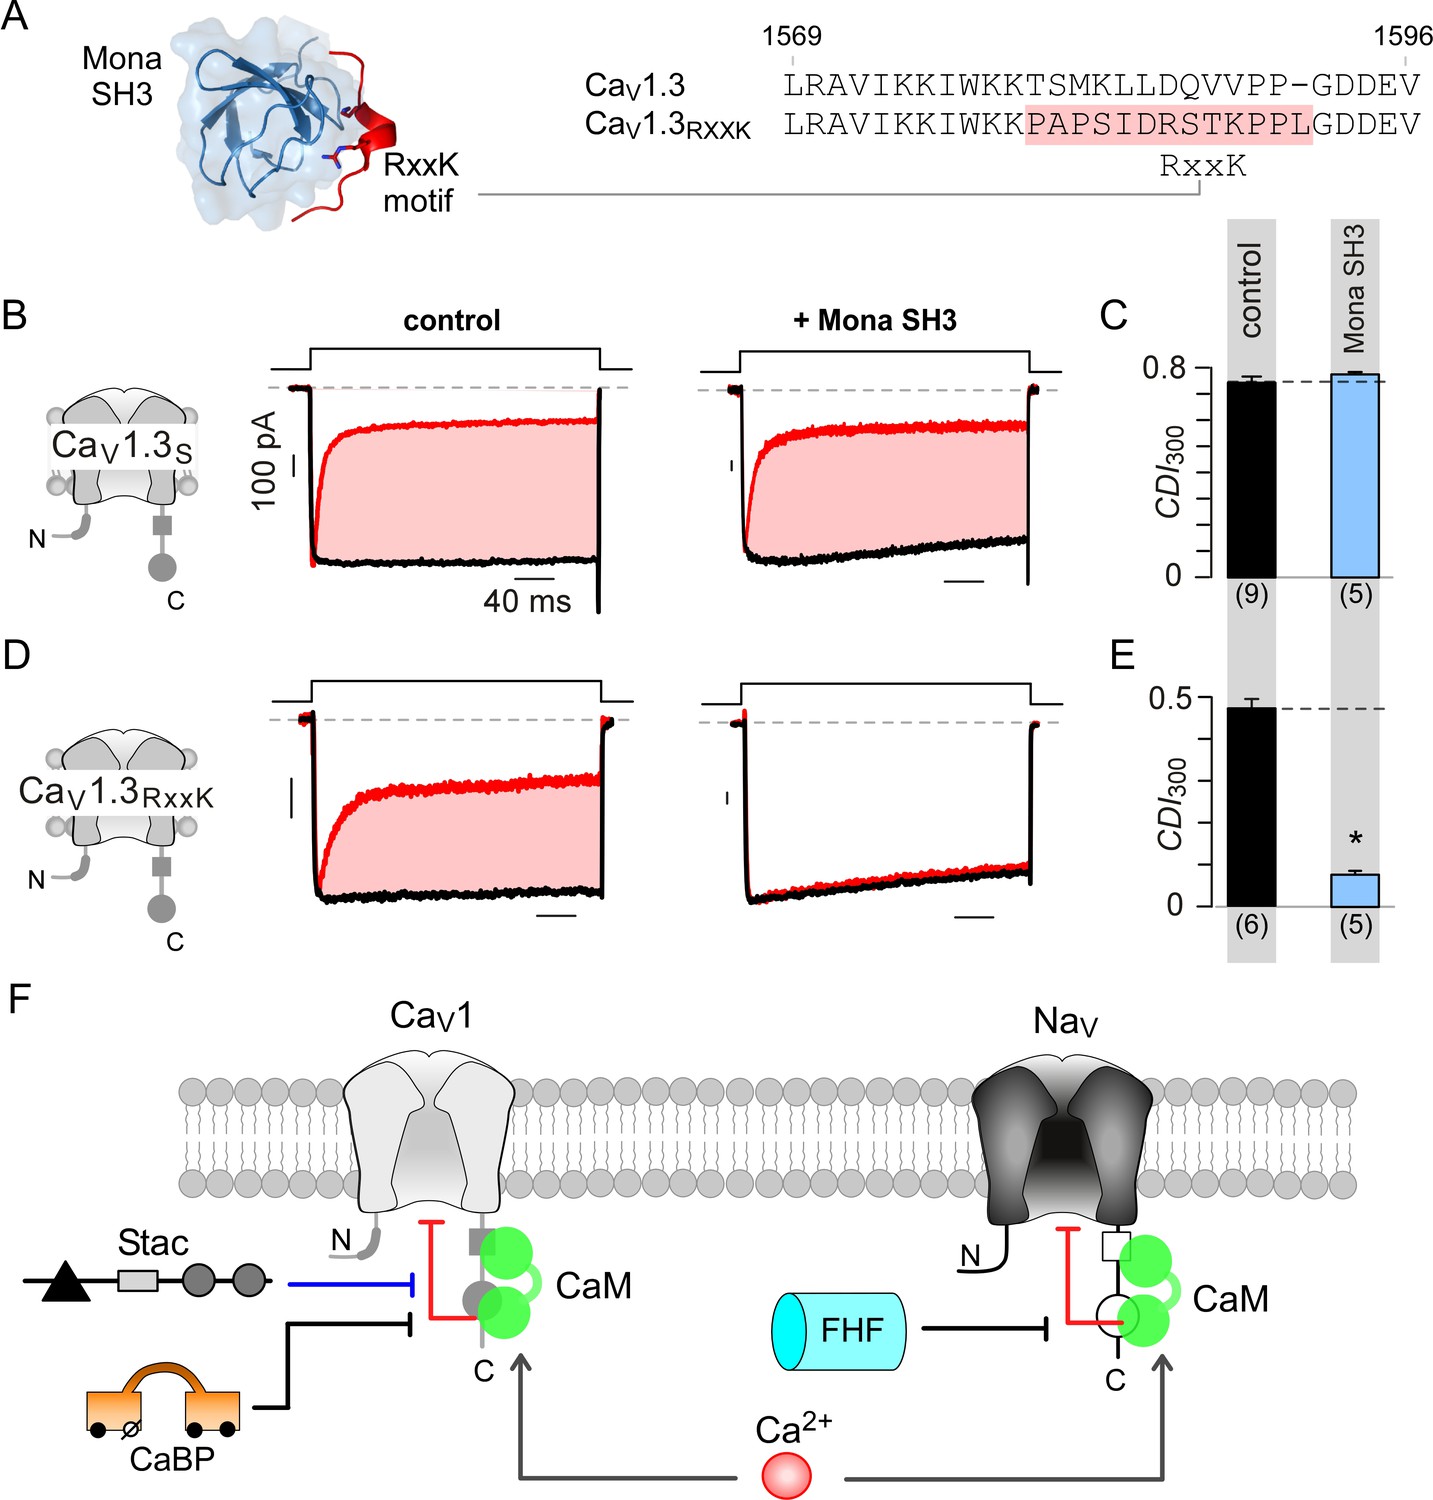
Engineering synthetic modulation of CaV1 channels.
(A) Left, schematic shows the atomic structure of Mona SH3 domain in complex with RxxK motif. Right, sequence alignment outlines strategy for insertion of RxxK motif into CaV1.3, yielding CaV1.3RxxK to confer synthetic suppression of CaV1.3 CDI by Mona SH3. (B–C) CaV1.3S expressed with and without Mona SH3 shows full CDI, confirming that wildtype CaV1.3 CDI is insensitive to Mona SH3. Format as in Figure 1A–B. Control data are reproduced from Figure 1D for comparison. (D–E) Mona SH3 strongly diminishes CDI of CaV1.3RxxK. Format as in Figure 1A–B. (F) Cartoon summarizes selective modulation of Ca2+/CaM signaling to CaV1, and NaV1 channels with CaM, stac, and fhf.
Figure 8—figure supplement 1
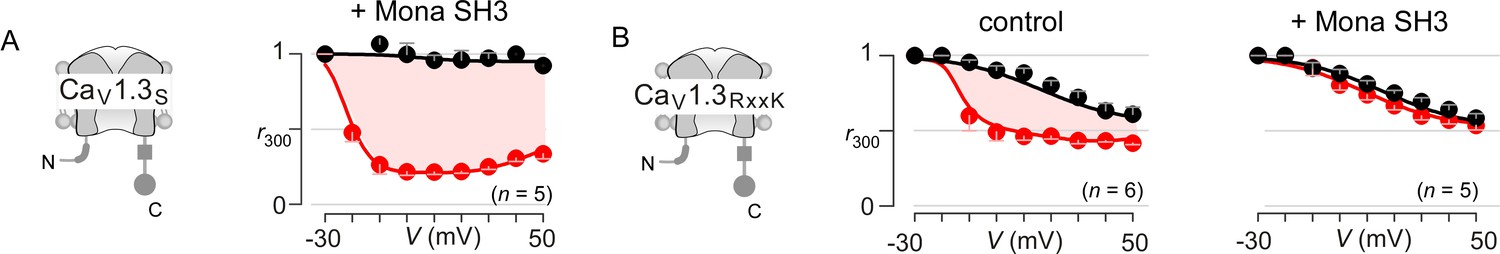
Extended data demonstrate feasibility of engineering synthetic modulators of CaM signaling to CaV1.3.
(A) CaV1.3S is insensitive to the SH3 domain of Mona/gads protein. Population data of inactivation r300 values show strong CDI of CaV1.3S in the presence of Mona SH3. Format as in Figure 1—figure supplement 1A. (B) In sharp contrast, the introduction of RxxK motif to CaV1.3 upstream CI elements (left subpanel) confers synthetic modulation of CaM signaling by Mona SH3. Middle, population r300 values show CDI of CaV1.3RxxK under endogenous levels of CaM. Right, co-expression of Mona SH3 abolishes CDI of CaV1.3RxxK, illustrating the feasibility of engineering synthetic regulatory proteins that abolish Ca2+/CaM signaling to selected targets. Format as in Figure 1—figure supplement 1A.
Tables
Key resources table
| Reagent type (species) or resource | Designation | Source or reference | Identifiers | Additional information |
|---|---|---|---|---|
| Gene (rat) | β2A | PMID: 1370480 | GenBank: M80545 | |
| Gene (rat) | α2δ | PMID: 8107966 | NCBI: NM_012919 | |
| Gene (Oryctolagus cuniculus) | CaV1.2 | PMID: 1718988 | NCBI: NM_001136522 | |
| Gene (rat) | CaV1.3S | PMID: 20139964 | GenBank: AF370009.1 | |
| Gene (rat) | CaV1.3MQDY | PMID: 24120865, 22284185 | ||
| Gene (human) | CaV1.443* | PMID: 22069316 | Laboratory of Dr. Soong Tuck Wah (National University of Singapore) | |
| Gene (human) | CaV2.1 splice variant 37a(EFa) with 43+/44-/47- | PMID: 12451115 | ||
| Gene (human) | CaV2.2 | PMID: 1321501, 10233069 | GenBank: M94172.1 | |
| Gene (rat) | CaV2.3 | PMID: 8388125, 18400181 | NCBI: NM_019294.2 | |
| Gene (rat) | NaV1.4 | PMID: 2175278 | ||
| Gene (human) | stac1 | Origene | NCBI: NP_003140.1 | |
| Gene (mouse) | stac2 | Origene | NCBI: NP_666140.1 | |
| Gene (human) | stac3 | Origene | NCBI: NP_659501.1 | |
| Gene (human) | fhf | PMID: 8790420 | Laboratory of Dr. Jeremy Nathans (Johns Hopkins University). | |
| Gene (human) | Mona SH3 | PMID: 12773374 | Synthesized by Genscript based on sequence in publication | |
| Peptide (mouse) | U-peptide | this paper | Peptide sequence KVDPVYETLRYGTSLALM NRSS synthesized by Genscript | |
| Competent cells (E. coli) | DH5α | Invitrogen: 18265017 | ||
| Cell line (human) | HEK293 | other | RRID: CVCL_0045 | |
| Biological sample (guinea pig) | aGPVM | PMID: 24076394 | Generated from Hartley strain guinea pigs | |
| Antibody | anti-stac1 | Abcam: ab181157 | 1:100 | |
| Antibody | anti-stac2 | Abcam: ab156080 | IHC – 1:100 WB – 1:250 | |
| Antibody | anti-α-actinin | Sigma Aldrich: A7811 | RRID: AB_476766 | 1:300 |
| Antibody | goat anti- rabbit IgG Alexa Fluor 594 | Abcam: ab150080 | RRID: AB_2650602 | 1:1000 |
| Antibody | goat anti-mouse IgG1 Alexa Fluor 488 | Thermo Fischer: A21121 | RRID: AB_2535764 | 1:1000 |
| Antibody | Goat Anti-Rabbit IgG (H + L) | Jackson ImmunoResearch: 111-035-144 | RRID: AB_2307391 | 1:10,000 |
| Recombinant DNA reagent | CaV1.3L | PMID: 20139964 | Engineered from CaV1.3S and human long distal carboxyl tail (NCBI: NM_000718) | |
| Recombinant DNA reagent | CaV2.3/1.3 CI | PMID: 24441587 | ||
| Recombinant DNA reagent | CaV1.3- CaMWT | PMID: 24441587 | ||
| Recombinant DNA reagent | CaV1.2- CaMWT | PMID: 15087548 | ||
| Recombinant DNA reagent | NaV1.4-CaM | this paper | Engineered by fusing CaMWT carboxy-tail of NaV1.4 | |
| Recombinant DNA reagent | CaV1.3RxxK | this paper | Engineered from CaV1.3S | |
| Recombinant DNA reagent | CFP-stac3 | this paper | stac3 was cloned into CFP vector with NotI and XbaI | |
| Recombinant DNA reagent | YFP-CaV1.3 CI | PMID: 23591884 | ||
| Recombinant DNA reagent | YFP-CaV1.3 PCI | PMID: 23591884 | ||
| Recombinant DNA reagent | YFP-CaV1.3 IQ | PMID: 23591884 | ||
| Recombinant DNA reagent | Ven-C1 | this paper | stac2 C1 was cloned into Venus vector (PMID: 26997269) with NotI and XbaI | |
| Recombinant DNA reagent | Ven-linker region | this paper | stac2 linker region was cloned into Venus vector (PMID: 26997269) with NotI and XbaI | |
| Recombinant DNA reagent | Ven-SH3-SH3 | this paper | stac2 SH3-SH3 was cloned into Venus vector (PMID: 26997269) with NotI and XbaI | |
| Recombinant DNA reagent | Ven-U-motif | this paper | stac2 U-motif was cloned into Venus vector (PMID: 26997269) with NotI and XbaI | |
| Recombinant DNA reagent | stac2 (KVD/AAA) | this paper | Quickchange PCR with stac2 | |
| Recombinant DNA reagent | stac2 (PVY/AAA) | this paper | Quickchange PCR with stac2 | |
| Recombinant DNA reagent | stac2 (ETL/AAA) | this paper | Quickchange PCR with stac2 | |
| Recombinant DNA reagent | stac2 (RYG/AAA) | this paper | Quickchange PCR with stac2 | |
| Recombinant DNA reagent | stac2 (TSL/AAA) | this paper | Quickchange PCR with stac2 | |
| Recombinant DNA reagent | stac2 (NRS/AAA) | this paper | Quickchange PCR with stac2 | |
| Recombinant DNA reagent | stac2 (S/A) | this paper | Quickchange PCR with stac2 | |
| Sequence-based reagent | Ven-C1 forward primer | this paper | cttctcgcggccgc tatgaccgaa atga gcgagaa | |
| Sequence-based reagent | Ven-C1 reverse primer | this paper | tcagaattctagattat tgctggt gggagatctc | |
| Sequence-based reagent | Ven-linker region forward primer | this paper | cttctcgcggccgcta catctttt cgacgcaact | |
| Sequence-based reagent | Ven-linker region reverse primer | this paper | tcagaattctagatta gtacatg ggccccacg | |
| Sequence-based reagent | Ven-SH3-SH3 forward primer | this paper | cttctcgcggccgc ttcctacgt cgccctct | |
| Sequence-based reagent | Ven-SH3-SH3 reverse primer | this paper | tcagaattctagattat cagatctct gccaaggag | |
| Sequence-based reagent | Ven-U-motif forward primer | this paper | cttctcgcggccgctaagg tggac ccagtttatga | |
| Sequence-based reagent | Ven-U-motif reverse primer | this paper | tcagaattctagattag ctggaa cggttcatcag | |
| Sequence-based reagent | stac2 (KVD/AAA) sense | this paper | ctactgggaccagcgg ggcggcgg ccccagt ttatgagacgc | |
| Sequence-based reagent | stac2 (KVD/AAA) antisense | this paper | gcgtctcataaactggg gccgccgc cccgctgg tcccagtag | |
| Sequence-based reagent | stac2 (PVY/AAA) sense | this paper | ccagcgggaaggtggac gcagc tgctgagacgct gcgctatg | |
| Sequence-based reagent | stac2 (PVY/AAA) antisense | this paper | catagcgcagcgtctc agcagct gcgtccacc ttcccgctgg | |
| Sequence-based reagent | stac2 (ETL/AAA) sense | this paper | ggtggacccagttt atgcggcgg cgcgct atggcacctcc | |
| Sequence-based reagent | stac2 (ETL/AAA) antisense | this paper | ggaggtgccatagcgc gccgcc gcataaact gggtccacc | |
| Sequence-based reagent | stac2 (RYG/AAA) sense | this paper | cccagtttatgagacgc tggccgc tgccacctcc ctggcactgatg | |
| Sequence-based reagent | stac2 (RYG/AAA) antisense | this paper | catcagtgccaggg aggtggca gcggccagc gtctcataaactggg | |
| Sequence-based reagent | stac2 (TSL/AAA) sense | this paper | acgctgcgctatgg cgccgccgc ggcactga tgaaccg | |
| Sequence-based reagent | stac2 (TSL/AAA) antisense | this paper | cggttcatcagtgc cgcggcggc gccatag cgcagcgt | |
| Sequence-based reagent | stac2 (NRS/AAA) sense | this paper | gatgtgctgctga agctggcagcg gccatc agtgccagggaggtg | |
| Sequence-based reagent | stac2 (NRS/AAA) antisense | this paper | cacctccctggc actgatggccgc tgcc agcttcagcagcacatc | |
| Sequence-based reagent | stac2 (S/A) sense | this paper | cactgatgaacc gttccgccttc agcag cacatctg | |
| Sequence-based reagent | stac2 (S/A) antisense | this paper | cagatgtgctgctga aggcgg aacggttca tcagtg | |
| Software, algorithm | PyMOL | http://www.pymol.org/ | RRID: SCR_000305 |
Additional files
-
Transparent reporting form
- https://doi.org/10.7554/eLife.35222.022
Download links
A two-part list of links to download the article, or parts of the article, in various formats.
Downloads (link to download the article as PDF)
Open citations (links to open the citations from this article in various online reference manager services)
Cite this article (links to download the citations from this article in formats compatible with various reference manager tools)
Allosteric regulators selectively prevent Ca2+-feedback of CaV and NaV channels
eLife 7:e35222.
https://doi.org/10.7554/eLife.35222


