Gene-specific mechanisms direct glucocorticoid-receptor-driven repression of inflammatory response genes in macrophages
- Weill Cornell/ Rockefeller/ Sloan Kettering Tri-Institutional MD-PhD Program, United States
- The David Rosensweig Genomics Center, United States
- Weill Cornell Graduate School of Medical Sciences, United States
- Tsinghua University, China
- The University of Texas Health Science Center at San Antonio, United States
Figures
Figure 1 with 2 supplements
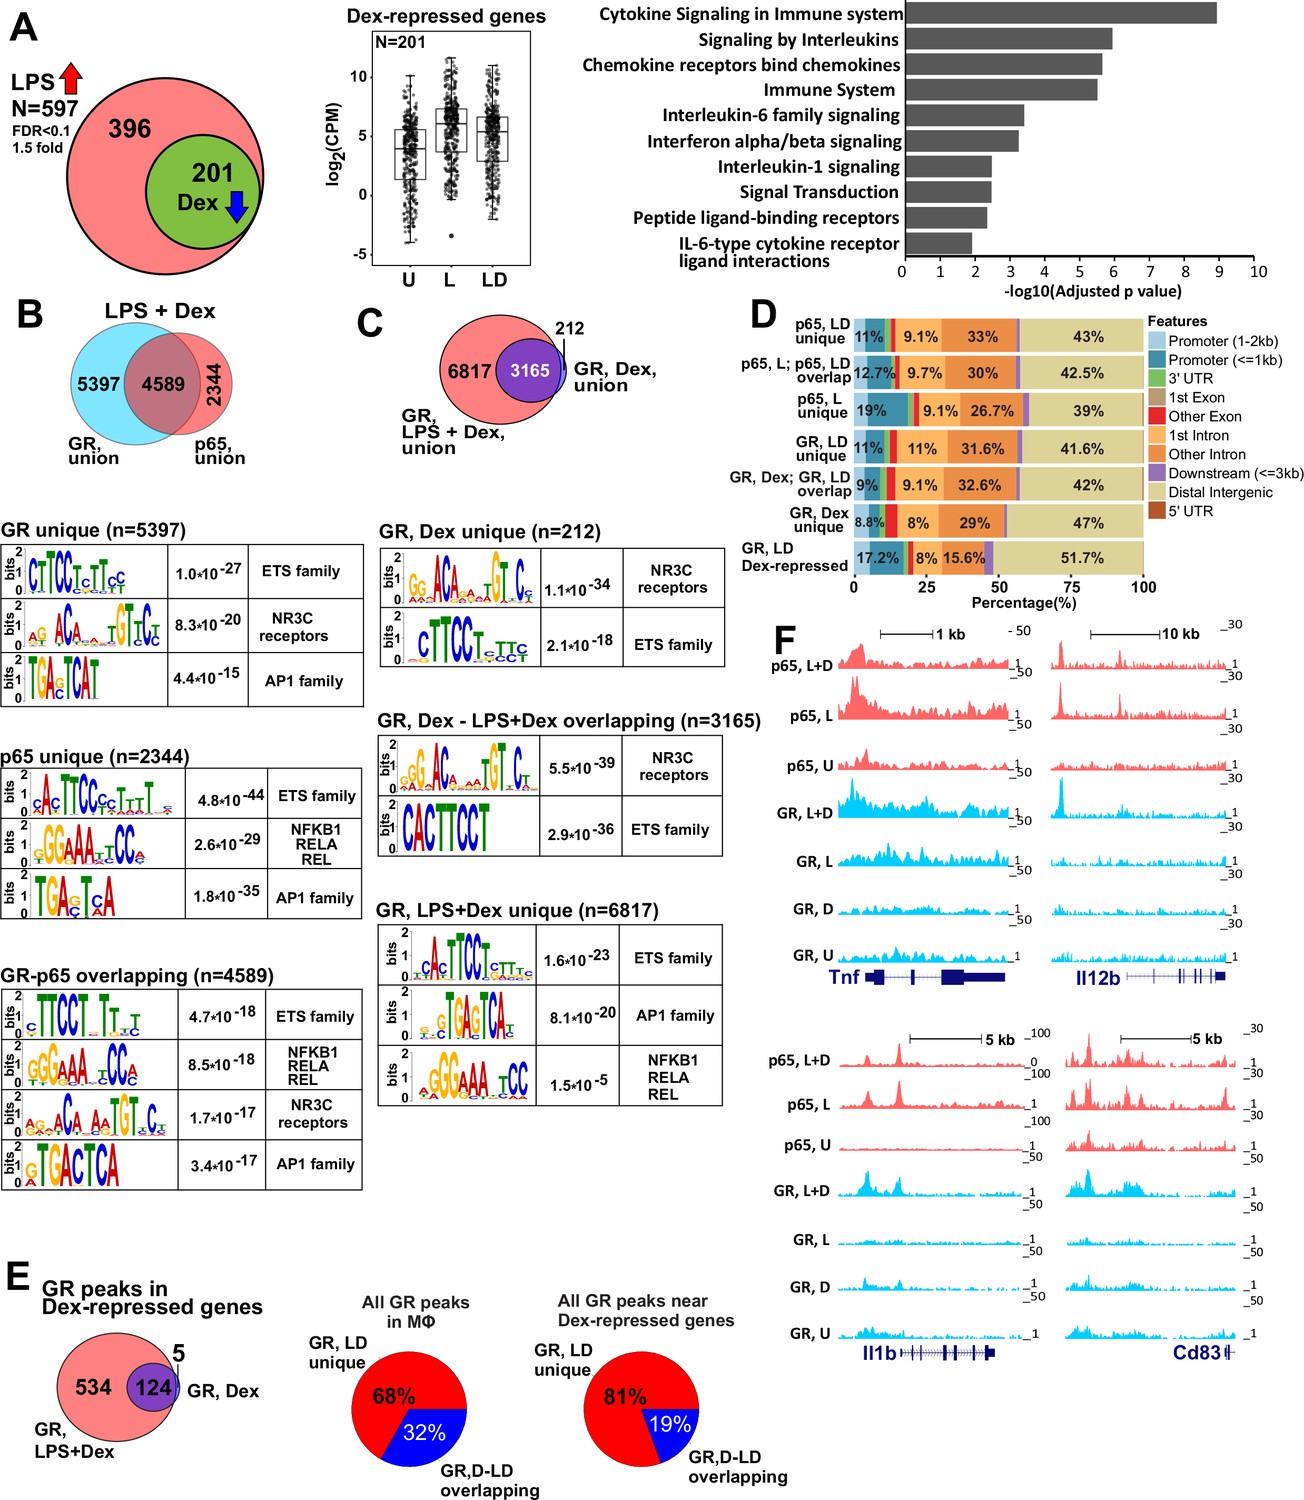
GR represses LPS-induced genes via p65-assisted tethering.
(A) Over 30% of LPS-induced genes (597) in BMDM are repressed by Dex (201; Venn diagram and normalized expression values) and show a pro-inflammatory gene signature (GO analysis). BMDM were untreated (U) or treated with 10 ng/ml LPS ±100 nM Dex (L and LD) for 1 hr, and gene expression levels were determined by RNA-seq (n = 2). (B) The overlap between ChIP-seq peak calls for GR and p65 in LPS + Dex-treated BMDM (Venn diagram) was determined using subsetByOverlap function from GenomicRanges package (Bioconductor) with the minimum overlap of 1 nt (see Materials and methods). Ab initio sequence motif discovery and over-representation in each subset of GR or p65 binding peaks was determined using MEME-ChIP (Ma et al., 2014). E-values for the enrichment of the motif are shown. (C) Dex- and LPS + Dex-induced GR ChIP-seq peaks are shown (Venn diagram). LPS + Dex unique peaks are enriched for NF-kB-binding sites as indicated by MEME-ChIP analysis as in B. (D) Genomic location of p65 and GR binding sites relative to known genomic features is determined by ChIPpeakAnno (Bioconductor) (Zhu et al., 2010). (E) The distribution of GR-binding sites located in a 200 Kb region centered on LPS-induced Dex-repressed genes in BMDM treated with Dex or LPS + Dex (left). Pie-charts show the % of LD-unique GR peaks either genome-wide (center) or those associated with LPS-induced Dex-repressed genes only (right). (F) GR and p65 ChIP-seq read density profiles of representative LPS-induced Dex-repressed genes are shown for untreated (U), LPS (L) or LPS + Dex (L + D) treated BMDM. Also see Figure 1—figure supplements 1–2 and Supplementary files 1 and 2.
Figure 1—figure supplement 1
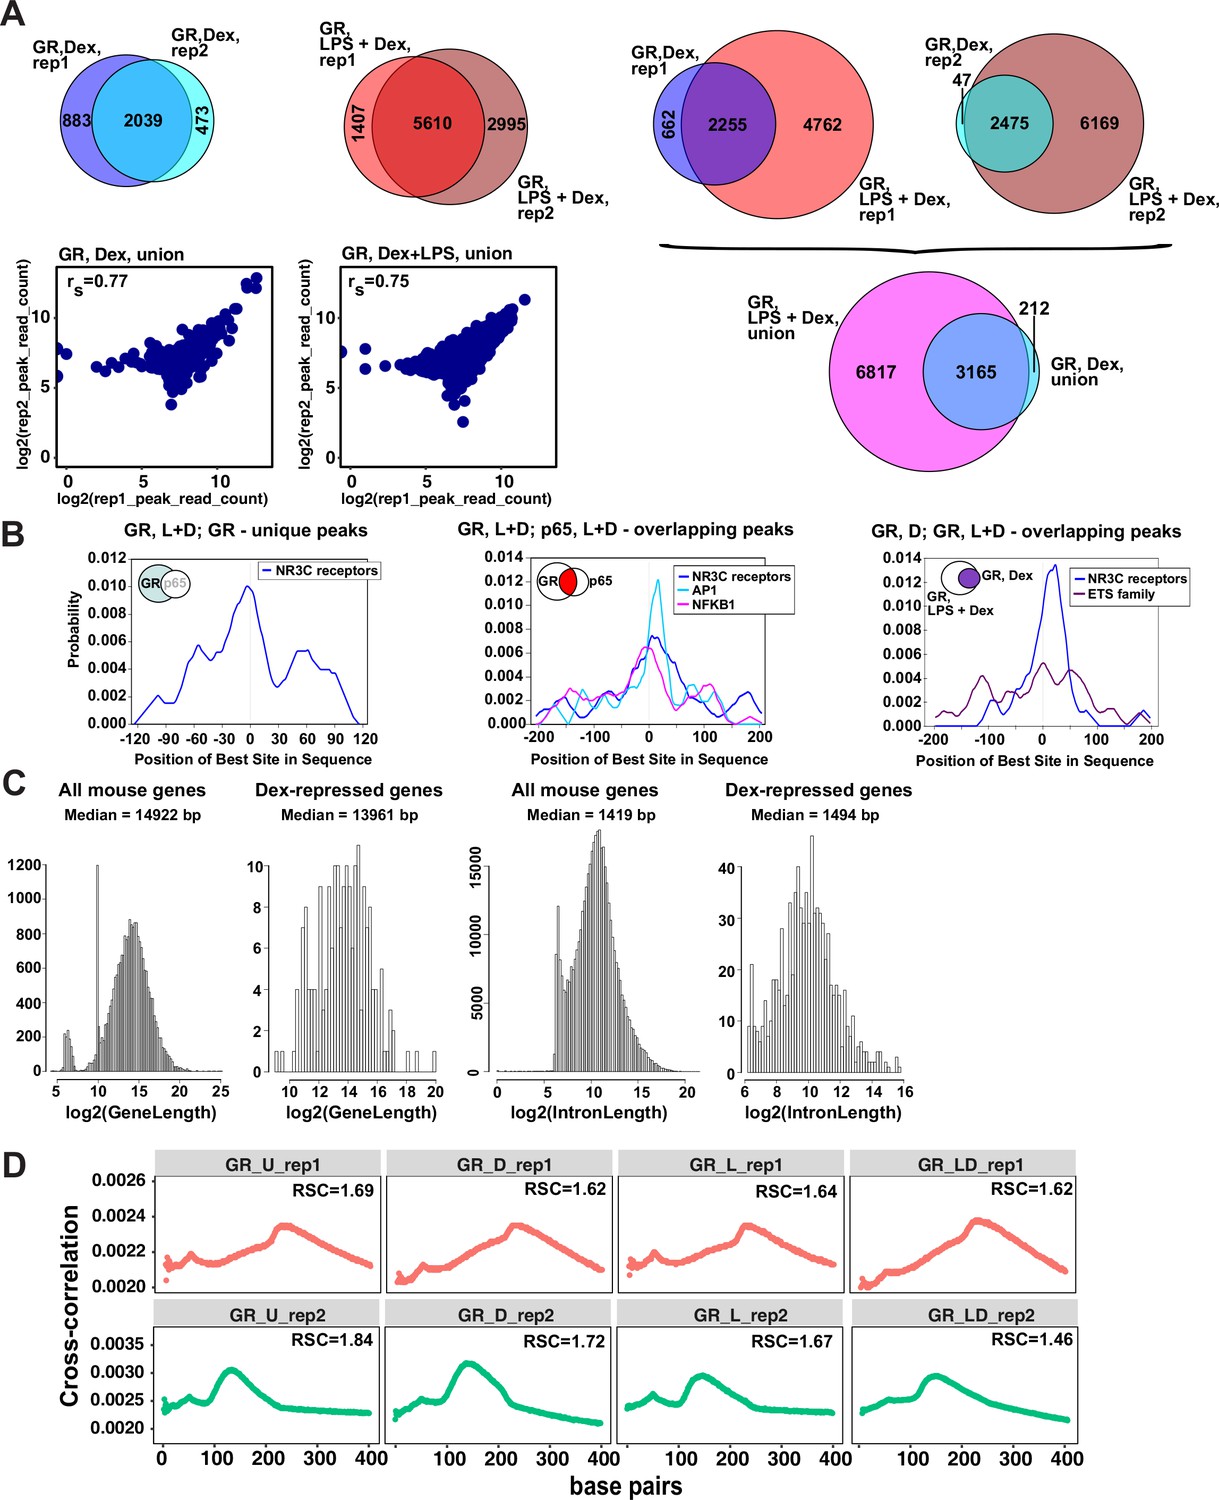
Characterization of GR cistromes in Dex- and LPS + Dex-treated BMDM.
(A) Venn diagram comparison of GR peak sets from ChIP-seq replicates in BMDM treated as indicated (left) and between treatments (right). The union of peak sets was constructed for each condition. Read counts were determined for each peak in condition-specific peak union sets for each replicate; a plot of log transformed per peak read counts for GR replicas is shown for each treatment condition; rs - Spearman’s correlation between replicas (left, bottom). (B) The centrality enrichment analysis of binding motifs identified by ab initio prediction with MEME was performed using CentriMo program of MEME suite. Significant distribution profiles relative to the peak midpoint are shown for several subsets of peaks identified by GR and p65 ChIP-seq. Left: GR-unique peaks from GR:p65 cistromes in LPS + Dex treated BMDM (Figure 1B). Middle: GR, L + D peaks overlapping p65, L + D peaks. Right: GR, D peaks overlapping GR, L + D peaks (Figure 1C). (C) Distribution of gene and intron length in Dex-repressed genes compared to all expressed genes in mouse BMDM. (D) Cross-correlation plots for GR ChIP-seq datasets generated in this study. Relative strand cross-correlations were calculated using CLC BIO Genomics Workbench.
Figure 1—figure supplement 2
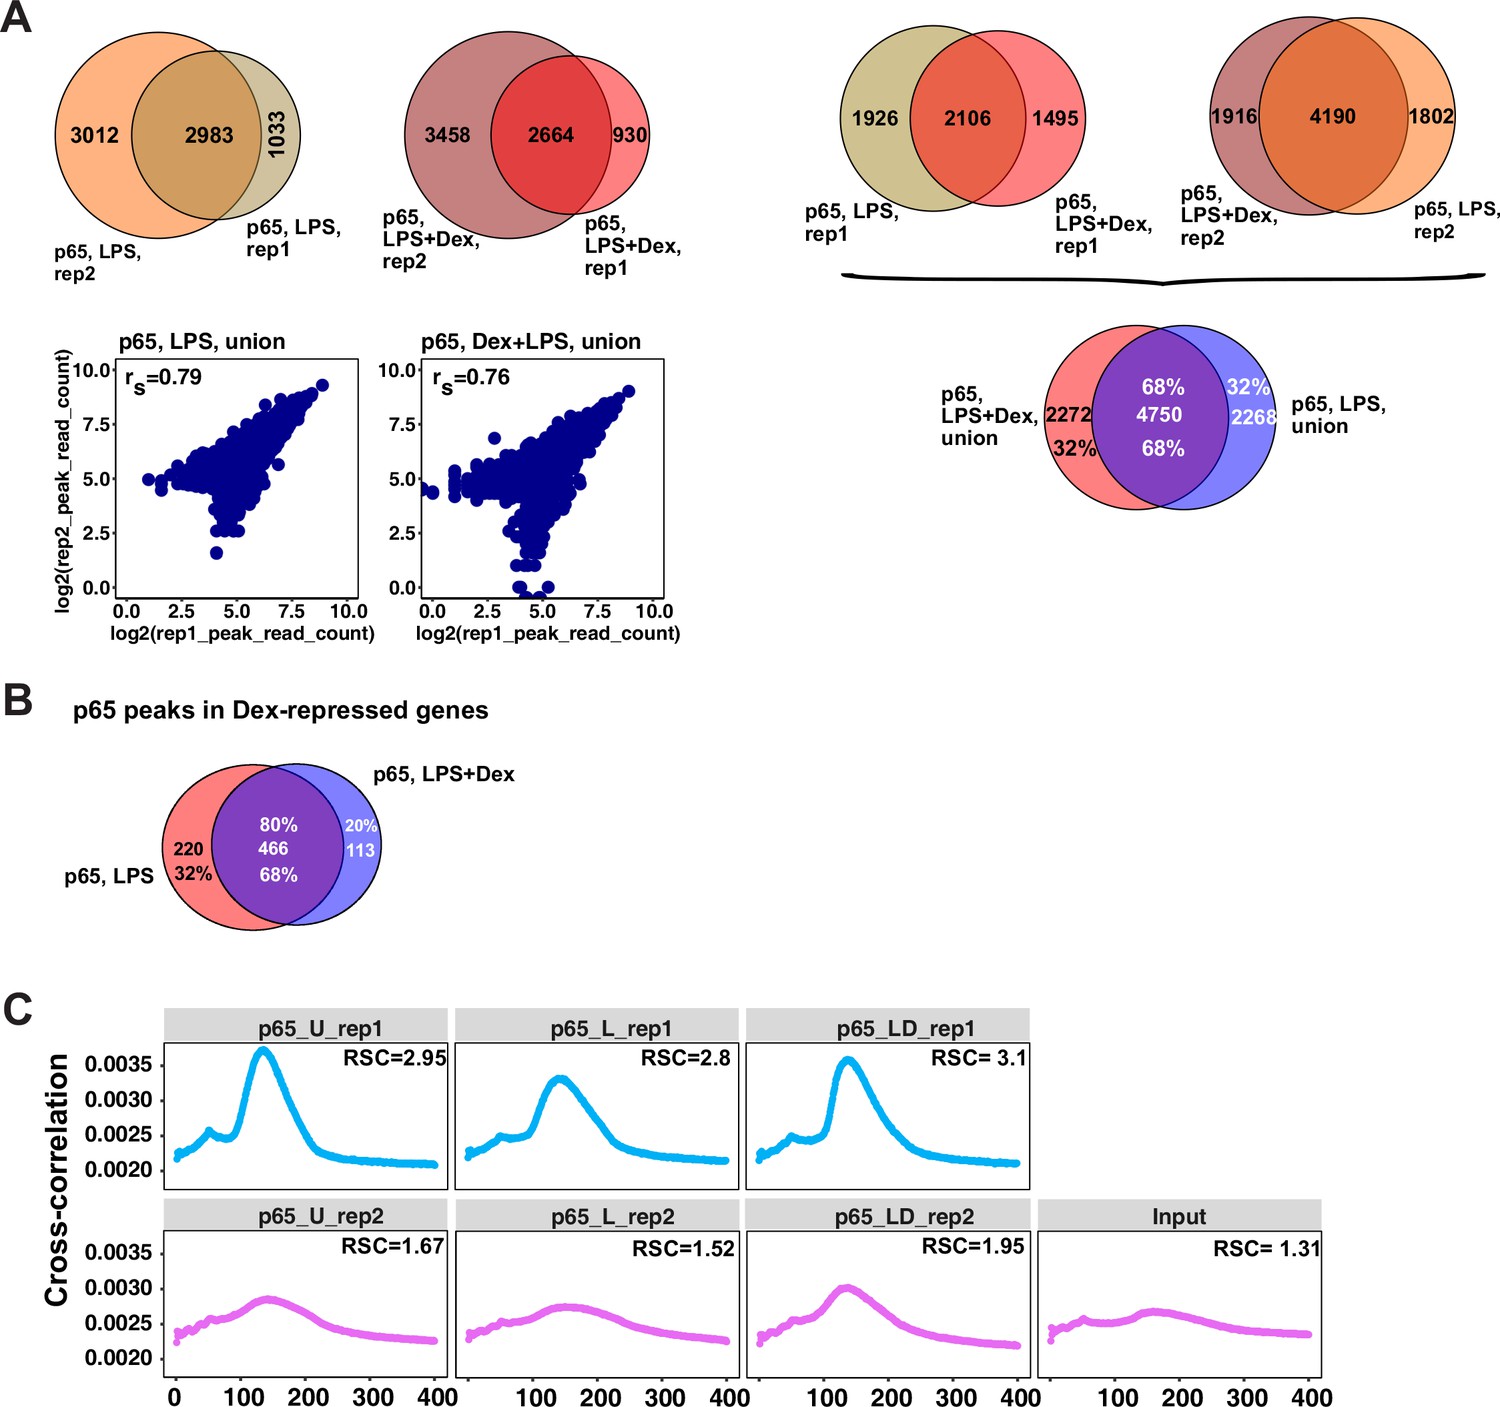
Characterization of p65 cistromes in LPS- and LPS +Dex treated BMDM.
(A) Venn diagram comparison of p65 peak sets from ChIP-seq replicates in BMDM treated as indicated (left) and between treatments (right). The union of peak sets was constructed for each condition. Read counts were determined for each peak in condition-specific peak union sets; a plot of log transformed per peak read counts for p65 replicas is shown for each treatment condition; rs - Spearman’s correlation between replicas (left, bottom). (B) p65 peaks distribution in LPS- and LPS + Dex-treated BMDM near Dex-repressed genes from Figure 1A (±100 Kb) (C) Cross-correlation plots for p65 ChIP-seq datasets generated in this study. Relative strand cross-correlations were calculated using CLC BIO Genomics Workbench.
Figure 2
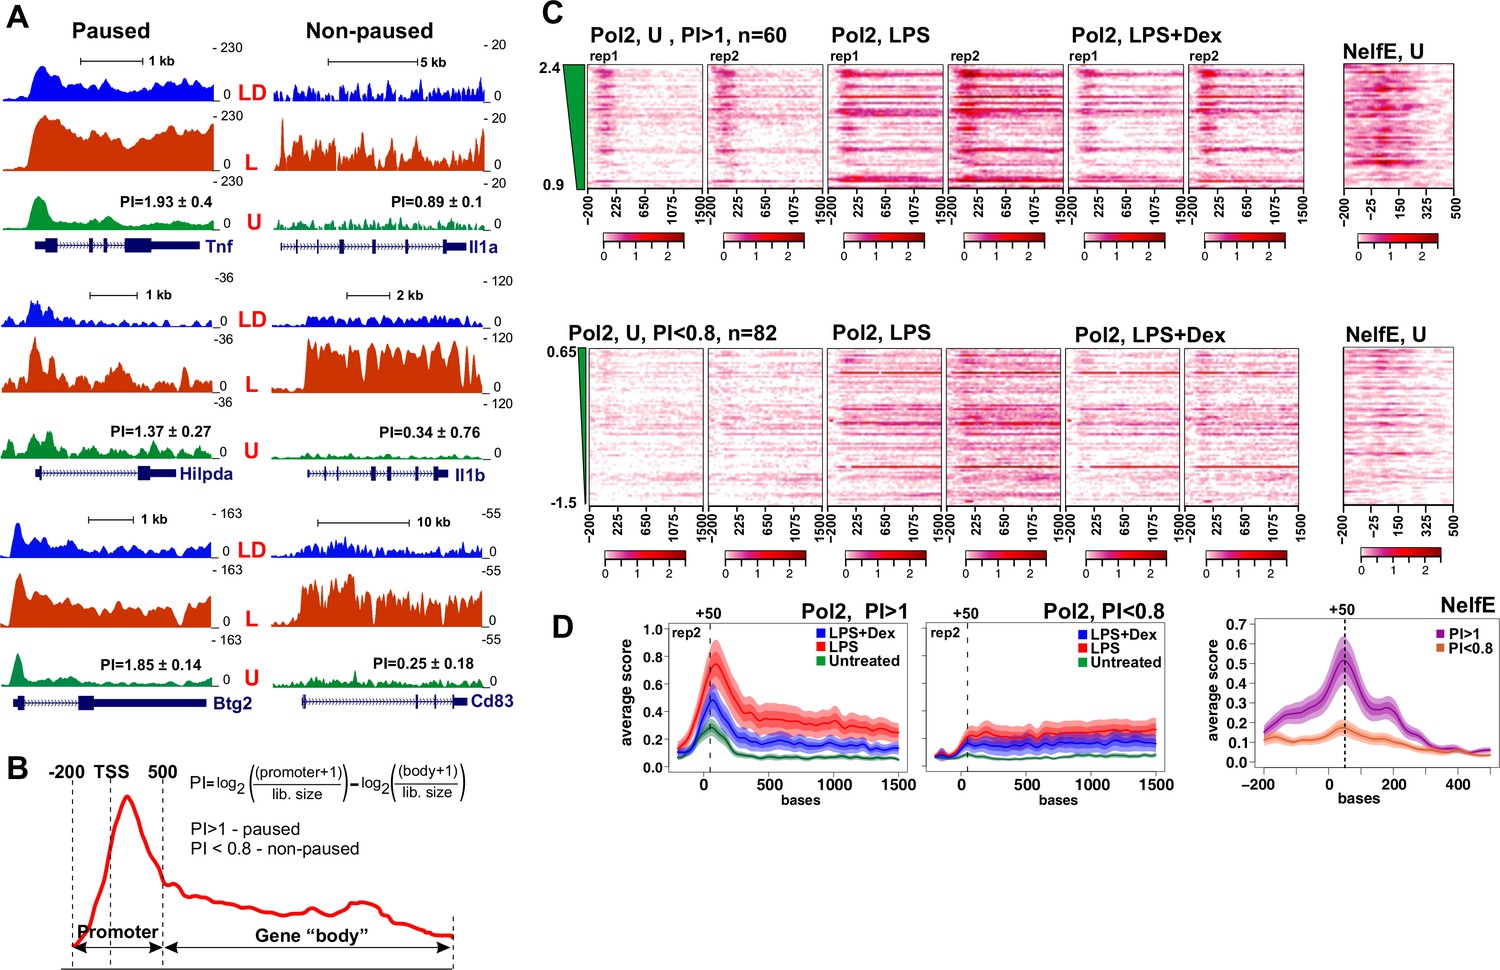
Pol 2 and NELF dynamics at different classes of GR-sensitive genes.
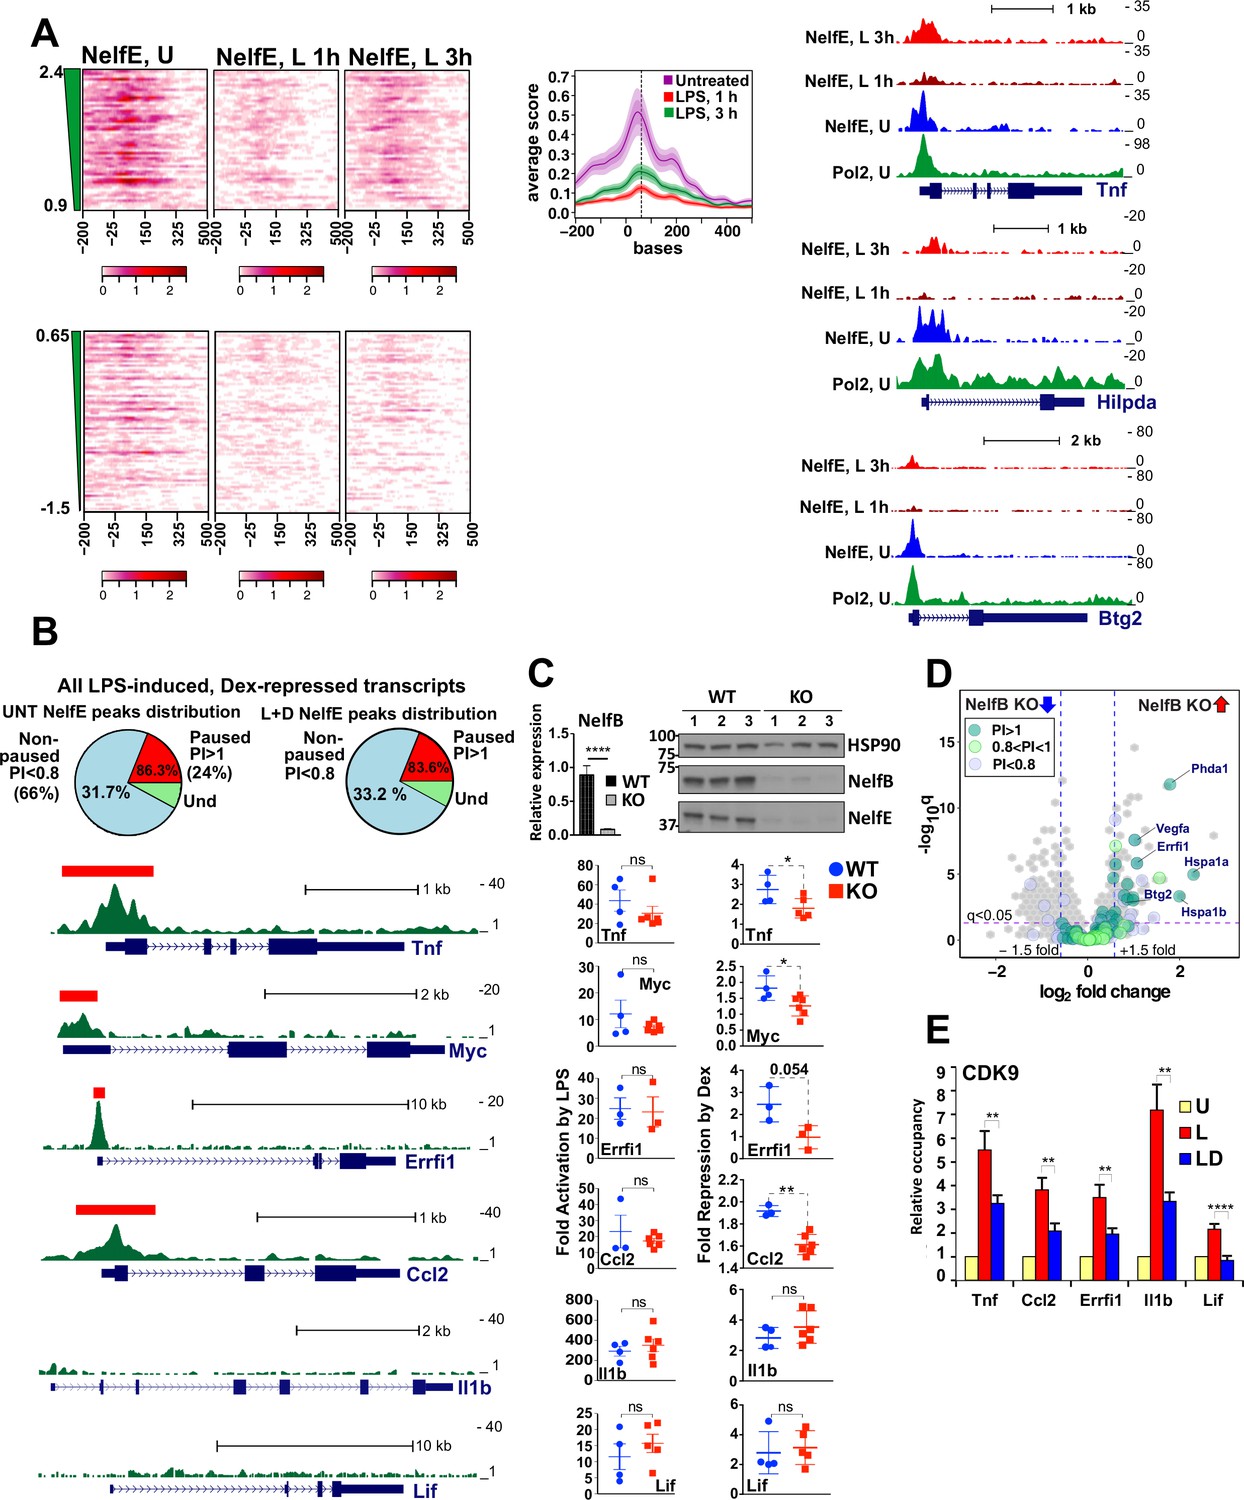
(A) Pol 2 ChIP-seq read density profiles and pausing indexes (PI) for representative paused and non-paused genes in the untreated (U), LPS (L) and LPS +Dex (LD) treated BMDM. (B) PI (a ratio of Log-transformed Pol 2 counts at the promoter and gene body in untreated BMDM) was calculated for all LPS-induced Dex-repressed transcript variants with unique 5’ ends (see Materials and methods). Genes with PI >1 were considered paused and those with a PI <0.8 non-paused. (C) Pol 2 ChIP-seq heat maps of paused (n = 62) and non-paused (n = 82) transcripts sorted by the PI indexes corresponding to 198 Dex-repressed genes (see Materials and methods) are shown for the U, L and L + D conditions for each individual replica. Only transcripts overlapping Pol 2 peaks in LPS-treated BMDMs as determined by MACS2 are shown. NELF-E heat maps from U BMDM ChIP-seq for the same transcript classes are shown on the right. Heat maps scales are equalized to visualize Pol 2 and NELF distribution across the genes; color scale bars are shown below corresponding maps. (D) Average Pol 2 (in each treatment condition) and NELF-E (untreated BMDM) occupancy for each gene class defined in C. The confidence band shows the SEM and 95% confidence interval. Also see Supplementary files 2 and 3.
Figure 3 with 1 supplement
Gene-class-specific contribution of NELF to GR-mediated repression.
(A) Heat maps show NELF-E occupancy in the U (from Figure 2C), 1 and 3 hr L-treated BMDM for paused and non-paused transcripts. Average occupancy for the paused genes in each condition is graphed as in Figure 2D. Representative examples of Pol 2 and NELF ChIP-seq read density profiles are shown on the right. (B) Pie charts show the percentage of all paused (24%) and non-paused (66%) LPS-induced Dex-repressed genes that exhibit promoter-proximal NELF-E binding in the UNT (86.3% and 31.7%, respectively) and L + D conditions (83.6% and 33.2%, respectively). NELF-E ChIP-seq read density profiles for the L + D condition are shown for a set of representative genes. Red rectangles in Tnf, Myc, Errfi1 and Ccl2 profiles indicate MACS2 NELF-E peaks in the L + D condition. (C) NELF-B KO mice were generated as described in Methods. NELF-B RNA in WT and KO BMDM was quantified by RT-qPCR and normalized to Actb (n = 5, p<0.0001, two-tailed Student’s t-test; error bars are SEM). For western blots, three mice per genotype were used to visualize NELF-B, NELF-E and HSP90 as a loading control (top). Bottom: WT and NELF-B KO BMDM were U or treated with L-/+D for 30 min (Tnf) or 1 hr (all others) and the expression of indicated genes (matching those in B) was assessed by RT-qPCR, normalized to Actb, and shown as ‘fold activation by LPS’ over basal levels (=1) and ‘fold repression by Dex’ (a ratio of L over L + D level of each transcript). *p<0.05, **p<0.01 (Two-tailed Student’s t-test). Error bars are SEM. (D) The volcano plot comparing gene expression in L + D (1 hr) treated BMDM from the WT vs. NELF-B KO mice (n = 3) (fold change = 1.5, FDR p<0.05). Pausing indices (PI) of 201 LPS-induced Dex-repressed genes from Figure 1A are shown in color. (E) CDK9 occupancy at selected genes in BMDM treated for 1 hr as indicated. n = 4–9. **p<0.01, ****p<0.001 (two-tailed Student’s t-test). Error bars are SEM. Also see Figure 3—figure supplement 1 and Supplementary file 2.
-
Figure 3—source data 1
Source raw data for Fig. 3C (RT-qPCR in WT and NELF-B KO) and 3E (ChIP-qPCR for CDK9).
- https://doi.org/10.7554/eLife.34864.009
Figure 3—figure supplement 1
Characterization of Pol 2 and NELF cistromes in BMDM.
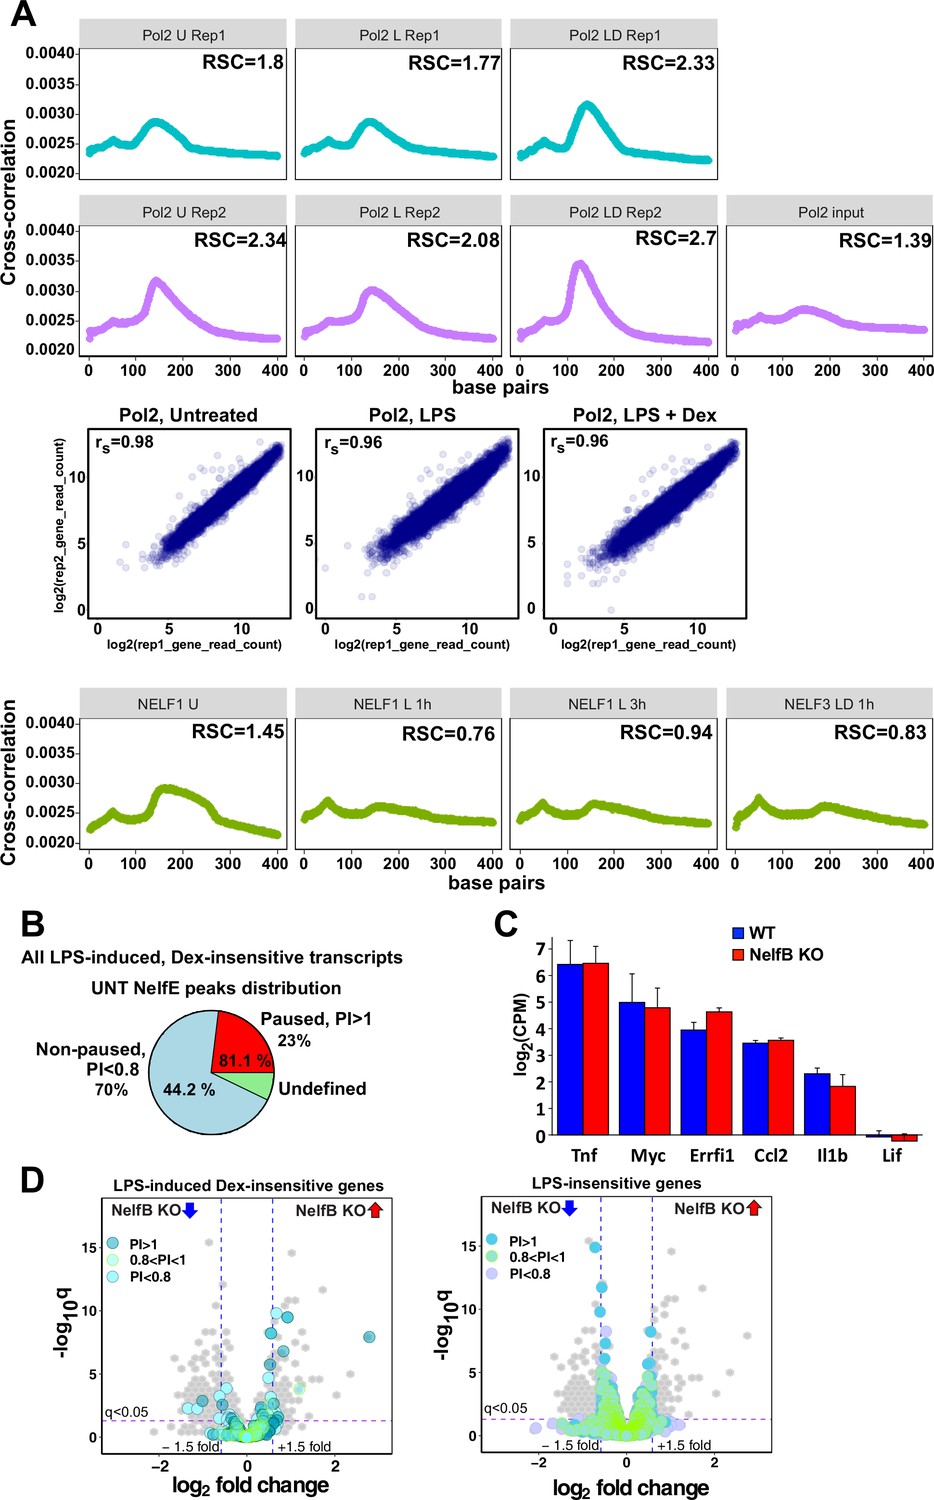
(A) Cross-correlation plots for Pol 2 and NELF-E ChIP-seq datasets generated in this study. Relative strand cross-correlations were calculated using CLC BIO Genomics Workbench. A plot of log transformed per gene read counts for Pol 2 replicas is shown for each treatment condition; rs - Spearman’s correlation between replicas. (B) A pie chart shows the percentage of all paused (23%) and non-paused (70%) LPS-induced Dex-insensitive transcripts that exhibit NELF-E binding (81.1% and 44.2%, respectively) in untreated BMDM. Paused and non-paused transcripts were identified as described in Materials and methods. (C) RNA-seq expression levels of indicated genes in untreated WT and NELF-B KO BMDM (n = 2). (D) The volcano plots compare gene expression in L + D (1 hr) treated WT vs. NELF-B KO BMDM (n = 3, fold change = 1.5, FDR p<0.05). Pausing indexes for LPS-induced Dex-insensitive genes from Figure 1A (left) and LPS-insensitive genes (right) are shown in colors, as indicated.
-
Figure 3—figure supplement 1—source data 1
RNA-seq baselines in wt vs NELF-B KO.
- https://doi.org/10.7554/eLife.34864.010
Figure 4 with 1 supplement
GR inhibits H4 acetylation, BRD4 and Mediator assembly at non-paused genes.
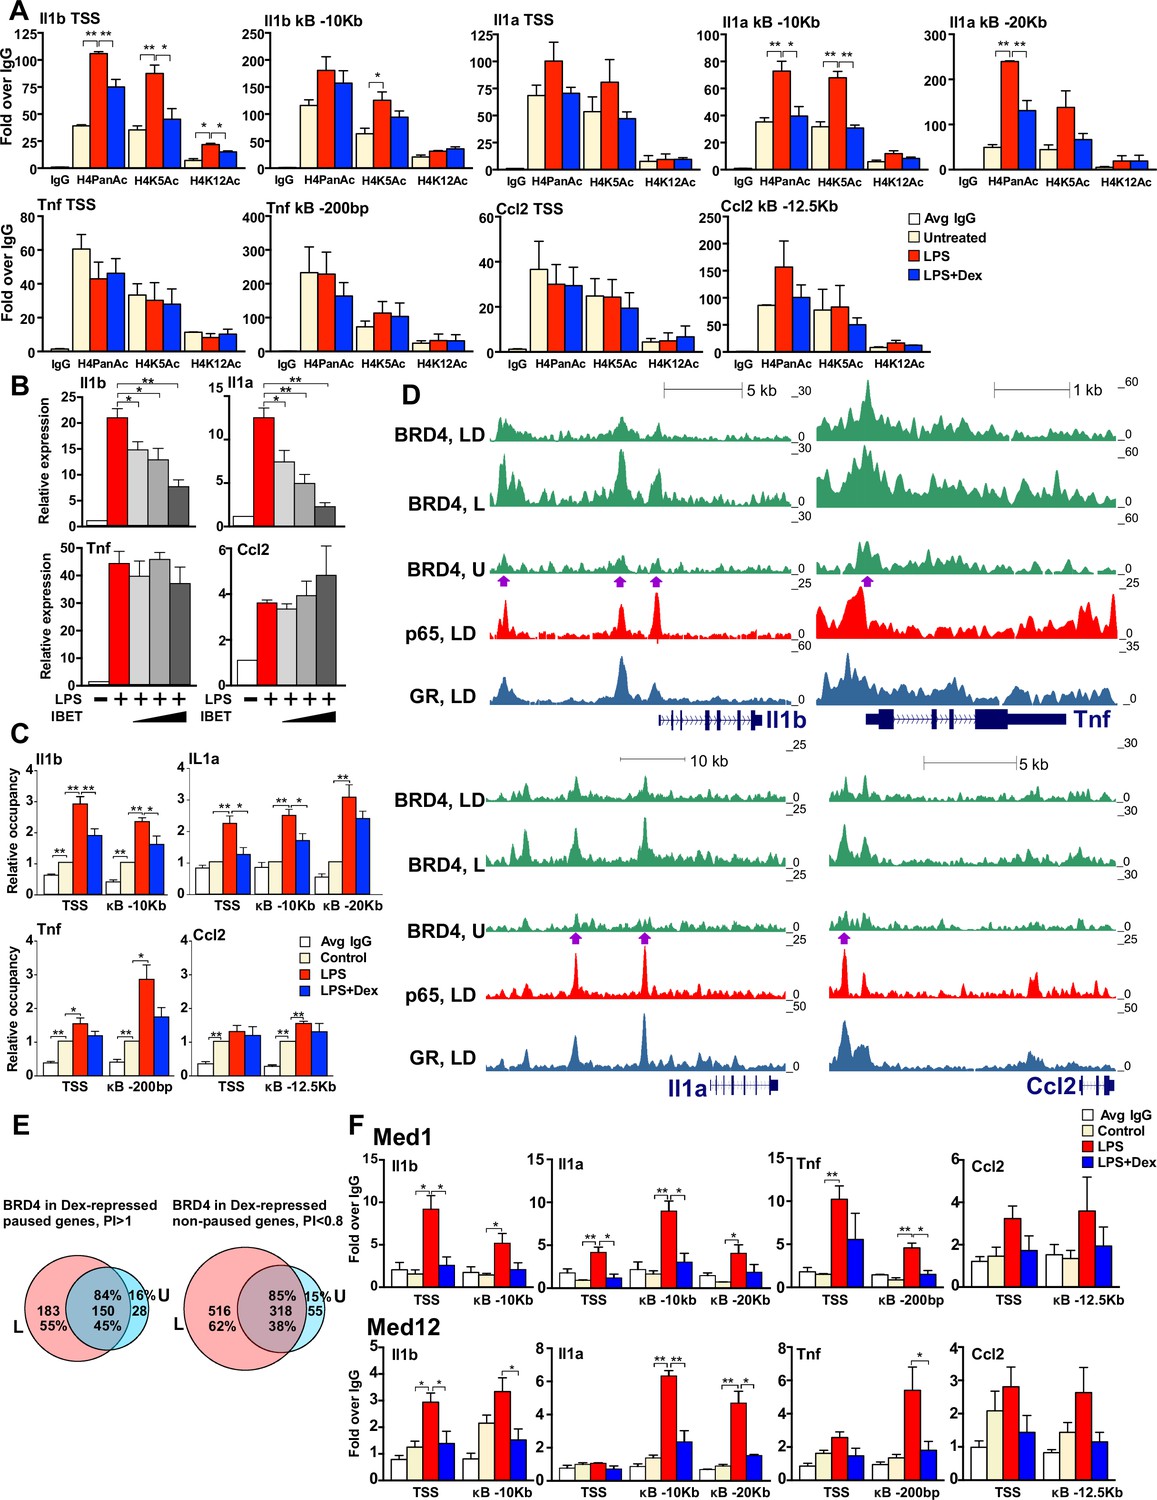
(A) BMDM were treated as indicated, and H4PanAc, H4K5Ac and H4K12Ac at the TSS and indicated kB sites were assessed by ChIP. qPCR signals were normalized to r28S gene and expressed as relative enrichment over normal IgG (=1). A two-tailed Student’s t-test was used for comparing means (n ≥ 3; *p<0.05, **p<0.01). Error bars are SEM. (B) BMDM were pre-treated with I-BET (10 nM, 100 nM, 1 μM) for 30 min followed by addition of LPS for 30 more min. Gene expression was assessed by RT-qPCR and normalized to that of Actb. A two-tailed Student’s t-test was used for comparing means (n ≥ 3; *p<0.05, **p<0.01). Error bars are SEM. (C) BRD4 occupancy was assessed by ChIP-qPCR as in A with IgG ChIP as a background metric and expressed as relative enrichment over untreated for each site (=1). A two-tailed Student’s t-test was used for comparing means (n ≥ 3, *p<0.05, **p<0.01). (D) ChIP-seq read density profiles for BRD4, GR and p65 in the U, L or L + D treated BMDM. Purple arrows indicate peaks specifically noted in Results. (E) Venn diagrams show overlapping BRD4 peaks for Dex-repressed paused and non-paused genes in the U and L condition. Overlapping peaks were determined as described in Figure 1 and Materials and methods. (F) Med1 and Med12 occupancy is analyzed by ChIP-qPCR as in A (n ≥ 3). Also see Figure 4—figure supplement 1 and Supplementary file 2.
-
Figure 4—source data 1
Source raw data for Figure 4A, C, F (ChIP-qPCR for H4Ac, Brd4 and Mediator) and 4B (RT-qPCR).
- https://doi.org/10.7554/eLife.34864.013
Figure 4—figure supplement 1
Characterization of BRD4 cistromes in BMDM.
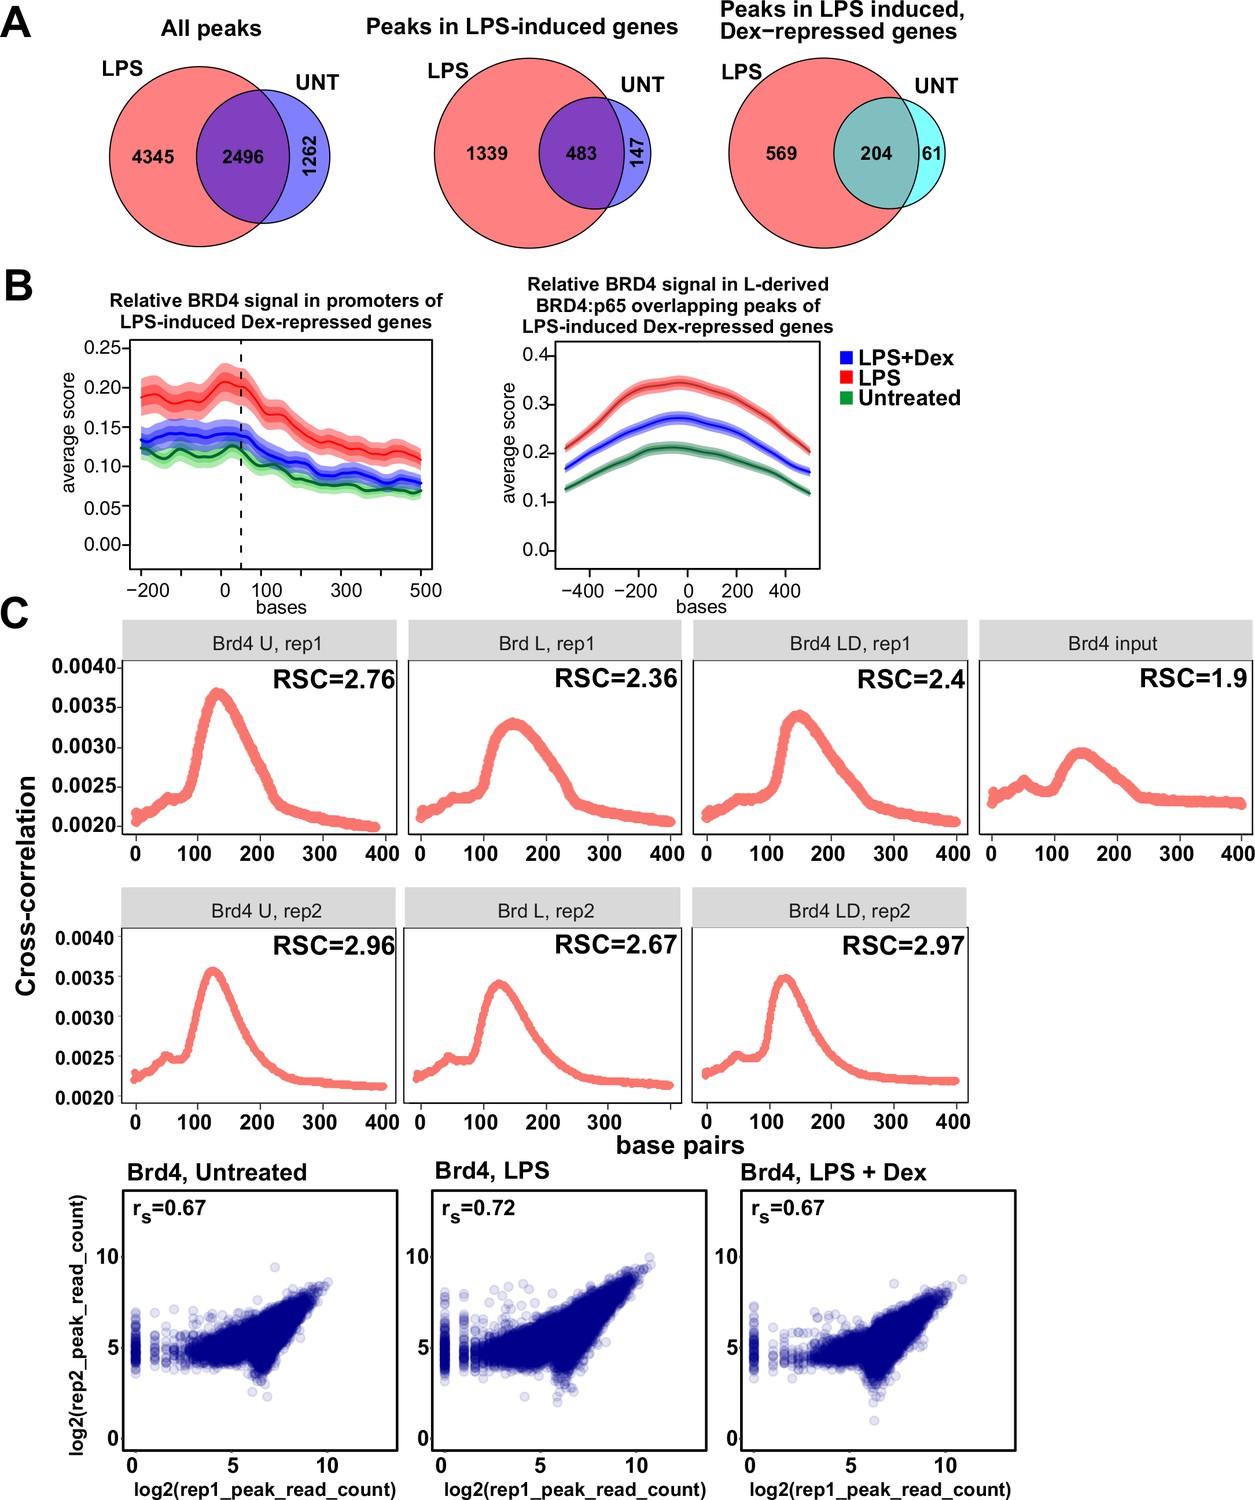
(A) Venn diagram comparisons of BRD4 peak numbers in LPS-treated vs. untreated BMDM in indicated groups of genes. The intersection of individual replica peak sets was constructed for each condition. (B) The average occupancy of BRD4 in each treatment condition at the LPS-induced Dex-repressed genes’ (left) promoters and (right) L-derived BRD4:p65 overlapping peaks. The occupancy profiles showing the mean score were calculated using genomation package. The band surrounding the mean score distribution shows SEM and 95% confidence interval for the mean. (C) Cross-correlation plots for BRD4 ChIP-seq datasets generated in this study. Relative strand cross-correlations were calculated using CLC BIO Genomics Workbench. Read counts were determined for each peak in condition-specific peak union sets; a plot of log transformed per peak read counts for Brd4 replicas is shown for each treatment condition; rs - Spearman’s correlation between replicas.
Figure 5
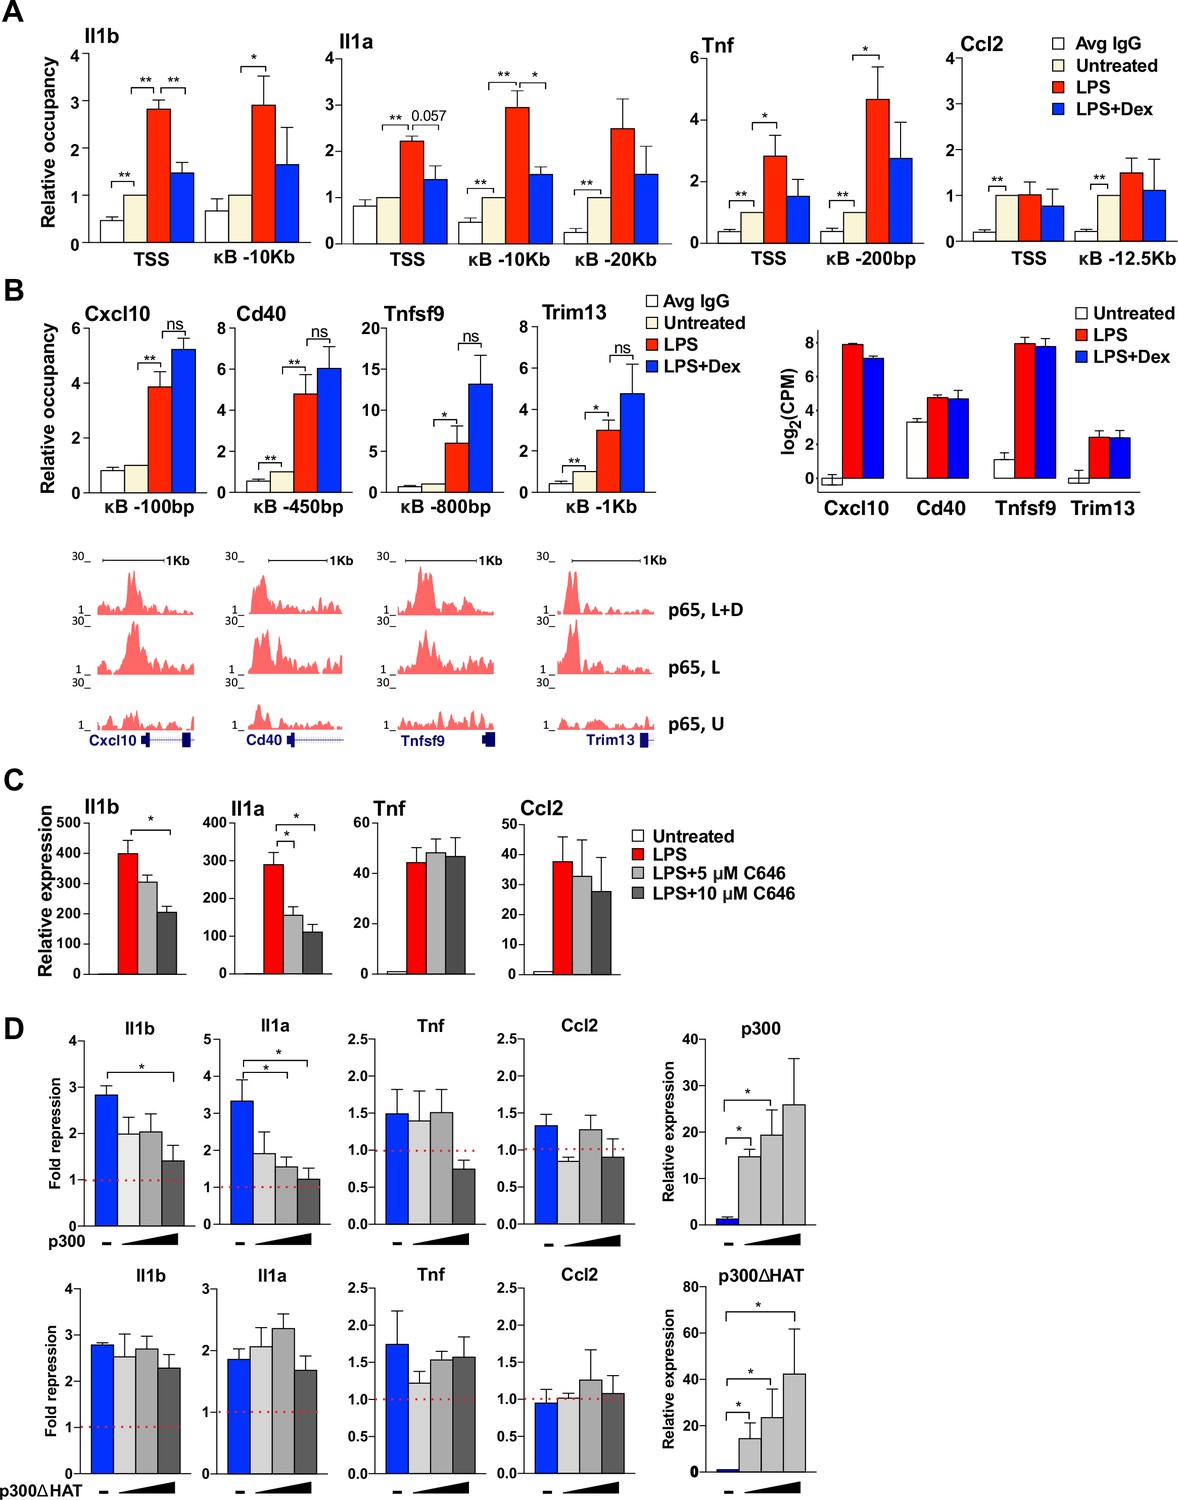
GR-mediated repression of non-paused genes is associated with the diminished p300 function.
(A) p300 occupancy at indicated kB-binding sites is evaluated as in Figure 4C (n ≥ 3). (B) p300 occupancy at indicated kB binding sites is evaluated as in A (n ≥ 3; top panel). p65 ChIP-seq read density distribution in U-, L- or L + D-treated BMDM for corresponding kB-binding sites is shown (bottom panel). Expression level (log(CPM) values) for LPS-induced Dex-insensitive genes as determined by RNA-seq in Figure 1A for the WT BMDM (untreated, LPS 1 hr, L + D 1 hr, n = 2, right panel). (C) BMDM were treated with LPS for 30 min followed by addition of 5 μM or 10 μM C646 for another 1 hr. The expression of indicated genes was assessed as described in Figure 4B (n ≥ 3). (D) RAW264.7 cells were transfected with increasing amounts of pcDNA3-p300 or pcDNA3-p300(ΔHAT) (0, 50, 100 and 150 ng/well) as described in Materials and methods. Cells were treated with 100 ng/ml LPS ±100 nM Dex for 1 hr. Gene expression was analyzed as described in Figure 3C (n ≥ 3).
-
Figure 5—source data 1
Source raw data for Figure 5A-B (p300 ChIP-qPCR) and 5C-D (RT-qPCR).
- https://doi.org/10.7554/eLife.34864.015
Author response image 1

GR DNA-binding mutants are competent for repression at NF-κB GR-tethering sites.
U2OS cells were transfected with hGR (WT, C421G or K442E)-expressing or empty EF.CMV.RFP vector (a, left) using Lipofectamine 3000 (ThermoFisher) and treated the next day with vehicle (Veh), 100 nM Dex, 5 ng/ml TNF or TNF+Dex, as indicated. (a) Gene expression of GR-activated IGFBP1 and GILZ (middle) or GR-repressed TNF and IL8 (right) following 2 h treatment was assessed by RT-qPCR with b-Actin as housekeeping control. IGFBP1 (n=5) and GILZ (n=4) fold induction by Dex is expressed over transcript level in veh-treated cells (=1). TNF and IL8 expression (n=3 each) is calculated relative to the transcript level in TNF-treated cells (=1). (b) ChIP with polyclonal antiGR Abs (PA1-511A ThermoFisher) was performed following 2-h Dex (left) or 1-h TNF or TNF+Dex (right) treatment, and GR occupancy was assessed at GREs and NF-κB sites at indicated genomic locations with signals at 28S ribosomal gene as normalization control (n=3). Occupancy is expressed over baseline in veh-treated cells (=1). Error bars are SEM; 2-tailed Student’s t-test.
Additional files
-
Supplementary file 1
Summary of RNA-seq data for LPS-induced Dex-repressed genes.
- https://doi.org/10.7554/eLife.34864.016
-
Supplementary file 2
Summary of ChIP-seq experiments.
- https://doi.org/10.7554/eLife.34864.017
-
Supplementary file 3
Pausing Indexes for LPS-induced Dex-repressed transcripts.
- https://doi.org/10.7554/eLife.34864.018
-
Supplementary file 4
Primer pairs used in the study.
- https://doi.org/10.7554/eLife.34864.019
-
Transparent reporting form
- https://doi.org/10.7554/eLife.34864.020
Download links
A two-part list of links to download the article, or parts of the article, in various formats.
Downloads (link to download the article as PDF)
Open citations (links to open the citations from this article in various online reference manager services)
Cite this article (links to download the citations from this article in formats compatible with various reference manager tools)
Gene-specific mechanisms direct glucocorticoid-receptor-driven repression of inflammatory response genes in macrophages
eLife 7:e34864.
https://doi.org/10.7554/eLife.34864


