Chronic 2P-STED imaging reveals high turnover of dendritic spines in the hippocampus in vivo
- CNRS UMR 5297, France
- University of Bordeaux, France
- German Center for Neurodegenerative Diseases, Germany
Figures
Figure 1 with 3 supplements
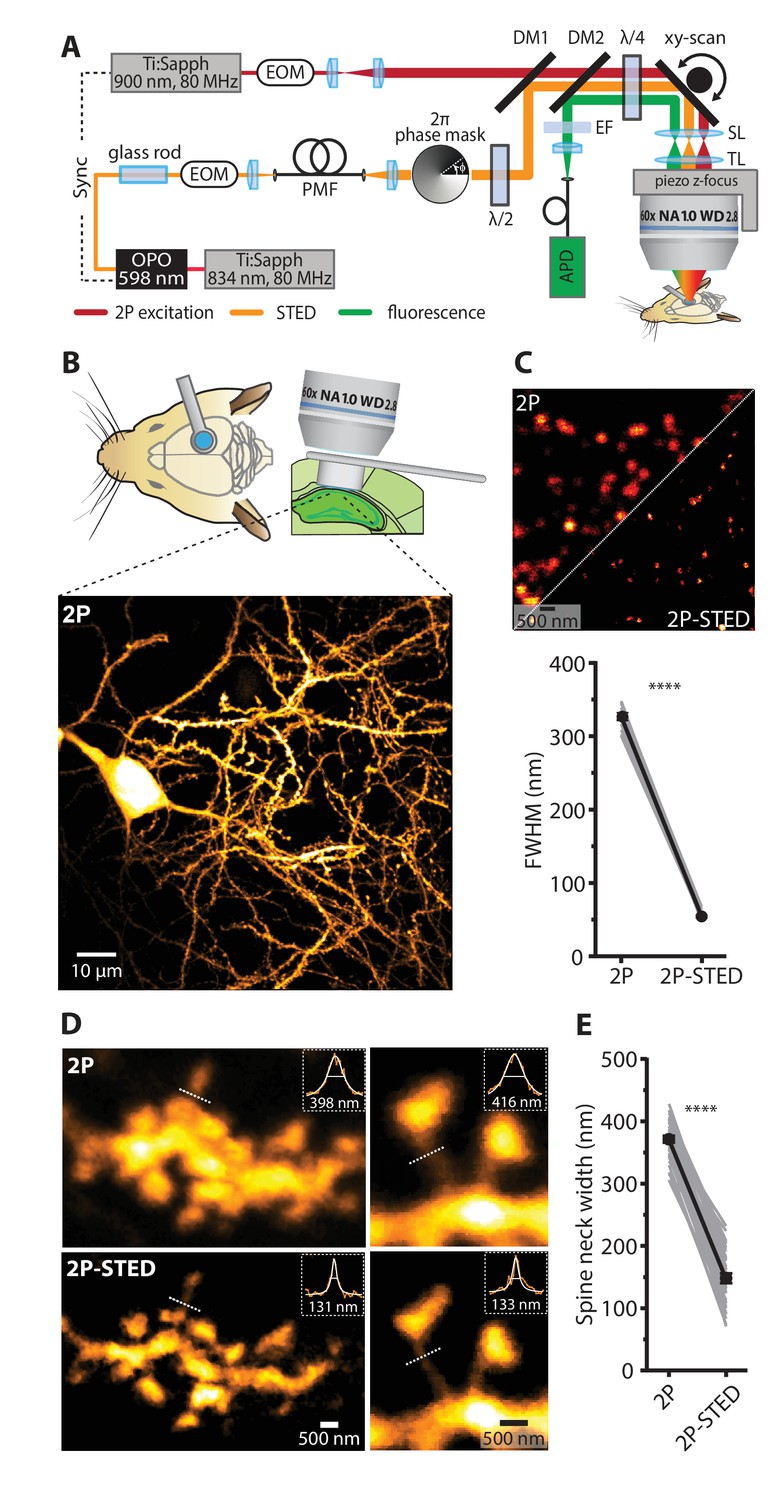
2P- STED microscopy of dendritic spines in the hippocampus in vivo.
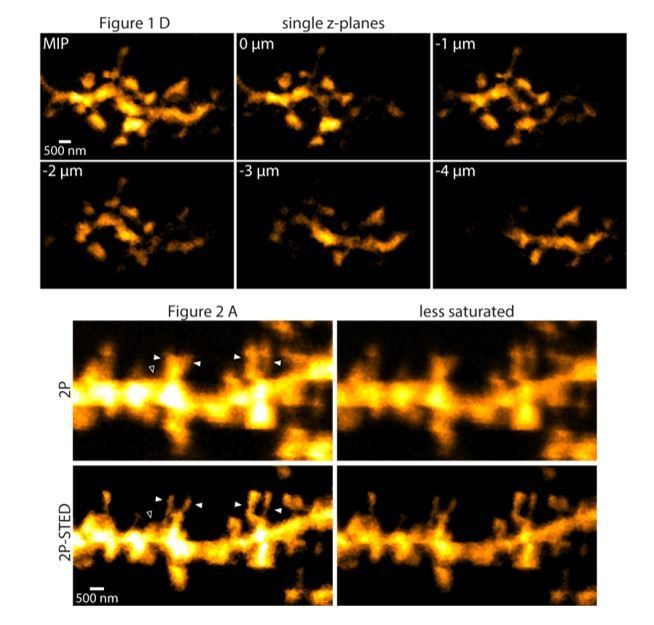
(A) Schematic of the custom-built upright 2P-STED microscope. A Ti:Sapphire laser emits light pulses at 834 nm with 80 MHz repetition rate. The laser pumps an optical parametric oscillator (OPO) to obtain pulsed STED light at 598 nm. A glass rod and a polarization-maintaining fiber (PMF) stretch the STED pulses. The STED doughnut is engineered by a helical 2π phase mask in combination with λ/2 and λ/4 wave plates. The second Ti:Sapphire laser tuned to 900 nm with 80 MHz repetition rate served for two-photon (2P) excitation and is synchronized to the STED light pulses. The 2P and STED beam are combined using a dichroic mirror (DM1). Both beams are swept over the specimen using a galvo-based x-y scanner and a z-focusing device. Scan (SL) and tube lens (TL) image the scan mirrors into the back focal plane of the objective and ensure that the expanded laser beams overfill the back aperture of the objective. Fluorescence is de-scanned and guided to the avalanche photodiode (APD) via a dichroic mirror (DM2) and filters (EF). Electro-optical modulators (EOM) serve for quick adjustments of the beam intensity. (B) Schematic visualizing the combined use of the hippocampal window preparation and a long working distance objective (top). A 2P overview image showing the cell body and basal dendrites of a GFP-labeled pyramidal neuron in hippocampal CA1 in vivo (bottom). Maximum intensity projection (MIP) of ten z-sections with 2 µm z-steps. (C) Quantification of the lateral resolution with 40 nm fluorescent nanospheres. Upper panel: Representative comparison of 40 nm beads imaged by 2P and 2P-STED microscopy. Lower panel: Paired comparison of mean full-width at half maximum (FWHM) of line profiles obtained from 40 nm nanospheres (p<0.0001, paired t-test; n = 17 beads). (D) Representative images obtained from a GFP-labeled dendrite acquired by 2P and 2P-STED microscopy. Insets show line profiles fitted with Lorentzian functions and FWHM values obtained from the indicated dotted lines of the spine neck (MIP of three z-sections). (E) Paired measurements of spine neck widths imaged in 2P and 2P-STED mode (p<0.0001, paired t-test; n = 29 spine necks, 11 dendrites, 6 mice).
-
Figure 1—source data 1
Data for panel C.
- https://doi.org/10.7554/eLife.34700.006
-
Figure 1—source data 2
Data for panel B.
- https://doi.org/10.7554/eLife.34700.007
-
Figure 1—source data 3
Data for Figure 1—figure supplement 1.
- https://doi.org/10.7554/eLife.34700.008
Figure 1—figure supplement 1
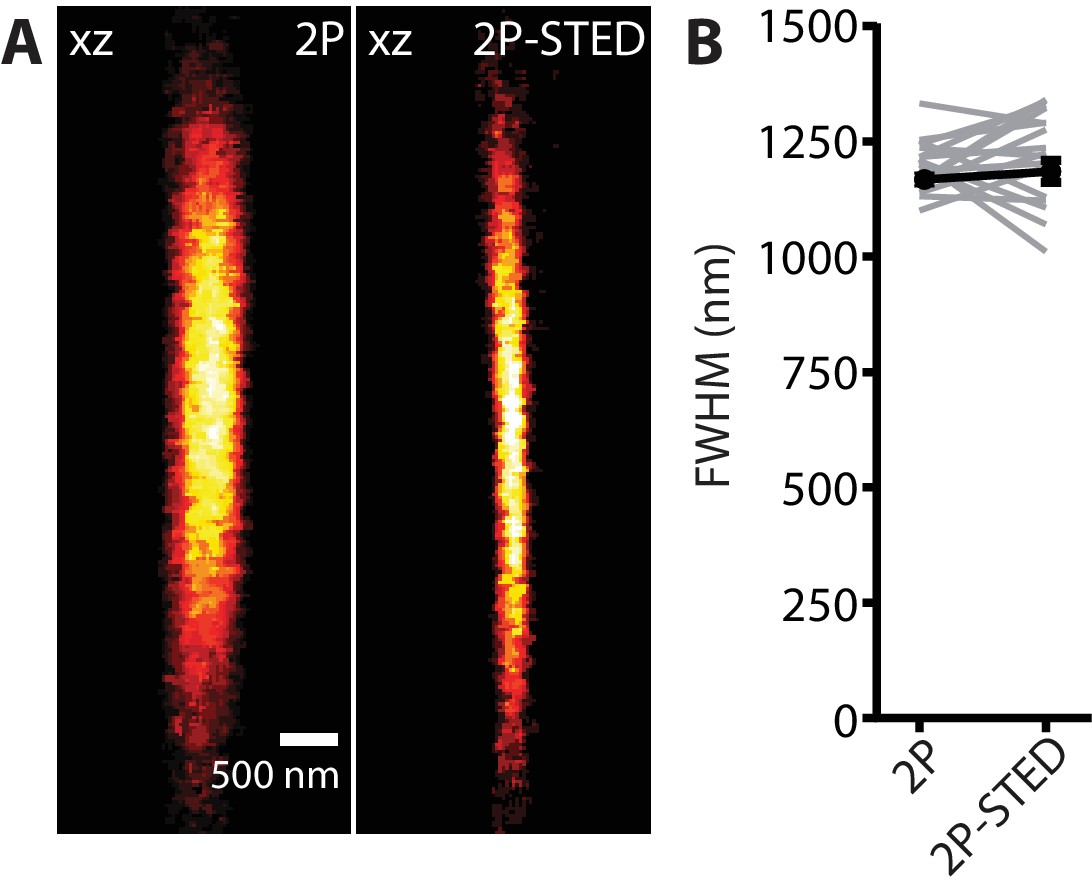
Axial PSF measurement: 2P versus 2P-STED.
(A) 2P and 2P-STED axial PSF. Scale bar: 500 nm. (B) FWHM of the axial PSF measured on 170 nm fluorescent beads in 2P (1200 ± 14 nm) and 2P-STED (1218 ± 24 nm) modes (n = 17 beads; paired t-test; p=0.52).
Figure 1—figure supplement 2

Measurements of spine neck diameters and direct comparison of 2P versus 2P-STED.
(A) 2P-STED image of a dendritic stretch with intensity profiles (orange), Lorentzian fit (white) and FWHM measurements (white horizontal line). Two-pixel line profiles were taken on single sections at the locations indicated by the white dotted lines (for illustrative purposes). FWHM values indicate that 2P-STED microscopy allows for sub-diffraction imaging in the hippocampus in vivo . MIP of three z-sections of a GFP-labeled basal dendrite imaged ~10–15 µm below the coverslip. (B, C, D) Dendrites imaged consecutively in 2P and 2P-STED mode showing the improvement in lateral resolution. MIP of three z-sections.
Figure 1—video 1
Hippocampal window approach afforded high level of sample stability.
The hippocampal window preparation offers excellent tissue stability for imaging in the hippocampus of the anesthetized mouse. The 2P image z-stack (100 × 100 × 60 µm3; 200 nm pixel size; 2 µm z-steps) illustrates the virtual absence of motion artifacts, which would impede the acquisition of super-resolved STED images.
Figure 2 with 2 supplements
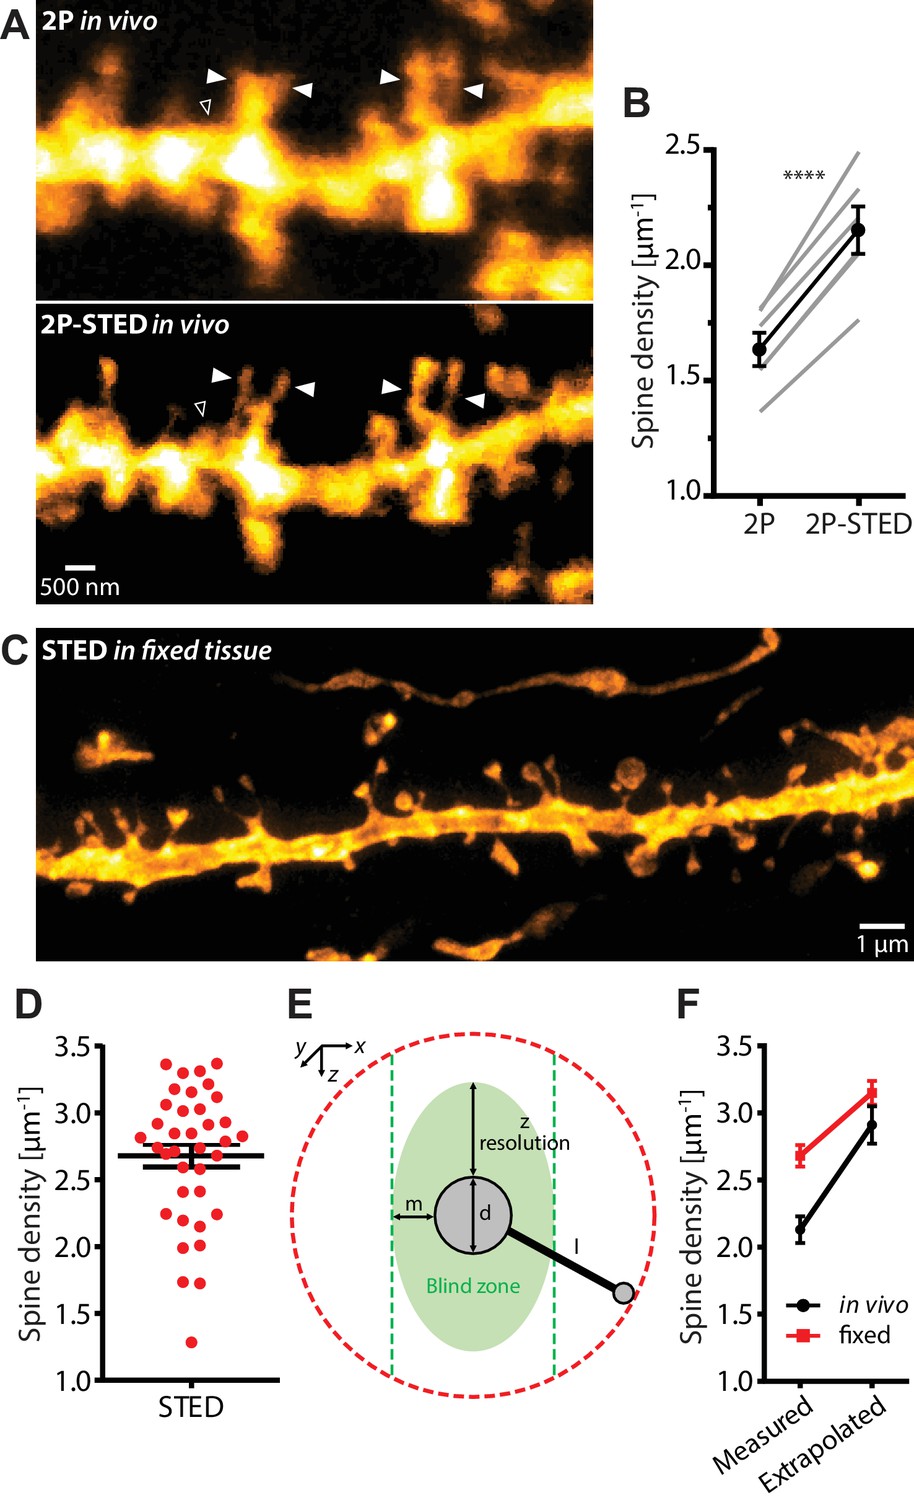
Density of spines on basal dendrites of CA1 pyramidal neurons in vivo.
(A) CA1 basal dendrite imaged with 2P (top) or 2P-STED (bottom) microscopy. Filled arrowheads highlight spines discerned in 2P-STED, but not 2P mode. Open arrowheads indicate spines that could only be visualized in 2P-STED mode as they were otherwise masked by the blurry fluorescence of the dendrite in the 2P image (MIP of two z-sections). (B) Measured spine densities in consecutive 2P and 2P-STED acquisitions of the same dendrites (p<0.0001, paired t-test; n = 82 basal dendrites, 6 mice). (C) Image of a basal dendrite obtained from fixed brain tissue acquired on a confocal STED. (D) Dendritic spine density on basal dendrites in fixed hippocampal tissue (n = 37 basal dendrites, 6 mice). (E) Geometric model to extrapolate the spine density in 3D. Spines cannot be detected when they are inside the ‘blind zone’, depending on the dimensions of the morphology and microscope PSF. (F) Extrapolation of spine density in 3D following the model in (E) for in vivo (black line) and fixed tissue measurements (red line).
-
Figure 2—source data 1
Data for panel B.
- https://doi.org/10.7554/eLife.34700.012
-
Figure 2—source data 2
Data for panel D.
- https://doi.org/10.7554/eLife.34700.013
Figure 2—figure supplement 1
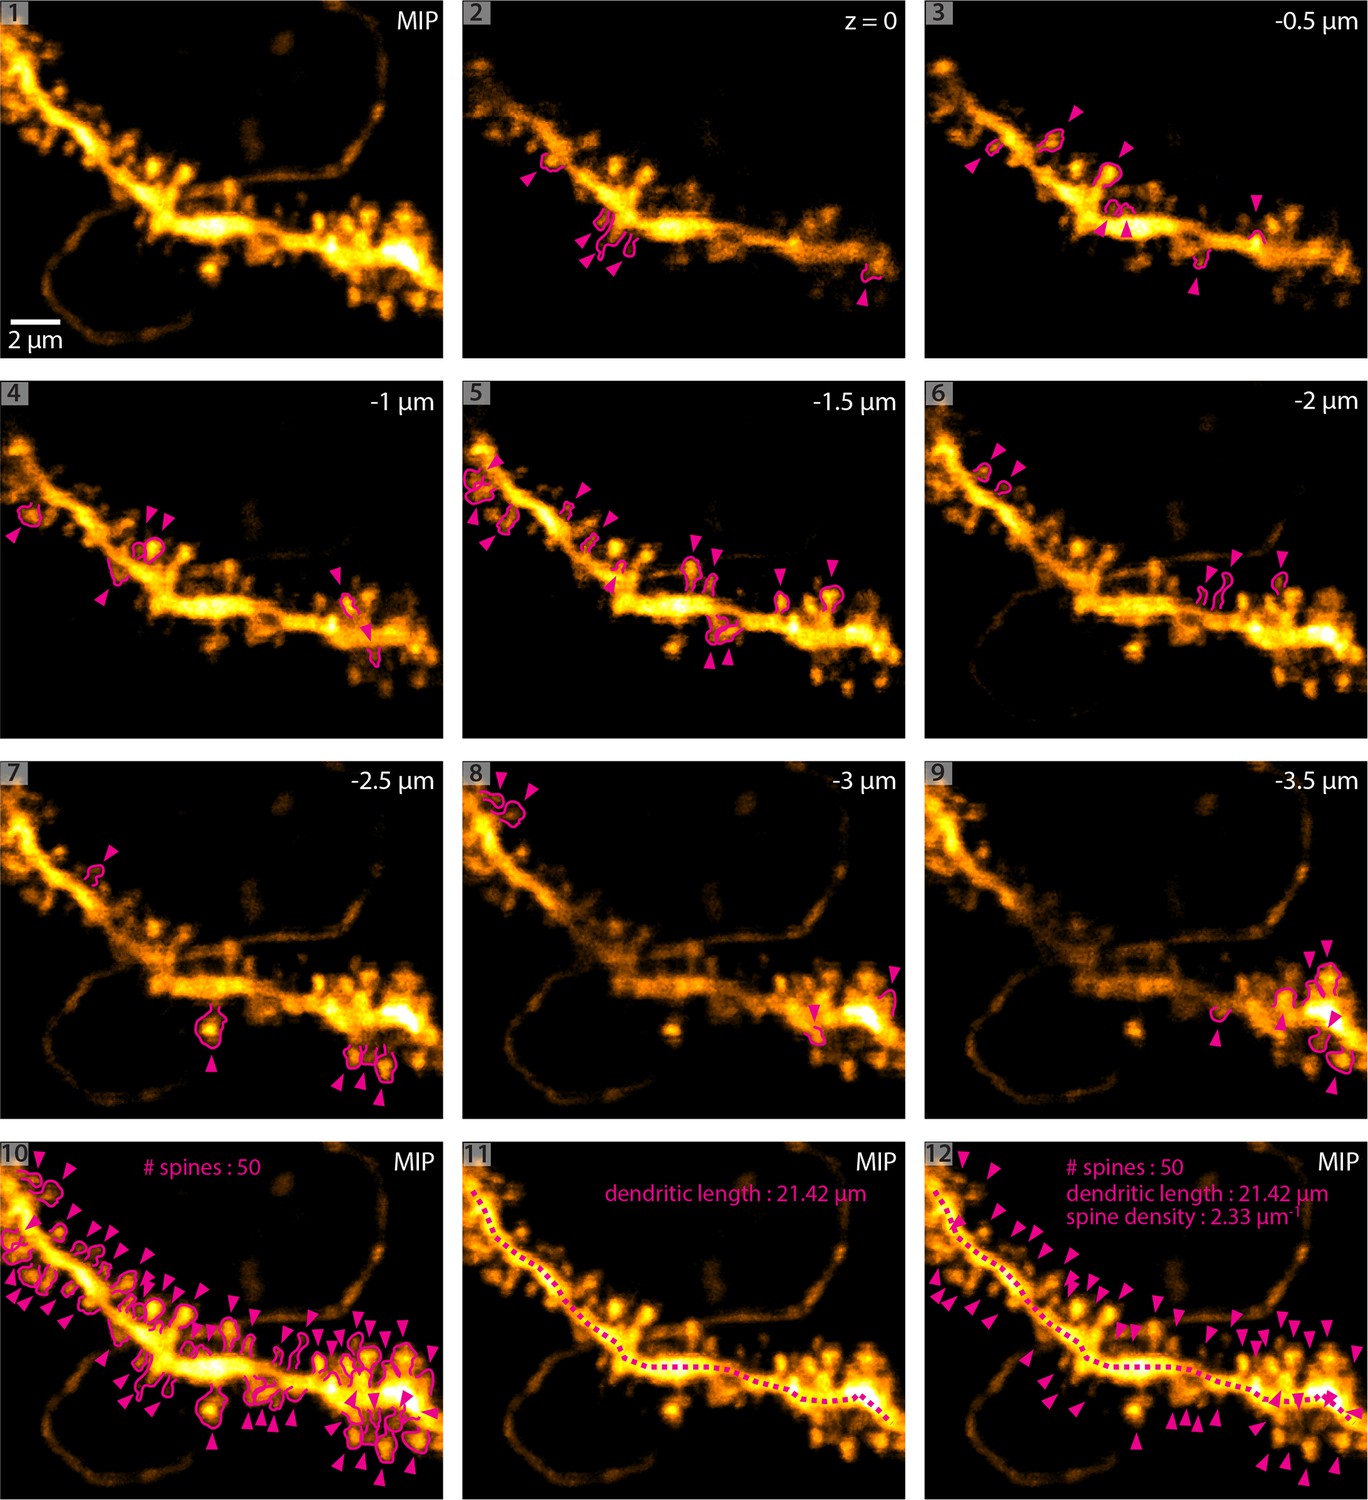
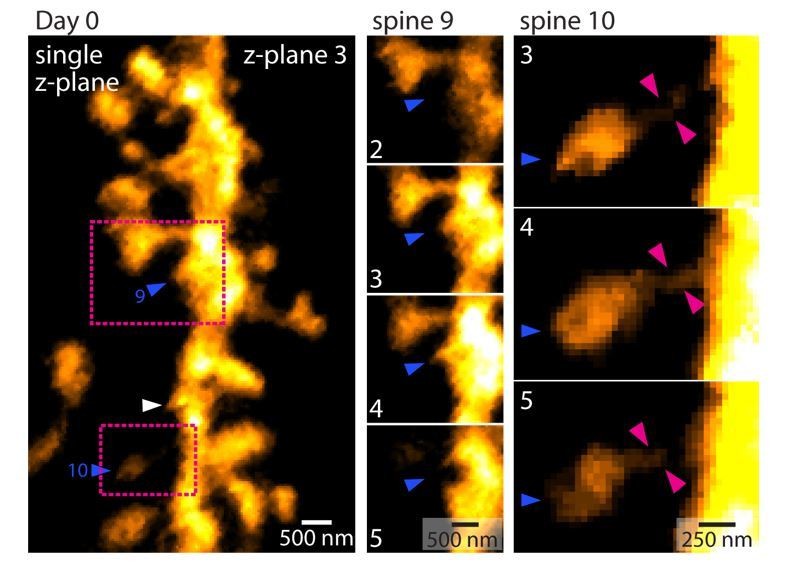
Methodology of dendritic spine density analysis in vivo.
(1) MIP of a basal dendrite acquired using 2P-STED in vivo. (2 - 9) Identification of dendritic spines in single z-planes. Magenta arrowheads indicate spines and magenta outlines highlight the spine shape. (10) Maximum intensity projection (MIP) of identified spines. (11) Measurement of dendritic length. (12) Overlay of (10) and (11) and analysis of spine density.
Figure 2—video 1
z-stack of a fixed dendrite imaged with one-photon STED microscopy.
STED z-stack of a fixed basal dendrite of CA1 pyramidal neuron acquired on commercial one-photon STED microscope (20 nm pixel size, 200 nm z-steps).
Figure 3 with 2 supplements
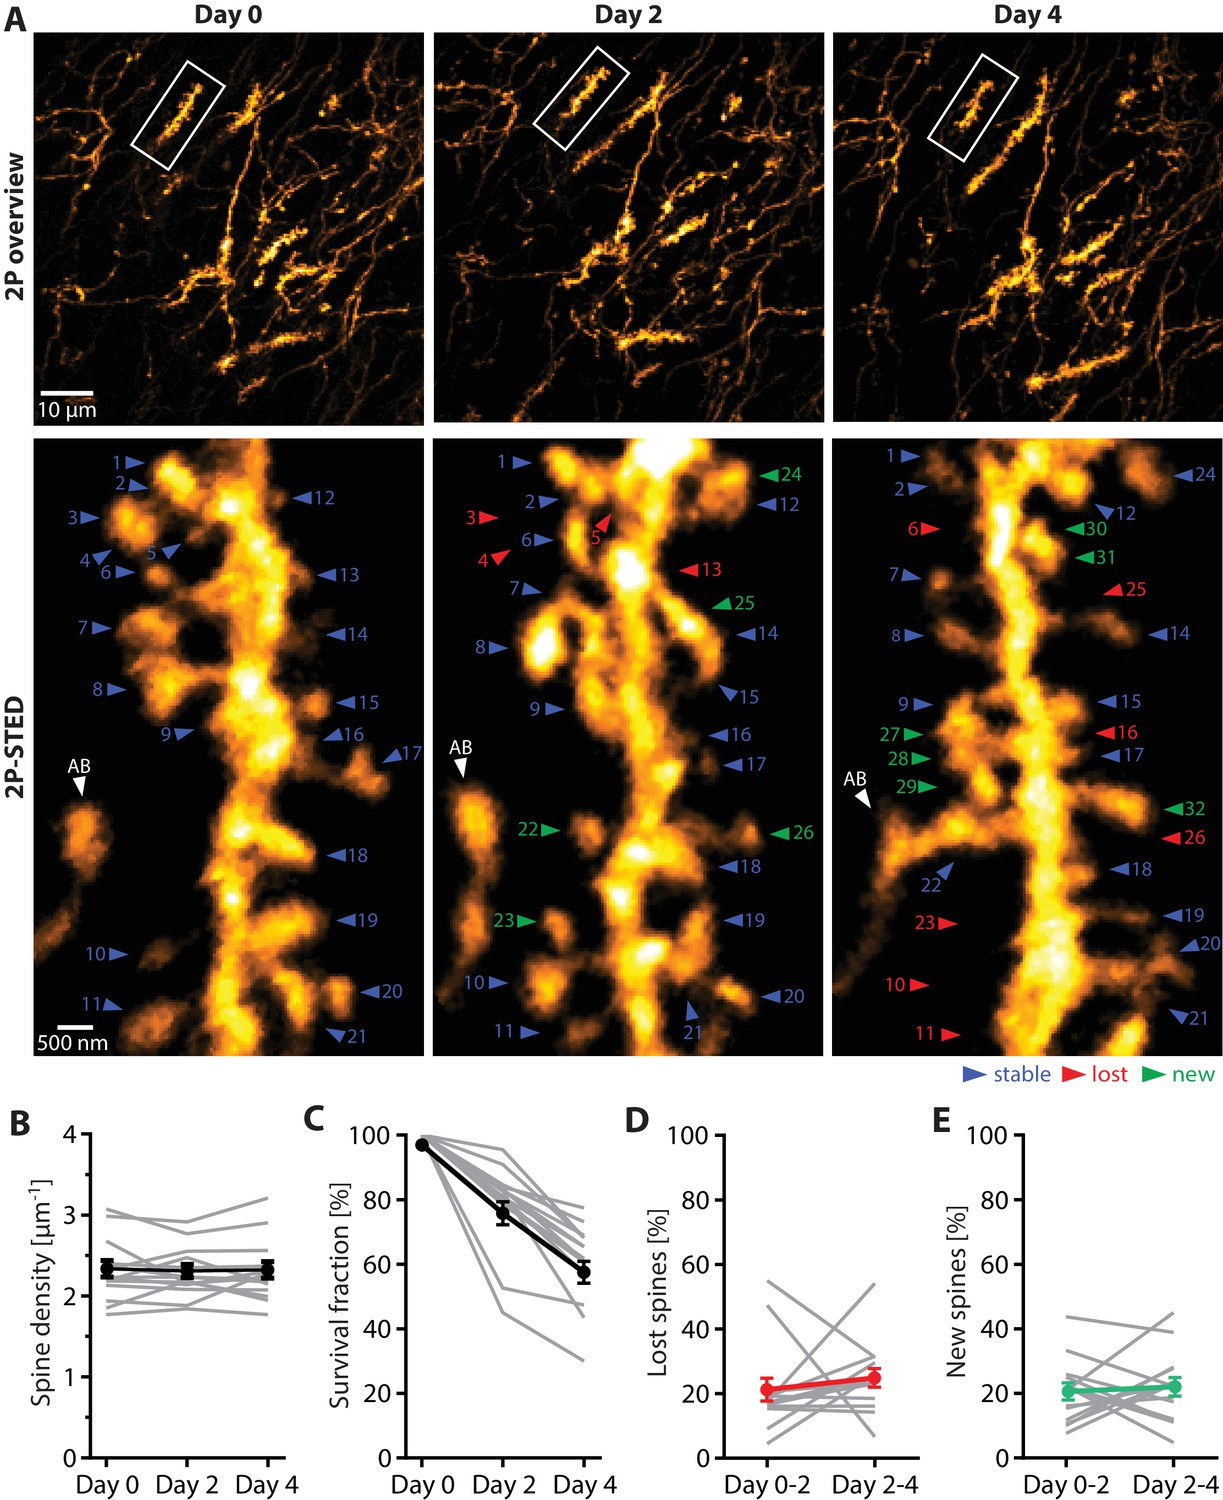
Turnover of spines on basal dendrites of CA1 pyramidal neurons in vivo.
(A) Repetitive imaging of basal dendrites in CA1 area using 2P-STED microscopy. The upper panel shows low-magnification overviews containing the dendrite of interest highlighted with a white box. The lower panel shows the corresponding 2P-STED images of the dendrite over time. The images represent single z-planes. Dendritic spines with blue arrowheads were stable between imaging sessions. Red arrowheads mark lost spines, and green arrowheads mark new ones. The axonal bouton (AB) is marked by a white arrowhead. The numbering of spines is continuous. (B) Quantification of spine density over 4 days (n = 14 dendrites, 3 mice). (C) Quantification of the 4-day survival fraction of dendritic spines. (D) Fraction of lost spines and (E) fraction of new spines. Thin grey lines represent the measurements of single dendrites.
-
Figure 3—source data 1
Source data of the parameters underlying Figure 3 extracted from the turnover data set.
- https://doi.org/10.7554/eLife.34700.017
-
Figure 3—source data 2
- https://doi.org/10.7554/eLife.34700.018
-
Figure 3—source data 3
Data for Figure 3—figure supplement 1.
- https://doi.org/10.7554/eLife.34700.019
Figure 3—figure supplement 1
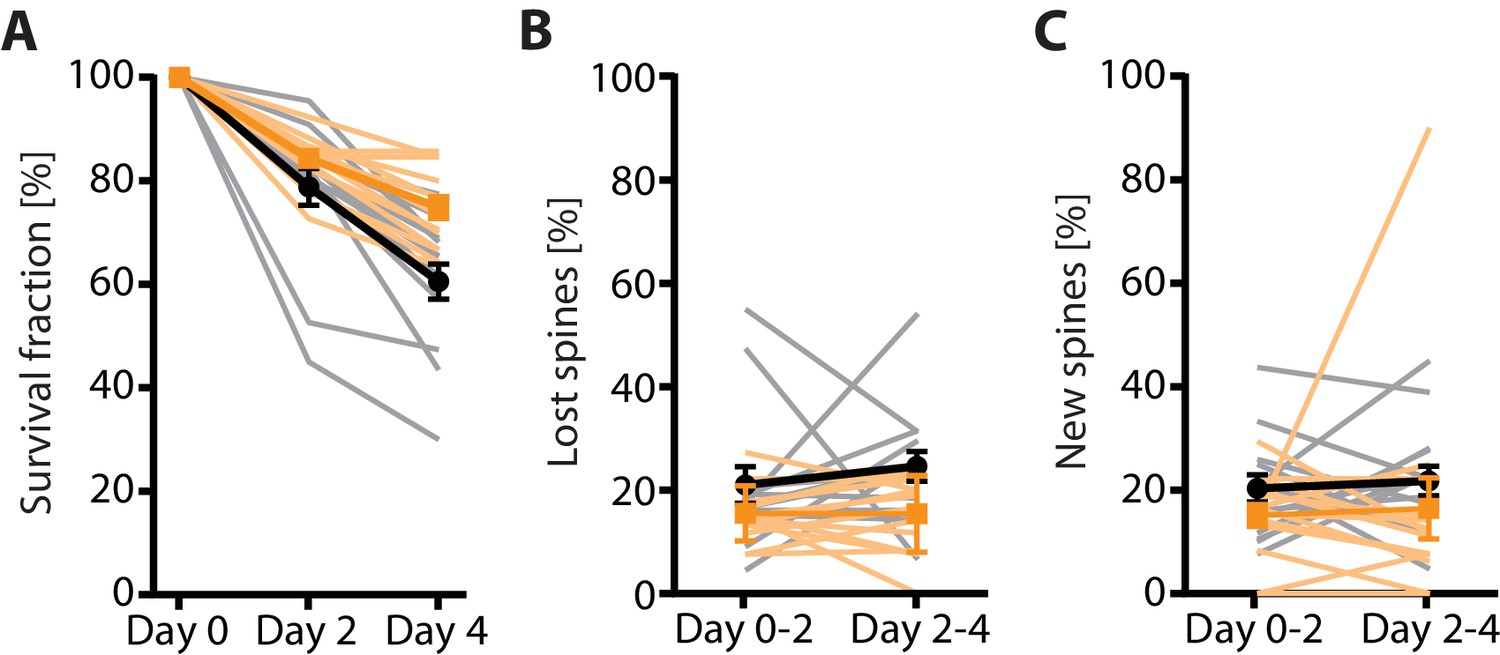
2P vs 2P-STED measurement of spine turnover in vivo.
(A) Quantification of the 4-day survival fraction in 2P and 2P-STED (n = 14 dendrites, 3 mice). (B) Fraction of lost spines and (C) fraction of new spines in 2P and 2P-STED (n = 14 dendrites, 3 mice). Thin grey lines represent the measurement of single dendrites. In all panels, orange and black lines represent 2P and 2P-STED, respectively.
Figure 3—figure supplement 2
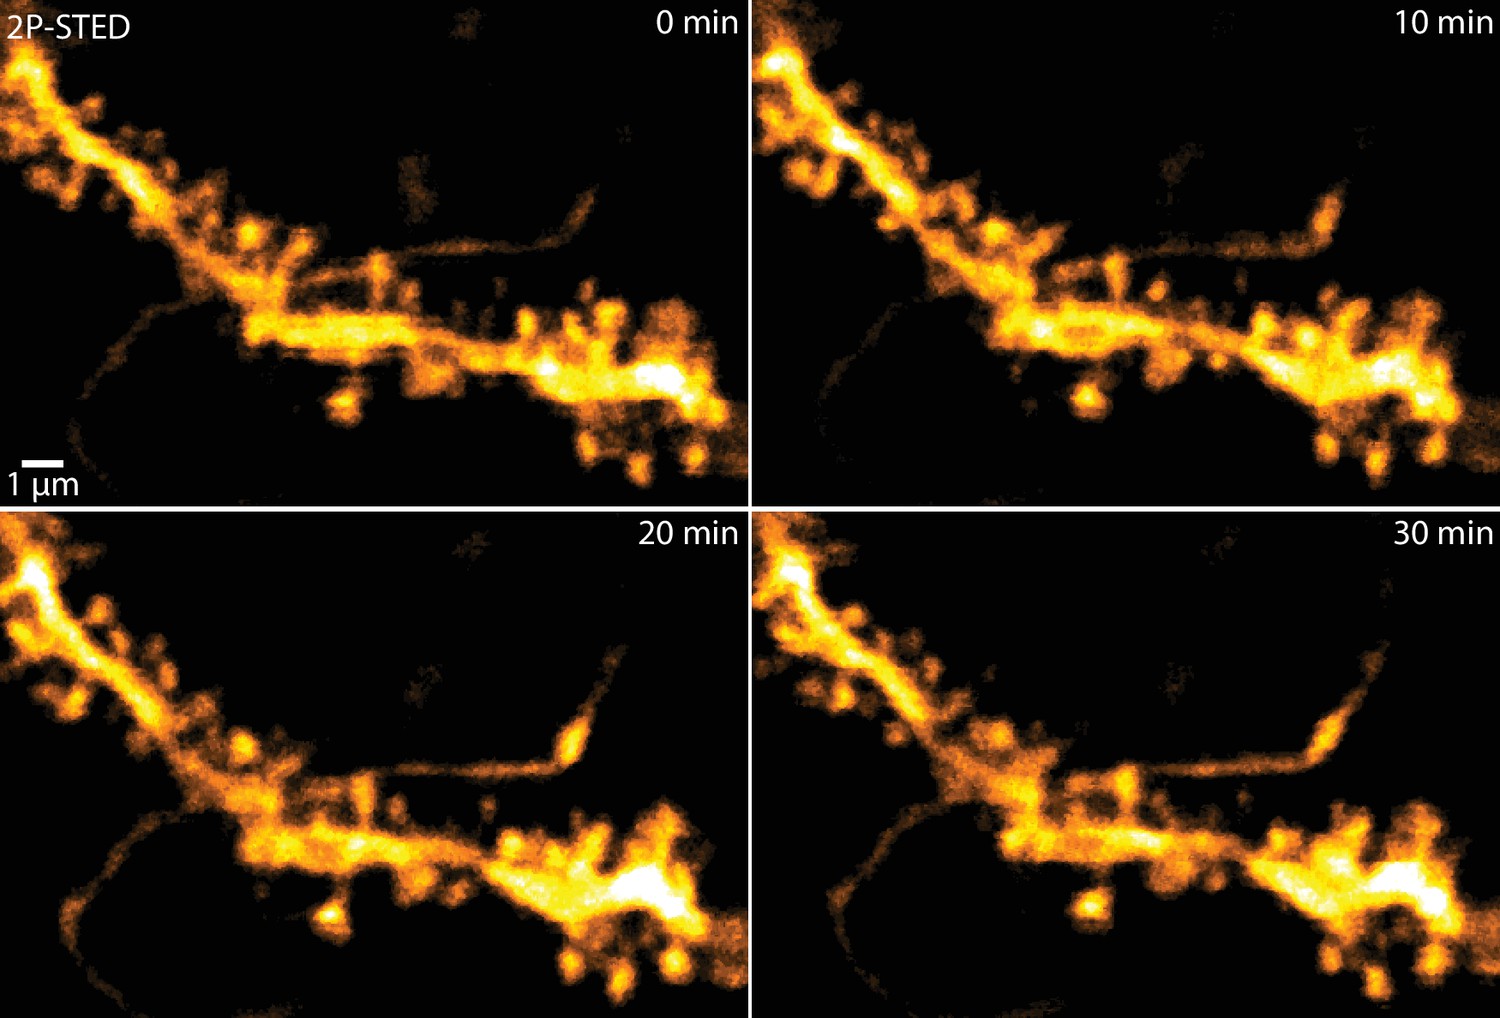
2P-STED time-lapse imaging of hippocampal dendrites in vivo.
2P-STED could be used for time-lapse imaging of hippocampal dendrites as bleaching of the volume-filling fluorophore was negligible and no apparent phototoxicity was induced. MIP of three z-sections of a YFP-labeled dendrite imaged every 10 min.
Figure 4 with 1 supplement
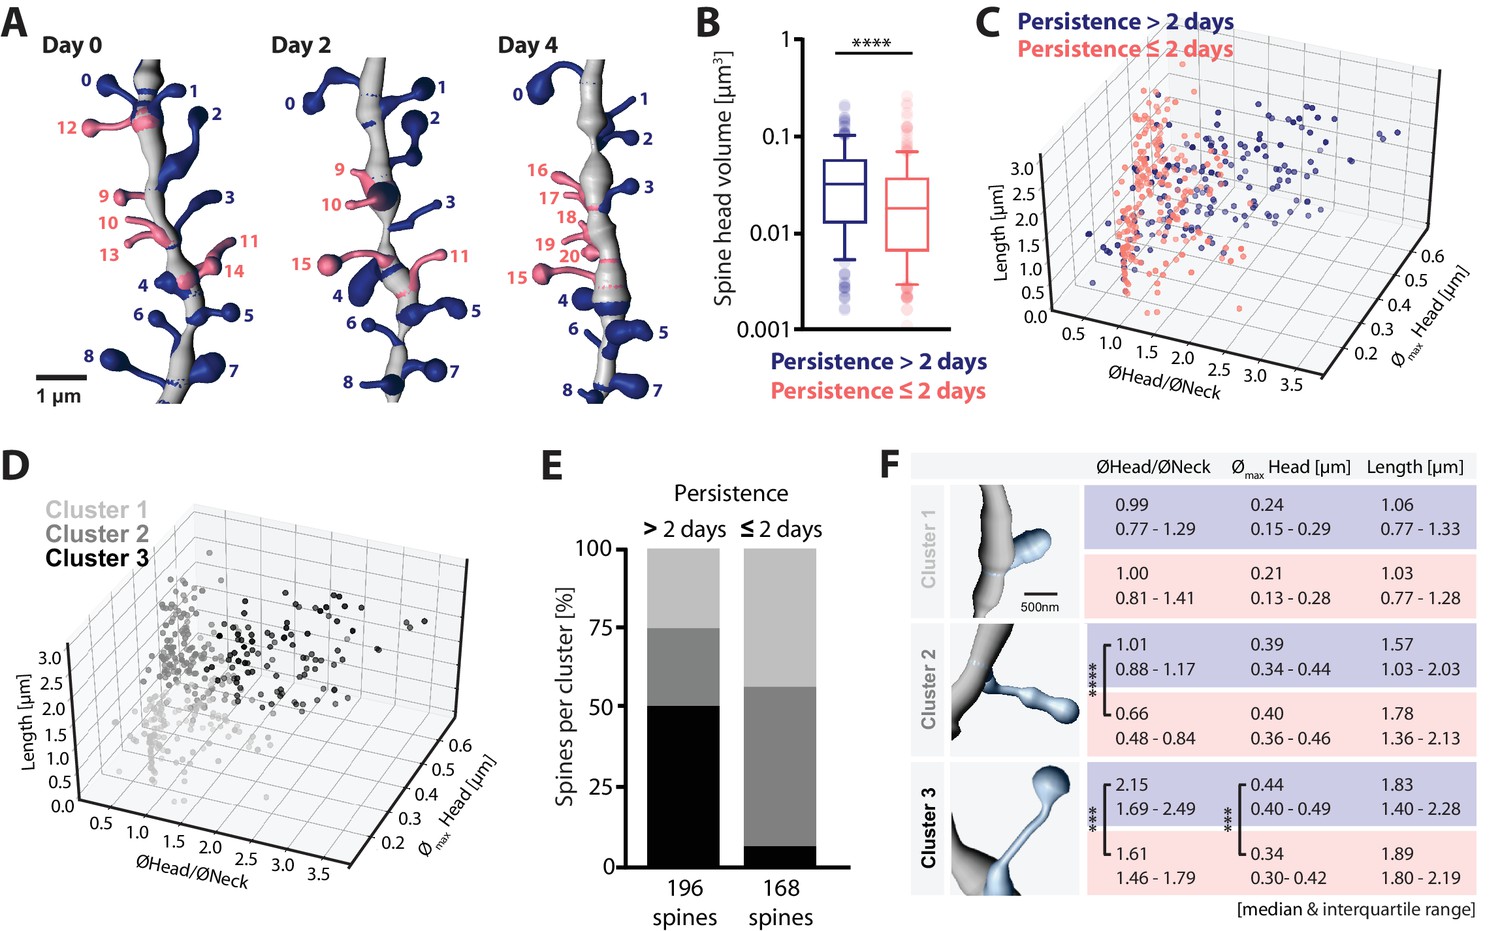
Structure-dynamics relationship of hippocampal spines.
(A) 3D reconstruction of a dendrite imaged on days 0, 2 and 4. Spines persisting for more than 2 days (#0–8, blue), and 2 days or less (#9–20, salmon) are illustrated. (B) Spine head volumes measured on reconstructed dendrites (p<0.0001, Mann-Whitney test; n = 14 dendrites, 3 mice; box plot shows median and 10, 25, 75 and 90th percentiles). (C, D) 3D morphology plots visualizing the populations of spines observed persistent for more than 2 days and 2 days or less (C), and their affiliation to identified clusters 1, 2 and 3 (D) (see also Figure 4—figure supplement 1A). Plotted are, the ratio of mean head to neck diameters (ØHead/ØNeck), spine length and maximum head diameter (Ømax Head). (E) Quantification of spine proportions within identified clusters, distinguishing spines of different persistence (>2 days versus ≤2 days). (F) Table summarizing the morphological parameters utilized for cluster analysis: ØHead/ØNeck, Ømax Head and length of spines, for spines that persist for >2 days (blue) and ≤2 days (salmon). Data are represented as median and interquartile range (25th–75th percentile). Significant differences are marked by asterisks (***p<0.001, ****p<0.0001, unpaired t-test or Mann-Whitney test; for all comparisons see Figure 4—figure supplement 1B; n = 14 dendrites, 3 mice).
-
Figure 4—source data 1
Underlying data for Figure 4.
- https://doi.org/10.7554/eLife.34700.022
Figure 4—figure supplement 1
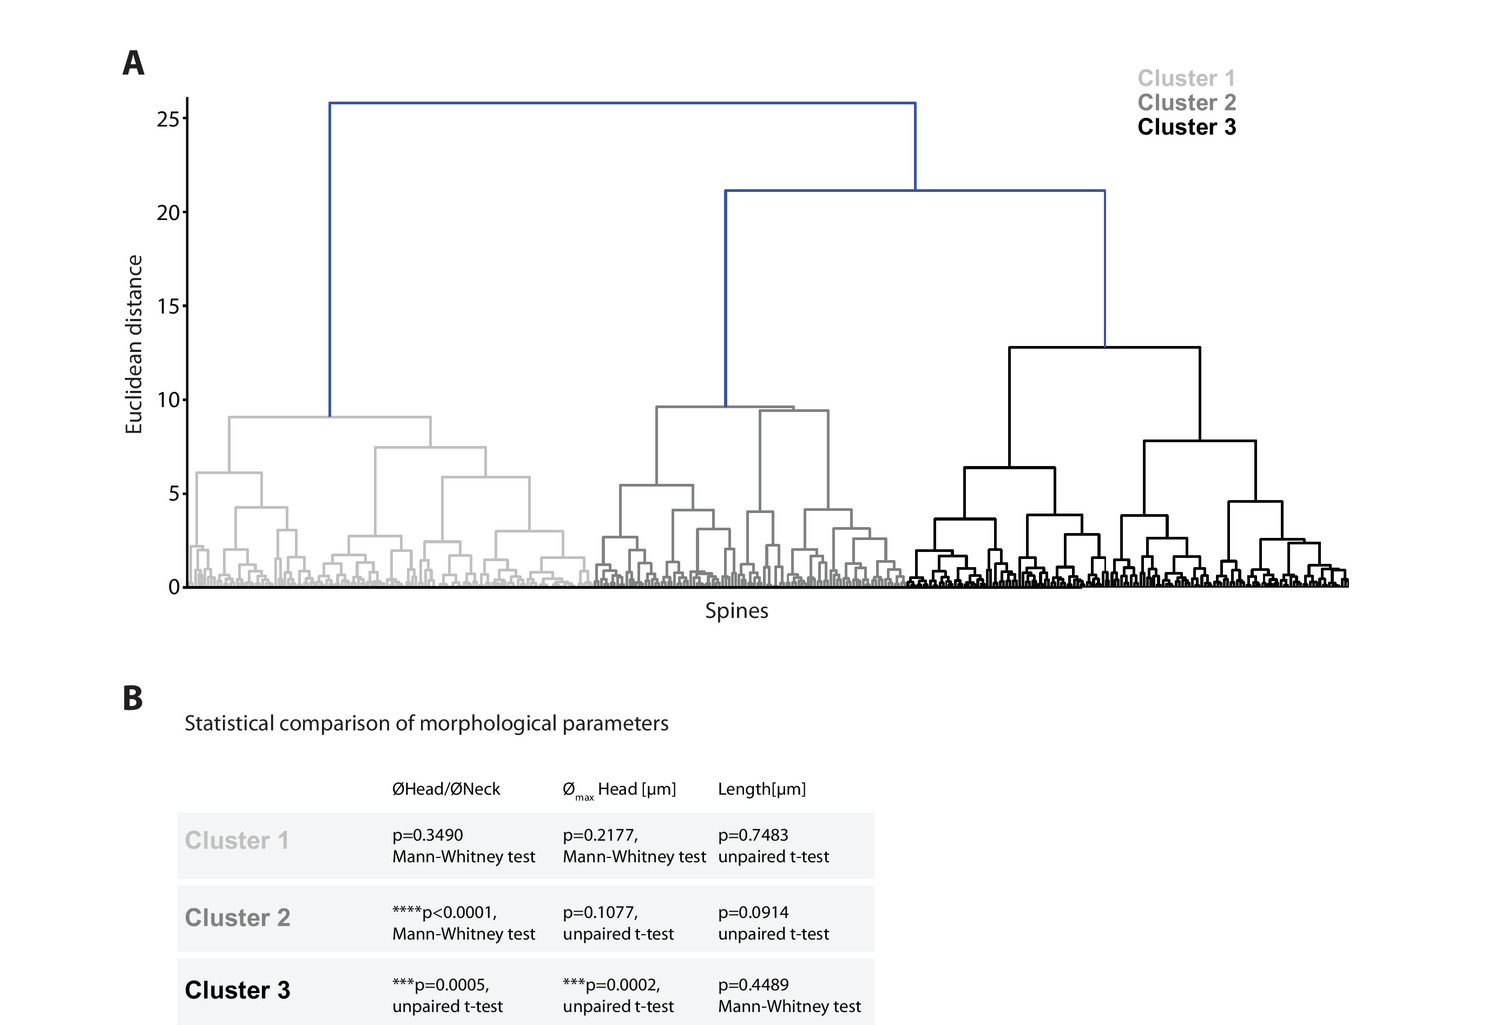
Cluster analysis of spine morphology.
(A) Dendrogram displaying the Euclidean distances of individual spines and their respective assignment to one of the three identified clusters. (B) Statistical comparison of morphological parameters between spines of different observed persistence (>2 days versus ≤2 days; n = 14 dendrites, 3 mice).
Author response image 1

Author response image 2
Author response image 3
Additional files
-
Transparent reporting form
- https://doi.org/10.7554/eLife.34700.023
Download links
A two-part list of links to download the article, or parts of the article, in various formats.
Downloads (link to download the article as PDF)
Open citations (links to open the citations from this article in various online reference manager services)
Cite this article (links to download the citations from this article in formats compatible with various reference manager tools)
Chronic 2P-STED imaging reveals high turnover of dendritic spines in the hippocampus in vivo
eLife 7:e34700.
https://doi.org/10.7554/eLife.34700


