Vibrator and PI4KIIIα govern neuroblast polarity by anchoring non-muscle myosin II
- Duke-NUS Medical School, Singapore
- Texas A&M University Health Science Center, United States
- National University of Singapore, Singapore
Figures
Figure 1 with 2 supplements
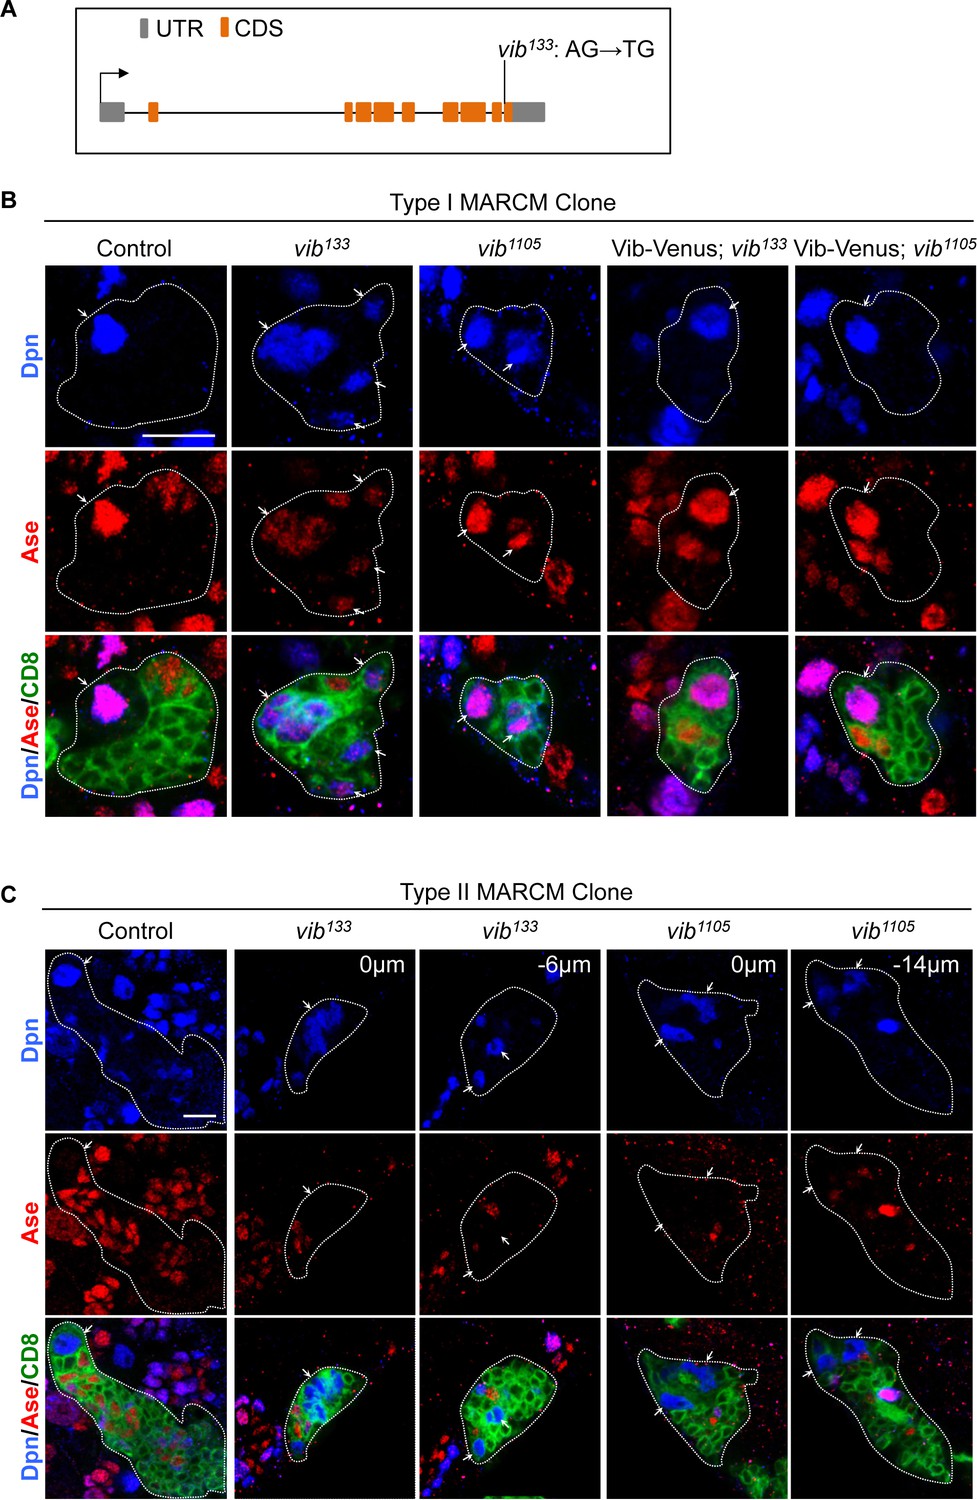
Vibrator regulates homeostasis of larval brain neuroblasts.
(A) A schematic showing the mutation in vib133 allele. (B) Type I MARCM clones of control (FRT82B), vib133, vib1105, UAS-Vib-Venus; vib133 and UAS-Vib-Venus; vib1105 were labeled with Dpn (blue), Ase (red) and CD8::GFP (green). Note that the signal of Vib-Venus in MARCM clones was masked by intense CD8::GFP signal. (C) Type II MARCM clones of control (FRT82B), vib133 and vib1105 were labeled with Dpn (blue), Ase (red) and CD8::GFP (green). Arrows indicate neuroblasts. Clones are marked by CD8::GFP and indicated by white dotted lines. Scale bars, 10 µm.
Figure 1—figure supplement 1
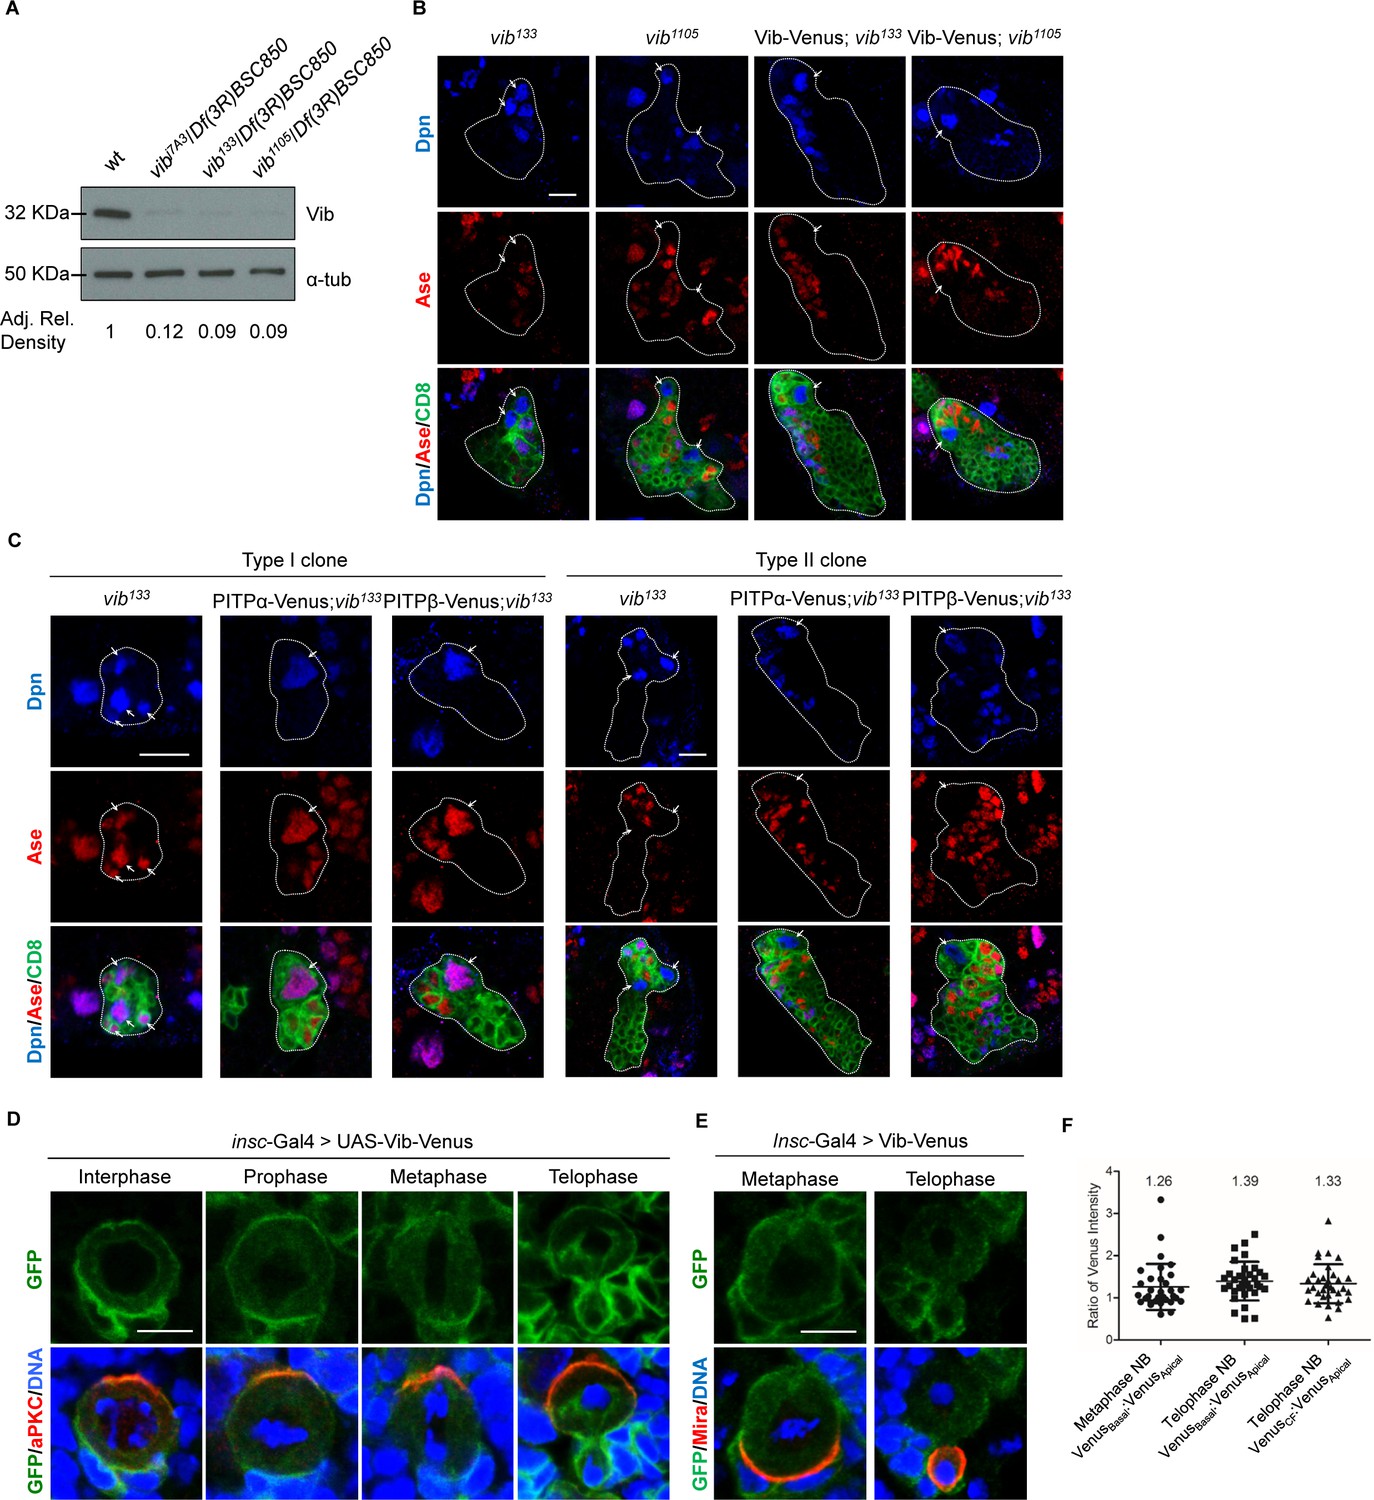
Mammalian PITPs rescue vib defects in neuroblast homeostasis.
(A) Western blot of endogenous Vib in larval brain lysate from wild-type (WT), vibj7A3/Df(3R)BSC850, vib133/Df(3R)BSC850 and vib1105/Df(3R)BSC850 hemizygotes. α-tubulin was used as a loading control. Adjusted relative density of Vib in each genotype was shown right below the blot (n = 2). (B) Type II MARCM clones of vib133, vib1105, UAS-Vib-Venus; vib133 and UAS-Vib-Venus; vib1105 were labeled with Dpn (blue), Ase (red) and CD8::GFP (green). (C) Type I and type II MARCM clones of vib133, UAS-PITPα-Venus; vib133 and UAS-PITPβ-Venus; vib133 were labeled with Dpn (blue), Ase (red) and CD8::GFP (green). Note that the signal of Vib-Venus, PITPα-Venus and PITPβ-Venus in MARCM clones is masked by CD8::GFP signal. Clones were marked by CD8::GFP and indicated by white dotted line. (D) Neuroblasts of Venus-tagged Vib driven by insc-Gal4 were labeled with GFP (green), aPKC (red) and DNA (blue). (E) Neuroblasts of Venus-tagged Vib driven by insc-Gal4 were labeled with GFP (green), Mira (red) and DNA (blue). (F) Quantification of the ratio of Venus intensity in metaphase and telophase neuroblasts in (E). VenusBasal:VenusApical represents the ratio of Venus intensity at the basal cortex compared with that of the apical cortex. VenusCF:VenusApical is the ratio of Venus intensity (at the cleavage furrow (CF) compared with that of the apical cortex in telophase neuroblasts. Scale bar, 10 μm (B–C), 5 μm (D–E).
Figure 1—figure supplement 2

Loss-of-neuroblast in vib mutants is due to premature differentiation, but not apoptosis.
(A) MARCM clones of control (FRT82B) and vib133 were labeled with Dpn (blue), Cleaved Caspase 3 (red) and CD8::GFP (green). Two different clones were shown for vib133 with one of them containing a neuroblast and the other losing the neuroblast. Note that there is no active Caspase staining in both clones. (B) Type I MARCM clones of control (FRT82B) and vib133 were labeled with Dpn (blue), Pros (red) and GFP (green). Clones were marked by CD8::GFP and indicated by white dotted lines. Only type I clones were analyzed since type II neuroblasts do not express Pros. (C) Interphase neuroblasts of wild-type control, vib133/j5A6 and vib1105/j5A6 were labeled with Pros (red) and DNA (blue). (D) Quantification of the average cell size of neuroblasts in control and vib133 MARCM clones. (E) MARCM clones of control (FRT82B) and vib133 were labeled with Dpn (blue), Fibrillarian (Fib, red) and GFP (green). The graph (to the right) shows the normalized ratio of nucleolus area to nucleus area of neuroblast in MARCM clones of control and vib133. Scale bar, 10 μm (A–B), 5 μm (C, E). *p-value<0.05, ***p-value<0.001.
Figure 2 with 1 supplement
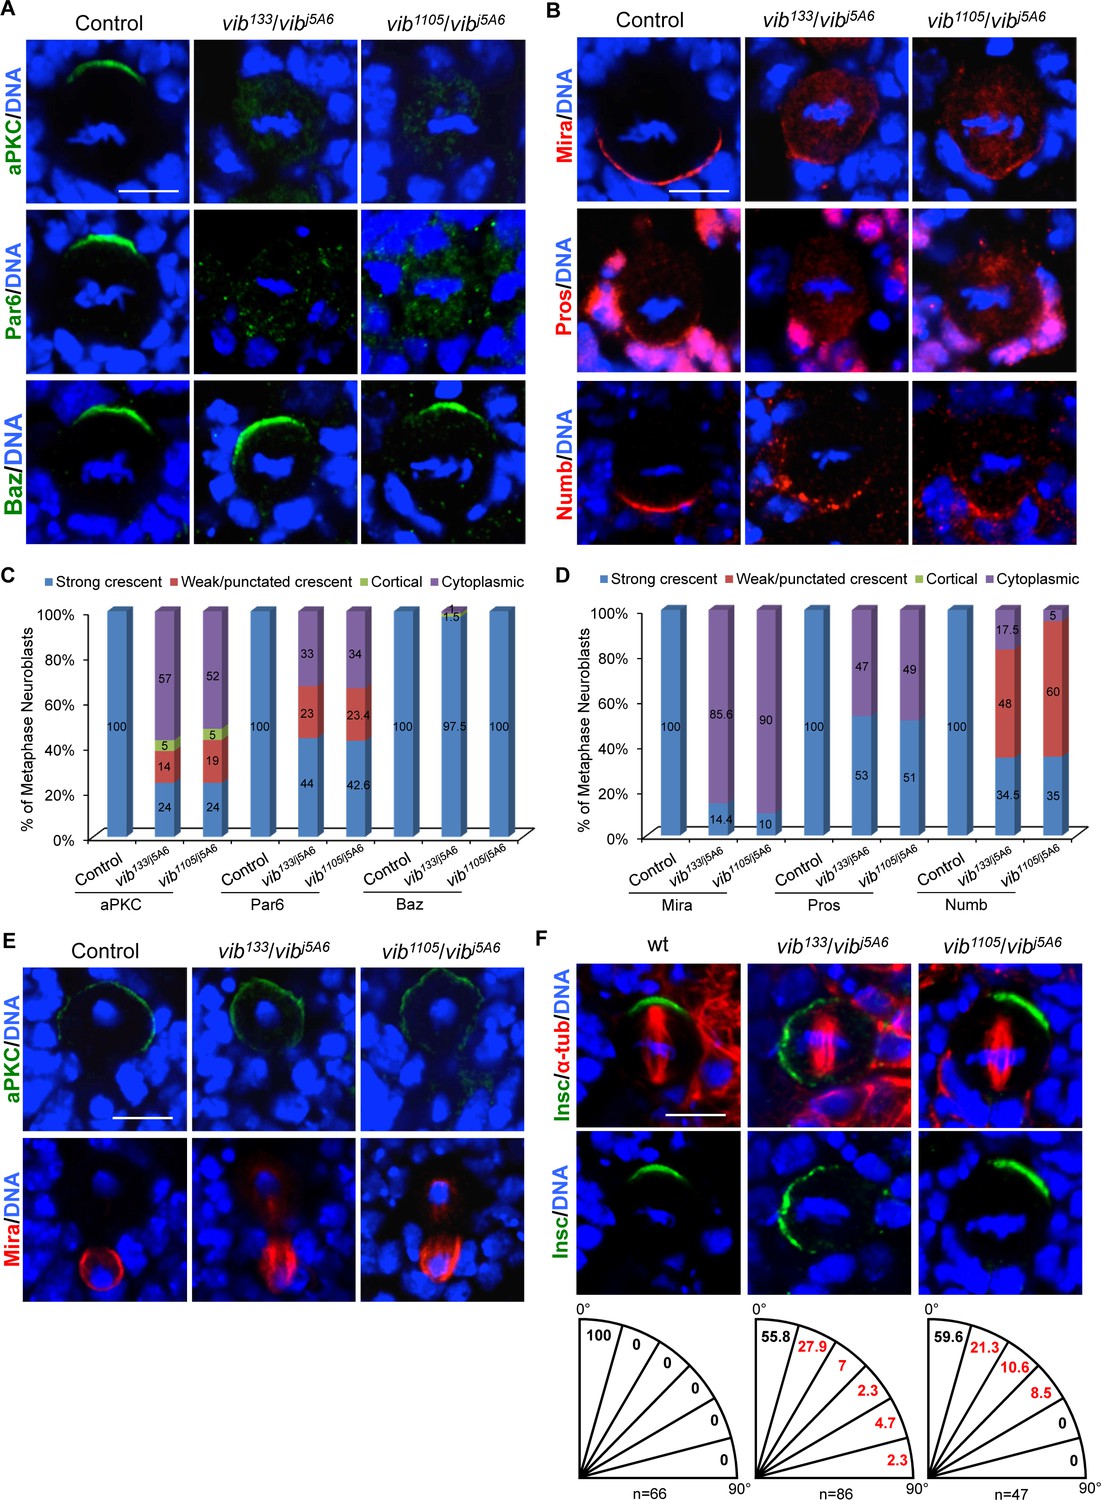
Vib regulates asymmetric cell division of neuroblasts.
(A) Metaphase neuroblasts of wild-type control, vib133/vibj5A6 and vib1105/vibj5A6 were labeled with aPKC, Par-6 or Baz (green) and DNA (blue). (B) Metaphase neuroblasts of control, vib133/vibj5A6 and vib1105/vibj5A6 were labeled with Mira, Pros or Numb (red) and DNA (blue). (C) Quantification of aPKC, Par-6 and Baz localization in metaphase neuroblasts for (A). (D) Quantification of Mira, Pros and Numb localization in metaphase neuroblasts for (B). (E) Telophase neuroblasts of control, vib133/vibj5A6 and vib1105/vibj5A6 were labeled with aPKC (green), Mira (red) and DNA (blue). (F) Metaphase neuroblasts of wild-type control, vib133/vibj5A6 and vib1105/vibj5A6 were labeled with Insc (green), α-tubulin (red) and DNA (blue). Spindle orientation was determined by the angle between apical-basal axis inferred by the Insc crescent and the mitotic spindle axis indicated by α-tubulin. Quantification of spindle orientation in control, vib133/vibj5A6 and vib1105/vibj5A6 are shown below the images. Scale bars, 5 µm.
Figure 2—figure supplement 1
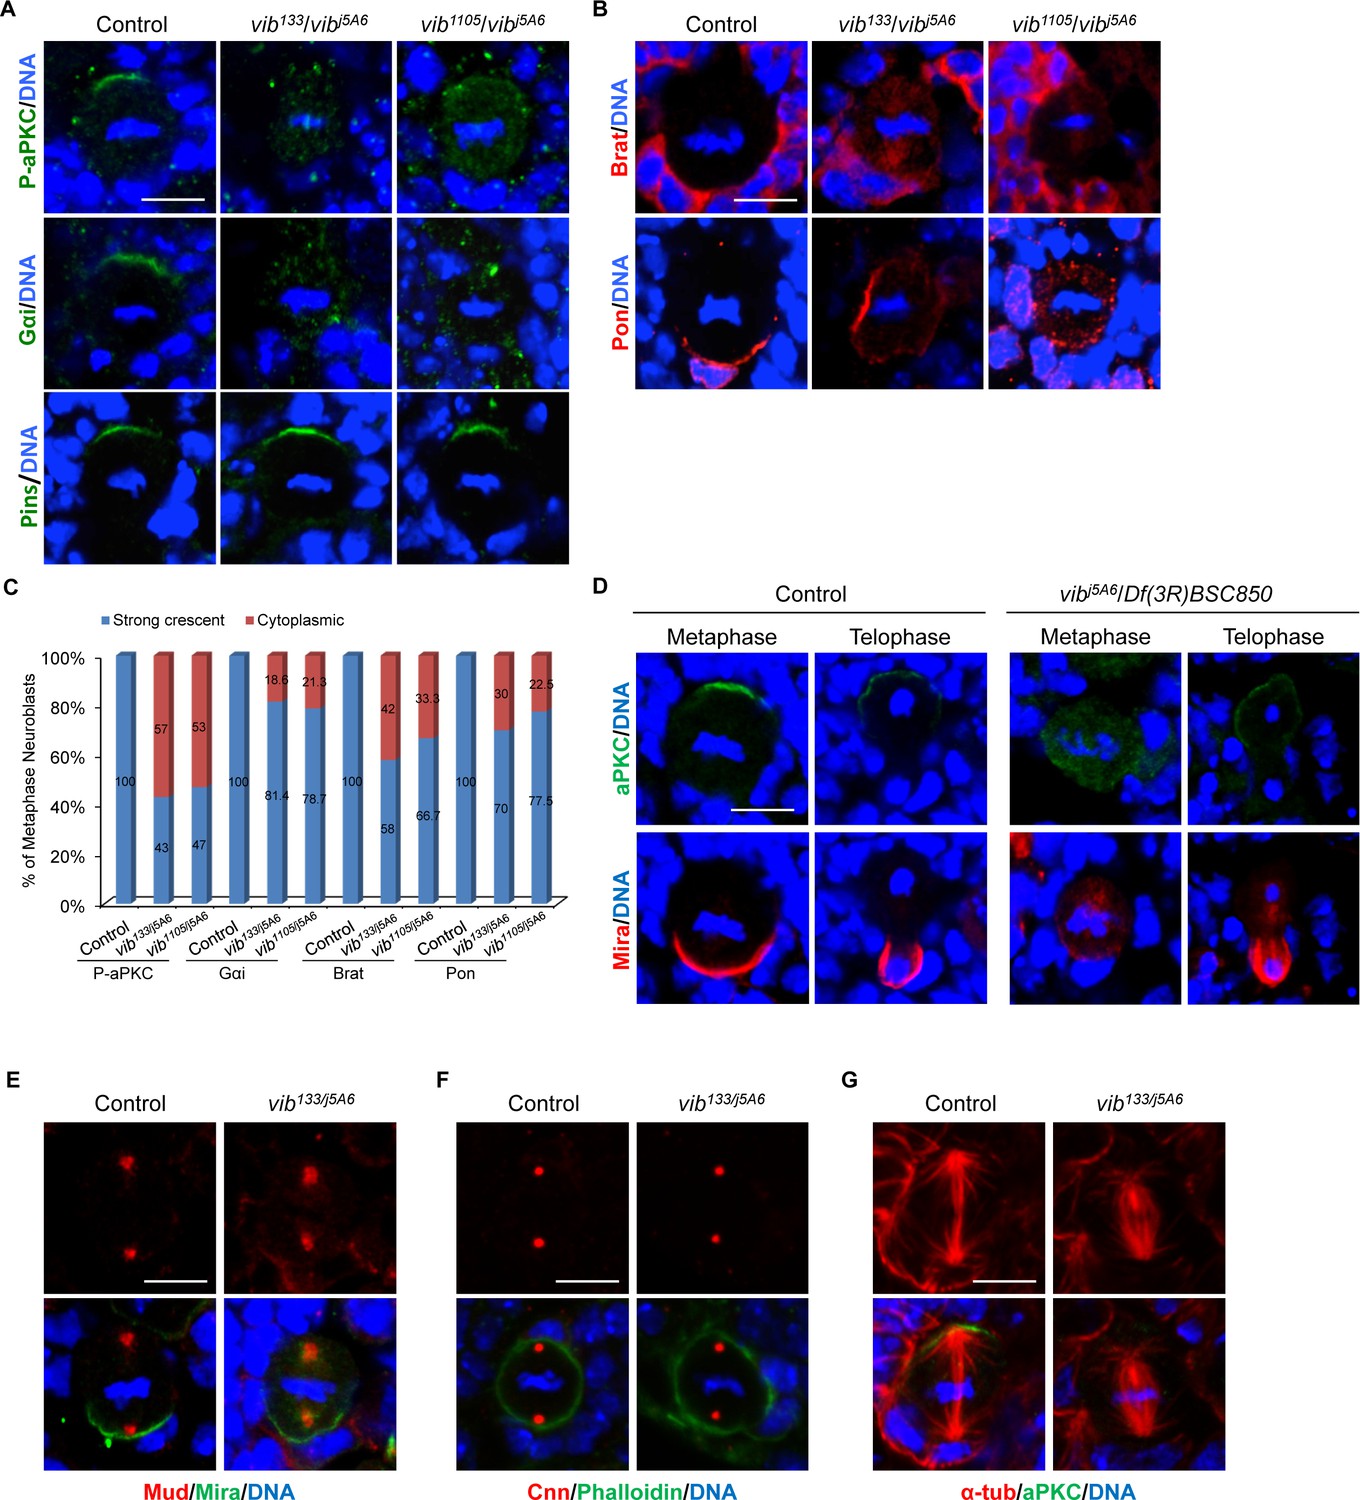
Vib is required for asymmetric protein localization in neuroblasts.
(A) Metaphase neuroblasts of wild-type control, vib133/vibj5A6 and vib1105/vibj5A6 were labeled with autophospho-aPKC, Gαi or Pins (green) and DNA (blue). (B) Metaphase neuroblasts of wild-type control, vib133/vibj5A6 and vib1105/vibj5A6 were labeled with Brat or Pon (red) and DNA (blue). (C) Quantification of autophospho-aPKC, Gαi, Brat and Pon localization in metaphase neuroblasts for A-B. (D) Neuroblasts of wild-type control and vibj5A6/Df(3R)BSC850 hemizygotes were labeled with aPKC (green), Mira (red) and DNA (blue). (E) Metaphase neuroblasts of wild-type control and vib133/j5A6 were labeled with Mud (red), Mira (green) and DNA (blue). (F) Metaphase neuroblasts of wild-type control and vib133/j5A6 were labeled with Centrosomin (Cnn, red), Phalloidin (green) and DNA (blue). (G) Metaphase neuroblasts of wild-type control and vib133/j5A6 were labeled with α-tubulin (red), aPKC (green) and DNA (blue). Scale bars, 5 μm.
Figure 3 with 1 supplement
Vib anchors non-muscle myosin II regulatory light chain Sqh to neuroblast cortex.
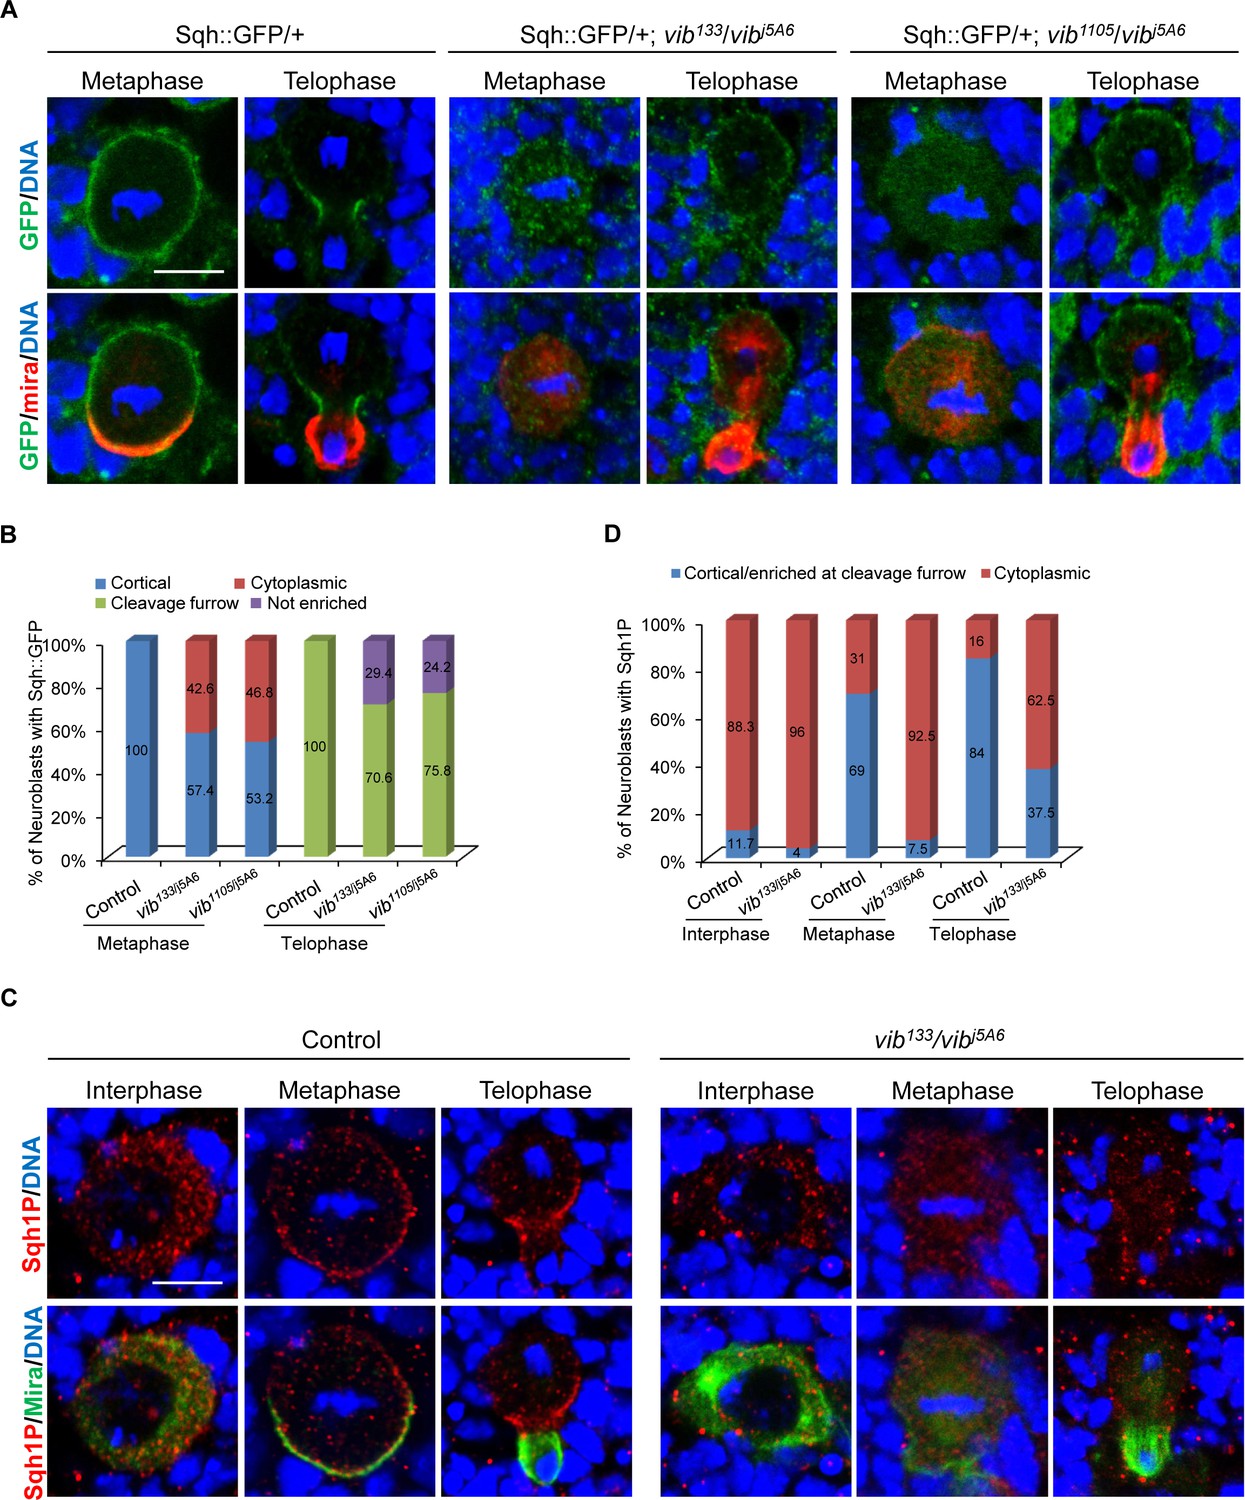
(A) Neuroblasts of control, vib133/vibj5A6 and vib1105/vibj5A6 each expressing one copy of Sqh::GFP were labeled with GFP (green), Mira (red) and DNA (blue). (B) Quantification of Sqh::GFP localization in neuroblasts for (A). ‘Not enriched’ in quantification legend refers to no enriched localization at cleavage furrow. (C) Neuroblasts of control and vib133/vibj5A6 were labeled with Mira (green), Sqh1P (red) and DNA (blue). (D) Quantification for Sqh1P localization in neuroblasts for (C). Scale bars, 5 µm.
Figure 3—figure supplement 1
Sqh localization is disrupted in vib mutant neuroblasts.
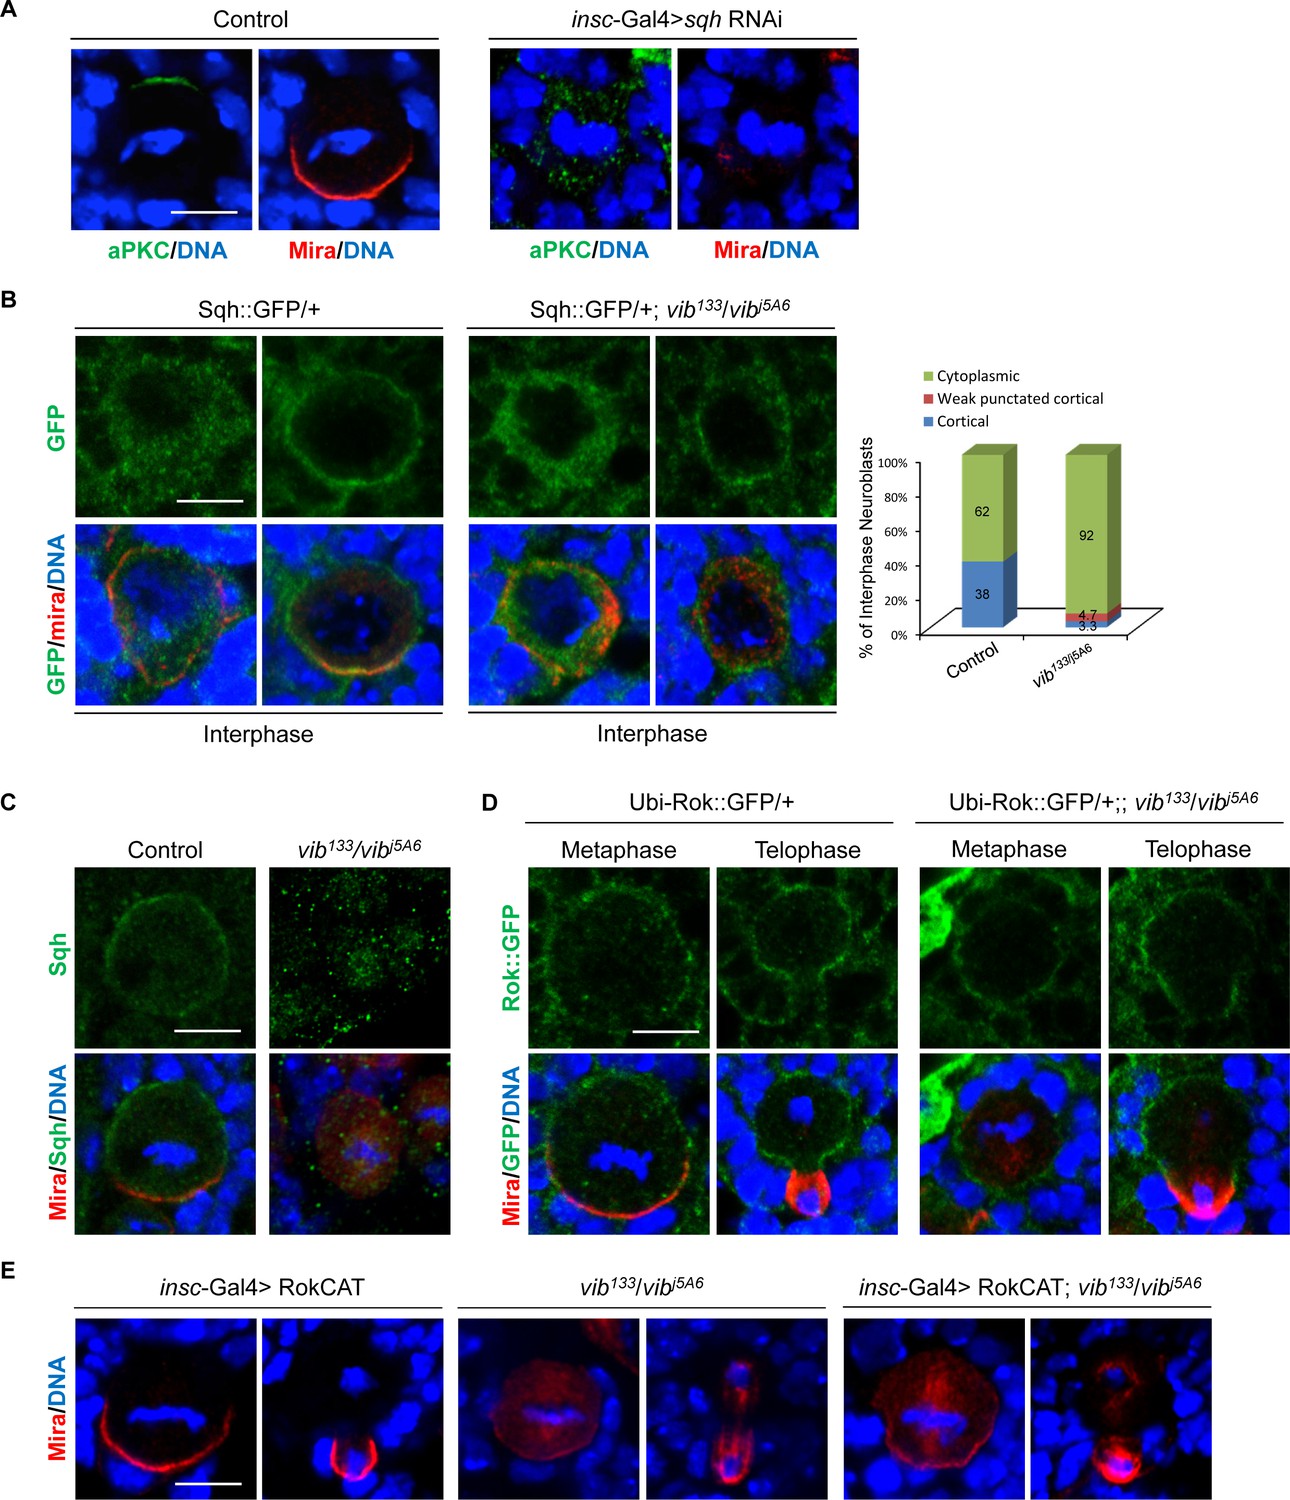
(A) Metaphase neuroblasts of control (insc-Gal4/+) and sqh RNAi knockdown (BDSC#33892) under insc-Gal4 driver were labeled with aPKC (green), Mira (red) and DNA (blue). (B) Interphase neuroblasts of control (Sqh::GFP/+) and vib133/j5A6 each containing one copy of Sqh::GFP were labeled with GFP (green), Mira (red) and DNA (blue). Quantification of Sqh::GFP localization in interphase neuroblasts of control and vib133/j5A6 is shown beside the images. (C) Metaphase neuroblasts of control and vib133/vibj5A6 were labeled with Sqh (green), Mira (red) and DNA (blue). (D) Neuroblasts of control (Ubi-Rok-GFP/+) and vib133/j5A6 each containing one copy of Ubi-Rok-GFP were labeled with GFP (green), Mira (red) and DNA (blue). (E) Neuroblasts of RokCAT over-expression under insc-Gal4 driver, vib133/j5A6 and RokCAT over-expression in vib133/j5A6 were labeled with Mira (red) and DNA (blue). Scale bars, 5 μm.
Figure 4 with 3 supplements
Lipid transfer activity of Vib is important for asymmetric cell division.
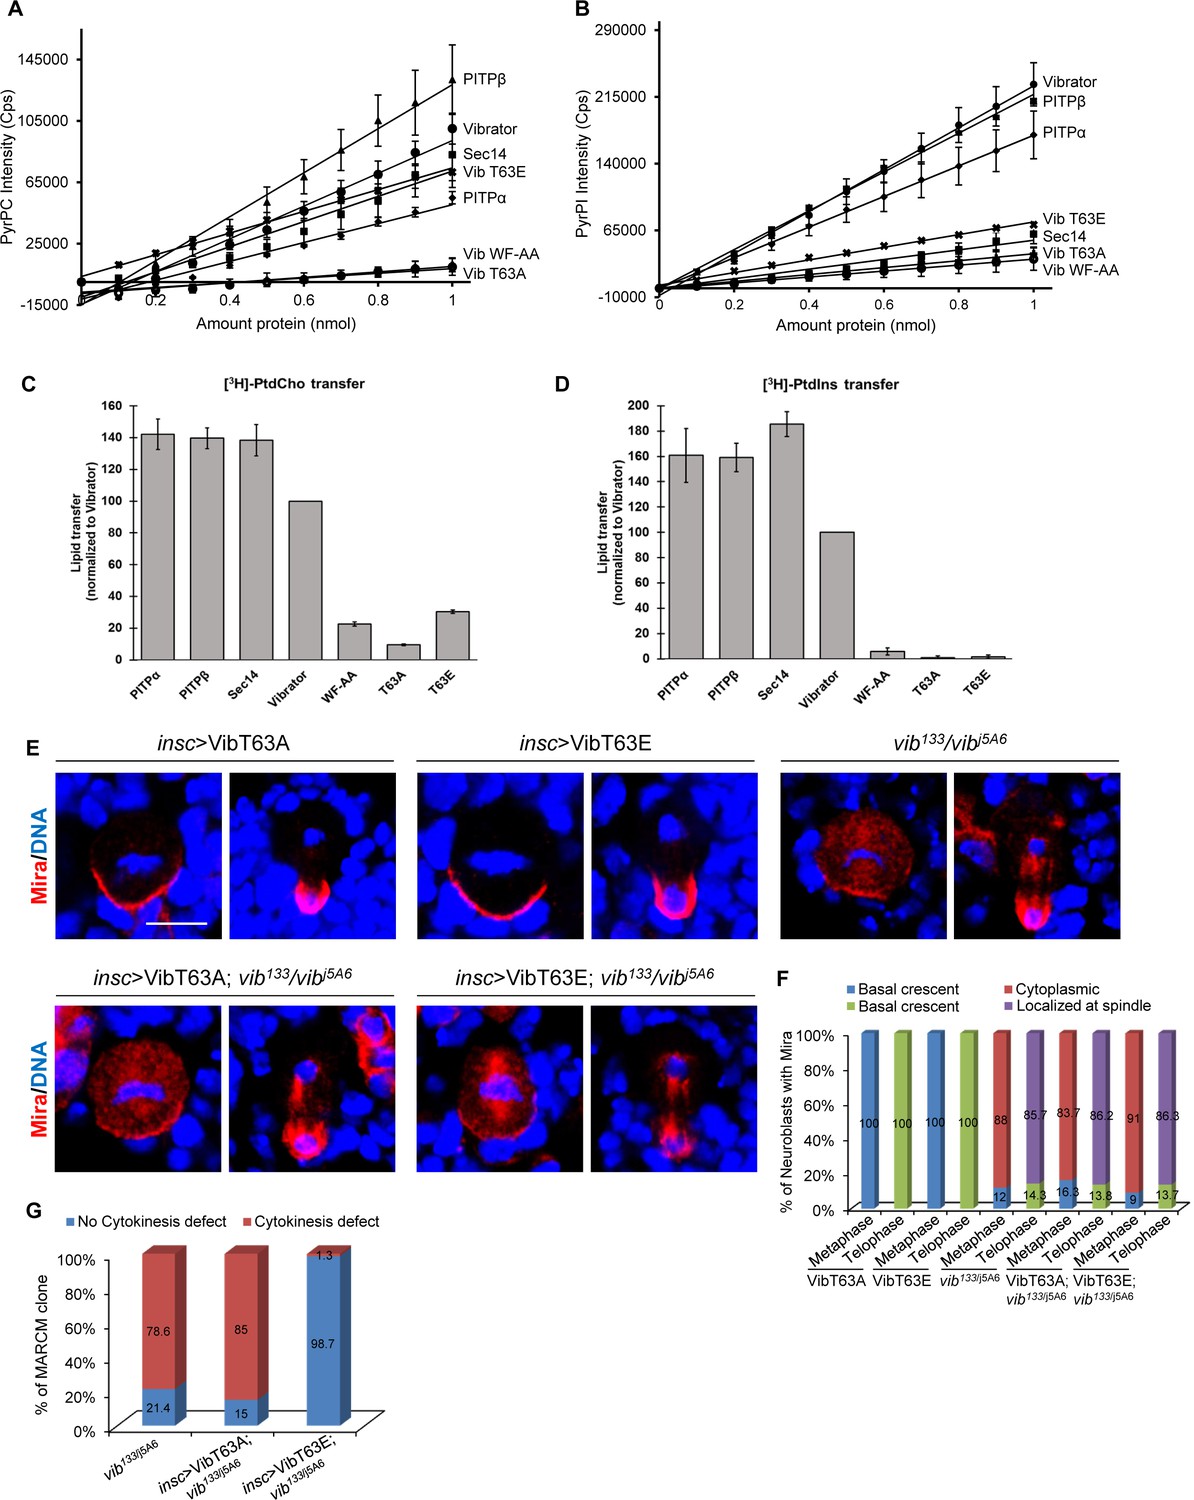
(A) Fluorescence intensity measured at 378 nm of PyrPtdCho as a function of protein amount. An increase in intensity represents binding events when the fluorophore is removed from its quenched environment. Lines represent linear equation trend lines were shown. For the error bars, n = 2. (B) Fluorescence intensity measured at 378 nm of PyrPtdIns as a function of protein amount. An increase in intensity represents binding events when the fluorophore is removed from its quenched environment. Lines represent linear equation trend lines were shown. For the error bars, n = 2. (C) Endpoint PtdCho transfer assays. Indicated recombinant proteins (10 µg/assay) were assayed for [3 hr]-PtdCho transfer. Transfer efficiencies of Vibrator were set at 100% (n = 3), and transfer of all other proteins are normalized relative to Vibrator activity values obtained from the same experiments. (D) Endpoint PtdIns transfer assays. Indicated recombinant proteins (10 µg/assay) were assayed for [3 hr]-PtdIns. Transfer efficiencies of Vibrator were set at 100% (n = 3), and transfer of all other proteins are normalized relative to Vibrator activity values obtained from the same experiments. (E) Neuroblasts of insc >VibT63A, insc >VibT63E, vib133/vibj5A6, insc >VibT63A in vib133/vibj5A6 and insc >VibT63A in vib133/vibj5A6 were labeled with Mira (red) and DNA (blue). (F) Quantification for Mira localization in neuroblasts for (E). ‘Localized at Spindle’ refers to the delocalization of Pros at the mitotic spindle in addition to basal crescent in telophase neuroblasts. (G) Quantification showing the percentage of MARCM clones of vib133/j5A6, insc >VibT63A; vib133/j5A6 and insc >VibT63E; vib133/j5A6 that exhibited cytokinesis defects. Scale bars, 5 µm.
Figure 4—figure supplement 1
Lipid transfer activity of Vib is required for neuroblast homeostasis.
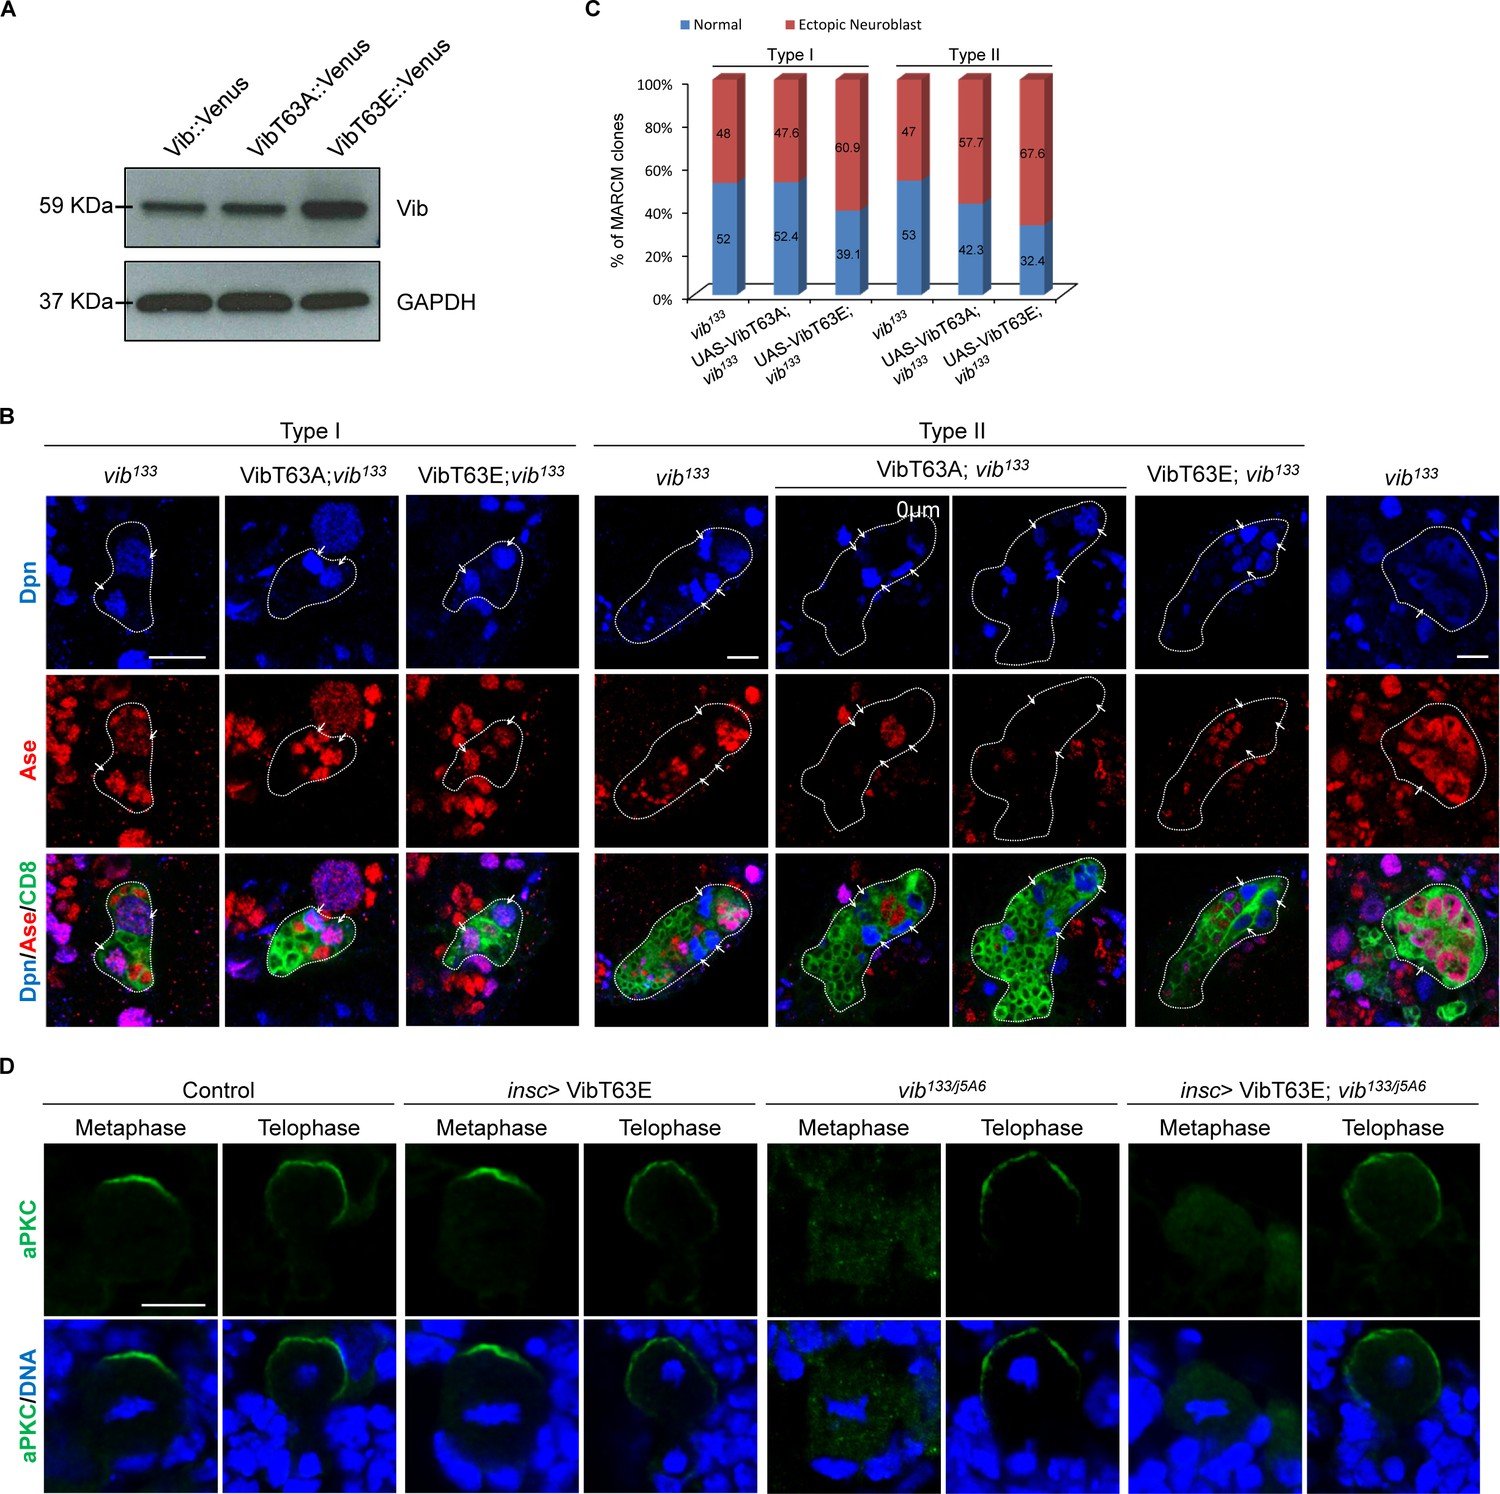
(A) Western blot of Vib protein in larval brain lysate from Vib::Venus, VibT63A::Venus and VibT63E::Venus expression under the elav-Gal4 driver. GAPDH was used as a loading control. (B) Type I and type II MARCM clones of vib133, UAS-VibT63A::Venus; vib133 and UAS-VibT63E::Venus; vib133 were labeled with Dpn (blue), Ase (red) and CD8 (green). The last clone on the right shows a cytokinesis defect. Clones were marked by CD8::GFP and indicated by white dotted line. Note that in VibT63E::Venus; vib133, no cytokinesis defects were observed. The signal of VibT63A-Venus and VibT63E-Venus in MARCM clones is masked by CD8::GFP signal. (C) Quantification of clones with ectopic neuroblasts phenotype in (B). Analysis was performed based on those clones that did not exhibit obvious cytokinesis defect. (D) Neuroblasts of wild-type controls, insc-Gal4 >VibT63E, vib133/vibj5A6 and insc-Gal4 >VibT63E in vib133/vibj5A6 were labeled with aPKC (green) and DNA (blue). aPKC was asymmetrically localized in the following genotypes: wild-type control metaphase neuroblasts, 100%, n = 22; control telophase neuroblasts, 100%, n = 39; insc >VibT63E::Venus metaphase neuroblasts, 100%, n = 51; insc >VibT63E::Venus telophase neuroblasts, 100%, n = 45; vib133/j5A6 metaphase neuroblasts, 53%, n = 49; vib133/j5A6 telophase neuroblasts, 100%, n = 44; insc> VibT63E::Venus; vib133/j5A6 metaphase neuroblasts, 49%, n = 90; insc> VibT63E::Venus; vib133/j5A6 telophase neuroblasts, 100%, n = 47. Scale bars, 10 µm (B), 5 µm (D).
Figure 4—figure supplement 2
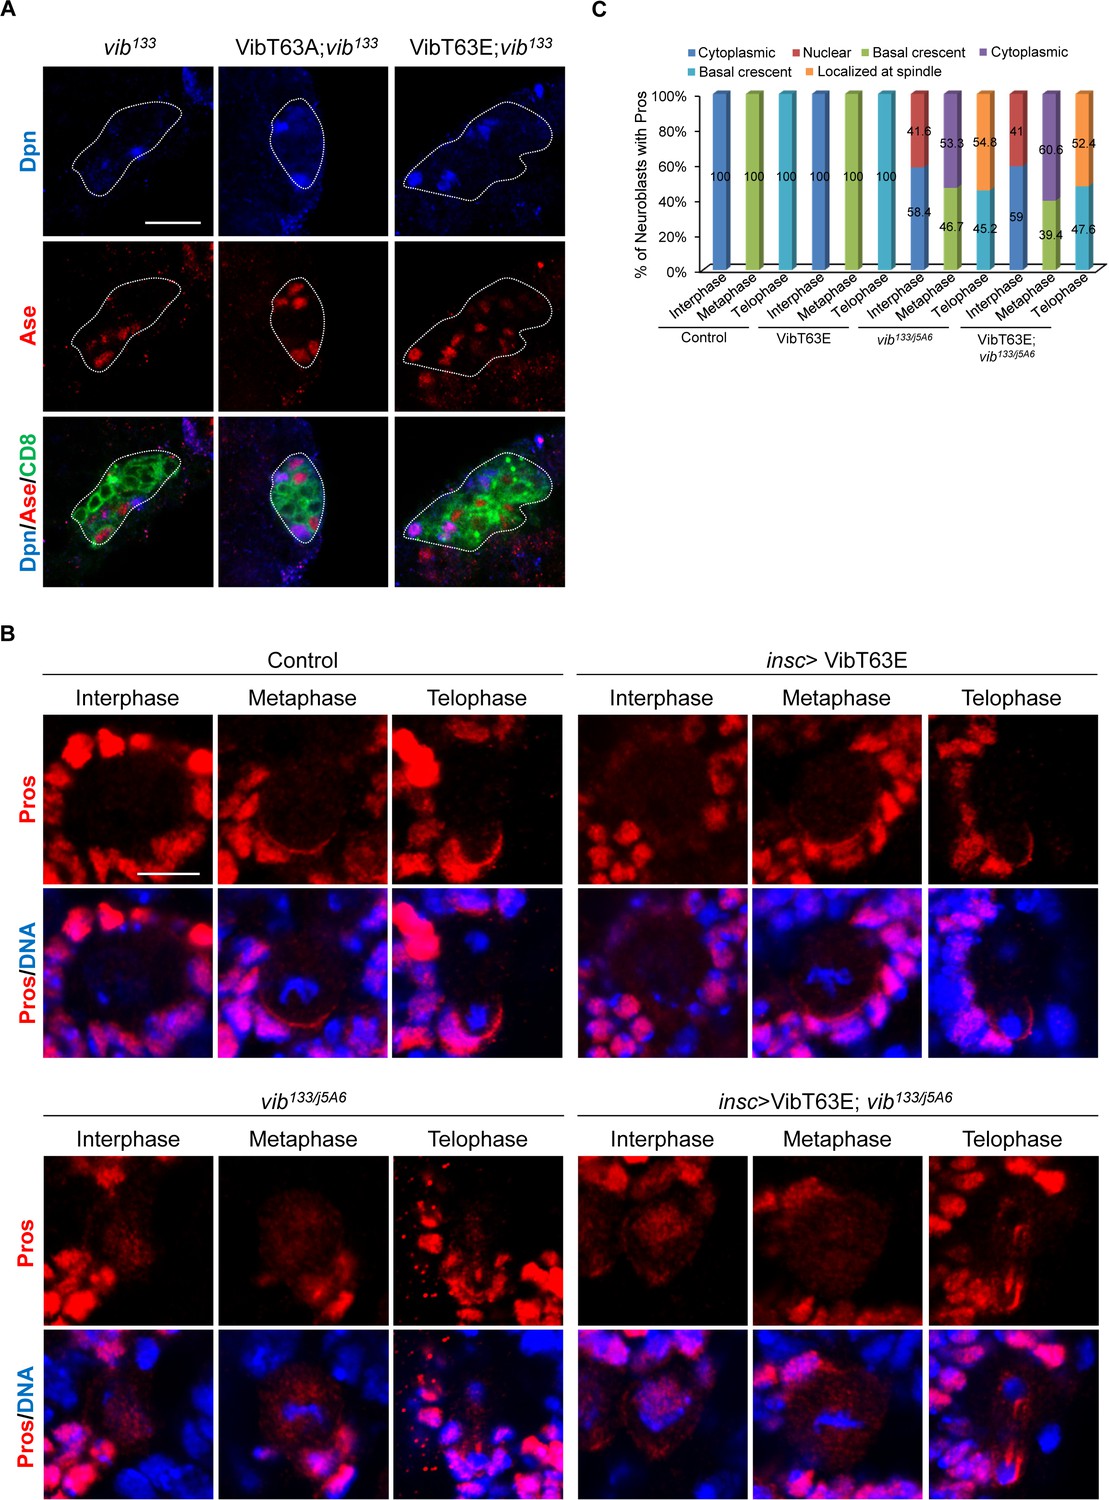
Lipid binding and transfer activity of Vib is required for the localization of Pros in neuroblasts.
(A) MARCM clones of vib133, UAS-VibT63A::Venus; vib133 and UAS-VibT63E::Venus; vib133 were labeled with Dpn (blue), Ase (red) and CD8 (green). Clones were marked by CD8::GFP and indicated by white dotted line. Note that none of the clones contains primary neuroblast (Z-stack not shown). (B) Neuroblasts of wild-type controls, insc-Gal4 >VibT63E, vib133/vibj5A6 and insc-Gal4 >VibT63E in vib133/vibj5A6 were labeled with Pros (red) and DNA (blue). (C) Quantification of Pros localization in neuroblasts for (B). Percentage of neuroblasts with various localization patterns of Pros was labeled on the column of each genotype. ‘Localized at spindle’ in quantification legend refers to the ectopic localization of Pros at the central spindle in addition to basal crescent in telophase neuroblasts. Scale bar, 10 μm (A), 5 μm (B).
Figure 4—figure supplement 3

Lipid binding and transfer activity of Vib is required for the localization of Sqh in neuroblasts.
(A) Neuroblasts of wild-type controls, insc-Gal4 >VibT63A, insc-Gal4 >VibT63E, vib133/vibj5A6, insc-Gal4 >VibT63A in vib133/vibj5A6 and insc-Gal4 >VibT63E in vib133/vibj5A6 were labeled with Mira (green) DNA (blue) and Sqh (red). (B) Quantification of Sqh localization in neuroblasts for (A). Percentage of neuroblasts with various localization patterns of Sqh was labeled on the column of each genotype. Sample sizes: wild-type control metaphase neuroblasts, n = 32; control telophase neuroblasts, n = 13; insc >VibT63A::Venus metaphase neuroblasts, n = 37; insc >VibT63A::Venus telophase neuroblasts, n = 19; insc> VibT63E::Venus metaphase neuroblasts, n = 36; insc> VibT63E::Venus telophase neuroblasts, n = 20; vib133/j5A6 metaphase neuroblasts, n = 41; vib133/j5A6 telophase neuroblasts, n = 14; insc> VibT63A::Venus; vib133/j5A6 metaphase neuroblasts, n = 59; insc> VibT63A::Venus; vib133/j5A6 telophase neuroblasts, n = 21; insc> VibT63E::Venus; vib133/j5A6 metaphase neuroblasts, n = 43; insc> VibT63E::Venus; vib133/j5A6 telophase neuroblasts, n = 15. (C) Sqh1P (red), Mira (green) and DNA (blue) were labeled in neuroblasts of various genotypes. (D) Quantification of Sqh1P localization in neuroblasts for (C). Percentage of neuroblasts with various localization patterns of Sqh1P was labeled on the column of each genotype. Sample sizes: control metaphase neuroblasts, n = 87; control telophase neuroblasts, n = 34; insc >VibT63A::Venus metaphase neuroblasts, n = 54; insc >VibT63A::Venus telophase neuroblasts, n = 22; insc >VibT63E::Venus metaphase neuroblasts, n = 45; and insc >VibT63E::Venus telophase neuroblasts, n = 21. vib133/j5A6 metaphase neuroblasts, n = 62; vib133/j5A6 telophase neuroblasts, n = 20; insc >VibT63A::Venus; vib133/j5A6, metaphase neuroblasts, n = 65; insc >VibT63A::Venus; vib133/j5A6 telophase neuroblasts, n = 20; insc >VibT63E::Venus; vib133/j5A6 metaphase neuroblasts, n = 70; insc >VibT63E::Venus; vib133/j5A6 telophase neuroblasts, n = 26. ‘Enriched’ in quantification legend refers to enriched localization at cleavage furrow, while ‘not enriched’ indicates no enrichment at cleavage furrow. Scale bar, 5 μm.
Figure 5 with 1 supplement
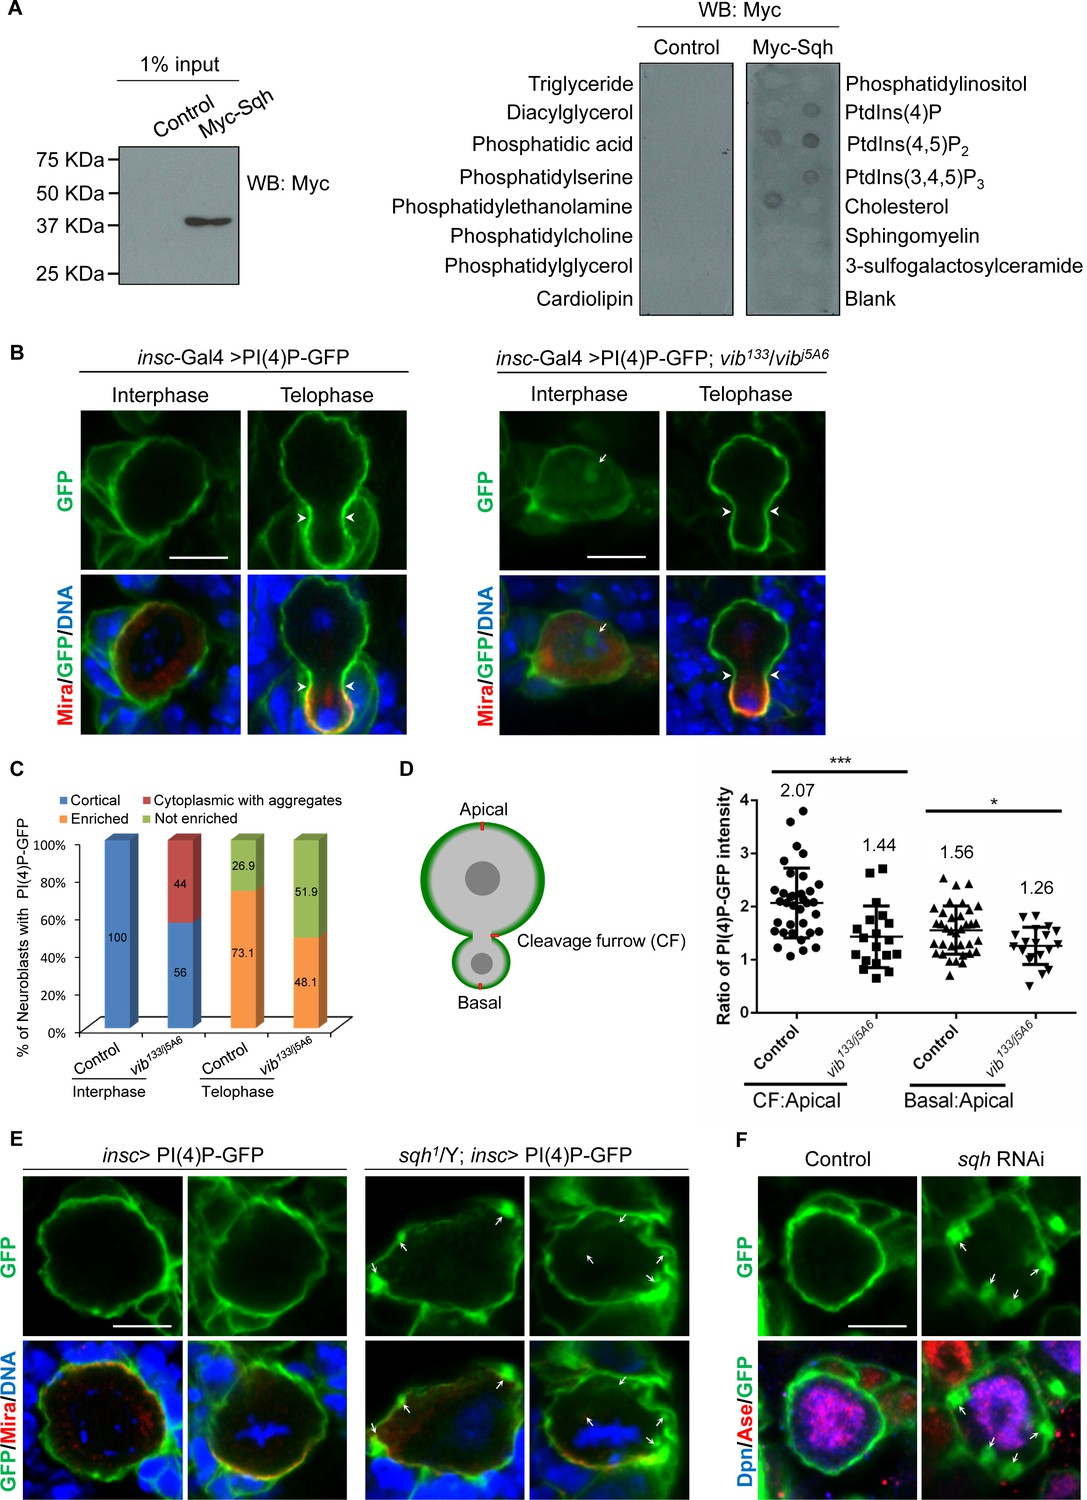
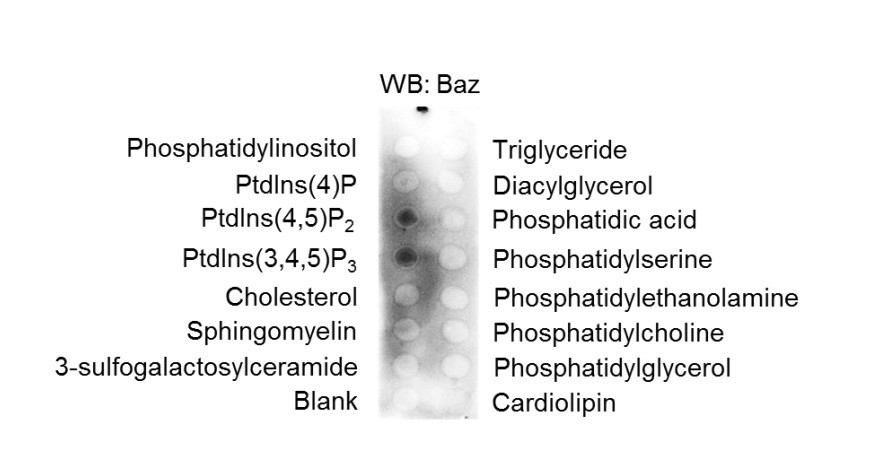
Sqh binds to phosphoinositide PI(4)P and localizes it to cell cortex in neuroblasts.
(A) Control (empty Myc vector) and Myc-Sqh lysates from S2 cells were used for lipid-binding assay with lipid strips. Lipid strips were blotted with Myc antibody. 1% of lysate input used for lipid-binding assay is shown in the left panel. (B) Neuroblasts of PI(4)P-GFP (2xOsh2PH::GFP, PI(4)P reporter) driven by insc-Gal4 were labeled with GFP (green), Mira (red) and DNA (blue). Neuroblasts of insc-Gal4 driven PI(4)P reporter in vib133/vibj5A6 were labeled with GFP (green), Mira (red) and DNA (blue). (C) Quantification of PI(4)P reporter localization in neuroblasts for (B). ‘Enriched’ in quantification legend refers to enriched localization at cleavage furrow, while ‘not enriched’ indicates no enrichment at cleavage furrow. (D) A schematic representation of measurement of the PI(4)P-GFP intensity for telophase neuroblasts shown in B. The red line shows the site where the measurement was taken in neuroblasts. The graph (to the right) shows the ratio of PI(4)P-GFP intensity at cleavage furrow (CF) or basal cortex to apical cortex in control and vib133/vibj5A6 expressing PI(4)P-GFP. (E) Neuroblasts of control and sqh1/Y hemizygotes expressing PI(4)P-GFP driven by insc-Gal4 were labeled with Mira (red), GFP (green) and DNA (blue). (F) Neuroblasts of control (PI(4)P-GFP driven by insc-Gal4) and sqh knockdown with PI(4)P-GFP expression driven by insc-Gal4 were labelled with Dpn (blue), Ase (red) and GFP (green). Arrowheads indicate position of cleavage furrow and arrows indicate PI(4)P-GFP aggregates. Scale bars, 5 µm.
Figure 5—figure supplement 1
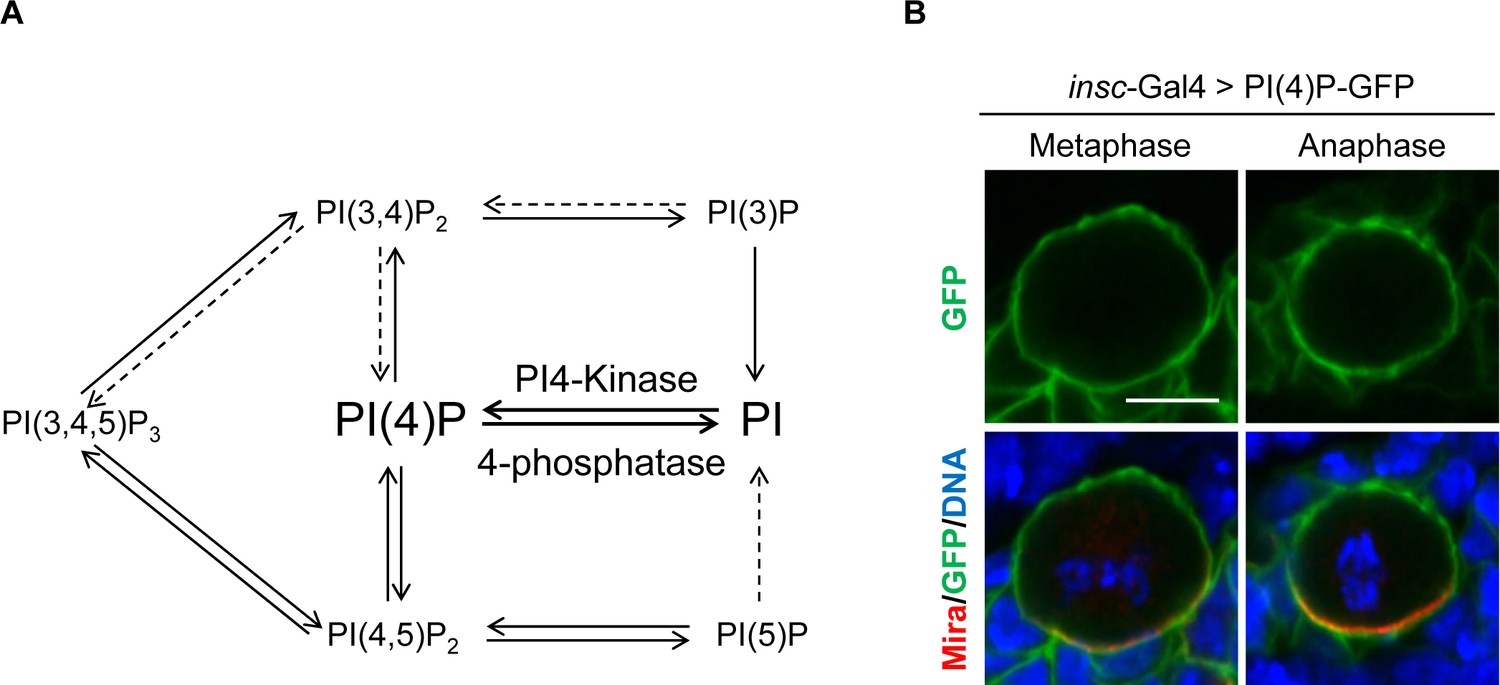
PI(4)P is localized to cell cortex in neuroblasts.
(A) A schematic diagram showing phosphoinositides metabolism. (B) Neuroblasts of PI(4)P-GFP (insc >2xOsh2PH::GFP, PI(4)P reporter) were labeled with GFP (green), Mira (red) and DNA (blue). Scale bar, 5 μm.
Figure 6 with 1 supplement
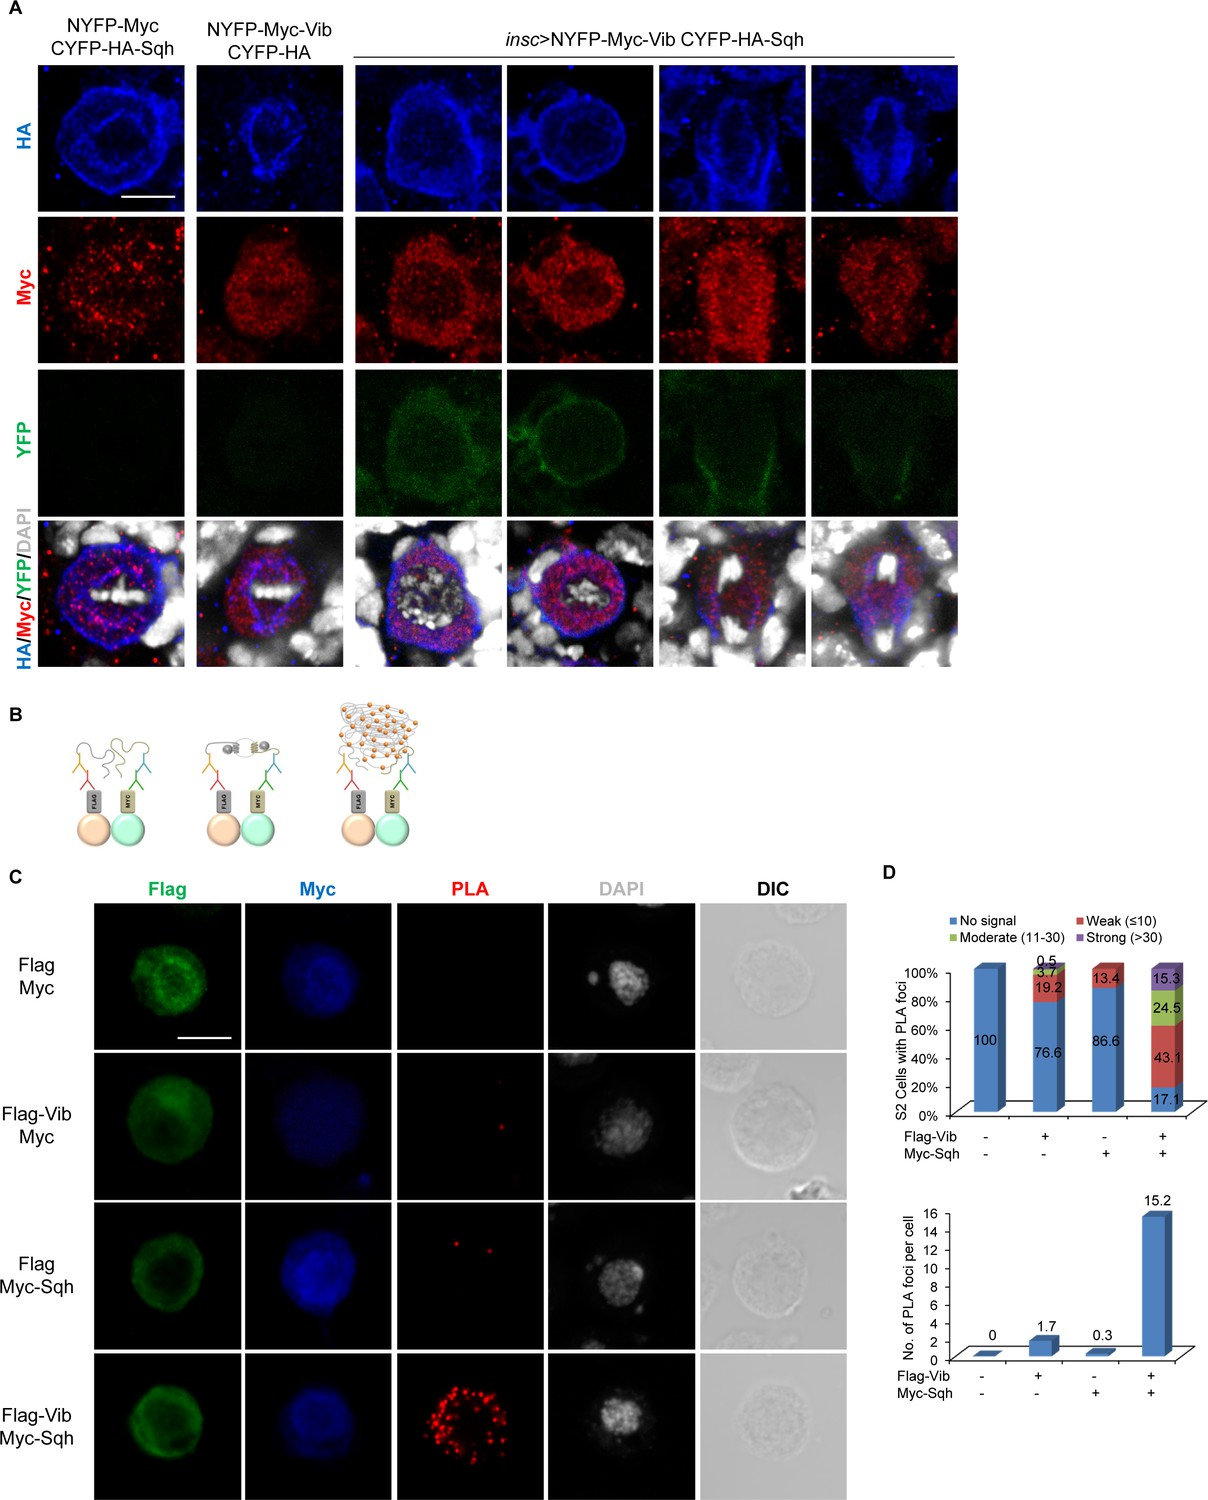
Vib interacts with Sqh in larval brain neuroblasts.
(A) In vivo BiFC assay between Vib and Sqh. NYFP-Myc-Vib and CYFP-HA-Sqh were co-expressed in neuroblasts by insc-Gal4, stained with HA (red), Myc (red) and DAPI (grey), and detected for YFP fluorescence (green). Controls were NYFP-Myc-Vib with CYFP-HA control and CYFP-HA-Sqh with NYFP-Myc Control. Scale bars, 5 µm. (B) Schematic representation of proximity ligation assay performed on S2 cells (refer to Materials and methods). (C) In situ PLA assay between Flag-Vib and Myc-Sqh in S2 cells. S2 cells transfected with the indicated plasmids were stained with Flag (green), Myc (blue) and DAPI (grey) and detected for PLA signal (red). Cell outline was shown by differential interference contrast (DIC) images. Scale bar, 5 µm. (D) Graph showing the percentage of S2 cells that expressed no PLA signal, weak (≤10 foci), moderate (11–30 foci) and strong (>30 foci) PLA signals for (C). Quantification for the average number of PLA foci per cell in (C).
Figure 6—figure supplement 1
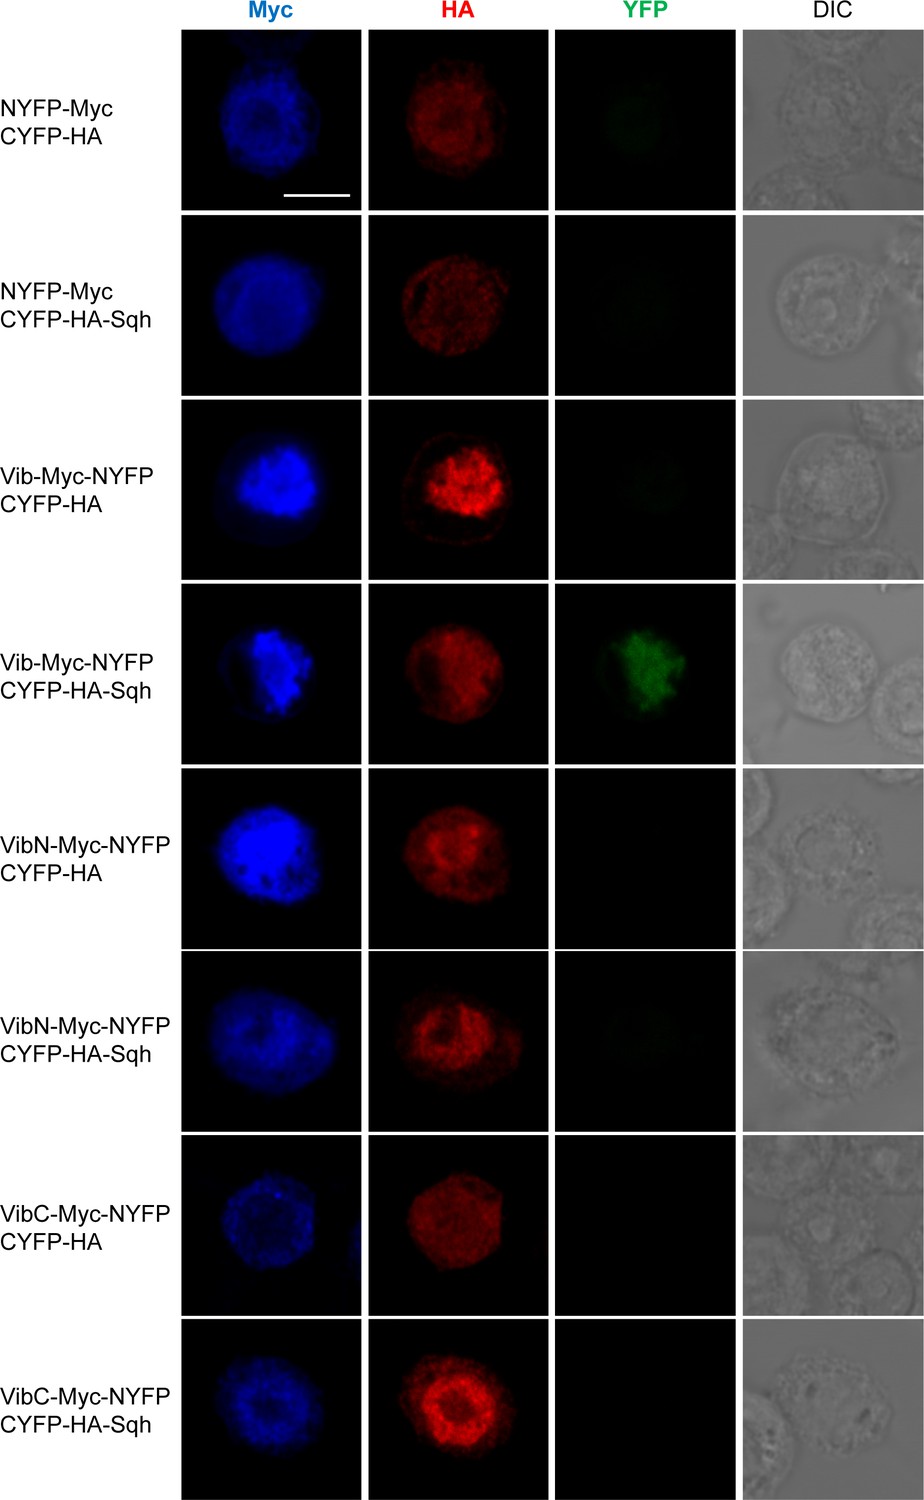
Vib interacts with Sqh in Bimolecular fluorescence complementation.
S2 cells that were triple transfected with actin-Gal4, UAS-NYFP-Myc-Vib and UAS-CFYP-HA-Sqh or various control combinations were stained with Myc (blue), HA (red) and detected for YFP fluorescence (green). Cell outline was shown by Differential interference contrast (DIC) images. Scale bar, 5 µm. Empty control: act-Gal4, UAS-NYFP-Myc and UAS-CYFP-HA. NYFP-Myc and CYFP-HA-Sqh: act-Gal4, UAS-NYFP-Myc and UAS-CYFP-HA-Sqh. Vib-Myc-NYFP and CYFP-HA: act-Gal4, UAS-Vib-Myc-NYFP and UAS-CYFP-HA. Vib-Myc-NYFP and CYFP-HA-Sqh: act-Gal4, UAS-Vib-Myc-NYFP and UAS-CYFP-HA-Sqh. VibN-Myc-NYFP and CYFP-HA: act-Gal4, UAS-VibN-Myc-NYFP and UAS-CYFP-HA. VibN-Myc-NYFP and CYFP-HA-Sqh: act-Gal4, UAS-VibN-Myc-NYFP and UAS-CYFP-HA-Sqh. VibC-Myc-NYFP and CYFP-HA: act-Gal4, UAS-VibC-Myc-NYFP and UAS-CYFP-HA. VibC-Myc-NYFP and CYFP-HA-Sqh: act-Gal4, UAS-VibC-Myc-NYFP and UAS-CYFP-HA-Sqh.
Figure 7 with 2 supplements
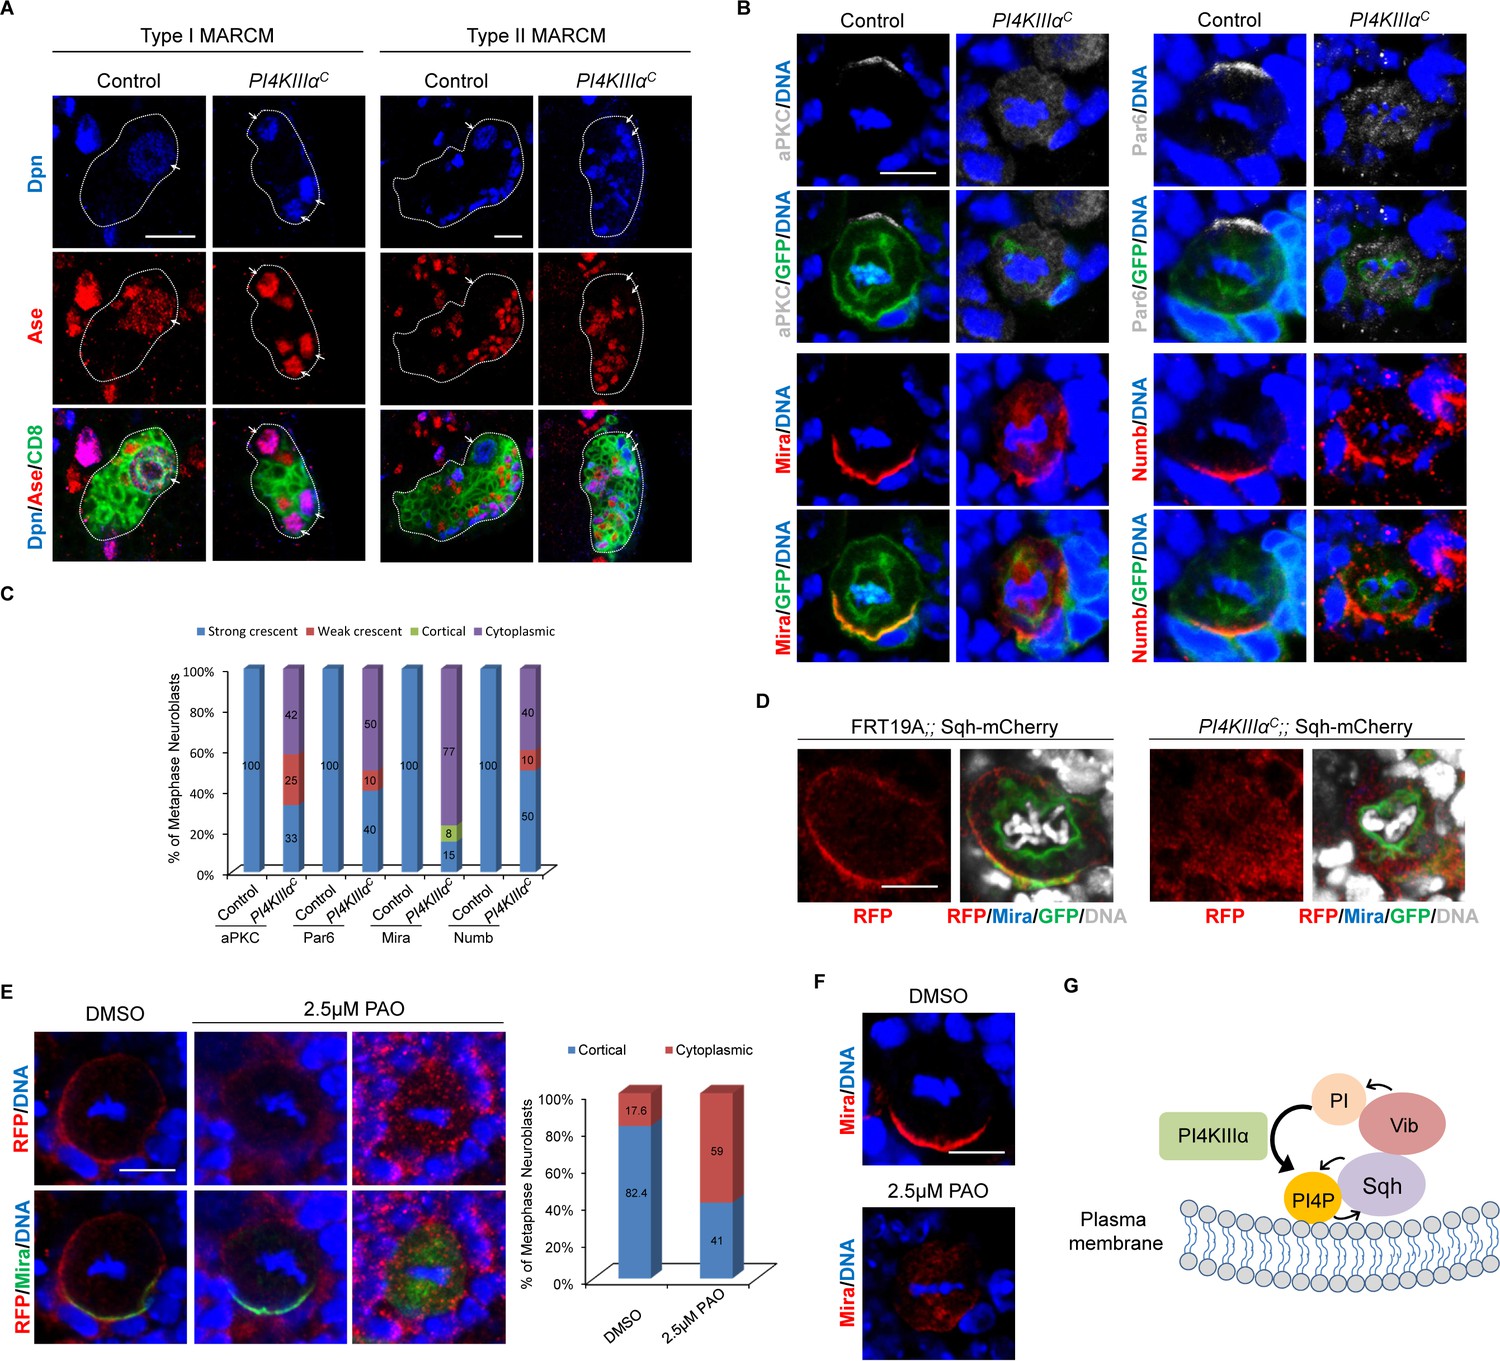
Loss of PI4KIIIα perturbs neuroblast homeostasis and asymmetric cell division of neuroblasts.
(A) MARCM clones of control (FRT19A) and PI4KIIIαC were labeled with Dpn (blue), Ase (red) and CD8 (green). Arrows indicate neuroblasts. Clones were marked by CD8::GFP and indicated by white dotted line. (B) Neuroblasts of control and PI4KIIIαC MARCM clones were labeled with aPKC or Par-6 (grey), Mira or Numb (red), GFP (green) and DNA (blue). (C) Quantification for (B). (D) Neuroblasts of control (FRT19A;; Sqh::mCherry) and PI4KIIIαC;; Sqh::mCherry MARCM clones were labeled with RFP (red), Mira (blue), GFP (green) and DAPI (grey). (E) Neuroblasts of Sqh::mCherry treated with mock (DMSO) or 2.5 μM PAO in DMSO were stained with RFP (red), Mira (green) and DNA. Quantification was shown next to images. (F) Neuroblasts treated with mock or 2.5 μM PAO in DMSO were stained with Mira (red) and DNA (blue). (G) A working model. Scale bars, 10 μm (A); 5 µm (B, D–F).
Figure 7—figure supplement 1
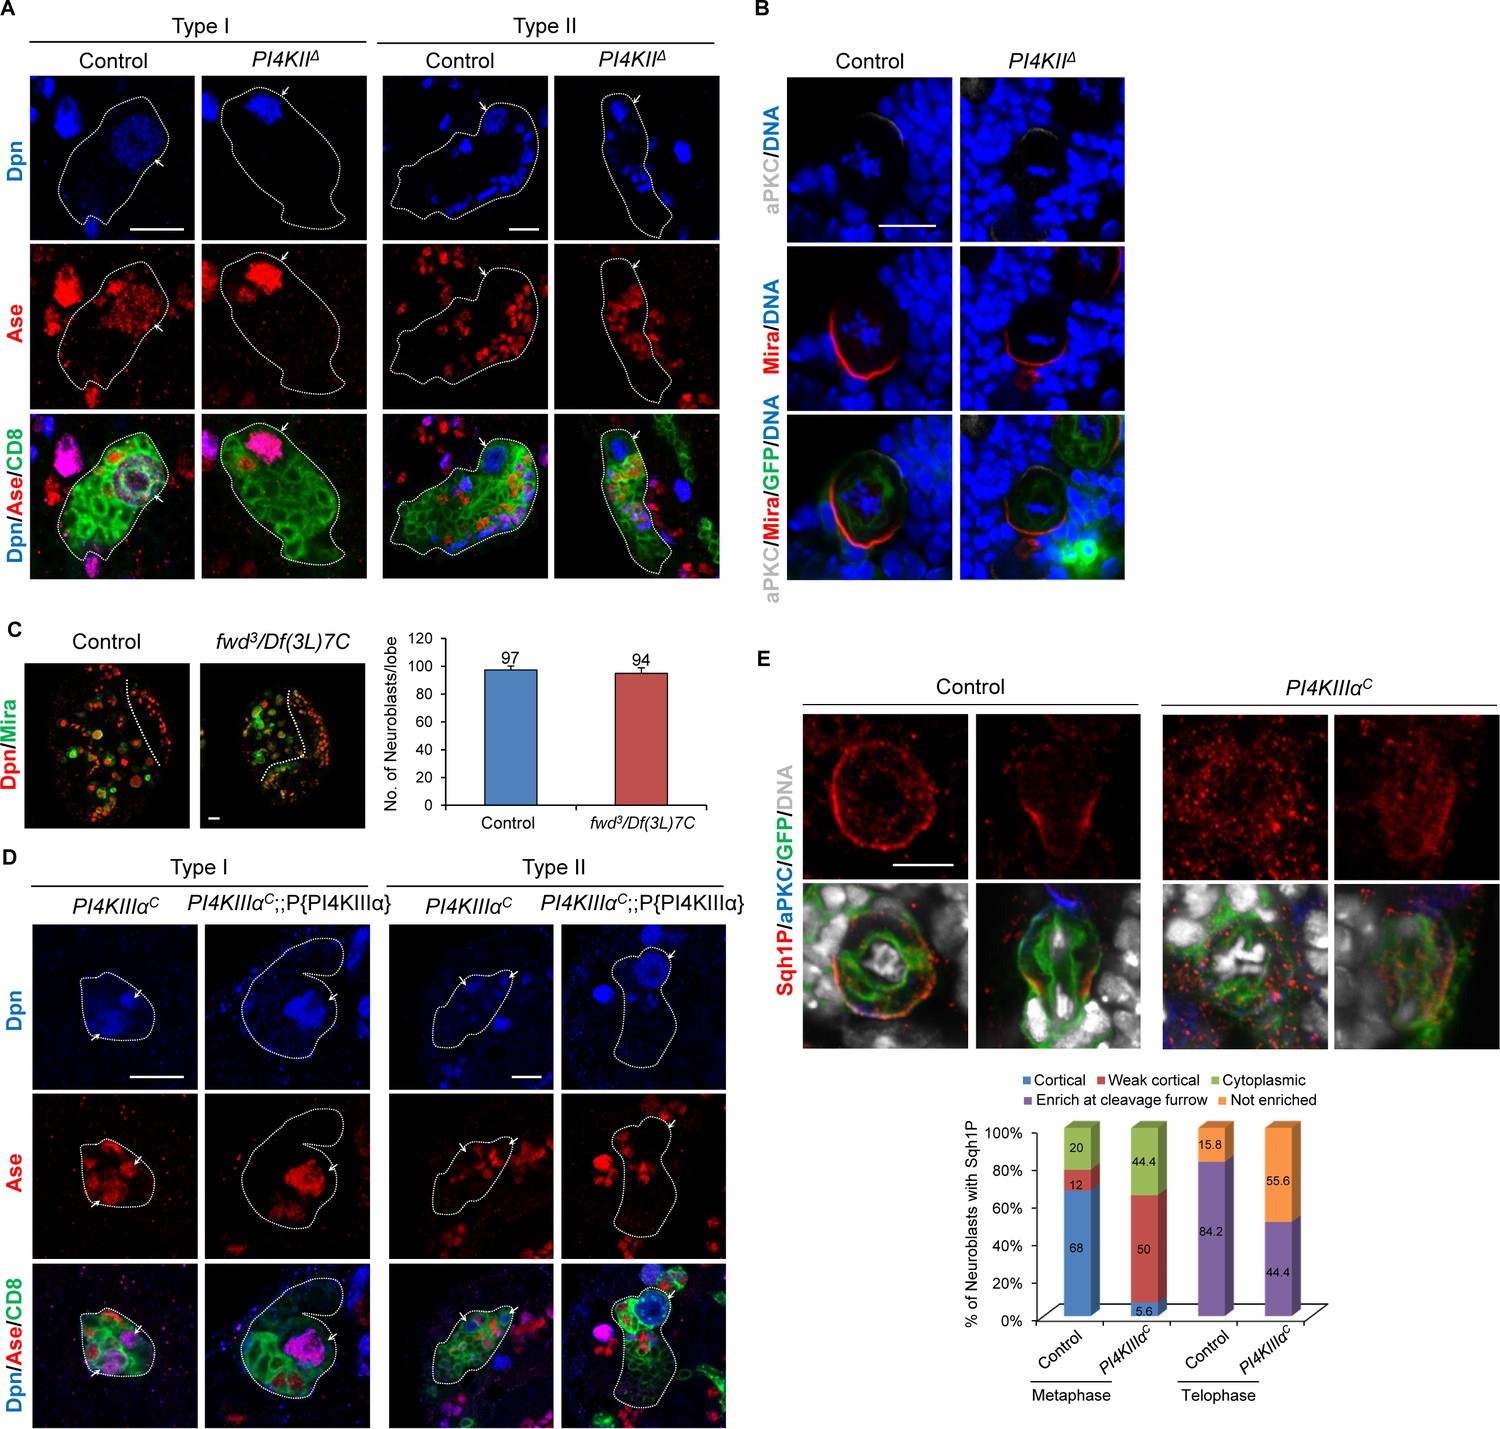
PI4KIIIα, but not PI4KIIIβ or PI4KIIα regulates neuroblast asymmetric division and homeostasis.
(A) Type I and type II MARCM clones of control and PI4KIIΔ were labeled with Dpn (blue), Ase (red) and CD8 (green). Arrows indicate neuroblasts. Clones were marked by CD8::GFP and indicated by white dotted line. (B) Neuroblasts of control and PI4KIIΔ MARCM clones were labeled with aPKC (grey), Mira (red), GFP (green) and DNA (blue). (C) Larval brains of control and fwd3/Df(3L)7C hemizygotes were labeled with Dpn (red) and Mira (green). Quantification of neuroblast number per brain hemisphere for control and fwd3 hemizygotes is shown beside the images. (D) Type I and type II MARCM clones of PI4KIIIαC and PI4KIIIαC;; P{w+, PI4KIIIα} (genomic PI4KIIIα) were labeled with Dpn (blue), Ase (red) and CD8 (green). Arrows indicate neuroblasts. Clones were marked by CD8::GFP and indicated by white dotted line. (E) Neuroblasts of control and PI4KIIIαC MARCM clones were labeled with Sqh1P (red), aPKC (blue), GFP (green) and DAPI (grey). Quantification for Sqh1P localization is shown right below the images. ‘Not enriched’ in quantification legend refers to no enriched localization at cleavage furrow. Scale bars, 10 µm (A–D), 5 µm (E).
Figure 7—figure supplement 2
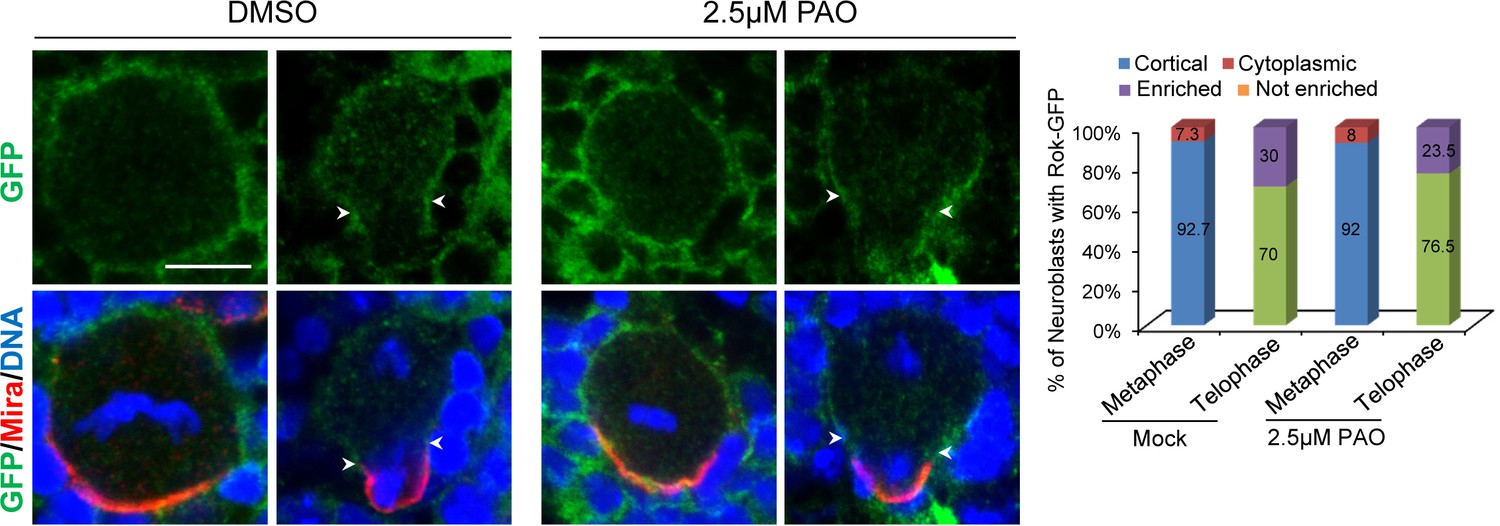
PI4KIIIα does not regulate Rok localization in neuroblasts.
Neuroblasts expressing Ubi-Rok::GFP were treated with mock (DMSO) or 2.5 μM PAO in DMSO and were labeled with GFP (green), Mira (green) and DNA (blue). Both metaphase and telophase neuroblasts were shown. Arrowheads indicate position of cleavage furrow. Percentage of neuroblasts with various localization patterns of Rok-GFP was labeled on the column of each genotype. Sample sizes: mock metaphase neuroblasts, n = 55; mock telophase neuroblasts, n = 20; PAO treated metaphase neuroblasts, n = 112; PAO-treated telophase, n = 17. ‘Enriched’ in quantification legend refers to enriched localization at cleavage furrow, whereas ‘Not enriched’ refers to no enriched localization at cleavage furrow. Scale bar, 5 µm.
Author response image 1
Tables
Table 1
List of primers used
https://doi.org/10.7554/eLife.33555.021| Primer name | Primer sequence (5'−3') | Purpose |
|---|---|---|
| Vib pENTR F | CACC ATG CAG ATC AAA GAA TTC CGT GTG | Generate Vib pENTR |
| Vib pENTR R | TTA ATC GGC ATC CGC GCG C | |
| Vib pENTR CT R | ATC GGC ATC CGC GCG CAT | Generate Vib pENTR without stop codon |
| Vib T63A F | TAC AAT TCC GGT CAA TAT GCC TAT AAG | Generate T63A mutation |
| Vib T63A R | CTT ATA GGC ATA TTG ACC GGA ATT GTA | |
| Vib T63E F | TAC AAT TCC GGT CAA TAT GAG TAT AAG | Generate T63E mutation |
| Vib T63E R | CTT ATA CTC ATA TTG ACC GGA ATT GTA | |
| Sqh pENTR F | CACC ATG TCA TCC CGT AAG ACC GC | Generate Sqh pENTR |
| Sqh pENTR R | TTA CTG CTC ATC CTT GTC CTT GG | |
| PITPα pENTR F | CACC ATG GTG CTG CTC AAG GAA TA | Generate PITPα pENTR |
| PITPα pENTR R | GTC ATC TGC TGT CAT TCC TTT CA | |
| PITPβ pENTR F | CACC ATG GTG CTG ATT AAG GAA TTC CG | Generate PITPβ pENTR |
| PITPβ pENTR R | GGC ATC AGC AGC CGA CGT GC | |
| Modifier pD221 F | GGGG ACAAGTTTGTACAAAAAAGCAGGCTTC GGTACCGCTGAAACGAAGTTAAACTTTGAGGTGTACGG GTAAGTATTAGAAAGCAGGACTAAACG | Modify pDONR221 to remove RfB cassette from BiFC constructs |
| Modifier pD221 R | GGGG ACCACTTTGTACAAGAAAGCTGGGTC AAGCTTCTATTCAATGGTCCGGCGGCCGACGACATGAGG ATATGGTCGTTTAGTCCTGCTTTCTAA |
Additional files
-
Transparent reporting form
- https://doi.org/10.7554/eLife.33555.022
Download links
A two-part list of links to download the article, or parts of the article, in various formats.
Downloads (link to download the article as PDF)
Open citations (links to open the citations from this article in various online reference manager services)
Cite this article (links to download the citations from this article in formats compatible with various reference manager tools)
Vibrator and PI4KIIIα govern neuroblast polarity by anchoring non-muscle myosin II
eLife 7:e33555.
https://doi.org/10.7554/eLife.33555


