Structural basis of proton translocation and force generation in mitochondrial ATP synthase
- Max Planck Institute of Biophysics, Germany
Figures
Figure 1 with 3 supplements
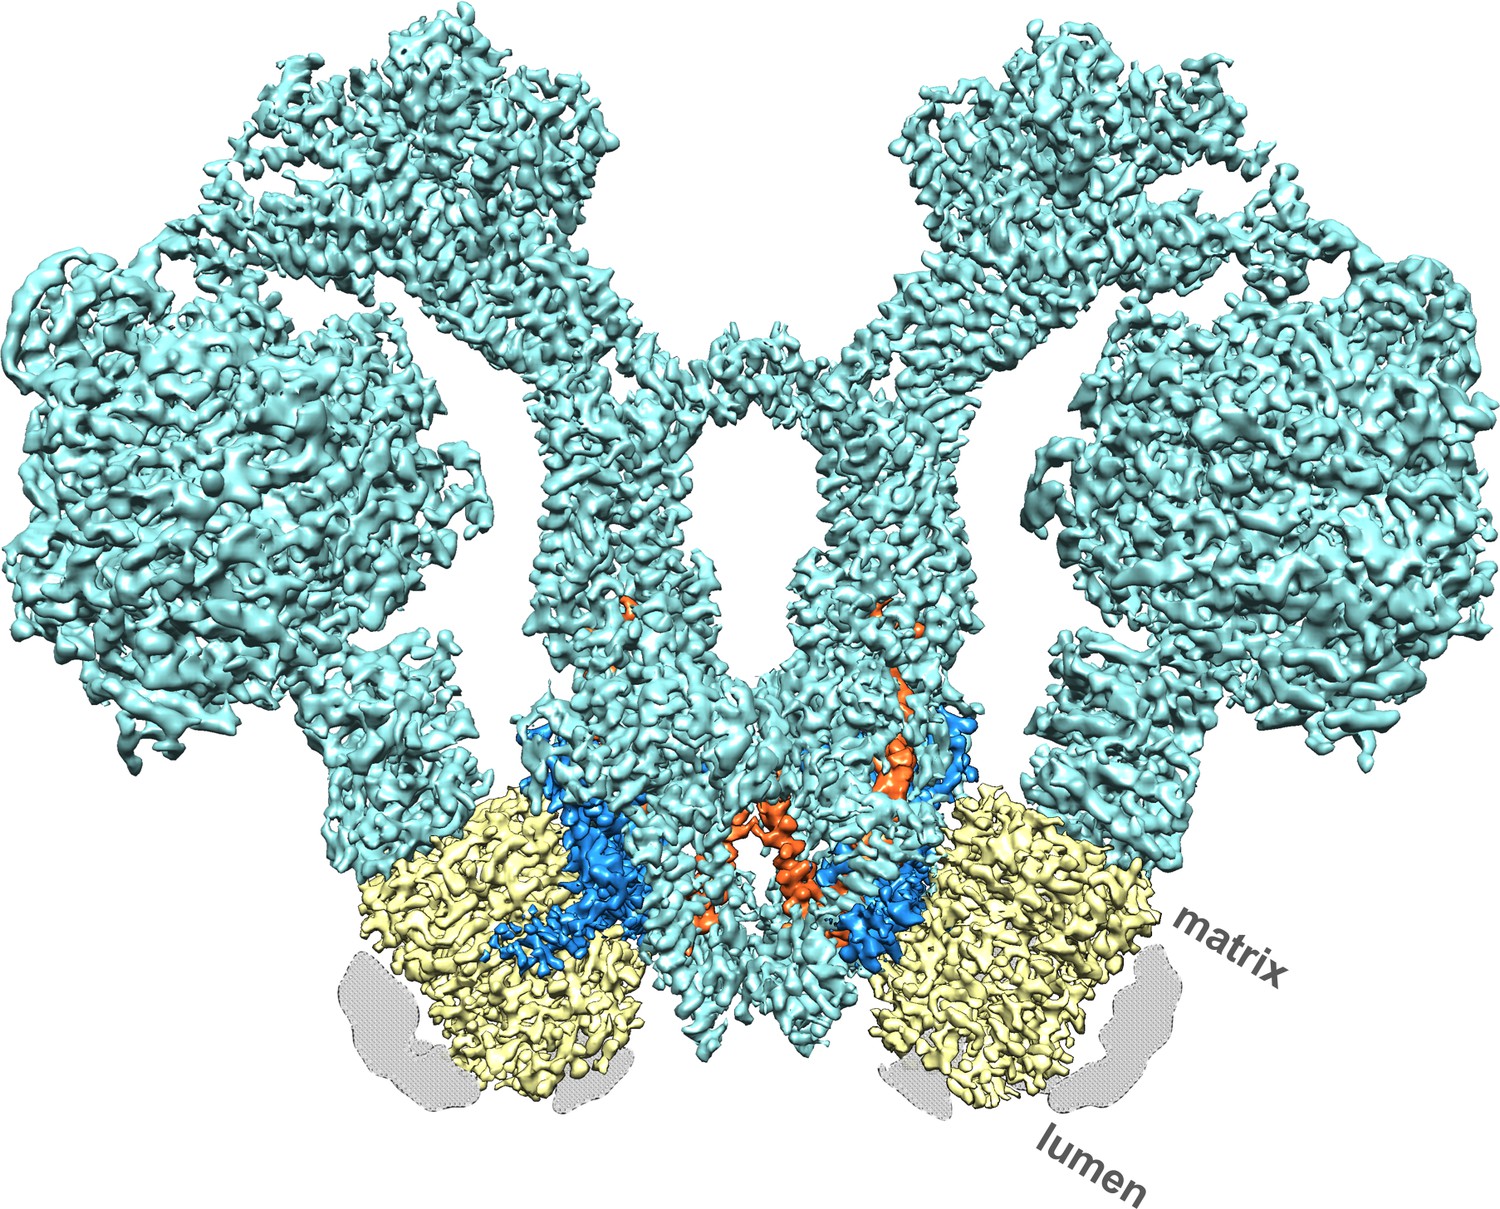
Cryo-EM structure of the Polytomella sp.
F1 Fo ATP synthase dimer at 4.1 Å resolution. Subunit a, blue; c-ring, yellow; ASA 6, brick; other subunits, cyan; detergent micelle, grey.
Figure 1—figure supplement 1

Schematic diagram of ATP synthase dimer from mitochondria of Polytomella sp.
c-ring rotor, yellow; subunit a, dark blue; subunit ASA 6, brick; α and β subunits of catalytic F1 head, green; central stalk subunits, light blue; oligomycin-sensitivity conferring protein (OSCP), pink; peripheral stalk consisting of subunits ASA 1–9, light grey; membrane, dark grey.
Figure 1—figure supplement 2
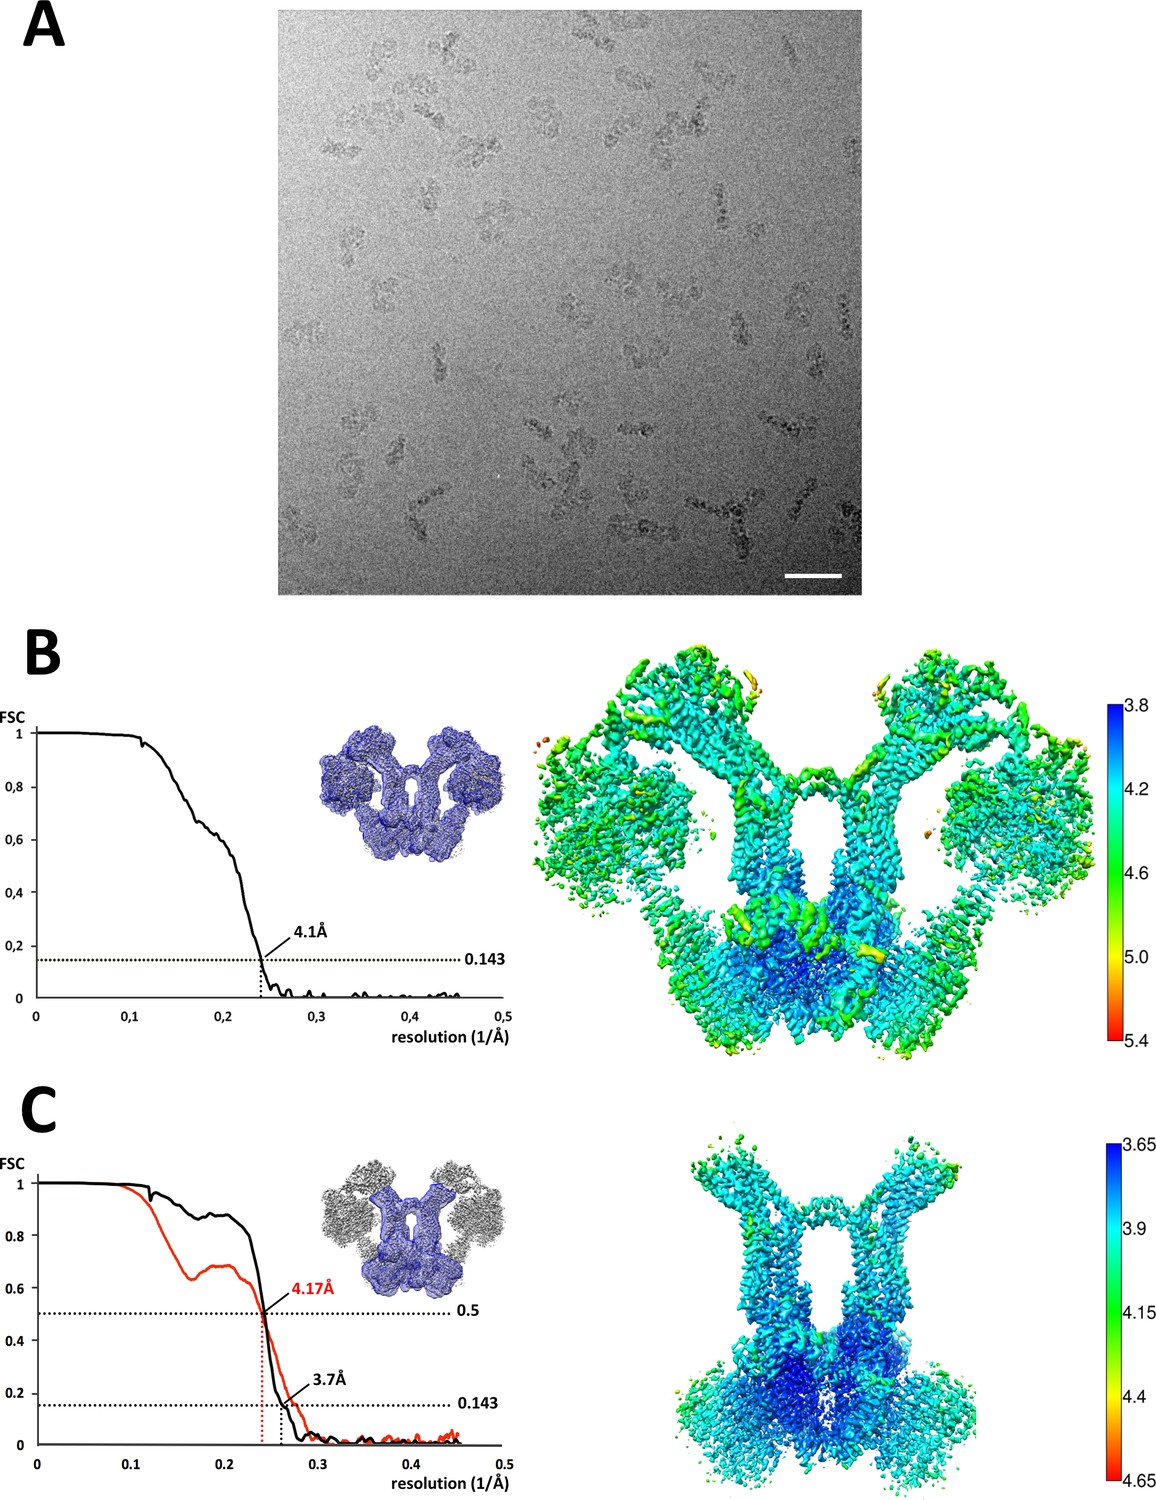
Cryo-EM of Polytomella sp.ATP synthase dimer.
(A) Electron micrograph of detergent-solubilised ATP synthase dimers. Scale bar, 500 Å; (B) Fourier shell correlation (FSC) curve and local resolution for the 1.6 MDa dimer indicate 4.1 Å overall resolution; (C) The local resolution of the peripheral stalk and Fo subcomplex (blue mask) including subunit a, ASA 6 and the c-ring is 3.7 Å. The map-to-model FSC (red curve) shows the correlation between the masked experimental cryo-EM map and a density map generated from the final refined model. Local resolution calculated by LocalRes in Relion.
Figure 1—figure supplement 3

Subunit a sequence alignment.
Strictly conserved aArg239, light blue; conserved charged and polar residues, pink; small residues aAla246, aGly247 and aAla292 at the point where the lumenal channel passes between H5 and H6, green; large hydrophobic spacers in H5 and H6, yellow; disease-relevant residues, orange. Brackets mark polypeptide regions lining the lumenal (red) or matrix (blue) channels. Helices H1 to H6 are indicated. An asterisk (*) indicates strictly conserved residues; (:) and (.) indicate highly conserved or similar residues. The arrangement of helices and connecting loops is shown below.
Figure 2 with 1 supplement
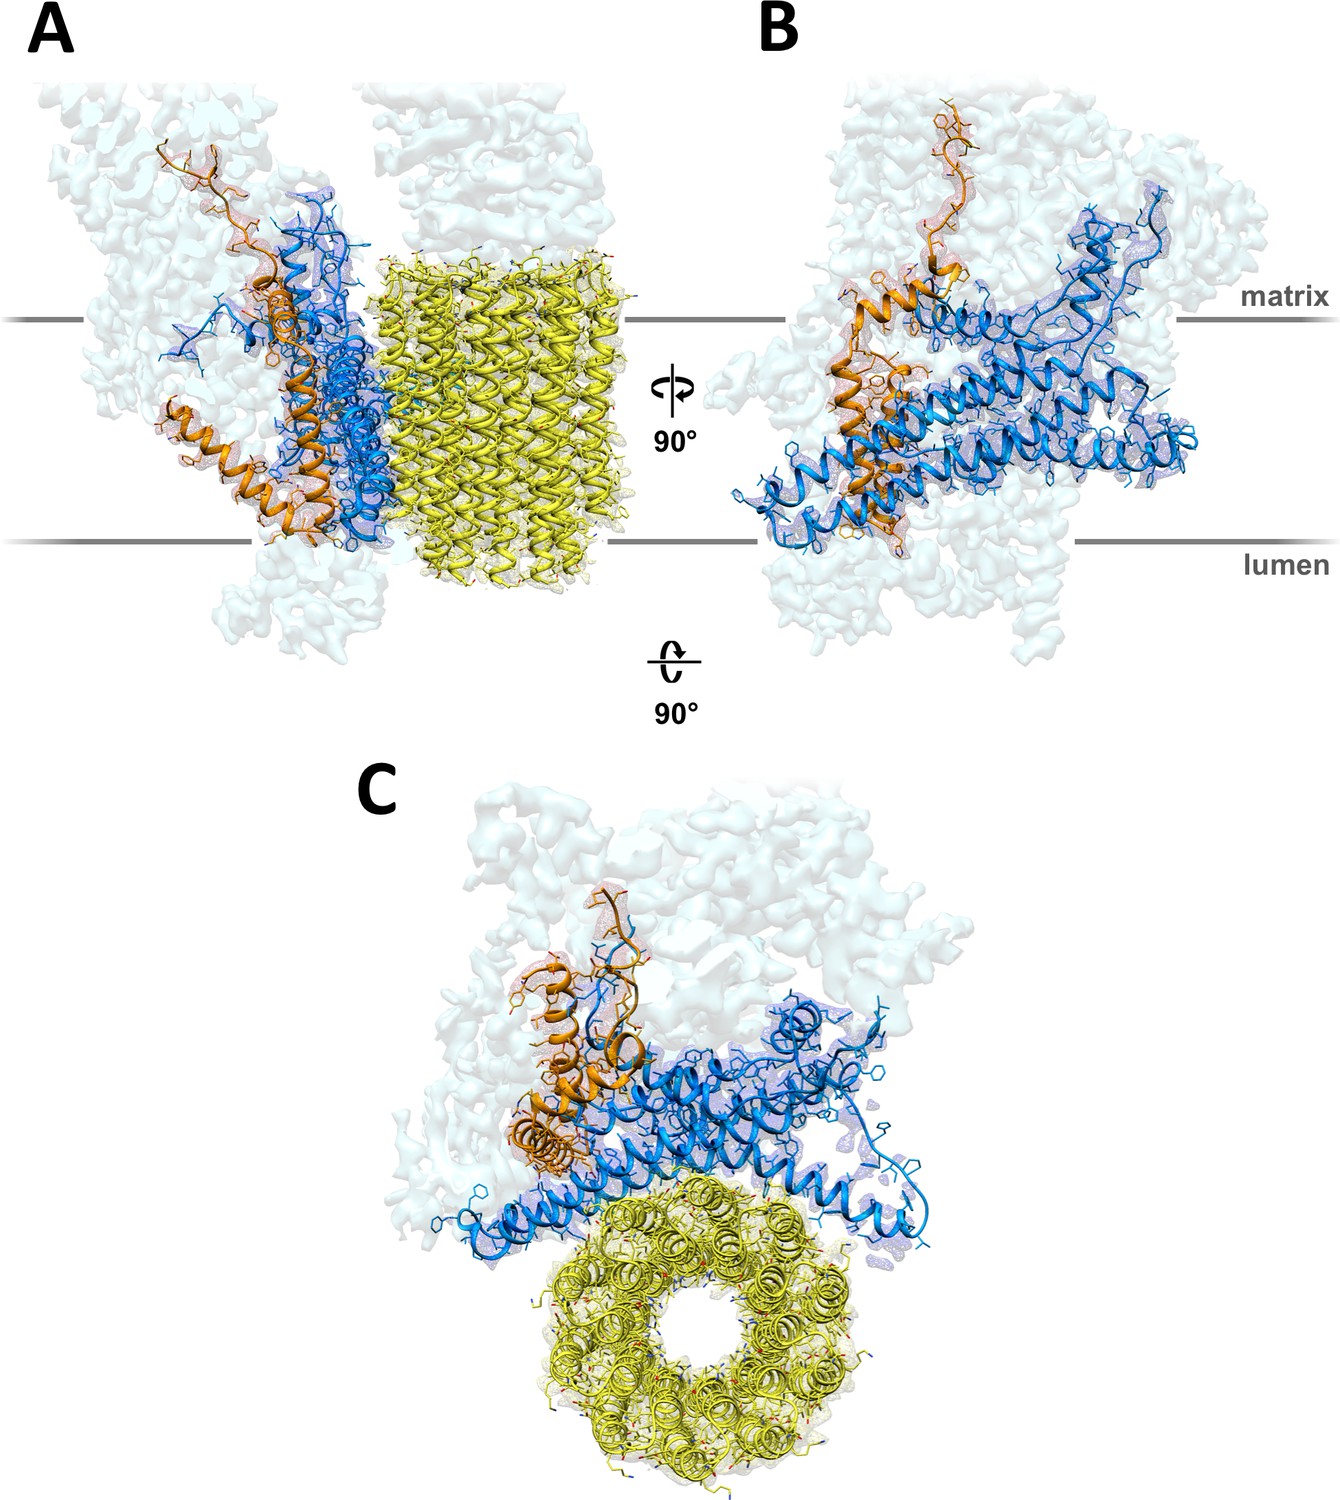
3.7 Å map of Polytomella Fo subcomplex with fitted atomic models.
(A) Side view with fitted subunit a, trans-membrane helices of ASA 6 and c-ring. (B) Subunit a and ASA 6 seen from the c-ring. (C) subunit a, c-ring and ASA 6 seen from the matrix. Subunit a, blue; c-ring, yellow; ASA 6, brick; other subunits, light cyan.
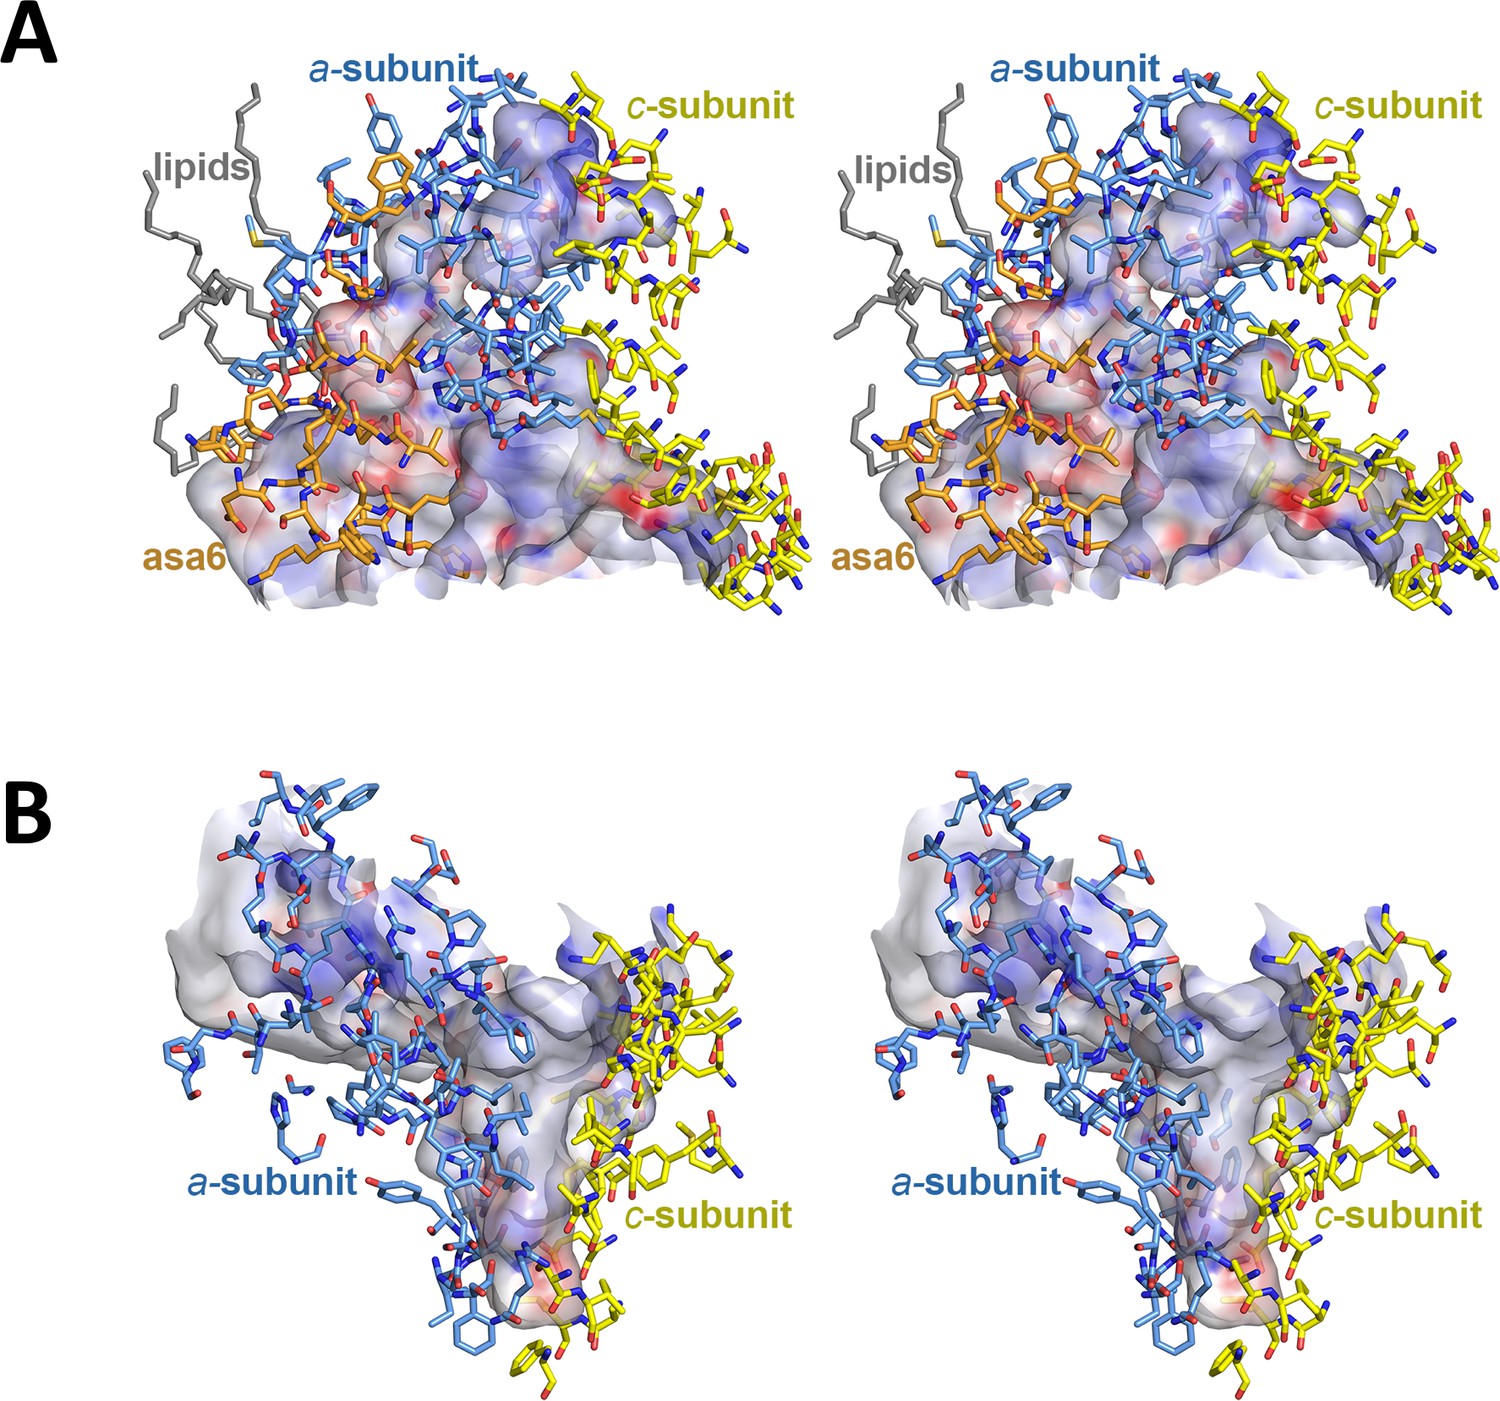
Figure 2—figure supplement 1
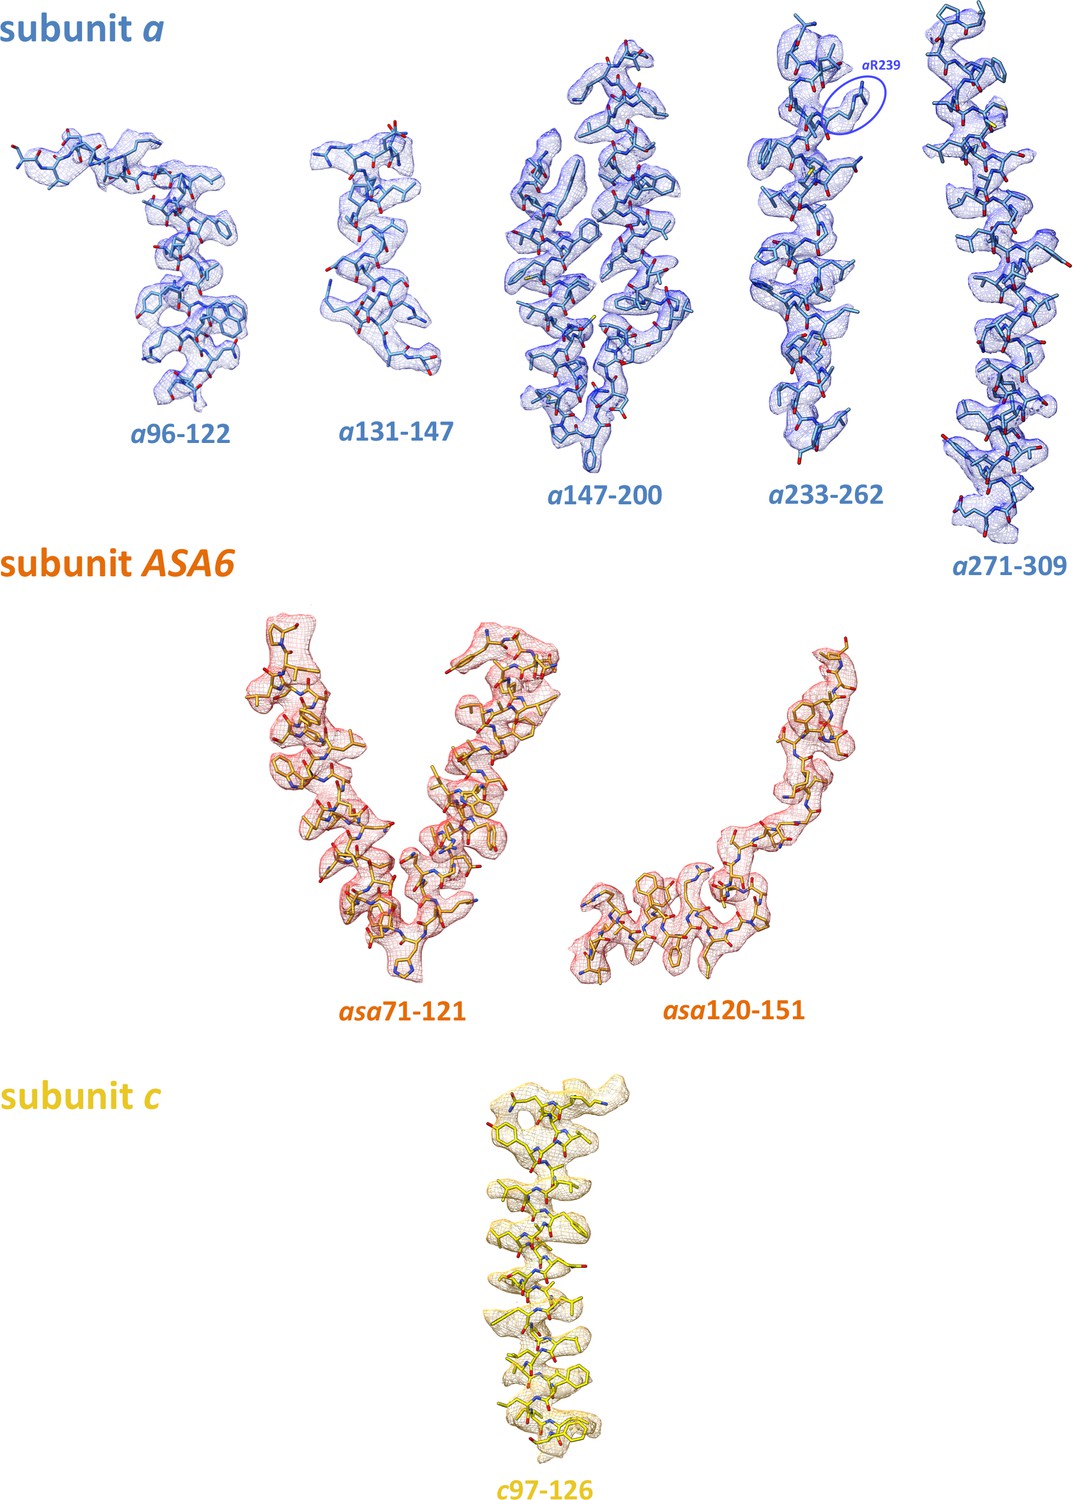
3.7 Å map with fitted atomic models.
Subunit a, blue; ASA 6, brick; c10-ring, yellow. The strictly conserved aArg239 in its well-defined map density is highlighted (blue ellipse).
Figure 3
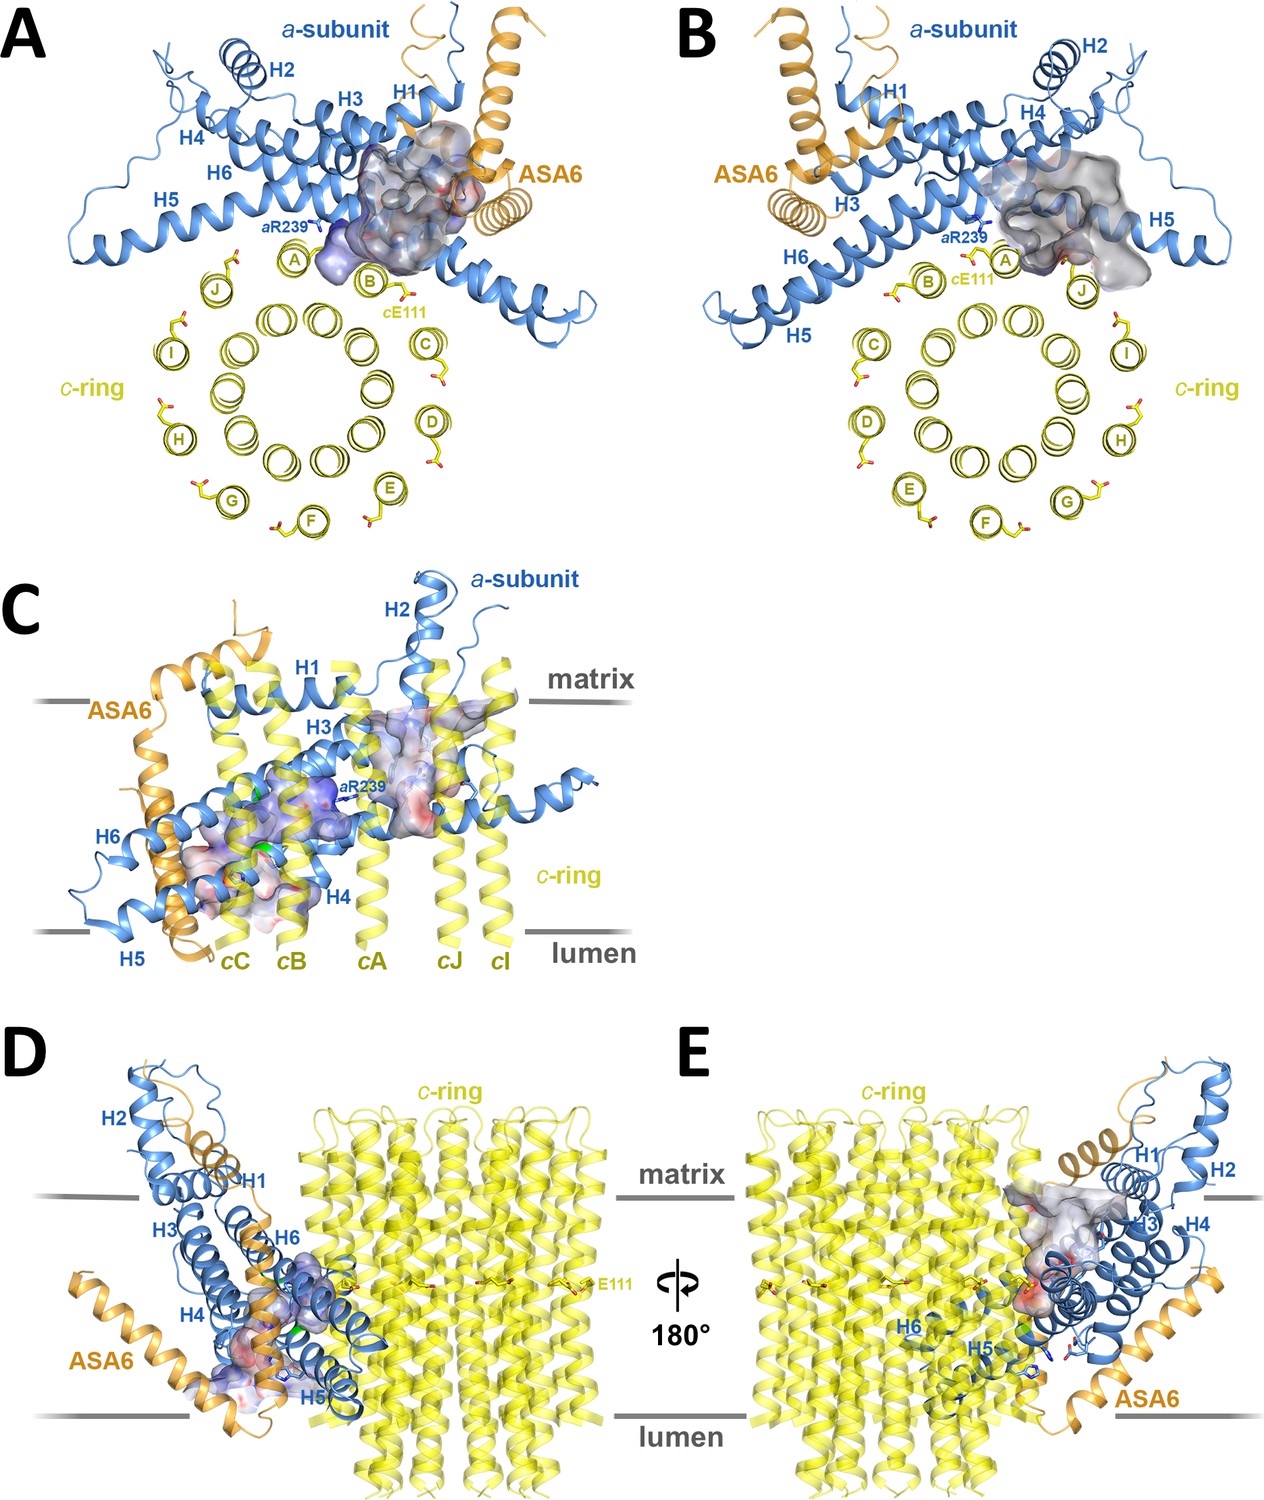
Two aqueous channels in Fo.
(A) Lumenal channel seen from the crista lumen. (B) Matrix channel seen from the matrix. (C) Side view of both channels seen from the c-ring, with outer c-ring helices in transparent yellow. Lumenal channel, left; matrix channel, right. The strictly conserved aArg239 in H5 separates the lumenal and matrix channels. (D) The lumenal channel passes through the H5/H6 hairpin at the small sidechains aAla246, aGly247 (H5) and aAla292 (H6) (green). (E) H4, the N-terminal half of H5 and the connecting H4/H5 loop at the matrix channel. Subunit a, blue; c10-ring, yellow; ASA 6, brick. Channels are shown as potential surfaces (red, negative; blue, positive; grey, neutral). (A) and (B) display a 5 Å slice of the c10-ring at the level of the protonated cGlu111.
Figure 4 with 3 supplements
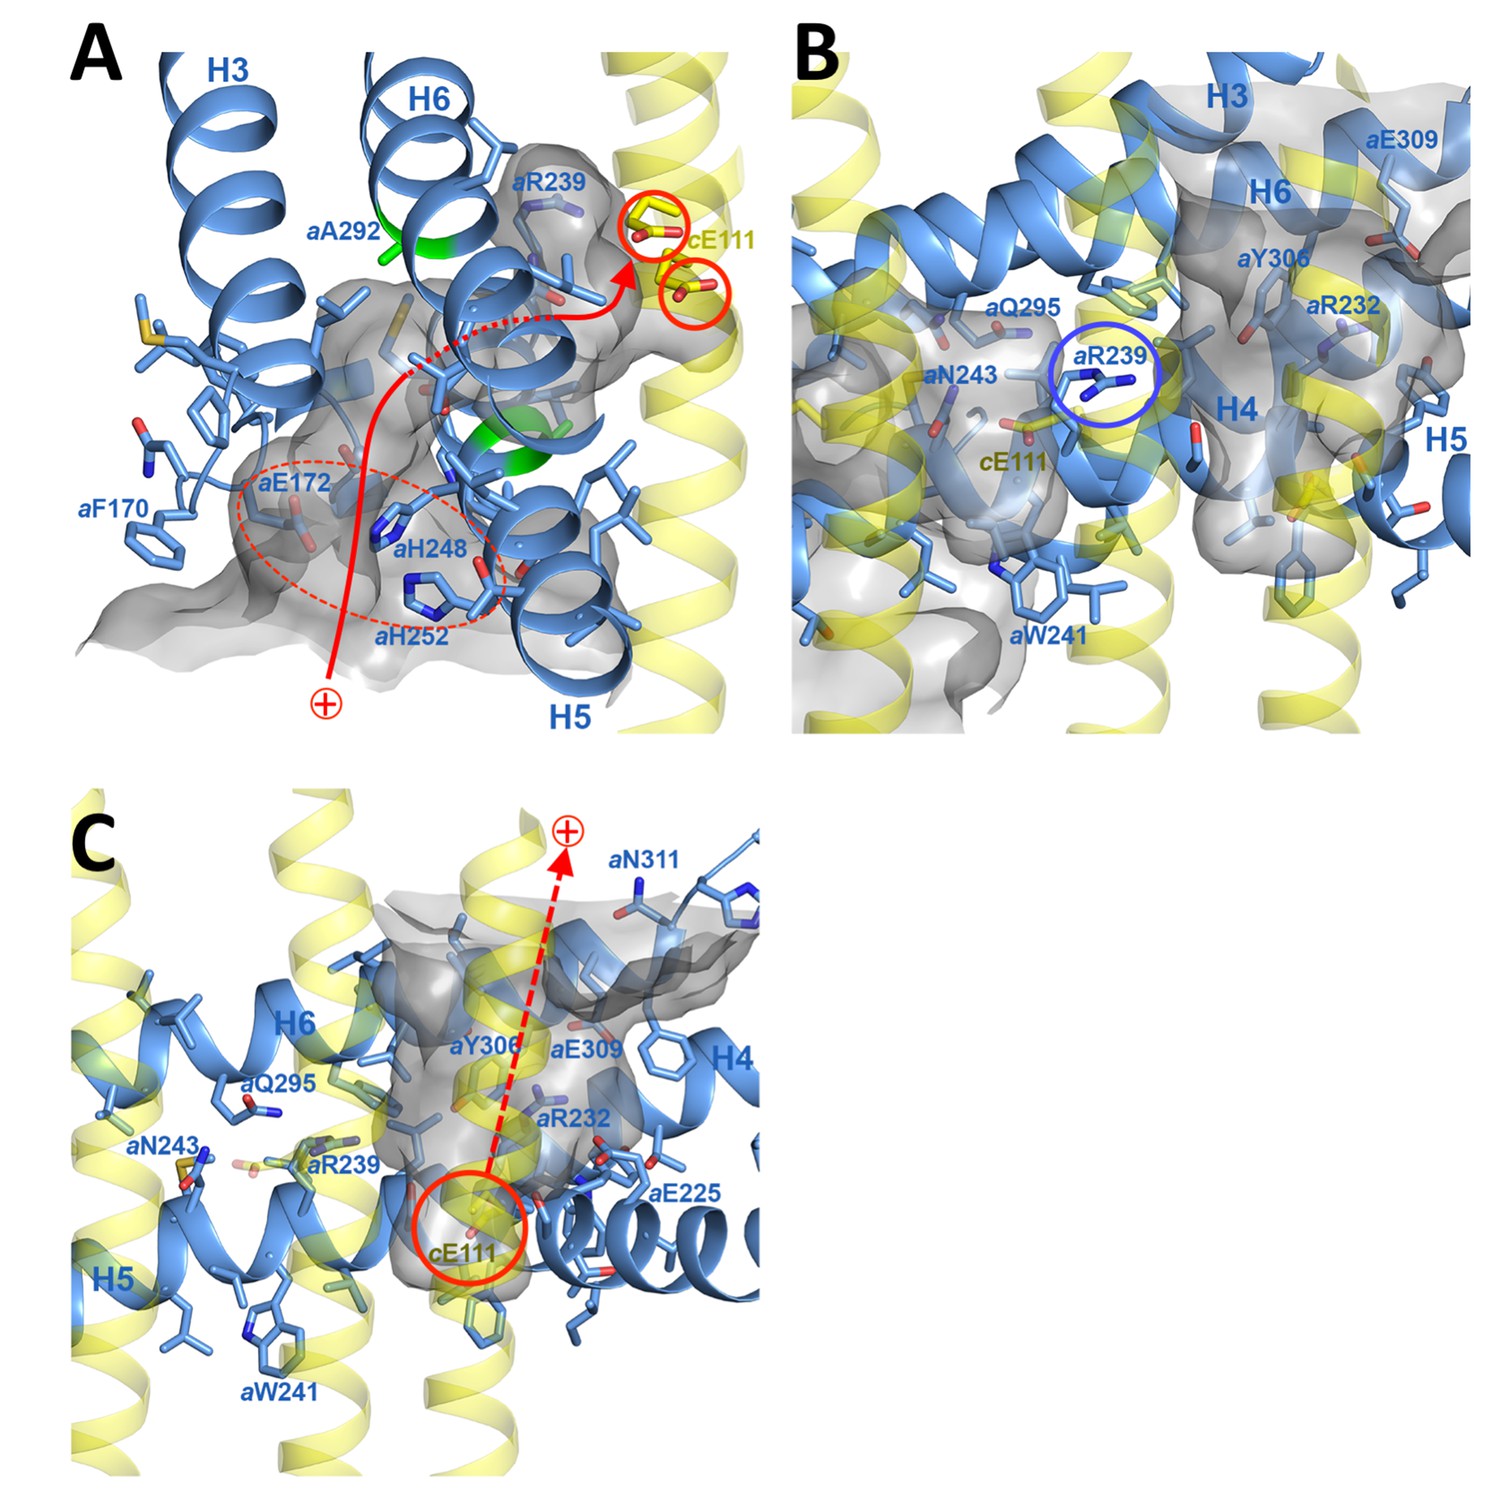
Proton pathway through the Fo subcomplex.
(A) In the lumenal channel, protons (red arrow) pass via the local proton reservoir of aGlu172, aHis248, aHis252 and aGlu288 (dashed red ellipse) through the H5/H6 helix hairpin at the small sidechains of aAla246, aGly247 (H5) and aAla292 (H6) (green) to cGlu111 in the rotor ring c-subunits (red circles). (B) aArg239 (blue circle) is located halfway between the lumenal channel on the left and the matrix channel on the right, forming a seal to prevent proton leakage. c-ring helices (transparent yellow) with cGlu111 are seen in the foreground. (C) In the matrix channel, protons (dashed red arrow) can pass straight from the deprotonated cGlu111 to the pH 8 matrix. Subunit a, blue; adjacent c-ring helices, transparent yellow; aqueous channels, translucent grey; residues in stick representation. Figure 4—figure supplement 1 shows the fitted model together with the map density in stereo.
Figure 4—figure supplement 1
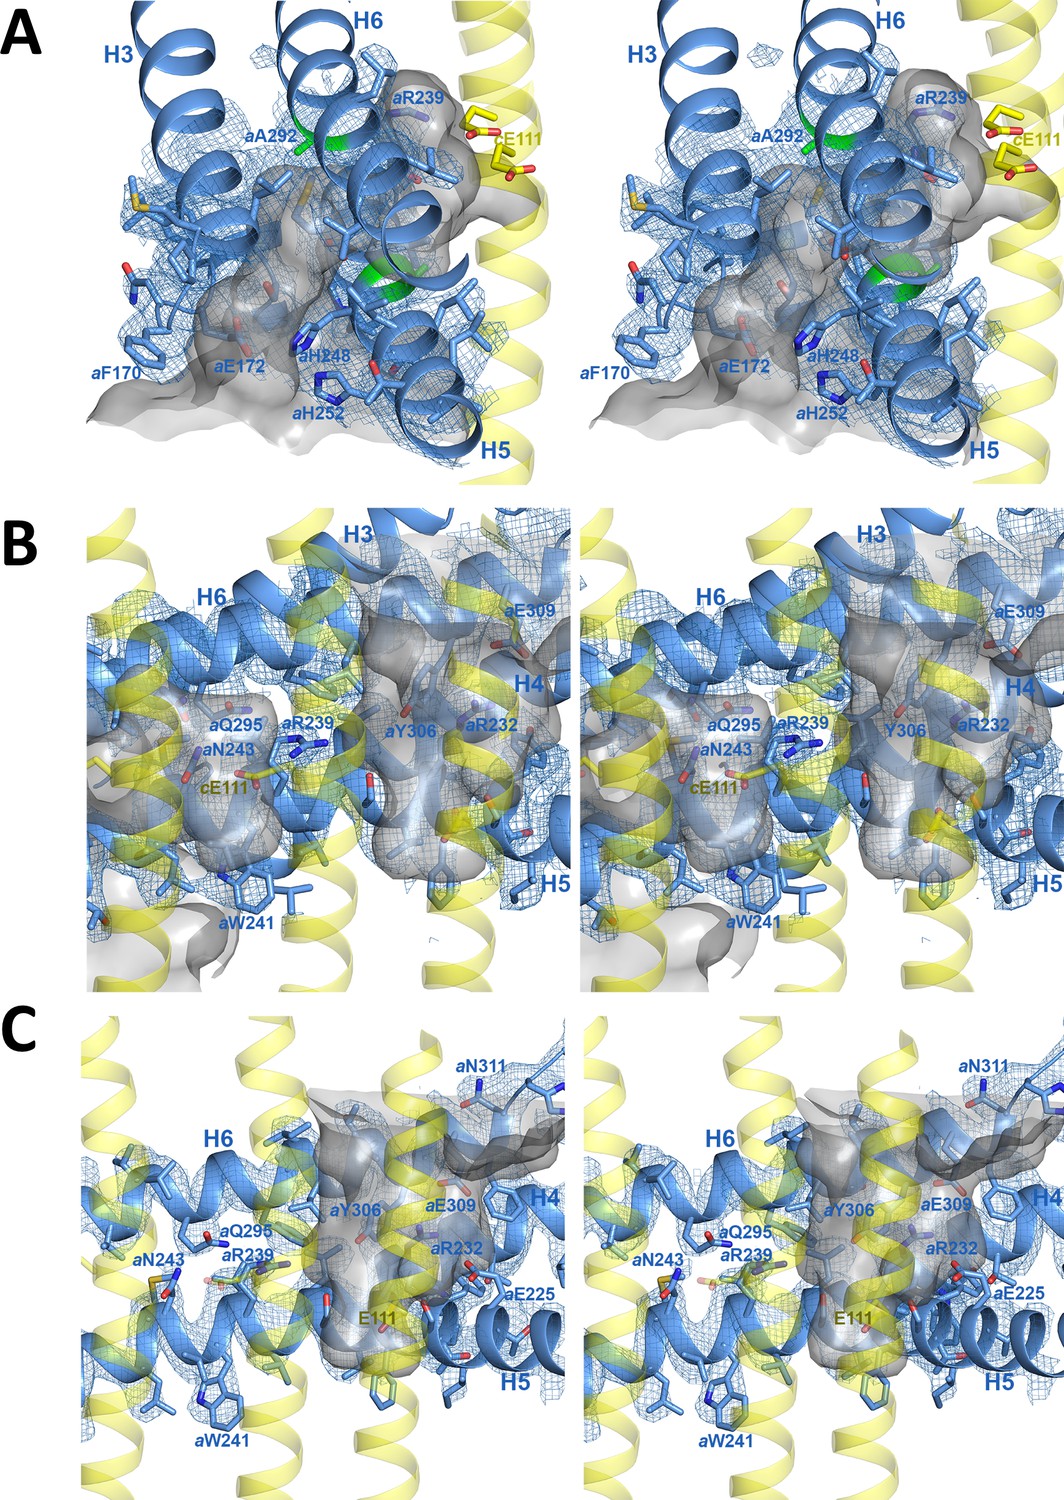
Stereo diagrams of map density (blue mesh) with fitted atomic models.
(A) Lumenal channel passing through the H5/H6 helix hairpin at aAla246, aGly247 (H5) and aAla292 (H6) (green). (B) aArg239 is located halfway between the lumenal channel on the left and the matrix channel on the right. c-ring helices (transparent yellow) with cGlu111 are seen in the foreground. (C) Matrix channel. Subunit a, blue; adjacent c-ring helices, transparent yellow; aqueous channels, translucent grey; residues in stick representation.
Figure 4—figure supplement 2
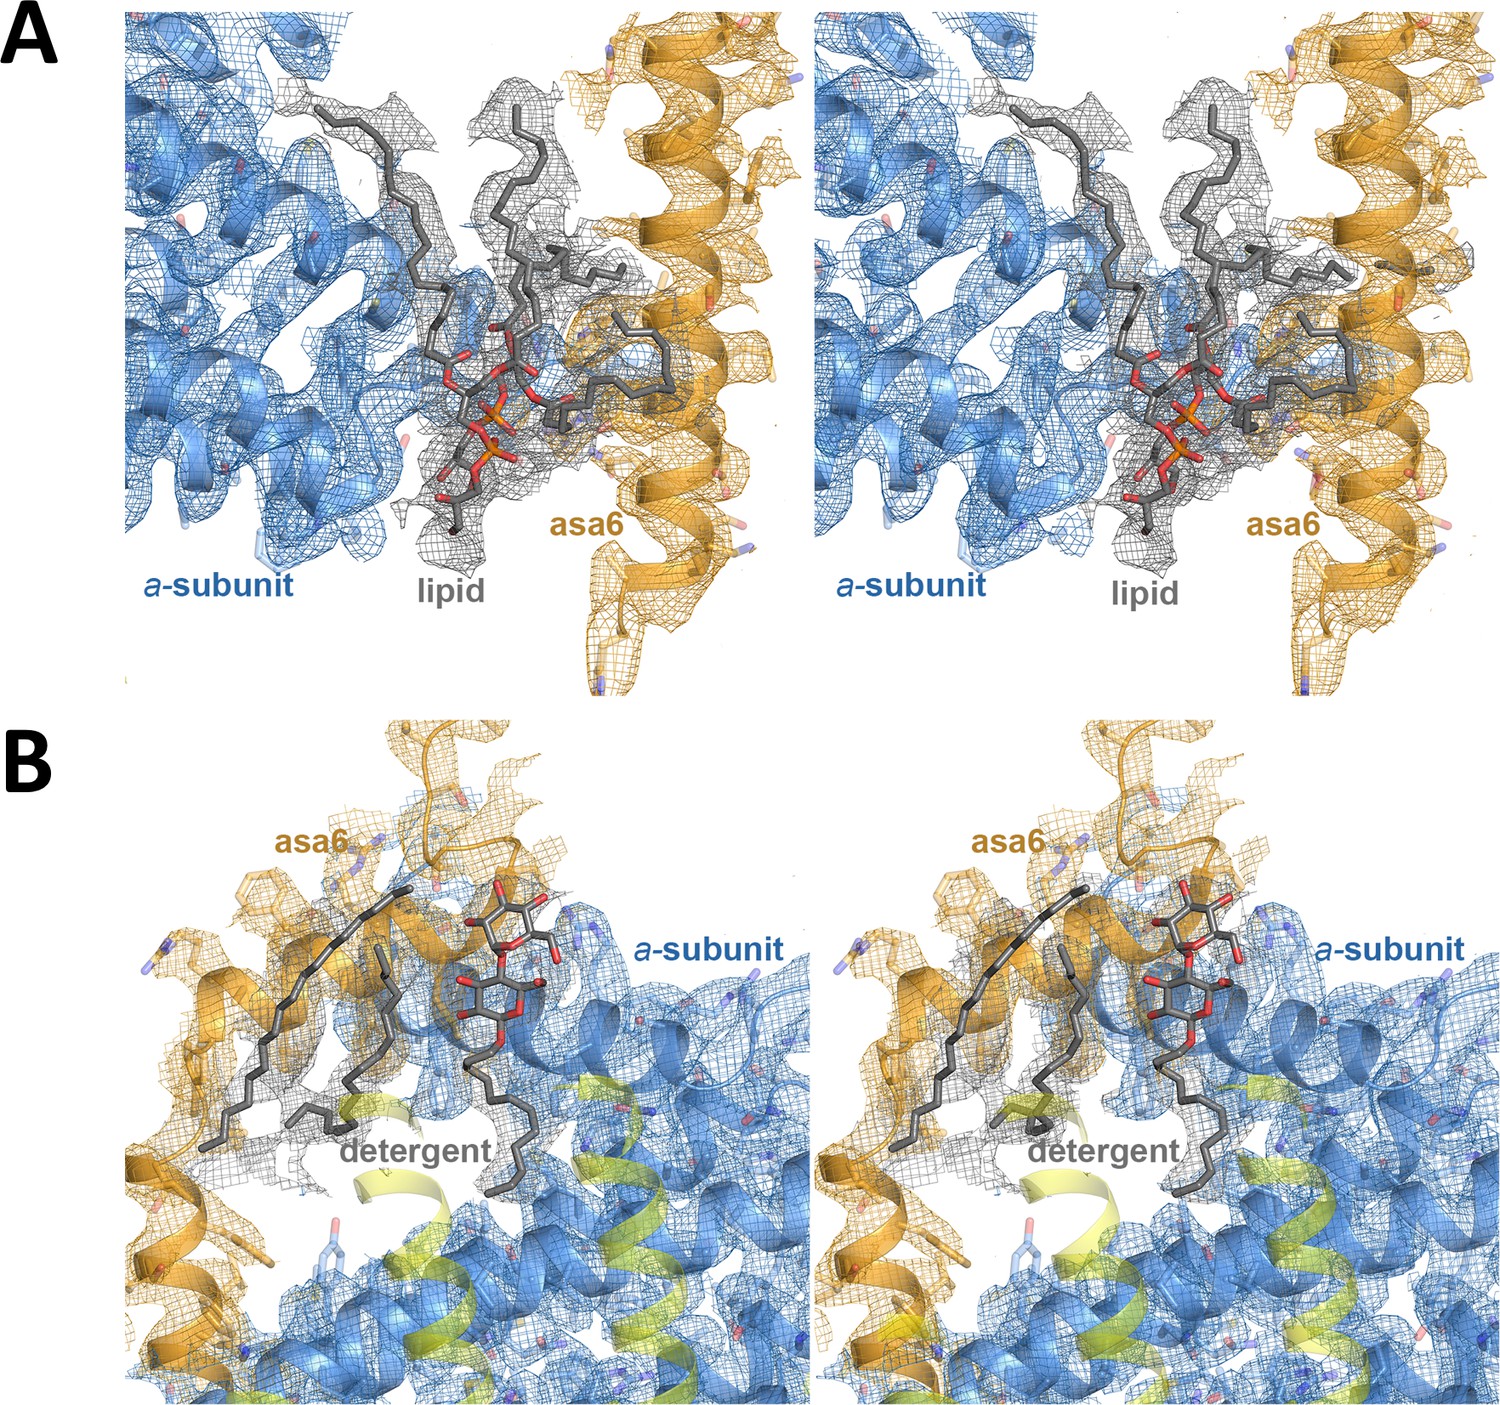
Stereo diagrams of bound lipid detergents.
(A) Lipid density modelled as two phosphatidyl glycerol molecules (grey) between subunit a (blue) and ASA 6 (brick); (B) detergent density modelled as dodecyl maltoside and hydrophobic alkyl chain densities (grey) at the interface between subunit a, ASA 6 and the c-ring.
Figure 4—figure supplement 3
Stereo diagrams of channel-lining residues seen from the protein interior.
(A) Lumenal channel; (B) matrix channel. Sidechains in stick representation are coloured as: subunit a, blue; subunit c-ring, yellow; ASA 6, brick. Channels are shown as potential surfaces (red, negative; blue, positive; grey, neutral). The lumenal channel extends ~32 Å into the Fo subcomplex. At its entrance, it measures 23 Å by 37 Å. The deepest point of the matrix channel ~25 Å below the membrane surface is marked by the hydrophobic subunit a residues aIle227, aPhe231 and c-ring residue cPhe116. Its exit funnel measures 36 Å by 30 Å.
Figure 5 with 1 supplement
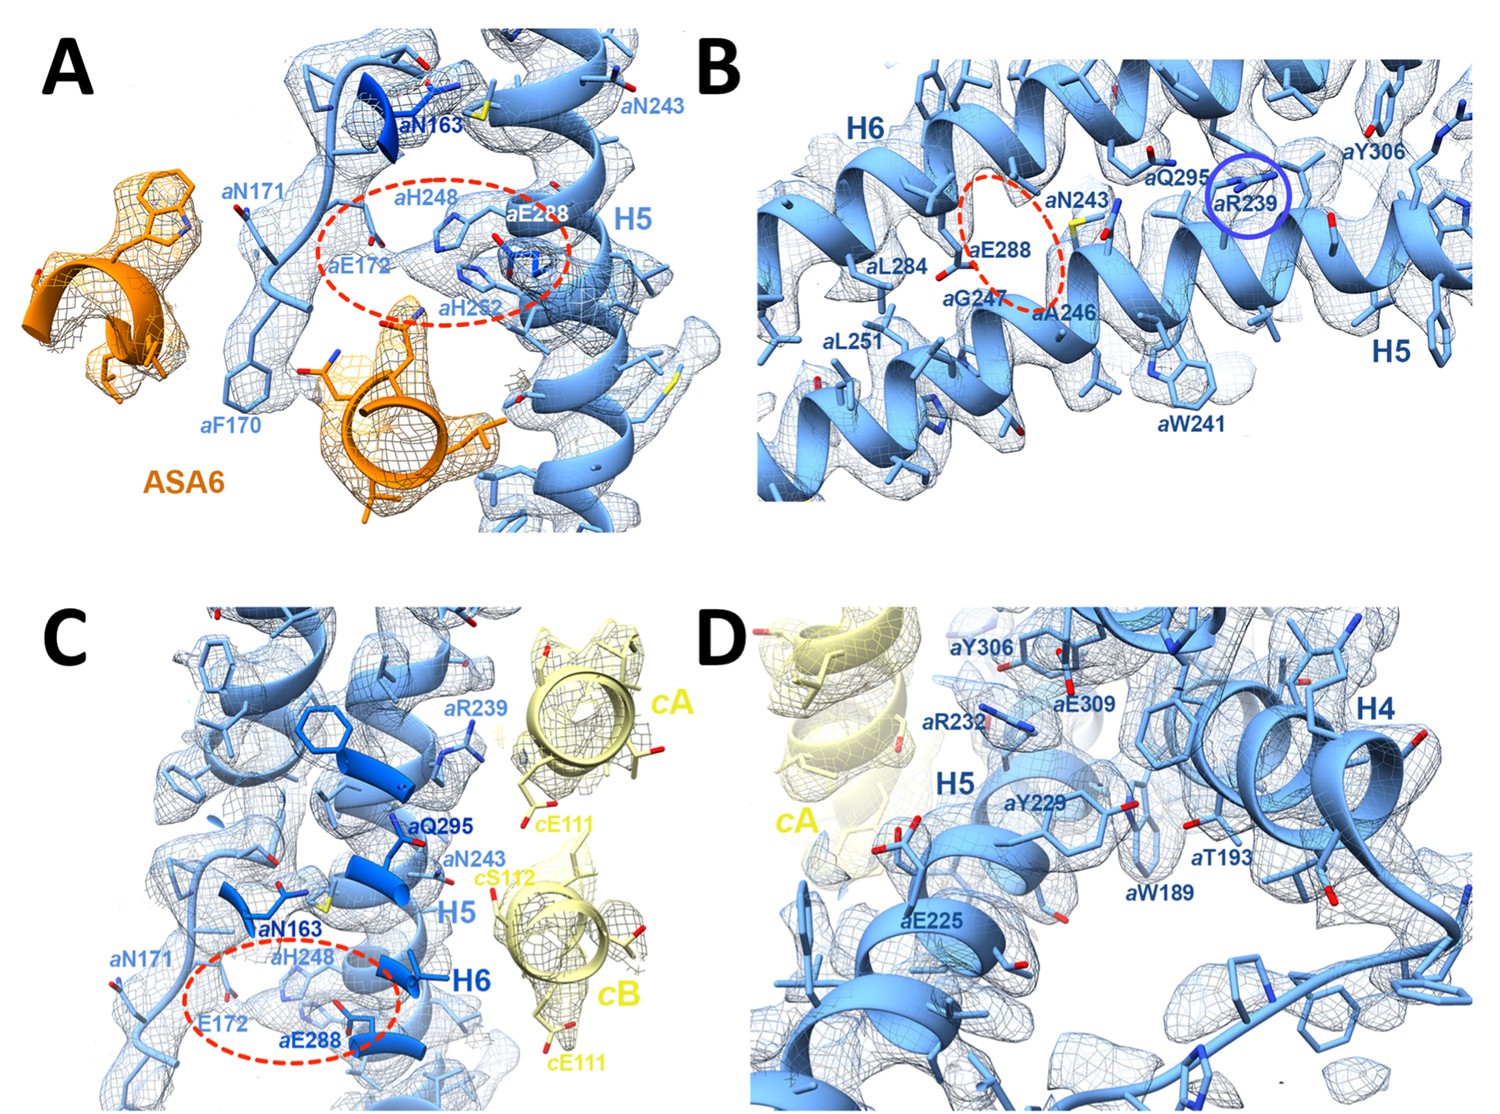
3.7 Å map of functionally important a-subunit residues with fitted atomic model.
(A) Proton reservoir formed by aGlu172, aHis248, aHis252, aGlu288 (dashed red ellipse) in the lumenal channel; (B) Interaction of aAsn243 (H5) and aGln295 (H6) stabilises the H5/H6 hairpin. The space between aGlu288 (H6) and aAsn243 (H5) marks the lumenal channel (dashed red ellipse). (C) Protons in the lumenal channel can pass from aGlu288 to cGlu111 of c-subunit A near aArg239 (H5) via cSer112 and aAsn243. (D) aTrp189 (H4), aThr193 (H4) and aTyr229 (H5) act as wedges between H4 and the N-terminal end of H5, forming two sides of a triangle.
Figure 5—figure supplement 1
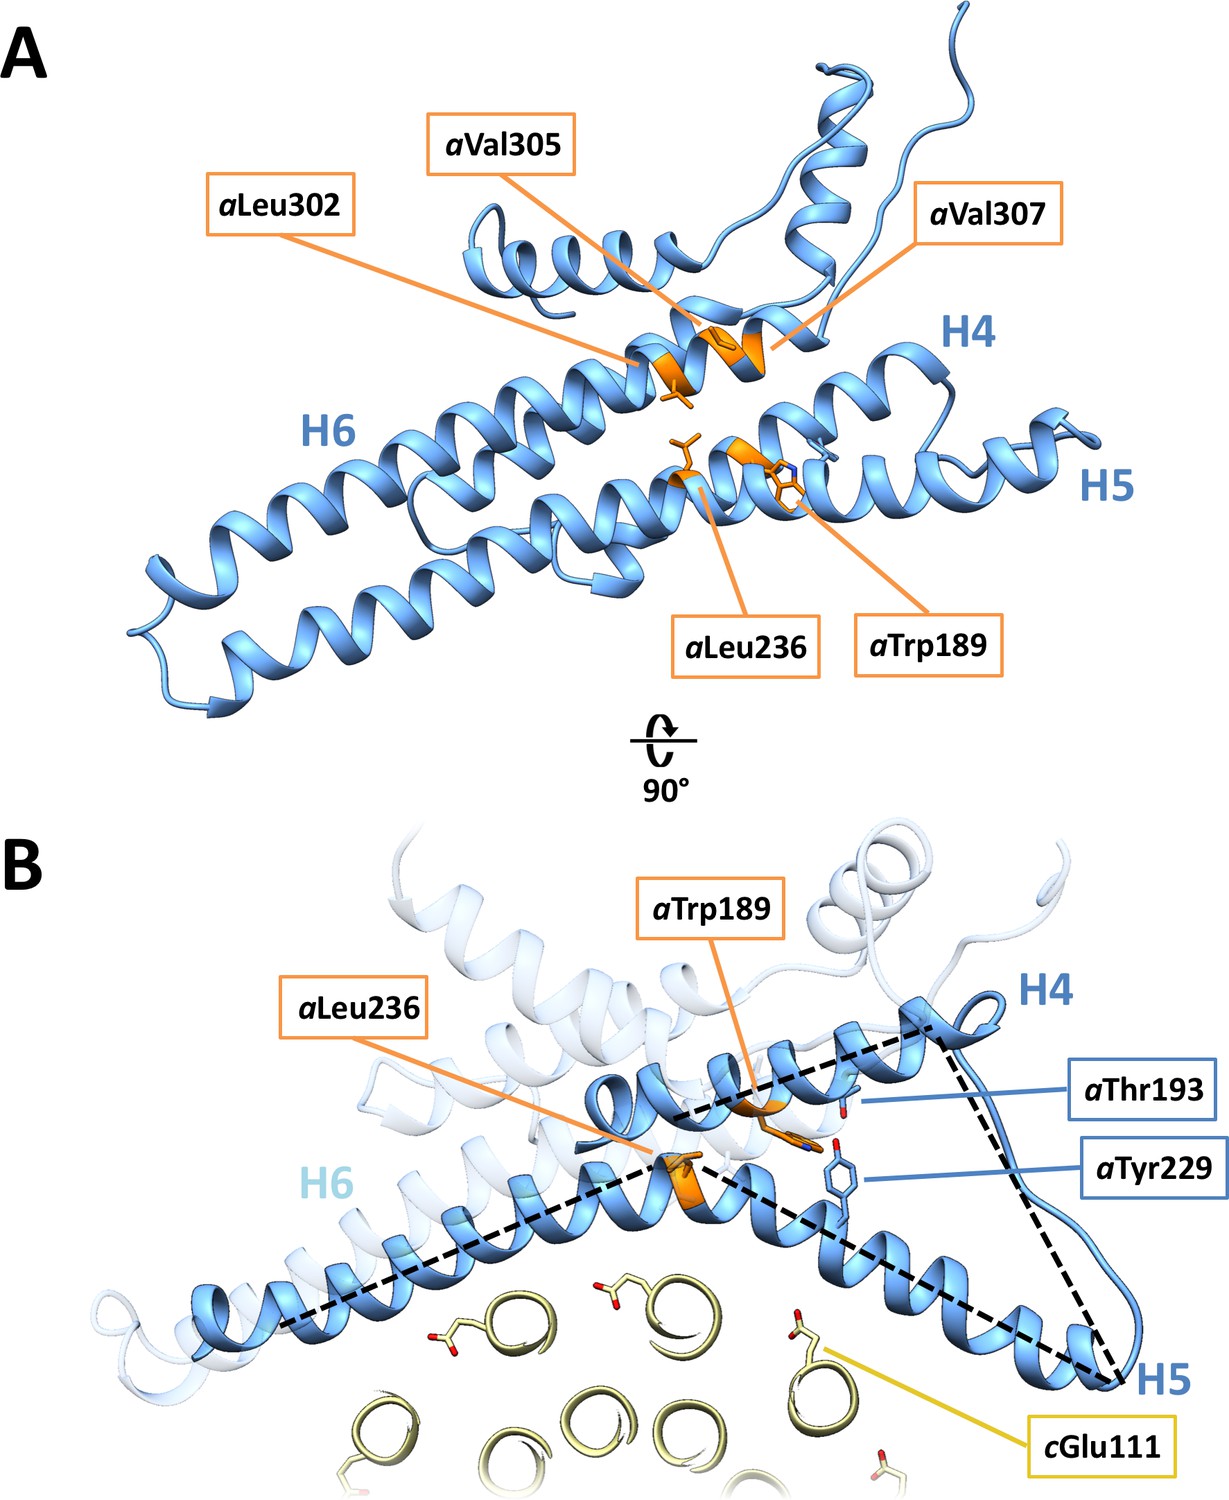
Disease-relevant residues in subunit a.
(A) Residues in a-subunit helices H4, H5 and H6, which are implicated in diseases are highlighted in orange. (B) Trp189 and Tyr299/Thr193 that act as wedges between H4 and H5.
Figure 6
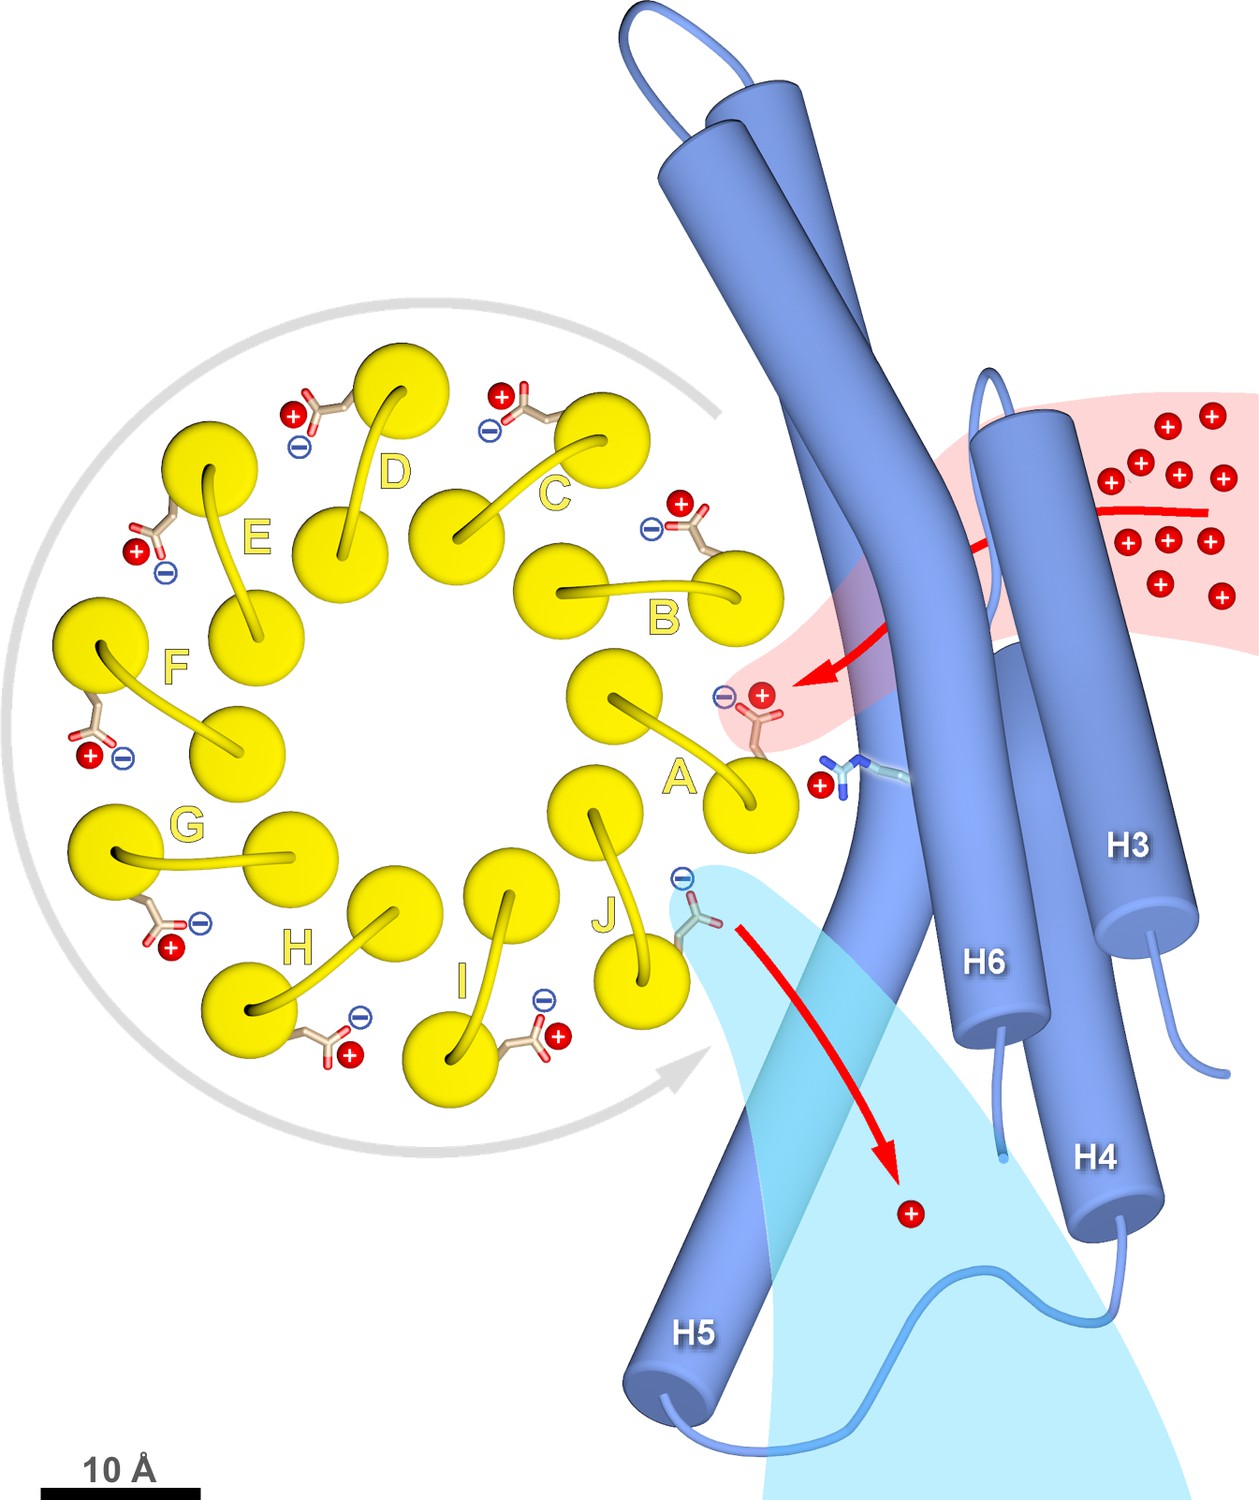
c-ring rotation is powered by the potential gradient between the lumenal channel (pink) and matrix channel (light blue).
The c-ring (yellow) and the membrane-intrinsic four-helix bundle of subunit a (blue) drawn to scale as seen from the matrix. Protons (red) pass from the crista lumen below the projection plane through the lumenal channel between H5 and H6 to protonate cGlu111 of c-subunit A, while c-subunit J is deprotonated by the higher pH of the matrix channel. The positively charged aArg239 is likely to interact with the deprotonated cGlu111 during its short passage to the lumenal channel. The lumenal and matrix channels approach one another to within 5–7 Å. A pmf of 200 mV between the closely spaced channels creates a local electrostatic field in the range of 40 million to 100 million V/m, depending on the protein dielectric. The field exerts a force on the deprotonated cGlu111 that results in net counter-clockwise rotation of the c-ring (grey arrow). Scale bar, 10 Å.
Videos
Video 1
Three-dimensional map of the 1.6 MDa mitochondrial ATP synthase dimer from Polytomella sp.
showing the two c-rings (yellow), subunits a (blue) and ASA 6 (brick). The remaining eight ASA subunits in the peripheral stalks, the central stalks and catalytic F1 heads are shown in transparent cyan.
Video 2
Three-dimensional arrangement of subunit a (blue), c-ring (yellow) with lumenal channel in pink and matrix channel in light blue.
https://doi.org/10.7554/eLife.33274.017
Video 3
Arrangement of channel-lining sidechains for the lumenal channel.
Sidechains in stick representation are coloured as: subunit a, blue; c-ring, yellow; ASA 6, brick; lipids, grey. Channels are shown as potential surfaces (red, negative; blue, positive; grey, neutral).
Video 4
Arrangement of channel-lining sidechains for the matrix channel.
Sidechains in stick representation are coloured as: subunit a, blue; c-ring, yellow; ASA 6, brick. Channels are shown as potential surfaces (red, negative; blue, positive; grey, neutral).
Tables
Table 1
Cryo-EM data collection parameters, image processing, and refinement statistics.
https://doi.org/10.7554/eLife.33274.008| Data collection | |
|---|---|
| Electron Microscope | JEOL JEM-3200FSC |
| Camera | K2 Summit |
| Voltage | 300 kV |
| Energy filter slit width | 20 eV |
| Nominal Magnification | 30,000 x |
| Calibrated physical pixel size | 1.12 Å |
| Pixel size after mag. distortion corr. | 1.105 Å |
| Total exposure | 82.5 e-/Å2 |
| Exposure rate | 11.5 e-/(pixel x s) |
| Number of frames | 45 |
| Defocus range | −0.4 to −5 μm (95% between -0.9 and -2.5 µm) |
| Image Processing | |
| Motion correction software | Unblur/MotionCor2 (with mag. distortion corr.) |
| CTF estimation software | CTFFind4, Gctf (for per-particle CTF) |
| Particle selection software | e2boxer (EMAN2) |
| Micrographs used | 9,518 |
| Particles selected | 117,281 |
| 3D map classification and refinement software | Relion2 |
| Particles contributing to final map | 90,142 |
| Applied symmetry | C2 |
| Global resolution (FSC = 0.143) | 3.68 Å |
| Applied B-factor | -125 Å |
| Model Building | |
| Modeling software | Coot |
| Refinement software | Phenix (phenix.real_space_refine) |
| Number of residues built | 1,039 |
| RMS (bonds) | 0.01 Å |
| RMS (angles) | 1.09° |
| Ramachandran outliers | 0.0% |
| Ramachandran favoured | 94.88% |
| Rotamer outliers | 0.27% |
| Clashscore | 7.5 |
| EMRinger score | 1.42 |
Download links
A two-part list of links to download the article, or parts of the article, in various formats.
Downloads (link to download the article as PDF)
Open citations (links to open the citations from this article in various online reference manager services)
Cite this article (links to download the citations from this article in formats compatible with various reference manager tools)
Structural basis of proton translocation and force generation in mitochondrial ATP synthase
eLife 6:e33274.
https://doi.org/10.7554/eLife.33274


