Flatworm-specific transcriptional regulators promote the specification of tegumental progenitors in Schistosoma mansoni
- UT Southwestern Medical Center, Texas
- Australian Institute of Tropical Health and Medicine, James Cook University, Australia
- Wellcome Genome Campus, United Kingdom
Figures
Figure 1 with 2 supplements
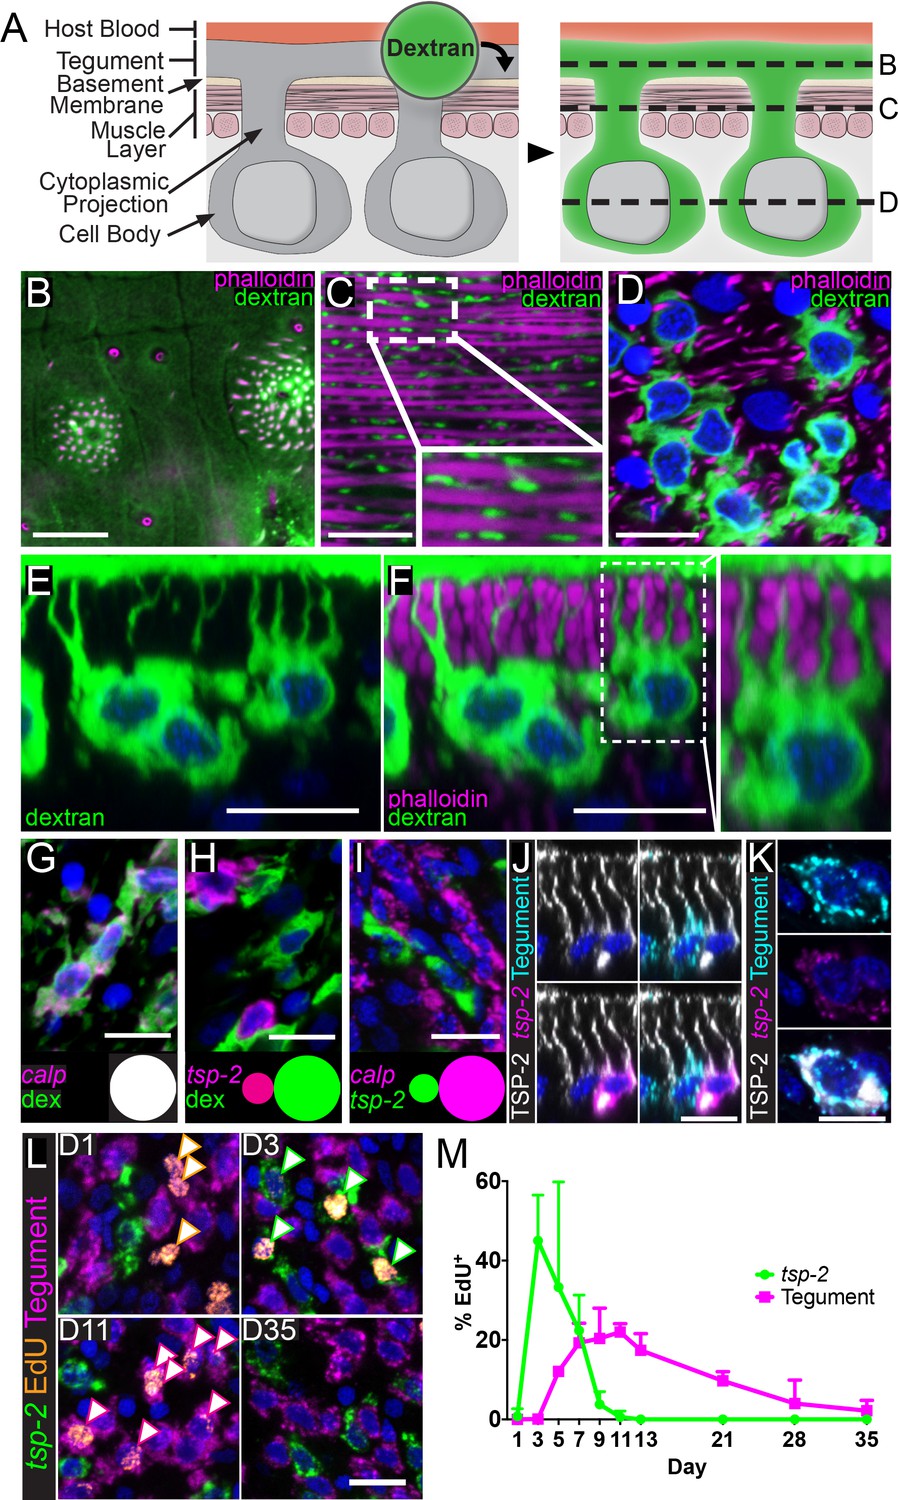
tsp-2+ neoblast progeny cells fuse with the tegumental syncytium in adult schistosomes.
(A) Cartoon depicting anatomy of the tegument and fluorescent dextran labeling. (B–D) Transverse planes through various levels of the tegument as indicated in (A). Phalloidin labels F-actin-rich (B) tegumental spines and pores and (C,D) muscle fibers; fluorescent dextran labels the tegument, cytoplasmic projections, and tegumental cell bodies. (E–F) Side view of dextran-labeled tegument depicting cytoplasmic projections extending from the cell bodies to the surface of the tegument and (F) intercalating between phalloidin-labeled muscle fibers. (G–H) FISH experiments demonstrating the localization of (G) calp expression (n = 222 cells from three adult male parasites) or (H) tsp-2 expression relative to the dextran-labeled tegumental cells (n = 233 cells from three adult male parasites). Insets show a Venn diagram illustrating the relative overlap of cell populations. (I) Double FISH experiment demonstrating the localization of tsp-2 expression relative to calp expression (n = 275 cells from three adult male parasites). (J) Immunofluorescence in conjunction with FISH demonstrating that TSP-2 protein is found in both tsp-2-expressing cells and in the cells expressing a mixture of tegument markers (‘Tegument’). (K) Image of a rare tsp-2 mRNA expressing tegumental cell that is also TSP-2 protein positive. (L) EdU pulse-chase experiment examining the kinetics of EdU incorporation into tsp-2+ cells and definitive tegumental cells. We find that EdU is incorporated into tsp-2+ cells prior to incorporation into cells expressing tegumental markers, consistent with short lived tsp-2-expressing progenitors going on to become mature tegumental cells (n = ~130 cells per animal from six adult male parasites per time point). (M) Quantification of EdU incorporation in tsp-2+ and tegumental cells. Error bars represent 95% confidence intervals. Scale bars: 10 µm.
Figure 1—figure supplement 1
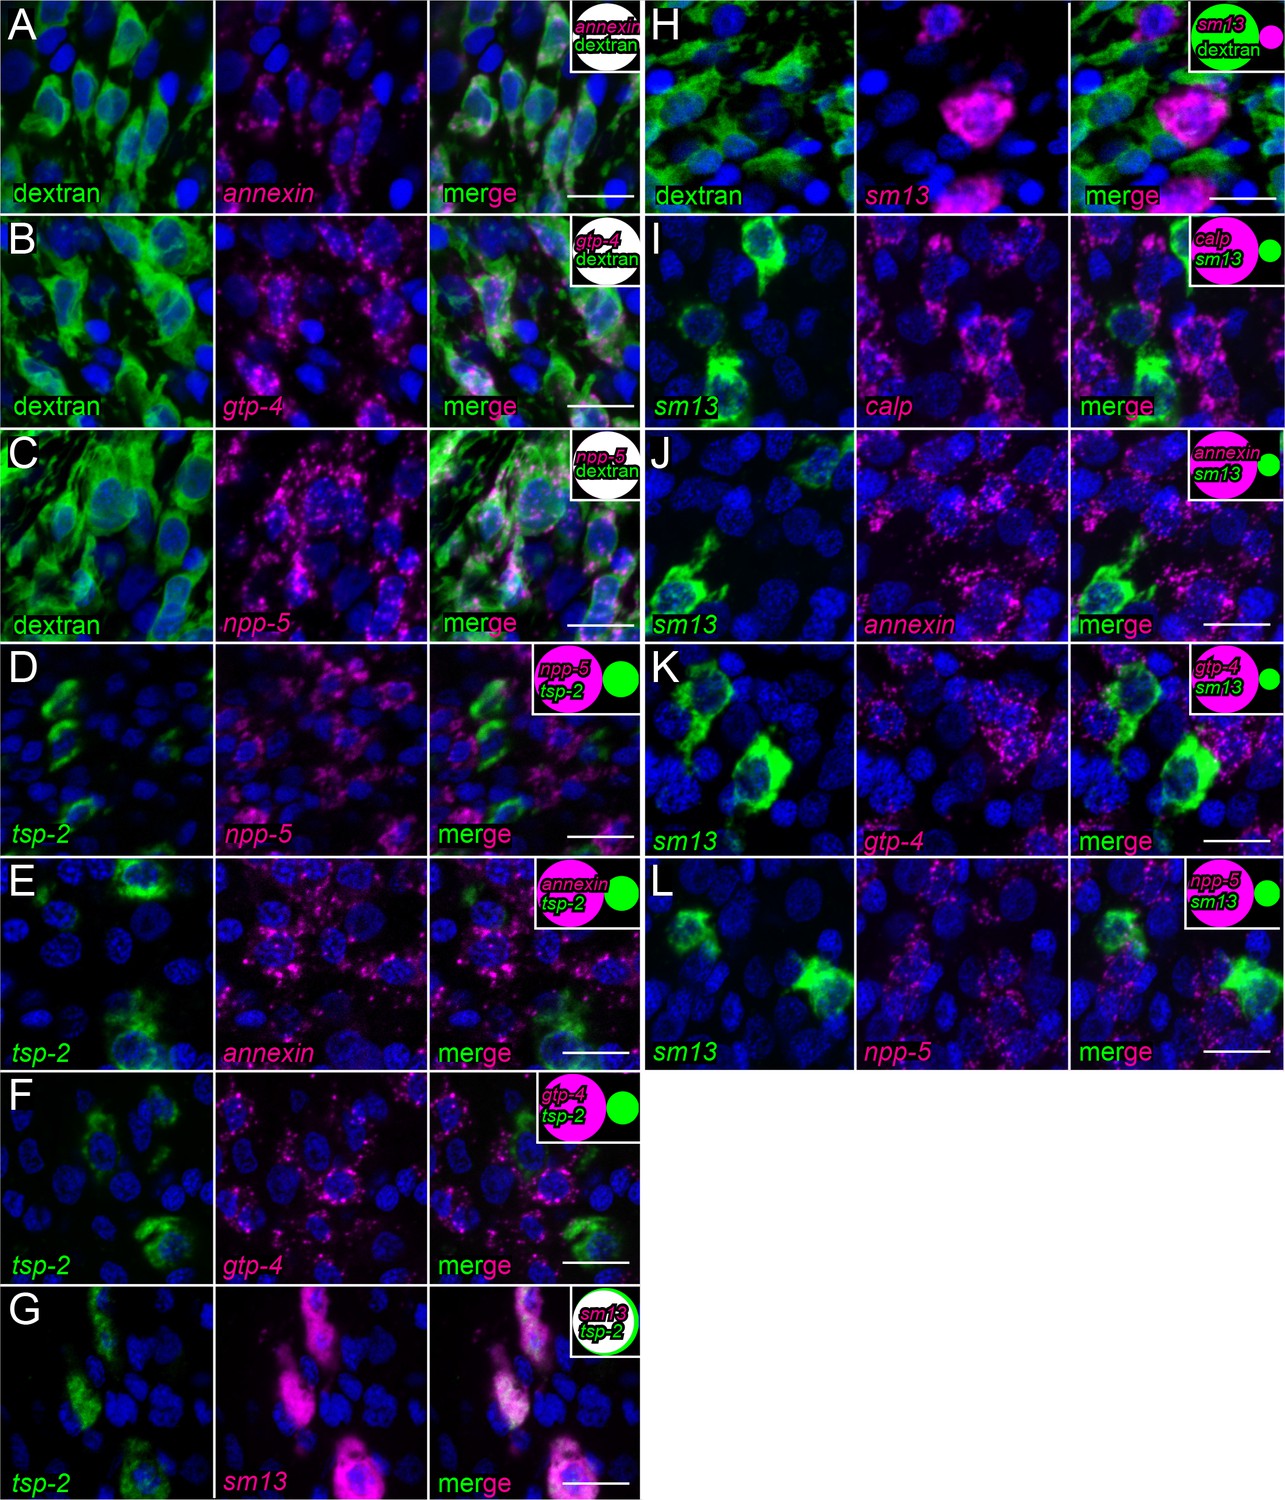
FISH examining the expression of several candidate tegument markers.
(A–C) FISH experiments on dextran-labeled worms demonstrating the localization of (A) annexin expression (n = 216 cells from three adult male parasites), (B) gtp-4 expression (n = 172 cells from three adult male parasites), and (C) npp-5 expression (n = 199 cells from three adult male parasites) relative to dextran-labeled tegumental cells. (D–F) Double FISH experiments demonstrating the localization of tsp-2 expression relative to (D) npp-5 expression (n = 492 cells from three adult male parasites), (E) annexin expression (237 cells from three adult male parasites), and (F) gtp-4 expression (n = 255 cells from three adult male parasites). (G) Double FISH experiment demonstrating the localization of tsp-2 expression relative to sm13 expression (n = 240 cells from three adult male parasites). (H) FISH experiment on dextran-labeled worms demonstrating the localization of sm13 expression relative to dextran-labeled tegumental cells (n = 372 cells from two adult male parasites). (I–L) Double FISH experiments demonstrating the localization of (I) calp expression (n = 291 cells from three adult male parasites), (J) annexin expression (n = 287 cells from three adult male parasites), (K) gtp-4 expression (n = 328 cells from three adult male parasites), and (L) npp-5 expression (n = 269 cells from three adult male parasites) relative to sm13 expression. Insets show a Venn diagram illustrating the relative overlap of cell populations with white representing co-expression. All images were taken at the level of the tegument. Scale bars: 10 µm.
Figure 1—figure supplement 2
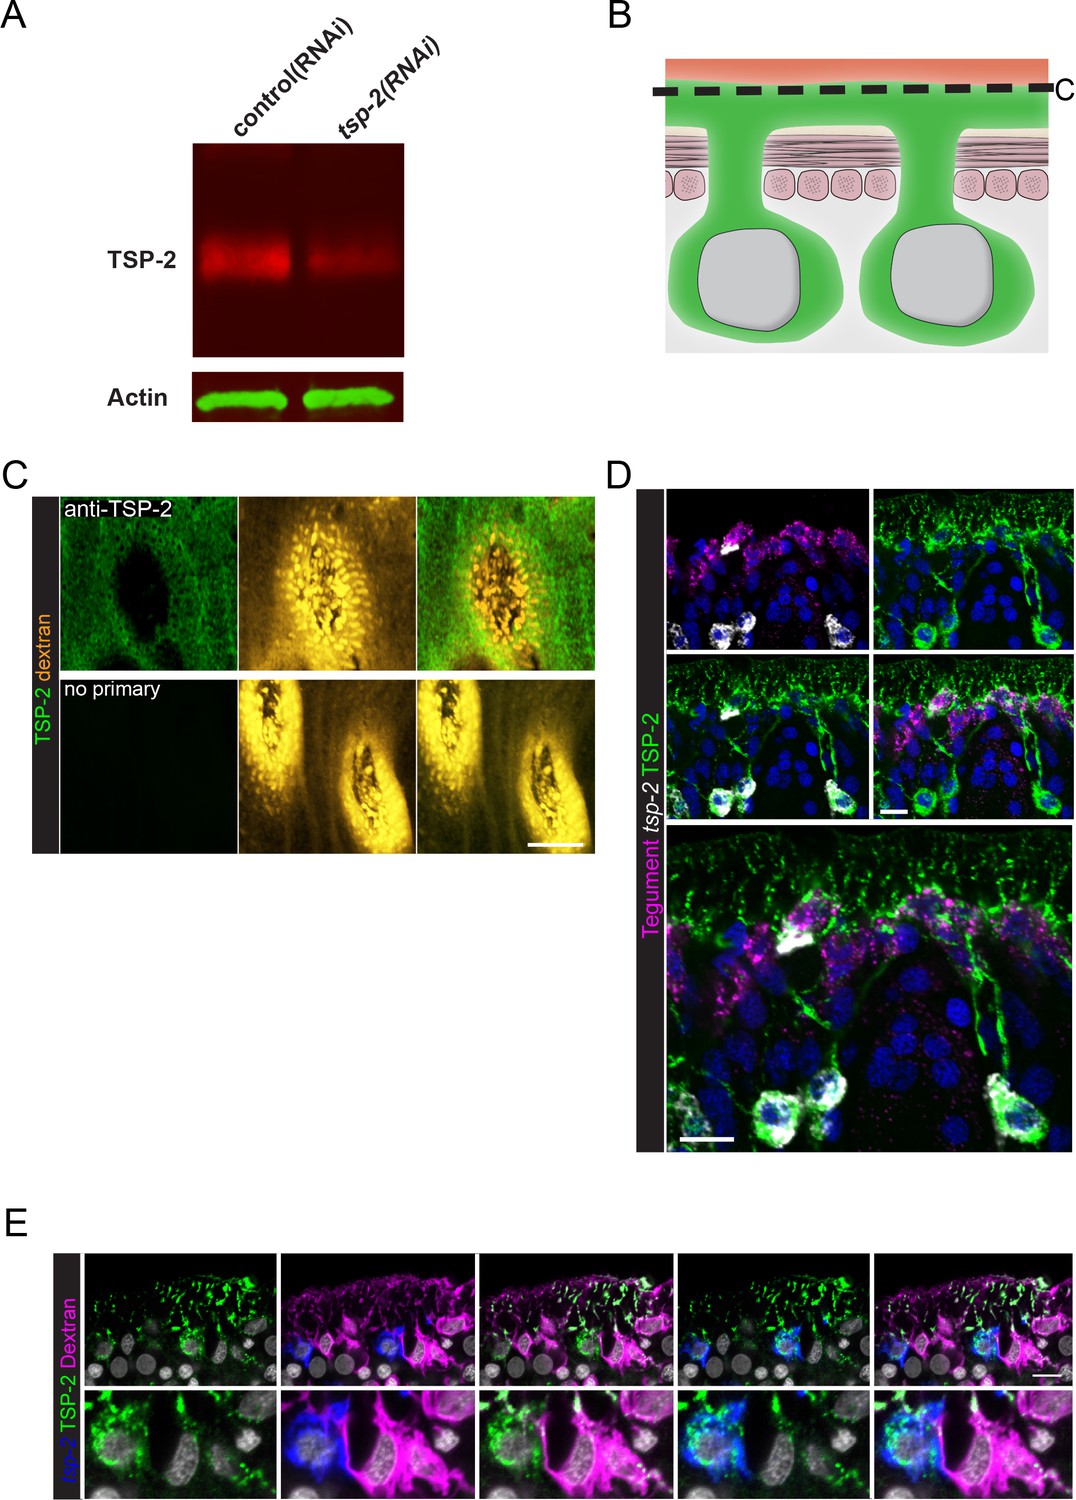
Examination of TSP-2 protein localization.
(A) Western blot showing depletion of TSP-2 protein levels following tsp-2 RNAi. (B) Cartoon depicting dextran and TSP-2 labeling of the tegument. (C) Transverse image at the level indicated in (B) demonstrating the specificity of surface labeling of the parasite using anti-TSP-2 antibody. (D) Double FISH experiment with immunofluorescence demonstrating that TSP-2 protein is found in both tsp-2 mRNA+ cells as well as in mature tegumental cells. (E) FISH experiment in conjunction with dextran-labeling and immunofluorescence demonstrating that TSP-2 protein is found in both tsp-2 mRNA+ cells as well as in mature tegumental cells. Scale bars: 10 µm.
Figure 2 with 3 supplements
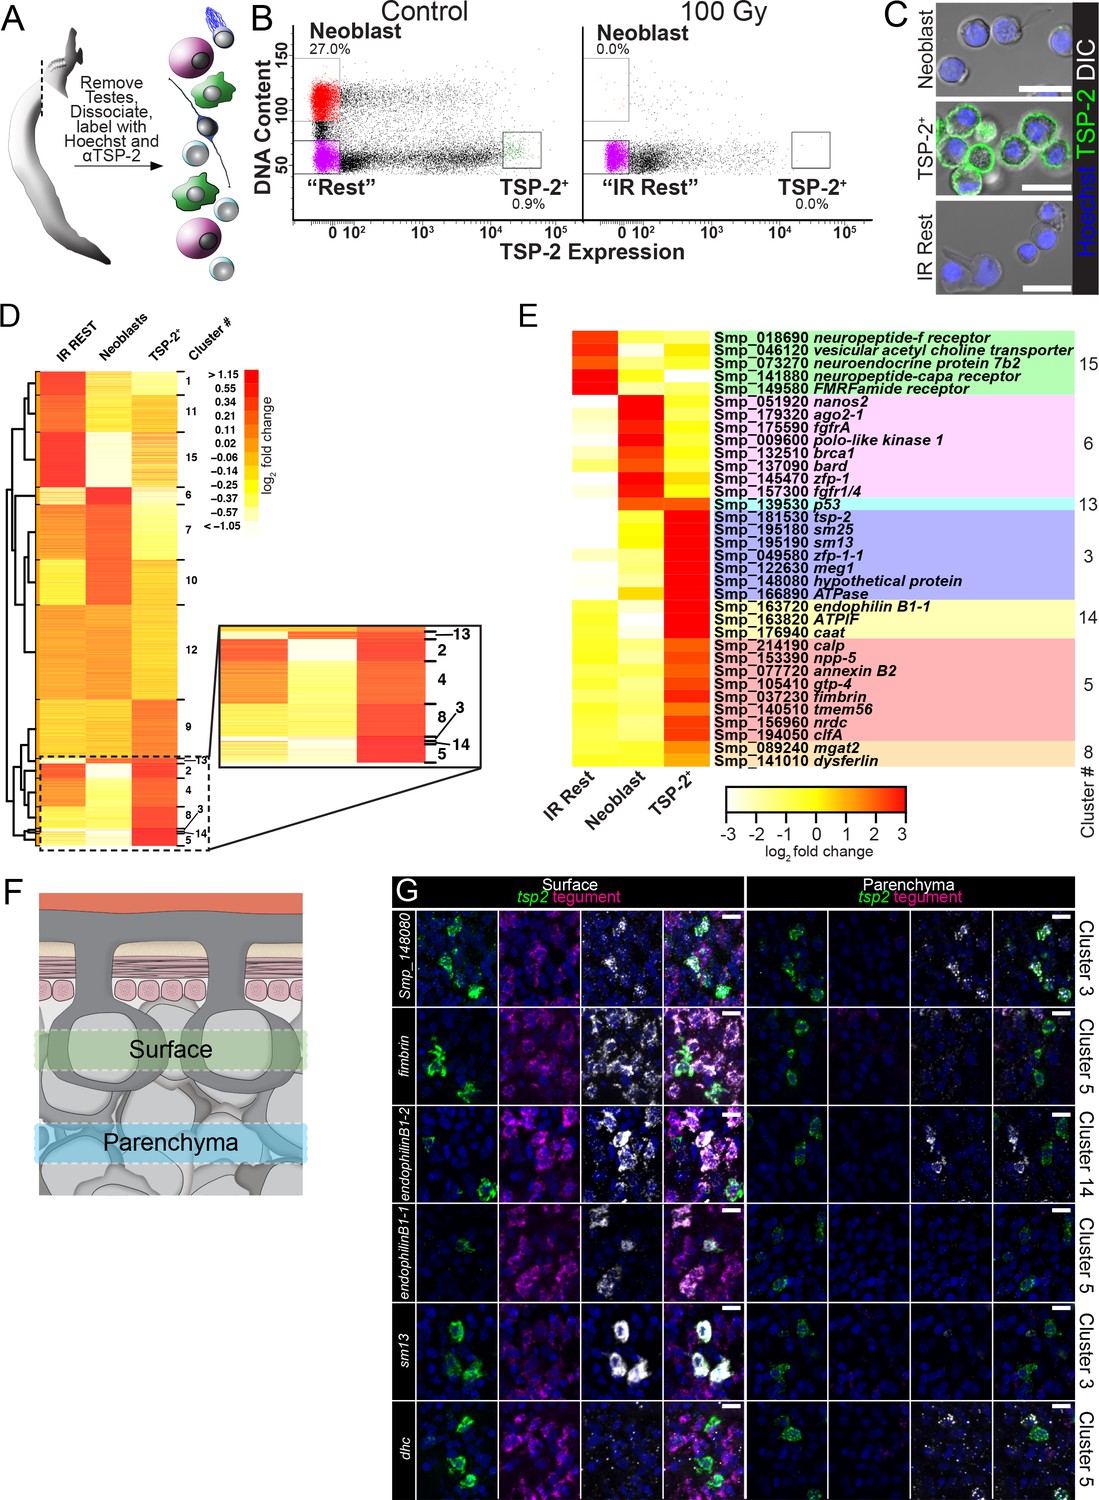
FACS purification and transcriptional profiling identifies molecules expressed in neoblasts and cells associated with the tegumental lineage.
(A) Cartoon depicting FACS purification strategy. (B) FACS plots showing various cell populations in control and following gamma-irradiation. Percentages represent fraction of the number of cells in the boxed region over the total number of live cells. (C) Confocal micrographs of the sorted cell populations labeled with Hoechst and an anti-TSP-2 antibody. (D) Heatmap showing clustering analysis of genes expressed in the indicated cell populations. Inset shows TSP-2 enriched clusters. (E) Heatmap showing the relative expression of individual genes in each cell population. These genes are organized by cluster. (F) Cartoon depicting the approximate regions imaged in panel G. (G) Maximum intensity projection of z-stacks acquired either at superficial levels (‘Surface’) or deeper in the parasite tissue (‘Parenchyma’). The gene expression cluster of each gene examined is listed on the right. Scale bars: 10 µm.
Figure 2—figure supplement 1
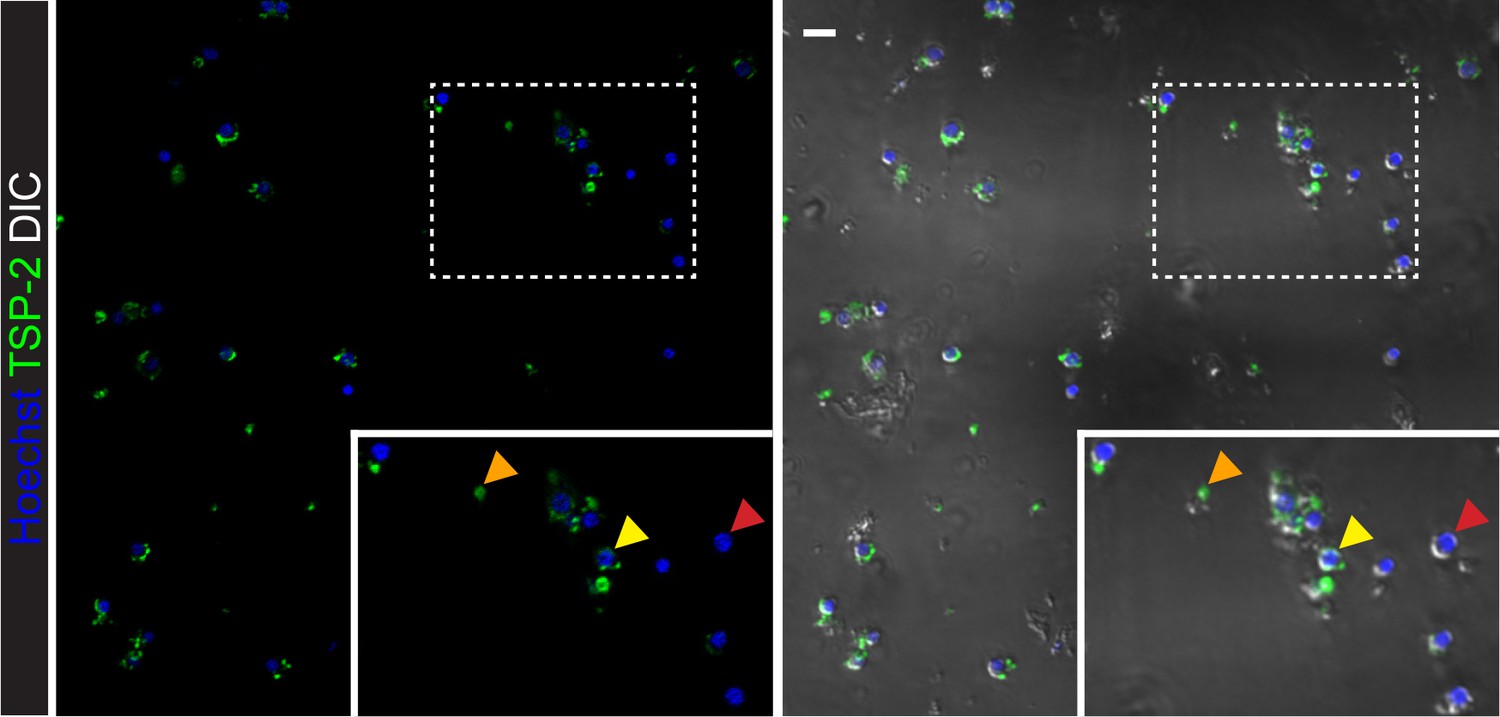
Microscopic imaging of sorted ‘TSP-2 Intermediate’ cells.
Confocal images of sorted TSP-2 Intermediate cells. Arrows in the inset show cells with no TSP-2 labeling (red arrows), cells with pieces of TSP-2+ debris attached to them (yellow arrows), and acellular debris (orange arrows). Scale bar: 10 µm.
Figure 2—figure supplement 2
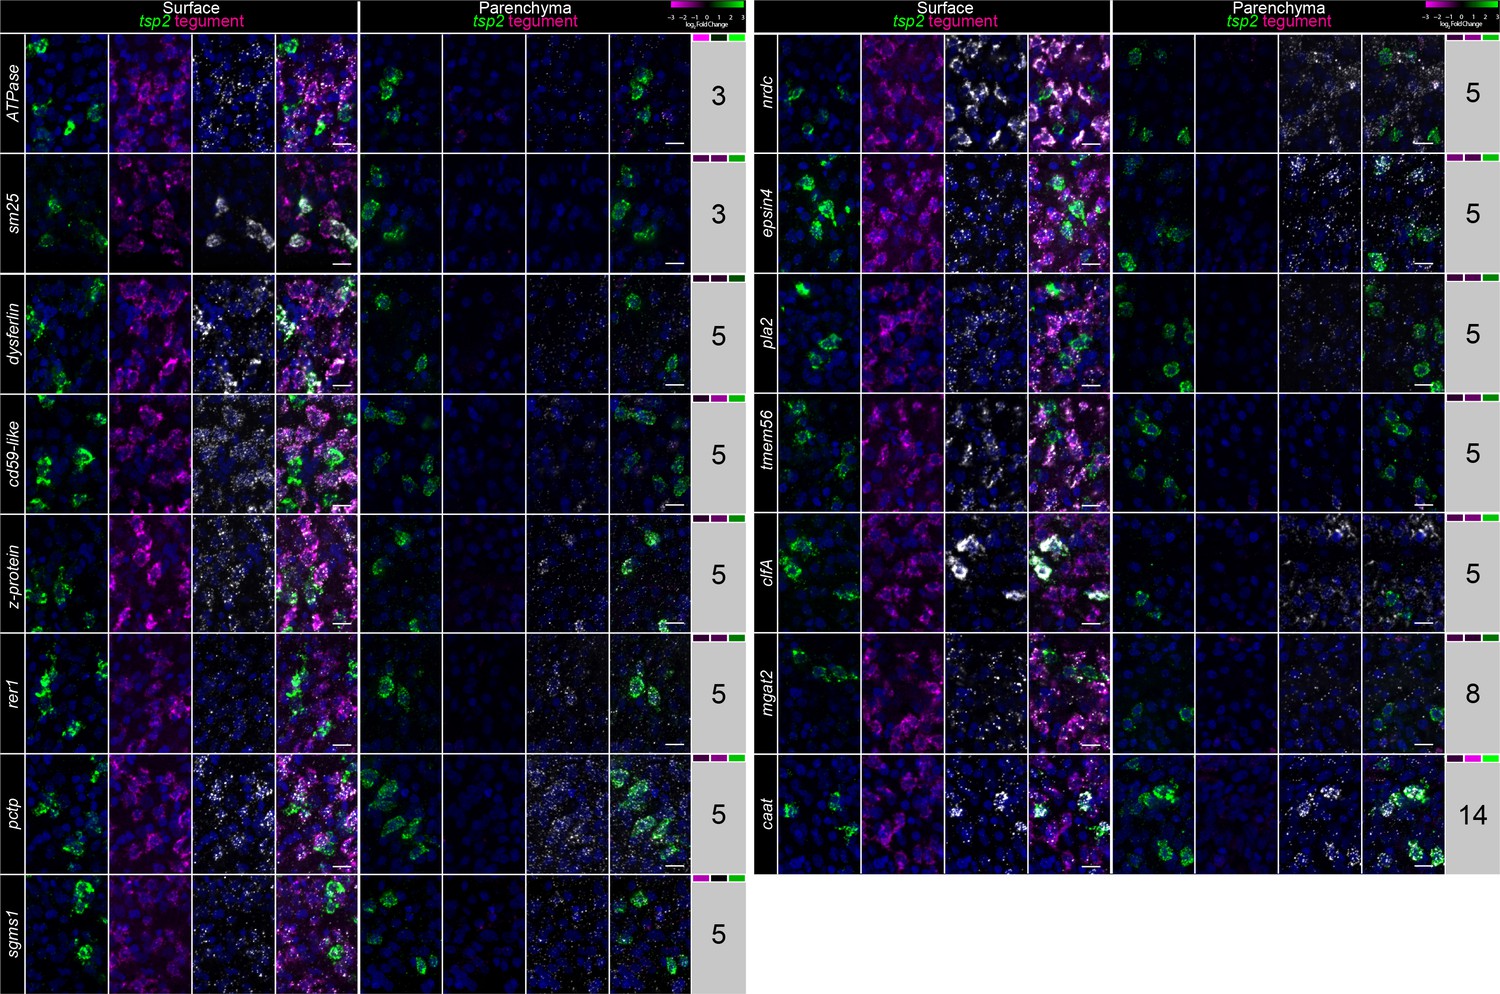
Examination of the expression of genes expressed in TSP-2-enriched clusters.
FISH for tsp-2, a mixture of tegumental makers (Tegument), and panel of 15 genes from various clusters of gene expression (indicated at right of the image). Relative expression levels of each gene in IR Rest, Neoblasts, and TSP-2+ cells are indicated in the heatmap to the right, respectively. Images are maximum intensity projections at either the level of the surface (left) or in the parenchyma (right). See Figure 2F for definition of ‘surface’ and ‘parenchyma’. Scale bars: 10 µm.
Figure 2—figure supplement 3
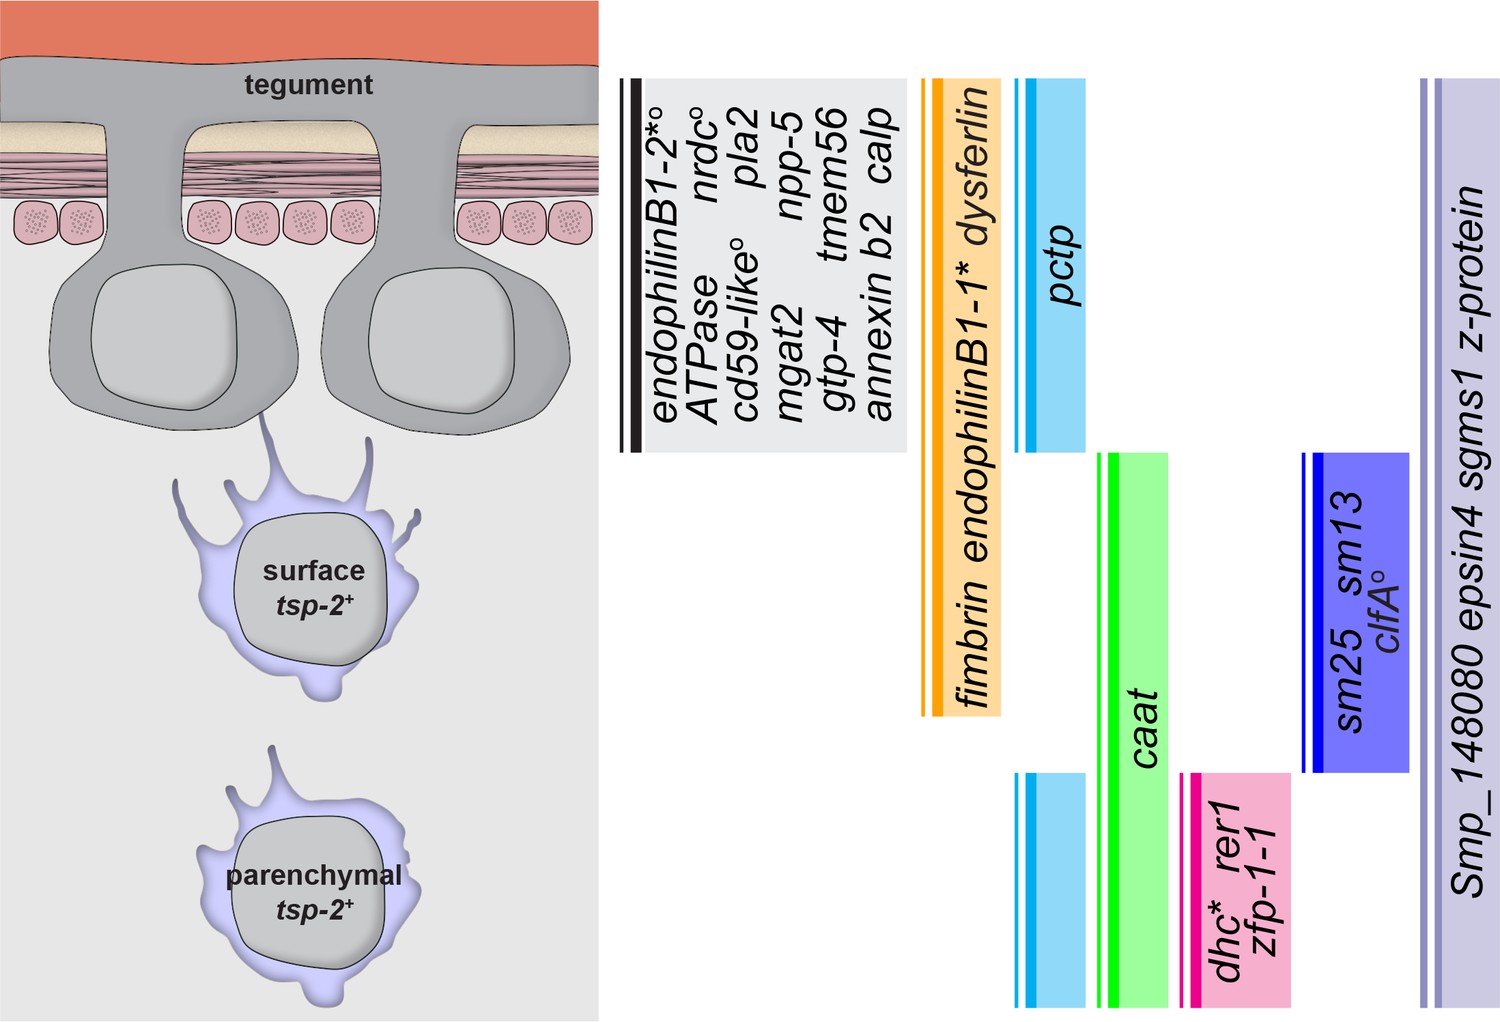
Graphical summary of genes expressed in TSP-2-enriched clusters.
A graphical summary indicating where in the tegumental lineage genes are expressed. An asterisk next to a gene name indicates that the gene is only expressed in a subset of the population. A superscript ‘O’ next to a gene name indicates that the gene is also expressed in cells not in the proposed tegument lineage.
Figure 3 with 3 supplements
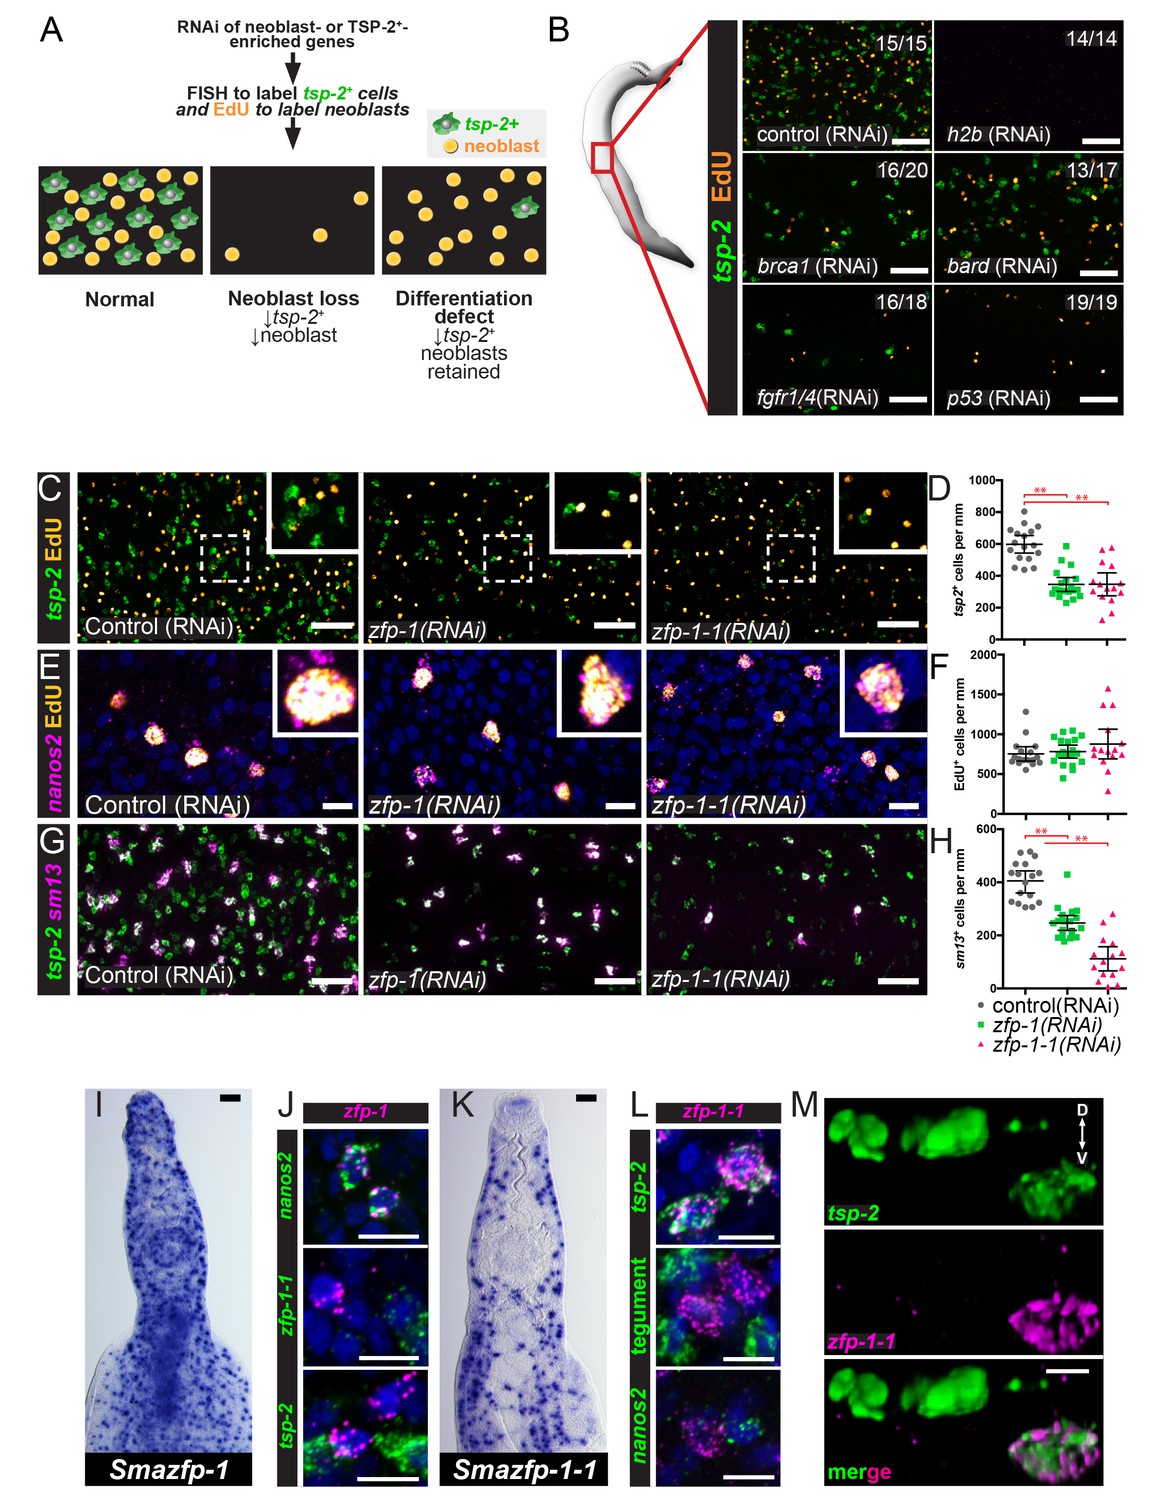
An RNAi screen identifies zfp-1 and zfp-1–1 as genes required for the production of tsp-2+ cells.
(A) Cartoon depicting the RNAi screening strategy used to identify regulators of tegument progenitor specification. Candidate genes were knocked-down using RNAi, worms were pulsed with EdU for 4 hrs and then fixed. Neoblasts and tegument progenitor cells were observed using EdU detection and tsp-2 RNA FISH, respectively. (B) Results of control RNAi experiments. Negative control RNAi preserves tsp-2 cells and neoblasts whereas h2b RNAi results in a loss of neoblasts and tsp-2 cells. brca1, bard, fgfr1/4, and p53 RNAi results in a partial depletion of neoblasts and a proportional decrease in tsp-2+cells. Representative maximum intensity confocal projections are shown. Numbers represent the fraction of parasites displaying the observed phenotype. (C) Maximum intensity projection showing tsp-2 expression and EdU incorporation in zfp-1(RNAi) or zfp-1-1(RNAi) parasites. (D) Quantification of the number of tsp-2+ cells per mm of worm. Control(RNAi) n = 17, zfp-1(RNAi) n = 19, zfp-1-1(RNAi) n = 15. (E) Maximum intensity projection showing nanos2 expression and EdU incorporation in zfp-1(RNAi) or zfp-1-1(RNAi) parasites. (F) Quantification of the number of EdU+ cells per mm worm. Control(RNAi) n = 17, zfp-1(RNAi) n = 19, zfp-1-1(RNAi) n = 15. (G) Maximum intensity projection showing tsp-2 and sm13 expression in zfp-1(RNAi) or zfp-1-1(RNAi) parasites. (H) Quantification of the number of sm13+ cells per mm worm. Control(RNAi) n = 17, zfp-1(RNAi) n = 19, zfp-1-1(RNAi) n = 15. (I) WISH showing zfp-1 expression in adult male worm. (J) Double FISH showing expression of zfp-1 relative to nanos2 (a neoblast marker), zfp-1–1, and tsp-2. (K) WISH showing zfp-1–1 expression in adult male worm. (L) Double FISH showing expression of zfp-1–1 relative to tsp-2, a mixture tegument-specific markers (tegument), and nanos2 (a neoblast marker). (M) 3D rendering showing expression of zfp-1–1 in a subset of tsp-2+ cells. The dorsal and ventral surfaces of the animal are oriented towards the top and the bottom of the image, respectively, as indicated by the arrows in the first panel. Scale bars: B, C, G, I, K 50 µm; E, J, L, M 10 µm. Error bars represent 95% confidence intervals, **p<0.01 (Student’s t-test).
Figure 3—figure supplement 1
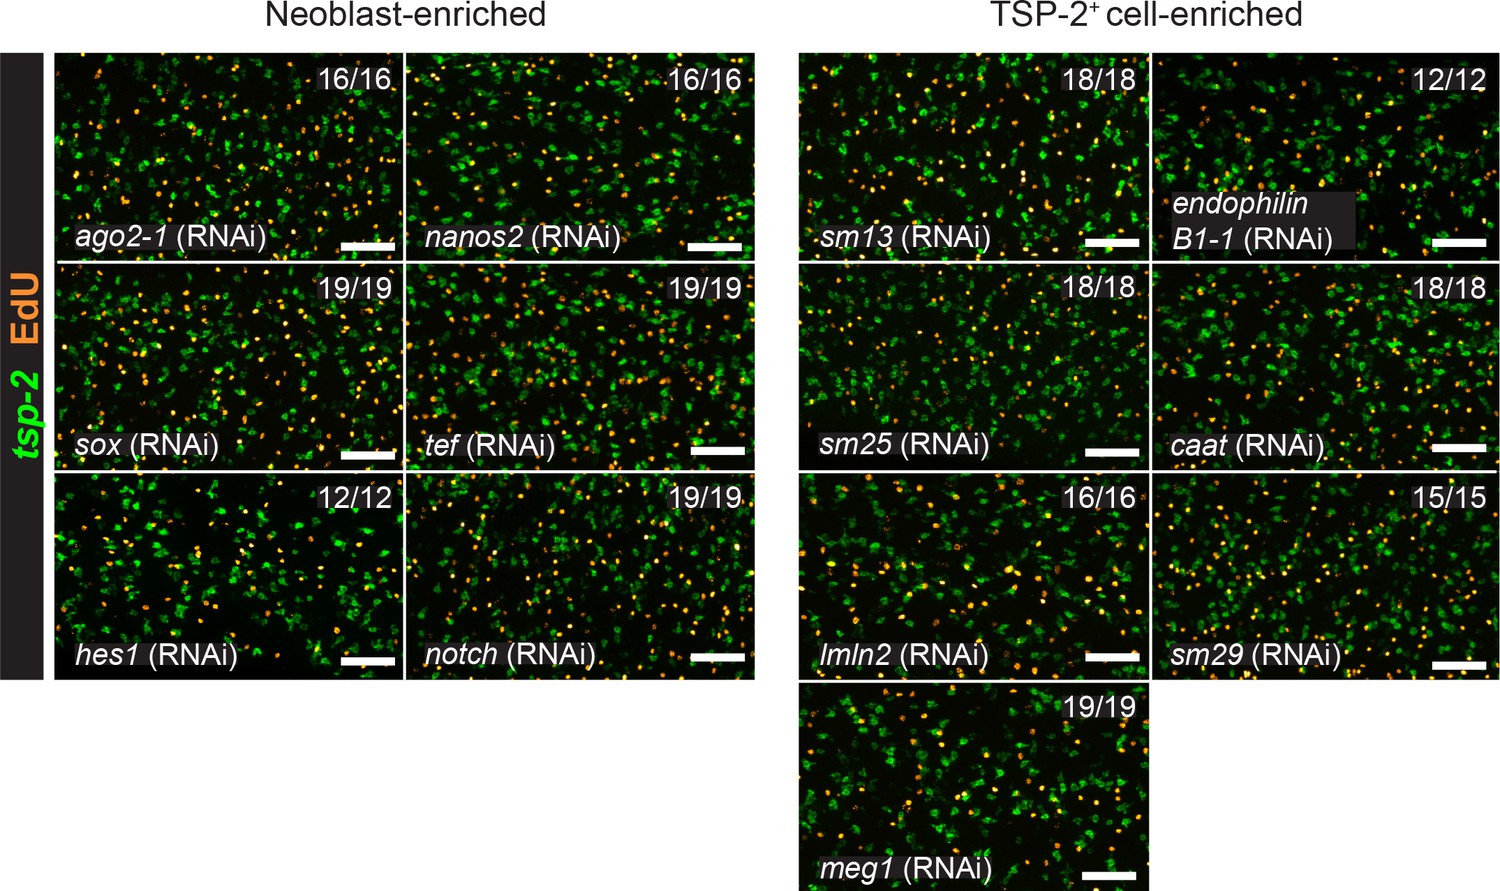
RNAi screen of candidate tegument biogenesis regulators.
Results of knocking down candidate transcripts that are dispensable for normal neoblast function and tsp-2+ cell production. Representative maximum intensity confocal projections are shown. Numbers represent the fraction of parasites displaying the observed phenotype. Scale bars: 50 µm.
Figure 3—figure supplement 2
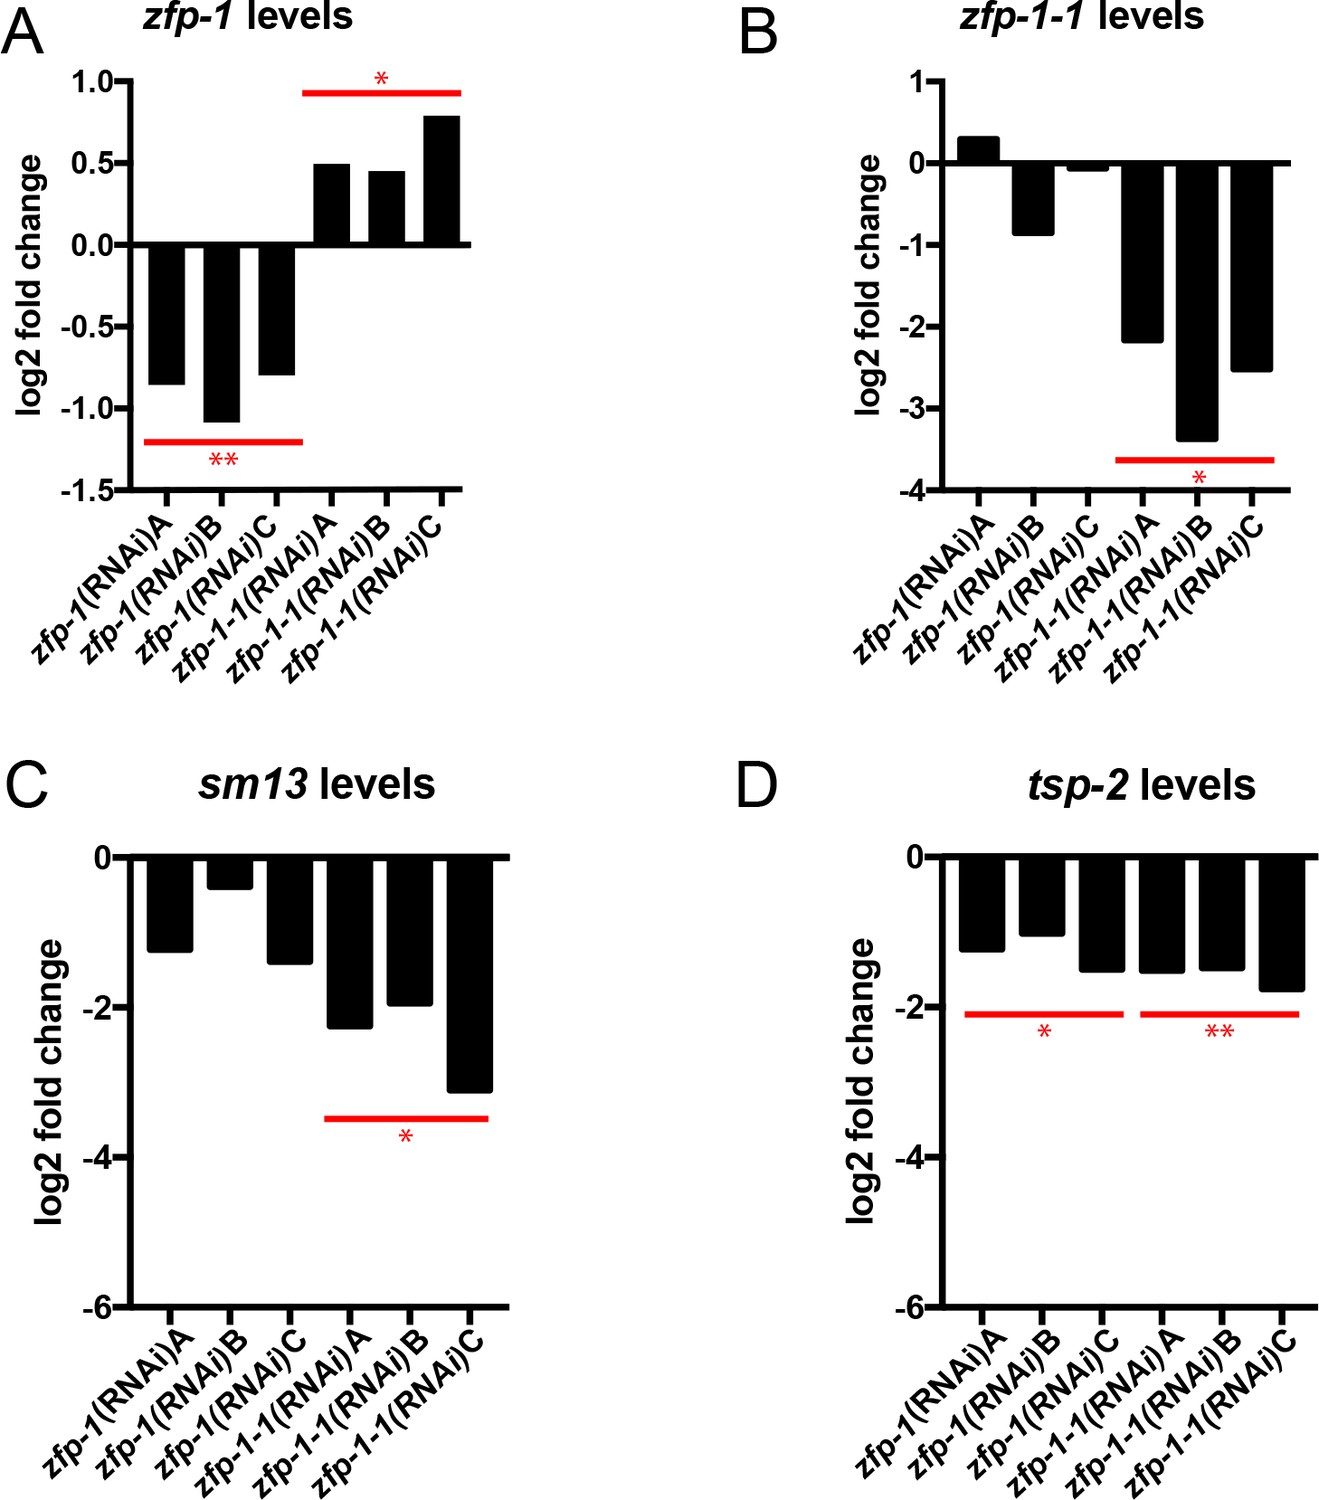
Quantification of gene expression in zfp-1(RNAi) and zfp-1-1(RNAi) parasites.
Quantitative real time PCR analysis of the effects of zfp-1 and zfp-1–1 RNAi on the expression of (A) zfp-1, (B) zfp-1–1, (C) sm13, and (D) tsp-2. Each bar represents the expression of the indicated gene from an individual biological replicate relative to the expression from a control RNAi treatment group. Expression levels of indicated genes were normalized to both Cytochrome C Oxidase (Smp_900000) and Proteasome Subunit Beta Type-4 (Smp_056500). *p<0.05, **p<0.01 (Student’s t-test).
Figure 3—figure supplement 3

Gene expression patterns of sm13 and zfp-1–1.
Representative double FISH demonstrating the localization of sm13 expression relative to zfp-1–1 expression. 1 of 248 sm13+ cells was zfp-1–1 positive. Image represents a z-projection. Scale bar: 10 µm.
Figure 4

ZFP-1 and ZFP-1–1 are flatworm specific zinc finger proteins and are putative transcriptional regulators.
(A) Multiple protein sequence alignment of the C2H2 domain of several zfp-1 and zfp-1–1 homologs. Zinc coordinating residues are shown in black background. Conserved residues contributing to high specificity DNA-binding are highlighted in cyan for the second and third zinc fingers, with the specific DNA base shown below the residue highlighted in yellow. The corresponding positions in the first zinc finger are shown in grey background. The positions determining DNA binding specificity in the first zinc finger (highlighted in grey background) either are not well conserved among these proteins or do not contribute to high specificity of DNA binding. (B) Un-rooted phylogenic tree of ZFP-1 and ZFP-1–1 homologs from multiple species of flatworms. Numbers at the nodes represent bootstrap values. (C) Predicted DNA binding motif of zfp-1 and zfp-1–1 of S. mansoni by the ZFModels server.
Figure 5
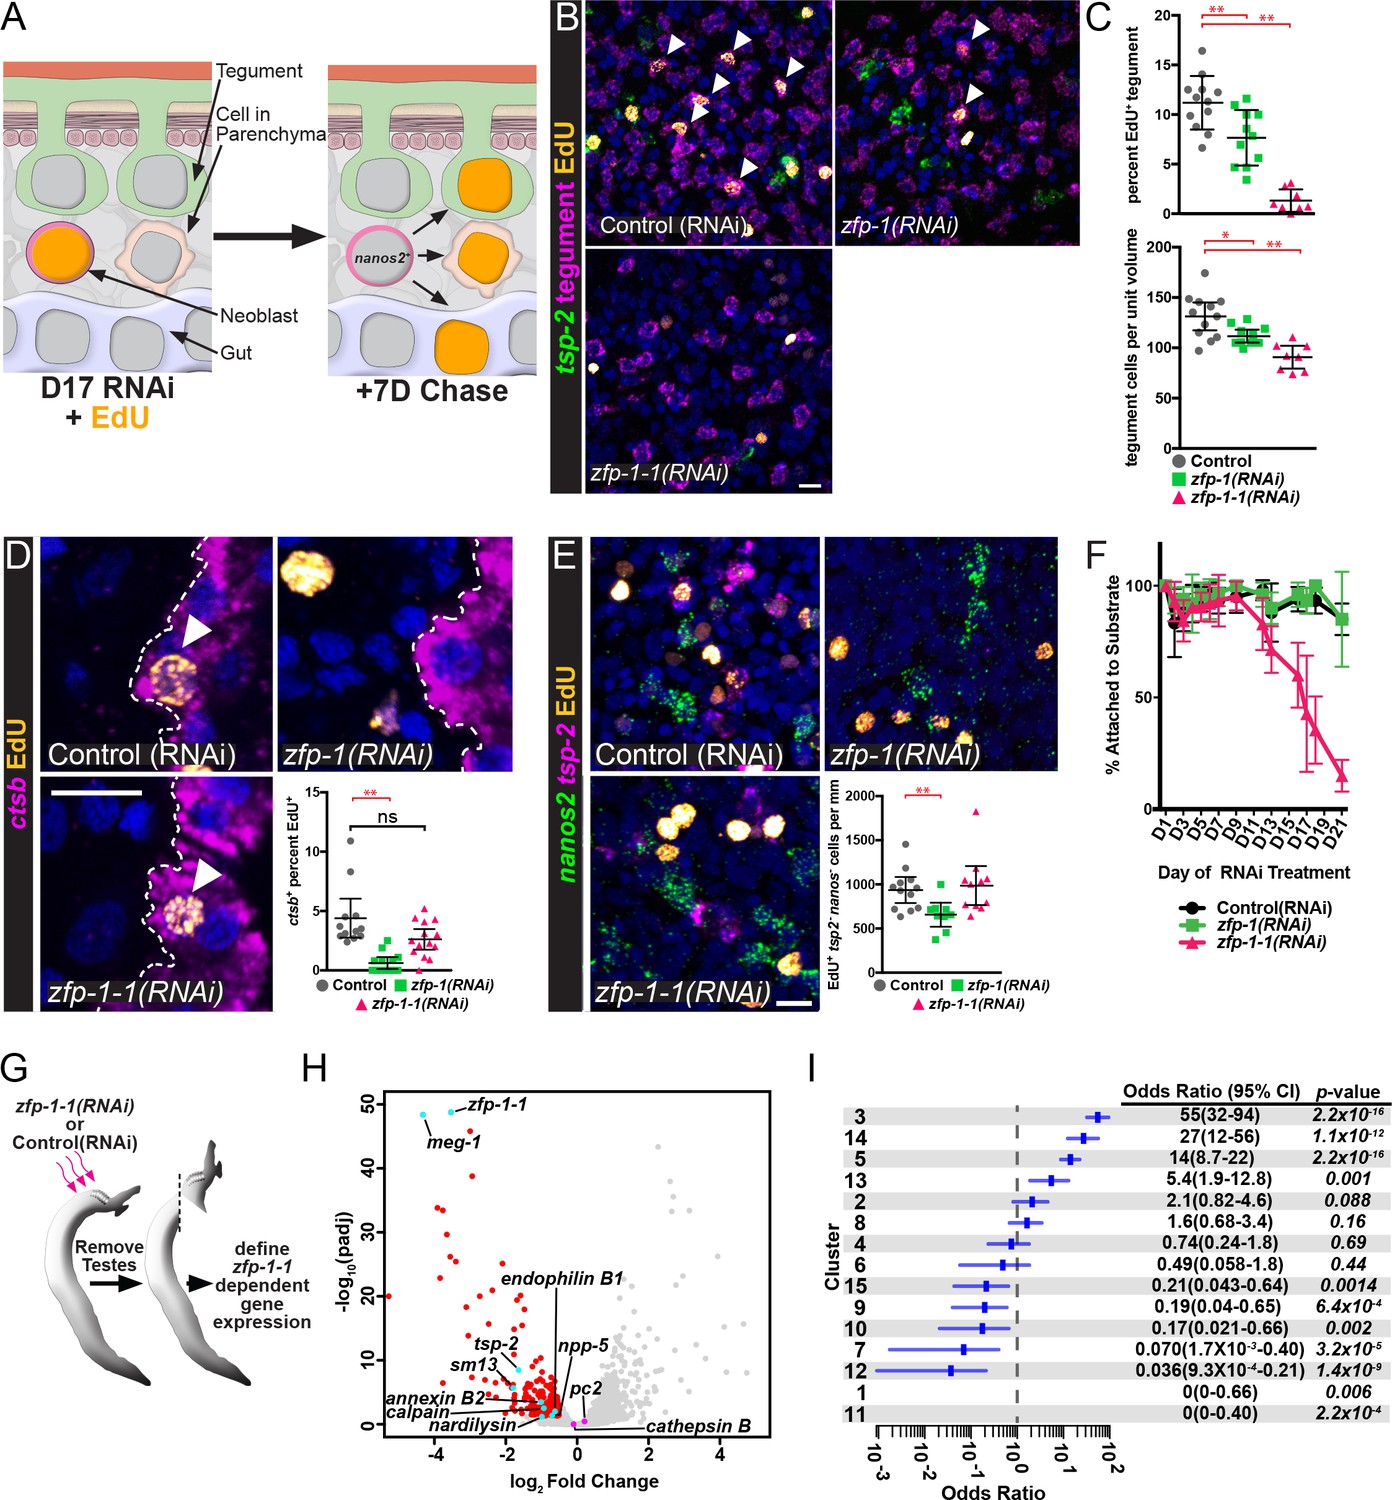
ZFP-1 family proteins are required for the production of new tegumental cells.
(A) Cartoon depicting the strategy for fate-mapping by EdU pulse-chase experiments. (B) FISH for tsp-2 and tegumental markers with EdU detection in zfp-1(RNAi) or zfp-1-1(RNAi) parasites at day seven following an EdU pulse. Arrows represent EdU+ tegumental cells. (C) (Top) Quantification of the percentage of tegumental cells that are EdU+ following a 7 day chase period and (Bottom) tegumental cell density in zfp-1(RNAi) or zfp-1-1(RNAi) parasites. Control(RNAi) n = 12, zfp-1(RNAi) n = 11, zfp-1-1(RNAi) n = 8. (D) FISH for cathepsin B and EdU detection in zfp-1(RNAi) or zfp-1-1(RNAi) parasites at day seven following an EdU pulse. Plot represents the percentage of cathepsin B + cells that are EdU+. Control(RNAi) n = 12, zfp-1(RNAi) n = 13, zfp-1-1(RNAi) n = 14. (E) FISH for nanos2 and tsp-2 with EdU detection in zfp-1(RNAi) or zfp-1-1(RNAi) parasites at day seven following an EdU pulse. Plot represents the number of tsp-2- EdU+ differentiated cells (i.e., nanos2- cells) per mm of parasite length. Control(RNAi) n = 12, zfp-1(RNAi) n = 10, zfp-1-1(RNAi) n = 11. (F) Percentage of the parasites that remain attached to the culture dish at the indicated time point following the first RNAi treatment. n = 5 experiments with approximately 10 worms per RNAi treatment in each experiment. (G) Cartoon depicting strategy for examining transcriptional changes following zfp-1–1 RNAi. (H) Volcano plot showing differentially expressed genes in zfp-1-1(RNAi) worms. Red dots represent genes that are down regulated (−0.5 log2 fold change, padj <0.05) in zfp-1-1(RNAi) worms. Cyan dots indicate genes known to be expressed in the tegument lineage. Magenta dots indicate genes validated to be expressed in differentiated cells. (I) Plot showing odds-ratio (i.e., the relative over- or under-representation) of genes from gene expression clusters among genes down regulated following zfp-1–1 RNAi. Blue rectangles depict the odds-ratio from a Fisher’s Exact Test, whereas blue lines indicate the 95% confidence intervals. Values of odds-ratio and p-values for Fisher’s Exact Test shown to right. No genes from expression clusters 1 or 11 were down-regulated following zfp-1–1 RNAi, so no odds ratio was calculated. From these data, genes from expression clusters 3, 5, 13 and 14 are over-represented (p<0.05), whereas genes from clusters 1, 7, 9, 11, 12, and 15 appear under-represented. Scale bars: 10 µm. Error bars in (C–E) represent 95% confidence intervals, error bars in (F) represent standard deviation. *p<0.05; **p<0.01; ns, not significant (Student’s t-test).
Figure 6
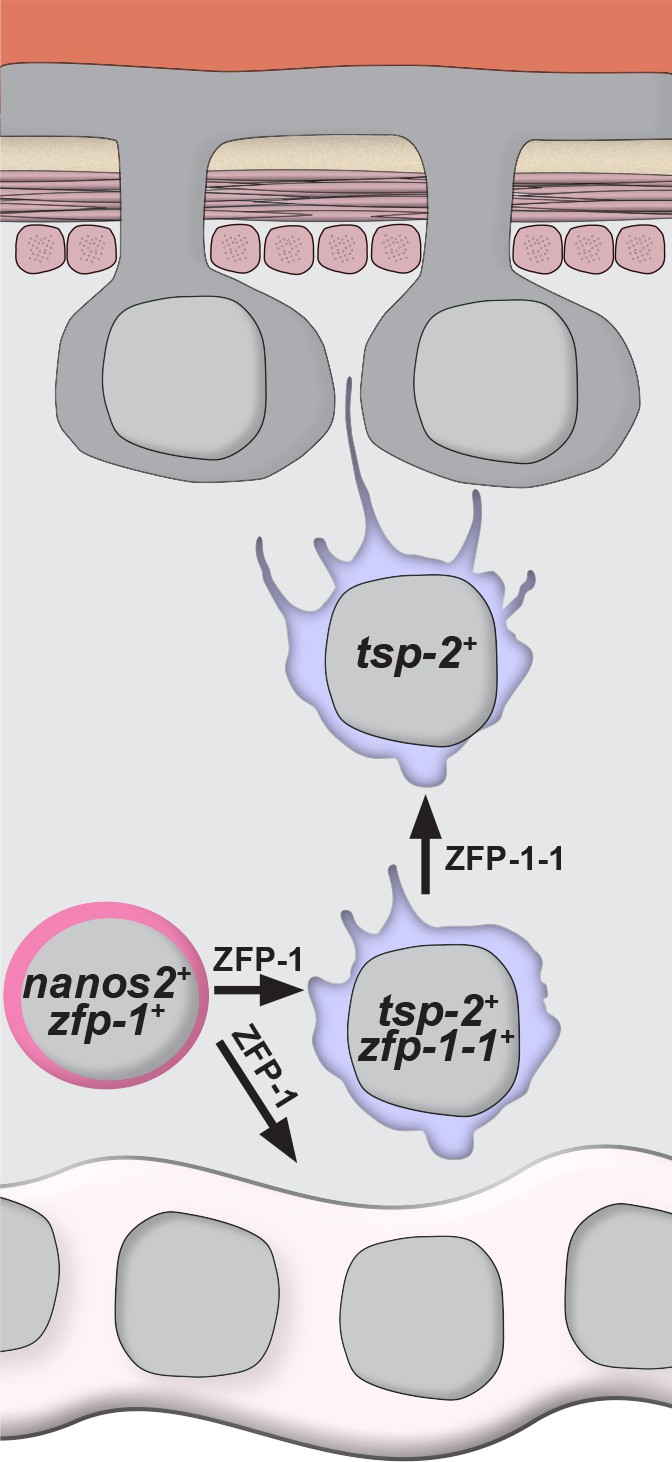
Model for the specification of new tegumental cells from neoblasts.
Neoblasts (magenta cells) expressing nanos2 and zfp-1 specify large numbers of tsp-2+ cells. Some fraction of tsp-2 cells express zfp-1–1. Within this tsp-2 compartment are cells that extend cytoplasmic projections ultimately fusing with the tegumental syncytium. Loss of zfp-1 function results in a general differentiation defect (i.e. loss of both tegument progenitors and gut cells) whereas loss of zfp-1–1 function results in a specific loss of tsp-2+ cells responsible for replenishing the tegument. In both cases, depletion of tsp-2+ cells causes a reduction in the total number of tegumental cell bodies.
Videos
Video 1
Movie depicting the elaborate interconnected network of the parasite’s tegument and the attached tegumental cell bodies.
https://doi.org/10.7554/eLife.33221.006
Video 2
Movie depicting the localization of TSP-2 protein relative to the tegument and tsp-2 expressing cells.
https://doi.org/10.7554/eLife.33221.007Additional files
-
Supplementary file 1
Pairwise comparisons of transcriptional profiles of neoblasts, TSP-2+ cells, and IR Rest cells.
- https://doi.org/10.7554/eLife.33221.019
-
Supplementary file 2
Results of model-based clustering analysis to define genes whose expression is enriched in either neoblasts, TSP-2+ cells, or IR Rest cells.
- https://doi.org/10.7554/eLife.33221.020
-
Supplementary file 3
Table of candidate tegument-associated genes, their abbreviations, their gene expression cluster, and their expression pattern.
- https://doi.org/10.7554/eLife.33221.021
-
Supplementary file 4
Pairwise comparisons of transcriptional profiles of control(RNAi) parasites versus zfp-1-1(RNAi) parasites.
- https://doi.org/10.7554/eLife.33221.022
-
Supplementary file 5
Table of gene names, abbreviations, and oligonucleotides sequences from this study.
- https://doi.org/10.7554/eLife.33221.023
-
Supplementary file 6
Table of results from Fisher’s exact test to define how zfp-1–1 RNAi treatment affects genes expressed in various gene expression clusters.
- https://doi.org/10.7554/eLife.33221.024
-
Supplementary file 7
FASTA formatted file with various flatworm ZFP-1 family protein sequences that were used for generating protein alignments and phylogenetic trees.
- https://doi.org/10.7554/eLife.33221.025
-
Transparent reporting form
- https://doi.org/10.7554/eLife.33221.026
Download links
A two-part list of links to download the article, or parts of the article, in various formats.
Downloads (link to download the article as PDF)
Open citations (links to open the citations from this article in various online reference manager services)
Cite this article (links to download the citations from this article in formats compatible with various reference manager tools)
Flatworm-specific transcriptional regulators promote the specification of tegumental progenitors in Schistosoma mansoni
eLife 7:e33221.
https://doi.org/10.7554/eLife.33221


