Silencing of transposable elements may not be a major driver of regulatory evolution in primate iPSCs
- University of Chicago, United States
- Imperial College, United Kingdom
Figures
Figure 1 with 14 supplements
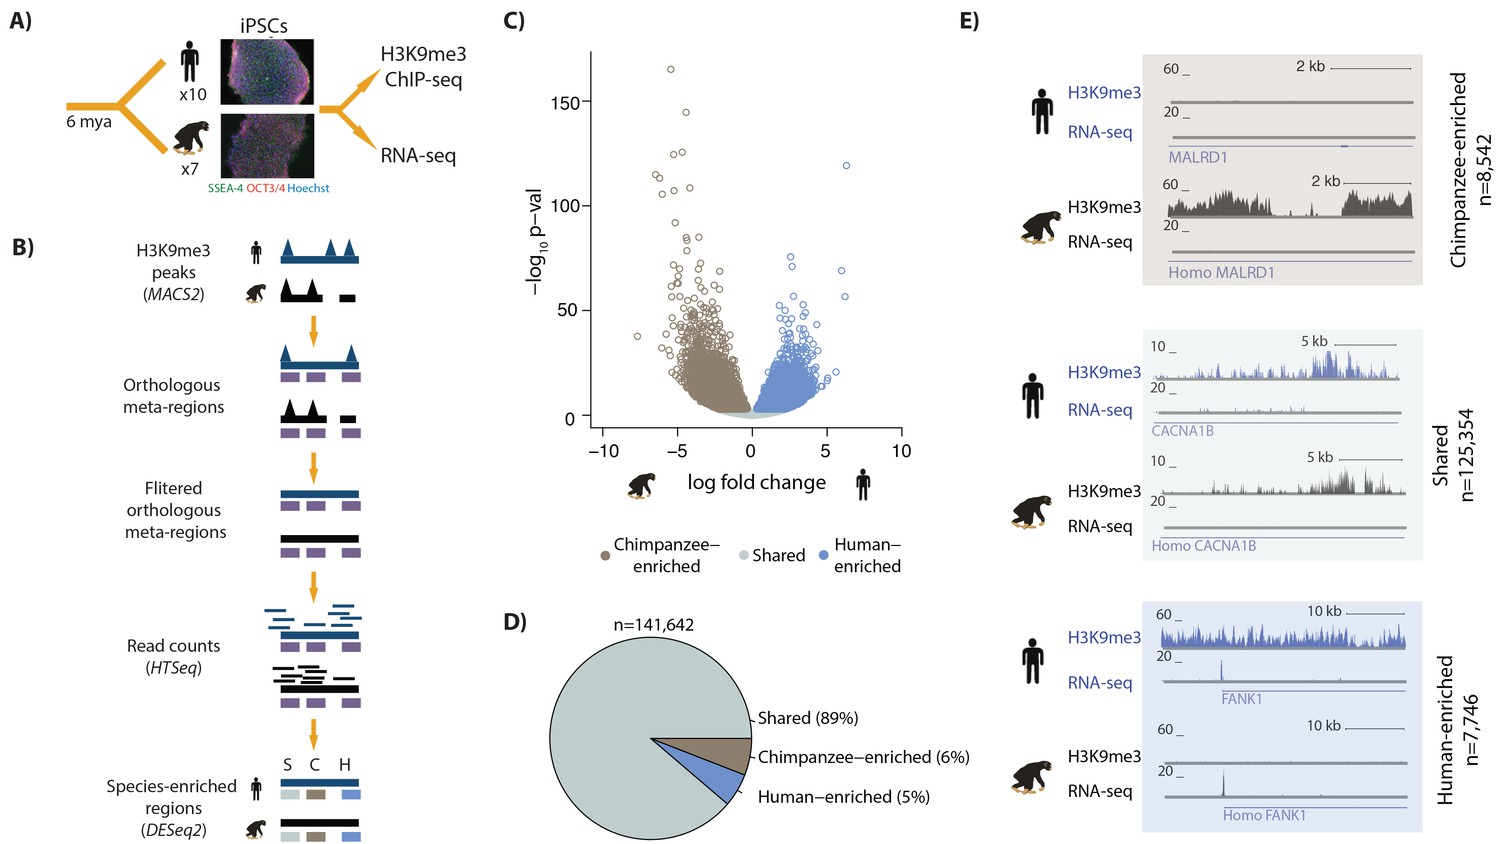
Majority of H3K9me3 regions are similarly enriched in human and chimpanzee iPSCs.
(A) Experimental design of the study. (B) A heuristic description of the computational pipeline to identify regions of differential H3K9me3 enrichment between humans and chimpanzees. Human genome, ChIP-seq peaks and ChIP-seq reads (dark blue); chimpanzee genome, ChIP-seq peaks and ChIP-seq reads (black), orthologous H3K9me3 regions (purple). (C) Volcano plot representing the regions similarly enriched in both species (grey: Shared), enriched in human (light blue), or enriched in chimpanzee (brown) at 1% FDR. (D) Pie-chart representing the proportion of regions within the Shared, Human-enriched and Chimpanzee-enriched categories. (E) Examples of individual loci representing each of the three defined categories. The top track represents sequencing reads from H3K9me3 ChIP-seq experiments, and the bottom track gene expression levels of the MALRD1, CACNA1B and FANK1 genes determined by RNA-seq. Also see Figure 1—figure supplements 1–14.
Figure 1—figure supplement 1
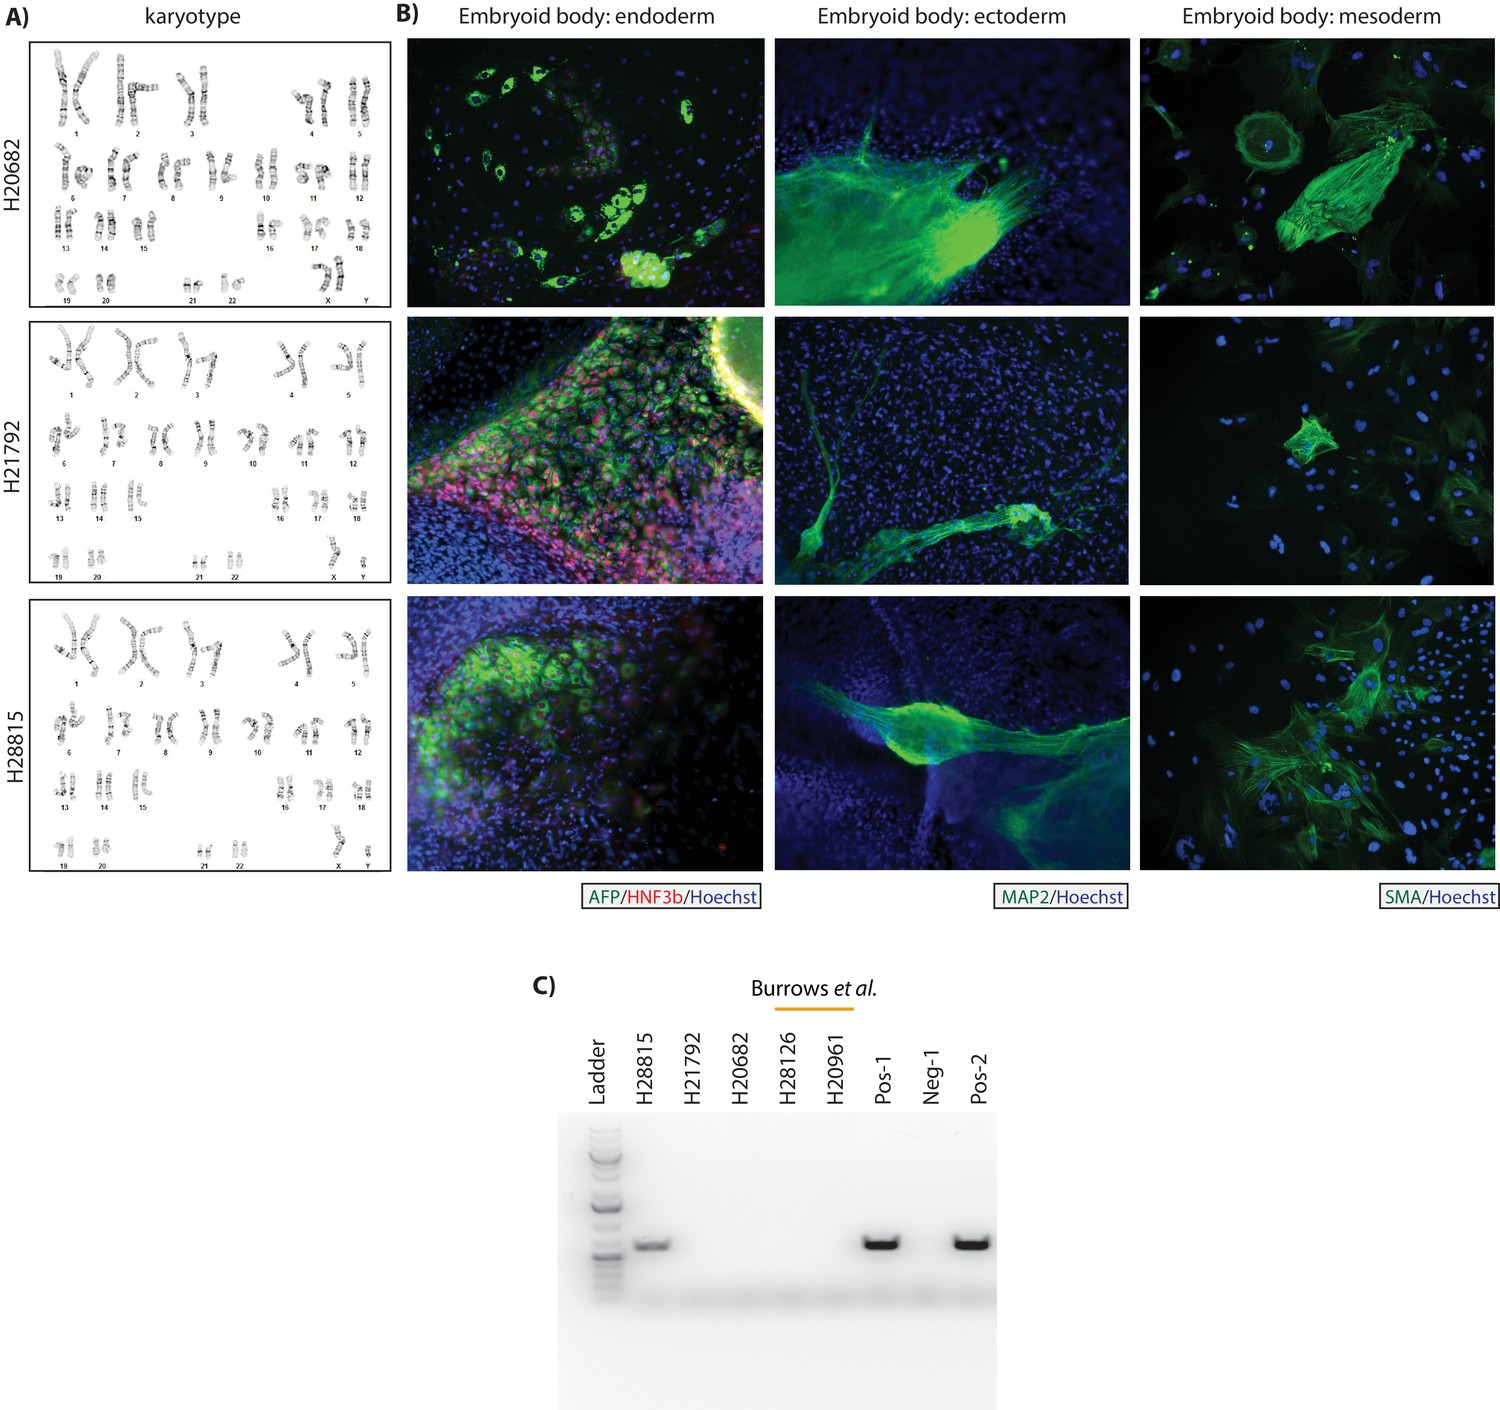
Newly generated human fibroblast-derived iPSCs have normal karyotypes and are able to differentiate into each of the three germ layers.
(A) Chromosome integrity analysis by metaphase spread. (B) Immunocytochemistry for markers from each of the three germ layers in spontaneously formed embryoid bodies. Evidence for endoderm differentiation is shown by positive staining for AFP and HNF3b, ectoderm by MAP2 staining, and mesoderm by SMA staining. Nuclei are stained with Hoechst. (C) PCR products of the episomal reprogramming vectors used to reprogram the fibroblasts. Pos-1: 1 pg mixture of reprogramming plasmids. Neg-1: 100 ng mixture of human and chimpanzee fibroblast DNA without added vector, Pos-2: 100 ng mixture of human and chimpanzee fibroblast DNA with a 1 pg mixture of reprogramming plasmids. H22815 tested positive for episomal vector but as it was not an outlier in any other analysis we chose to include it in our study.
Figure 1—figure supplement 2
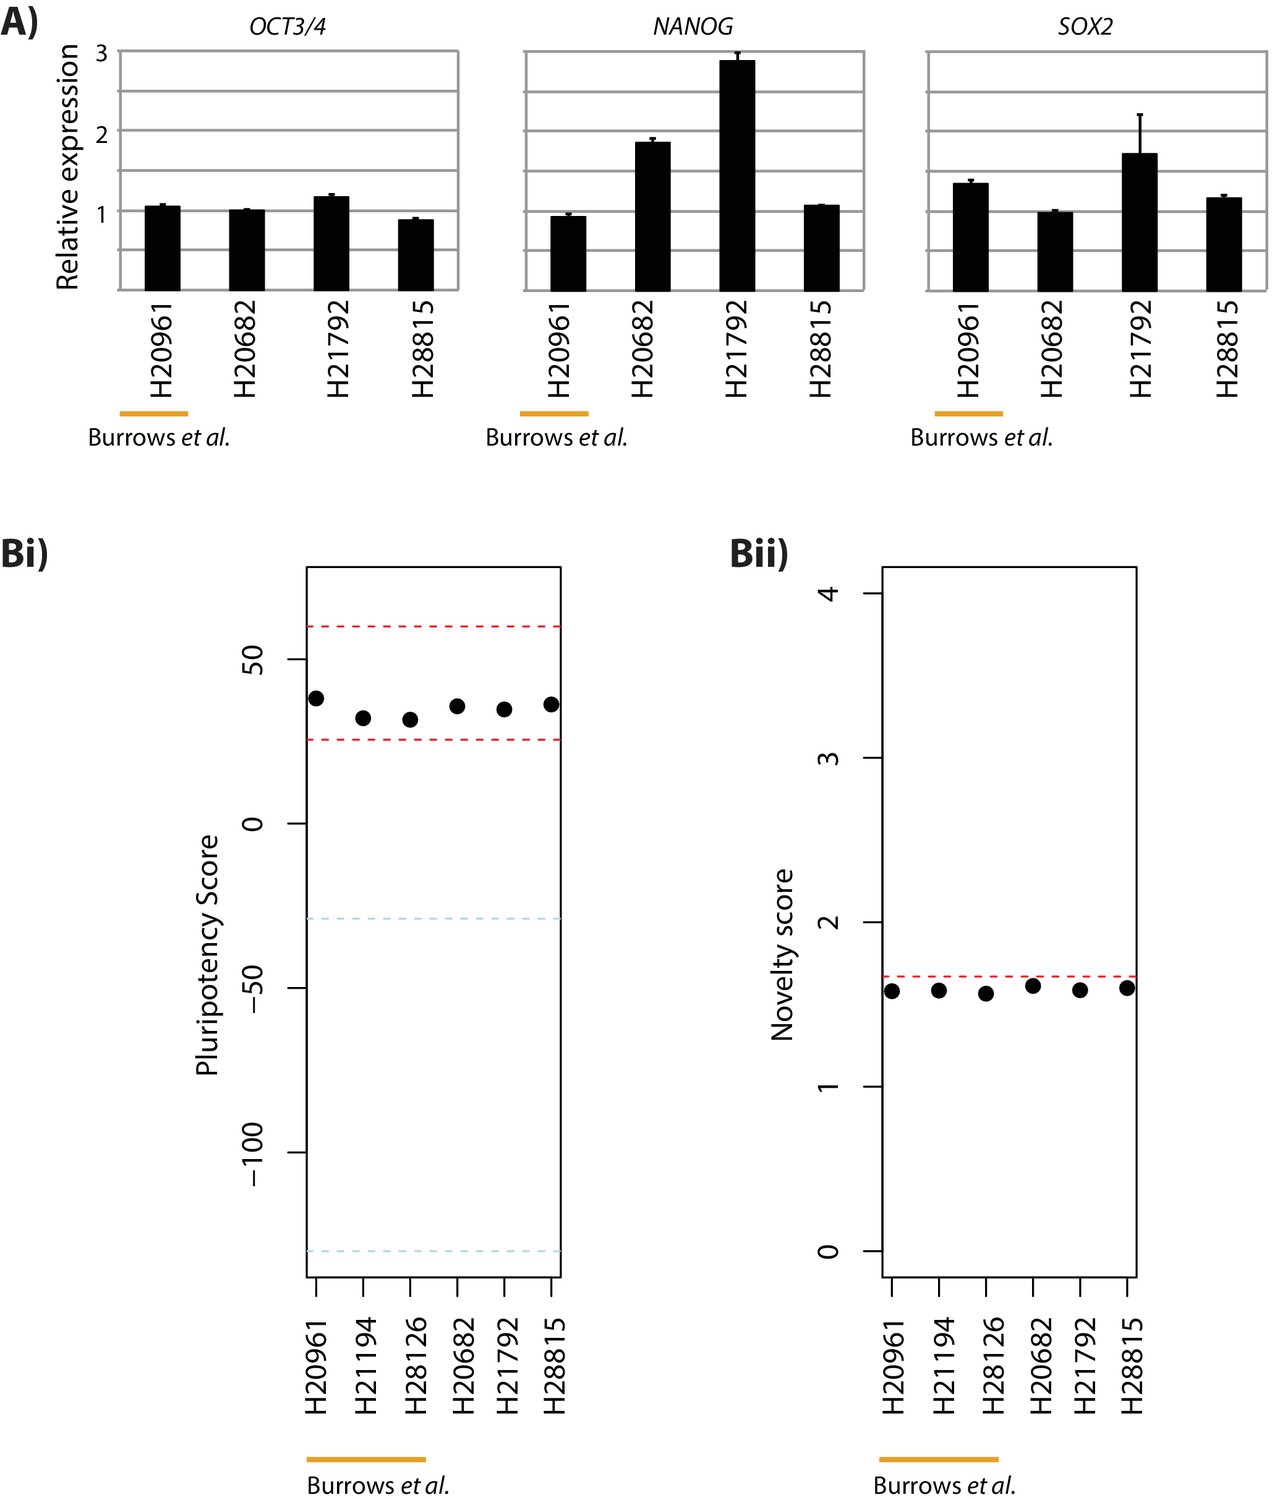
Human fibroblast-derived iPSCs exhibit gene expression profiles consistent with pluripotent cells.
(A) Expression of the core pluripotency genes OCT3/4, NANOG and SOX2 relative to GAPDH determined by qPCR. Error bars represent standard deviation from three technical replicates (Bi) PluriTest-derived pluripotency scores (Muller et al.) as a measure of the overall pluripotency gene expression signature of each sample. The empirical range in which samples’ global gene expression profiles are consistent with known pluripotent cells is shown in red. Non-iPSCs fall in the score range indicated by the blue lines. (Bii) PluriTest-derived novelty score as a measure of contamination from differentiated cells. The empirical threshold (1.67) below which samples’ gene expression profiles are consistent with known pluripotent stem cells is shown in red. Fibroblast-derived iPSCs previously described in Burrows et al. are shown for comparison.
Figure 1—figure supplement 3
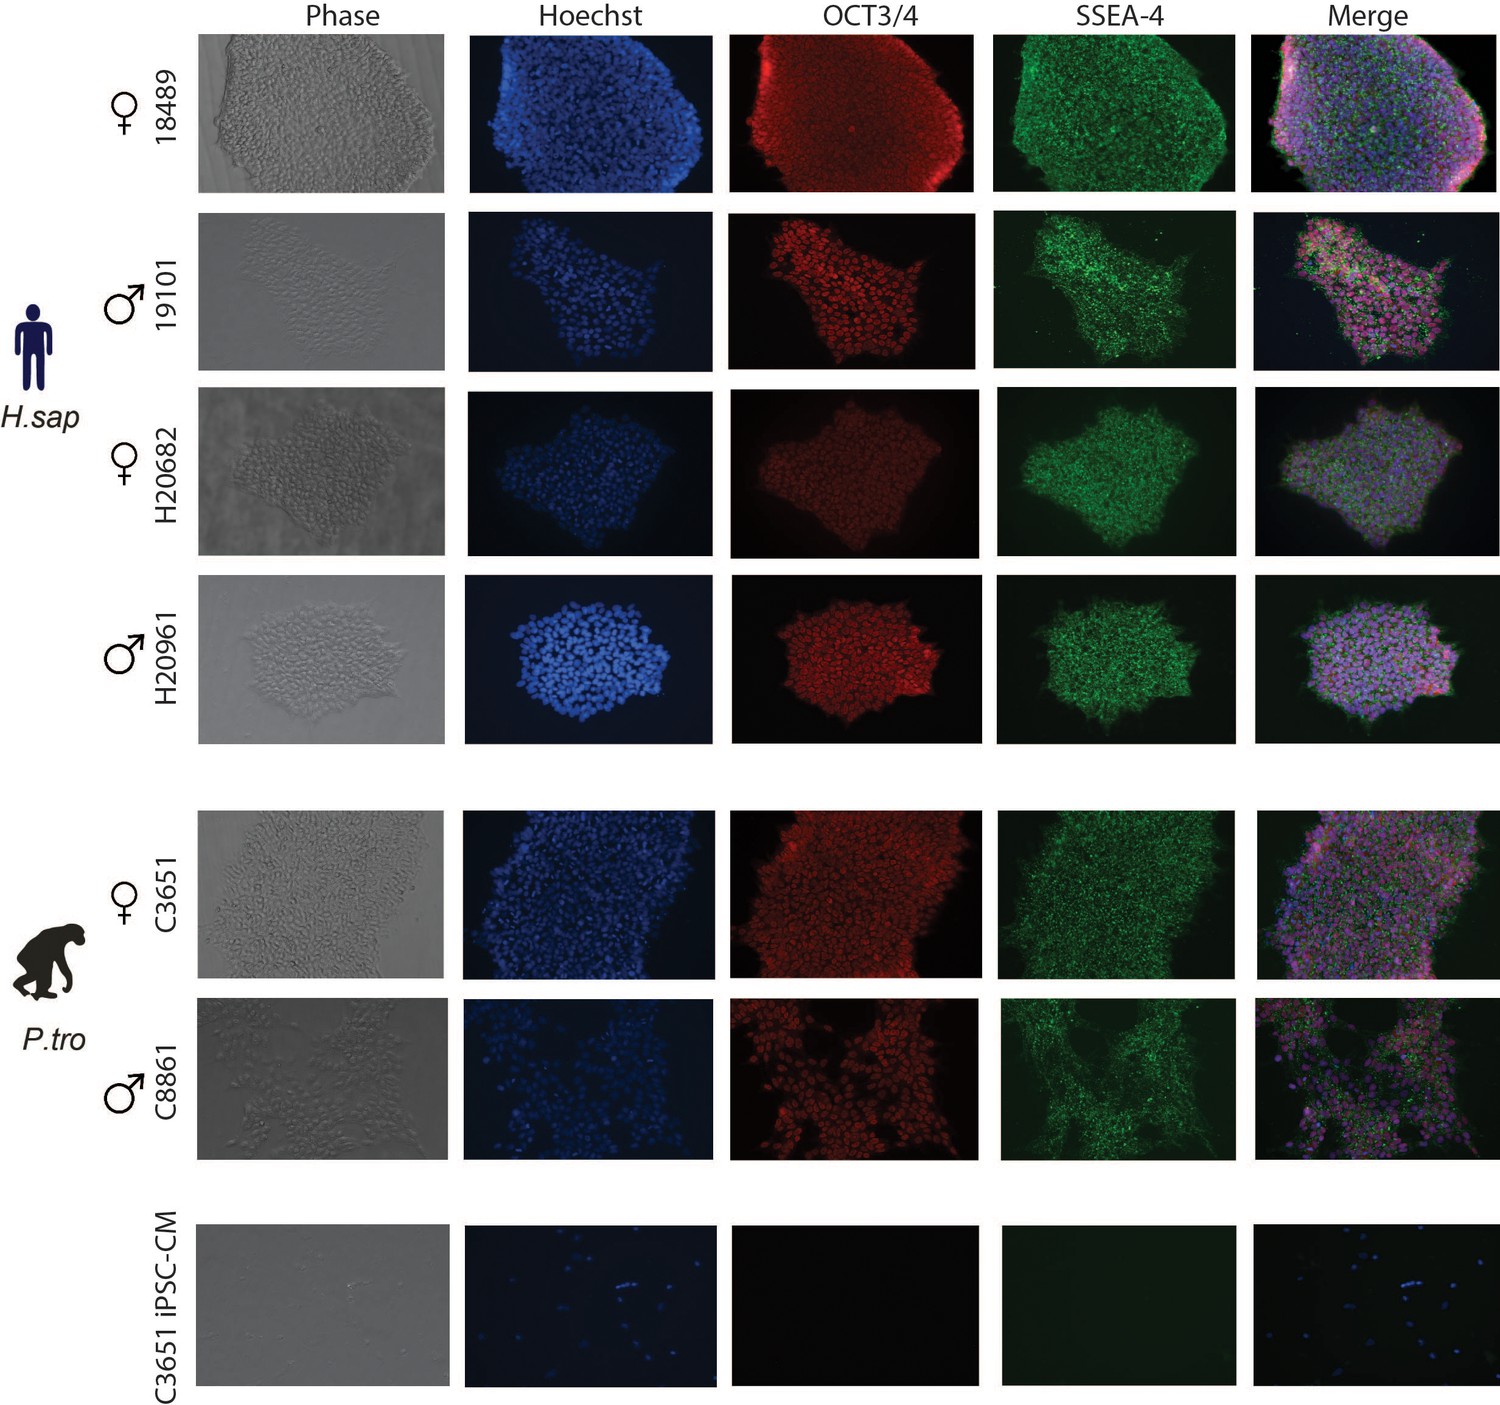
Human and chimpanzee iPSCs express key pluripotency factors.
Immunocytochemistry for nuclear OCT3/4 and cytoplasmic SSEA-4 in a subset of iPSCs from male and female human and chimpanzee individuals. Nuclei are stained with Hoechst. iPSC-derived cardiomyocytes (iPSC-CM) are shown as a negative control.
Figure 1—figure supplement 4
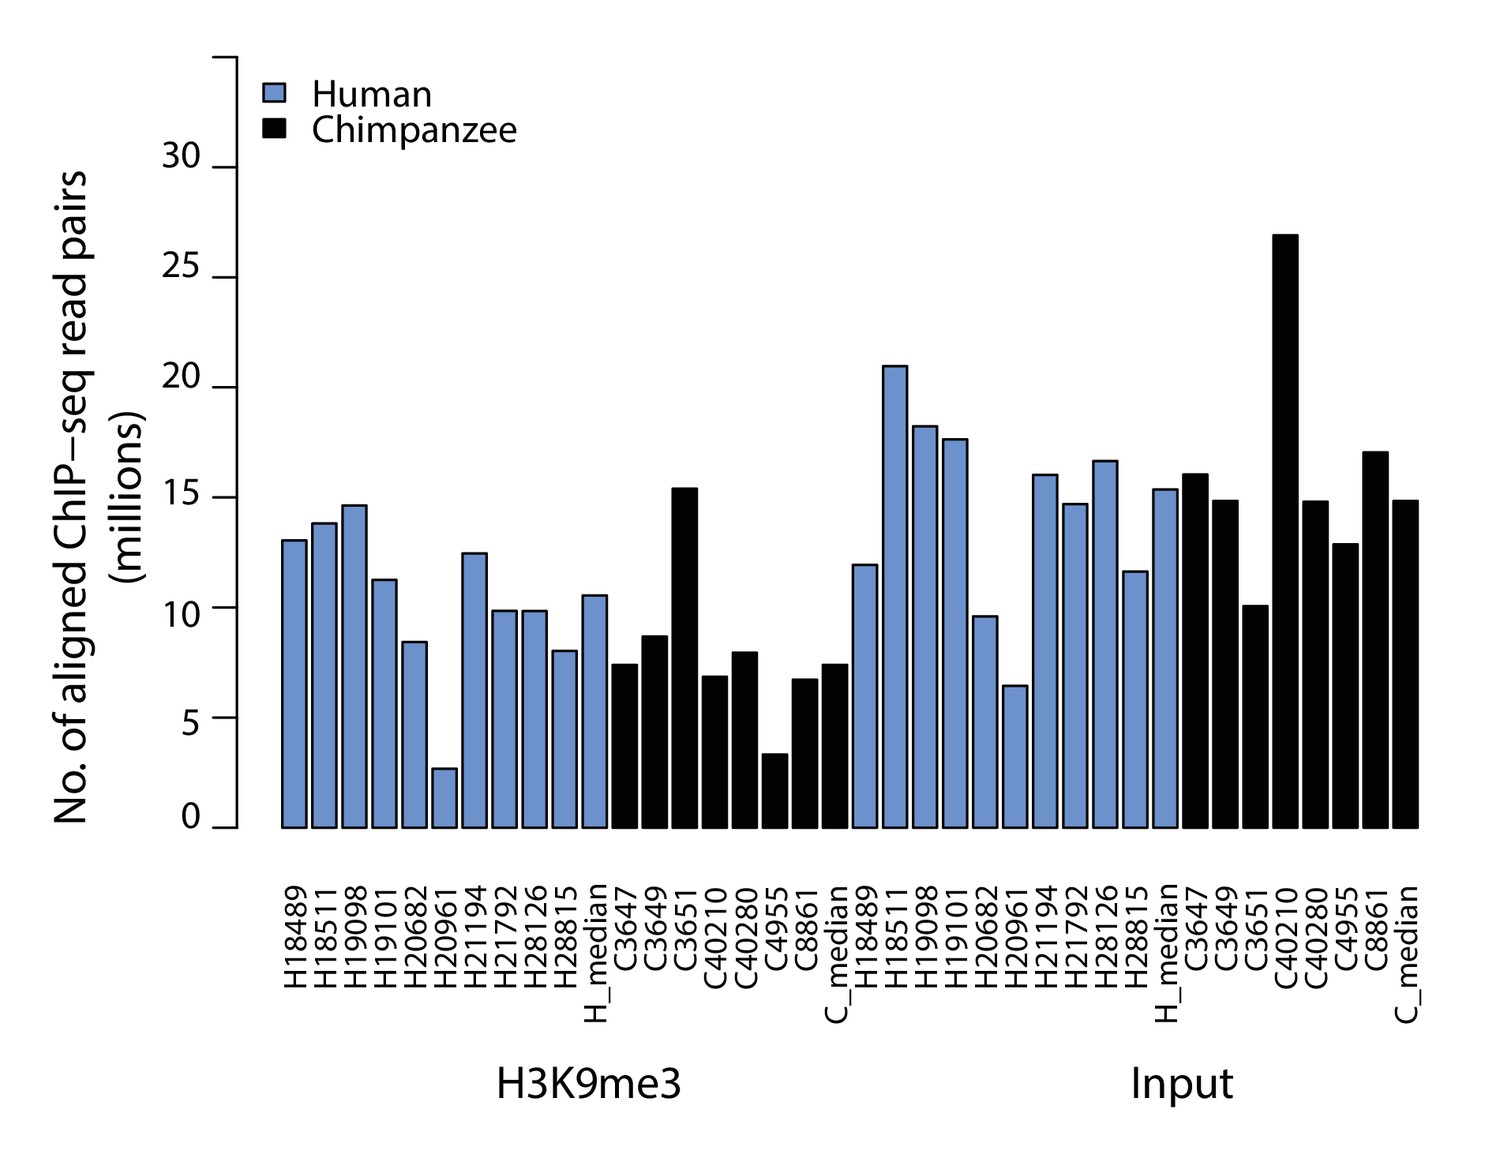
Number of ChIP and Input sequencing reads are similar across species.
Total number of high-quality, aligned read pairs for each individual from human and chimpanzee.
Figure 1—figure supplement 5
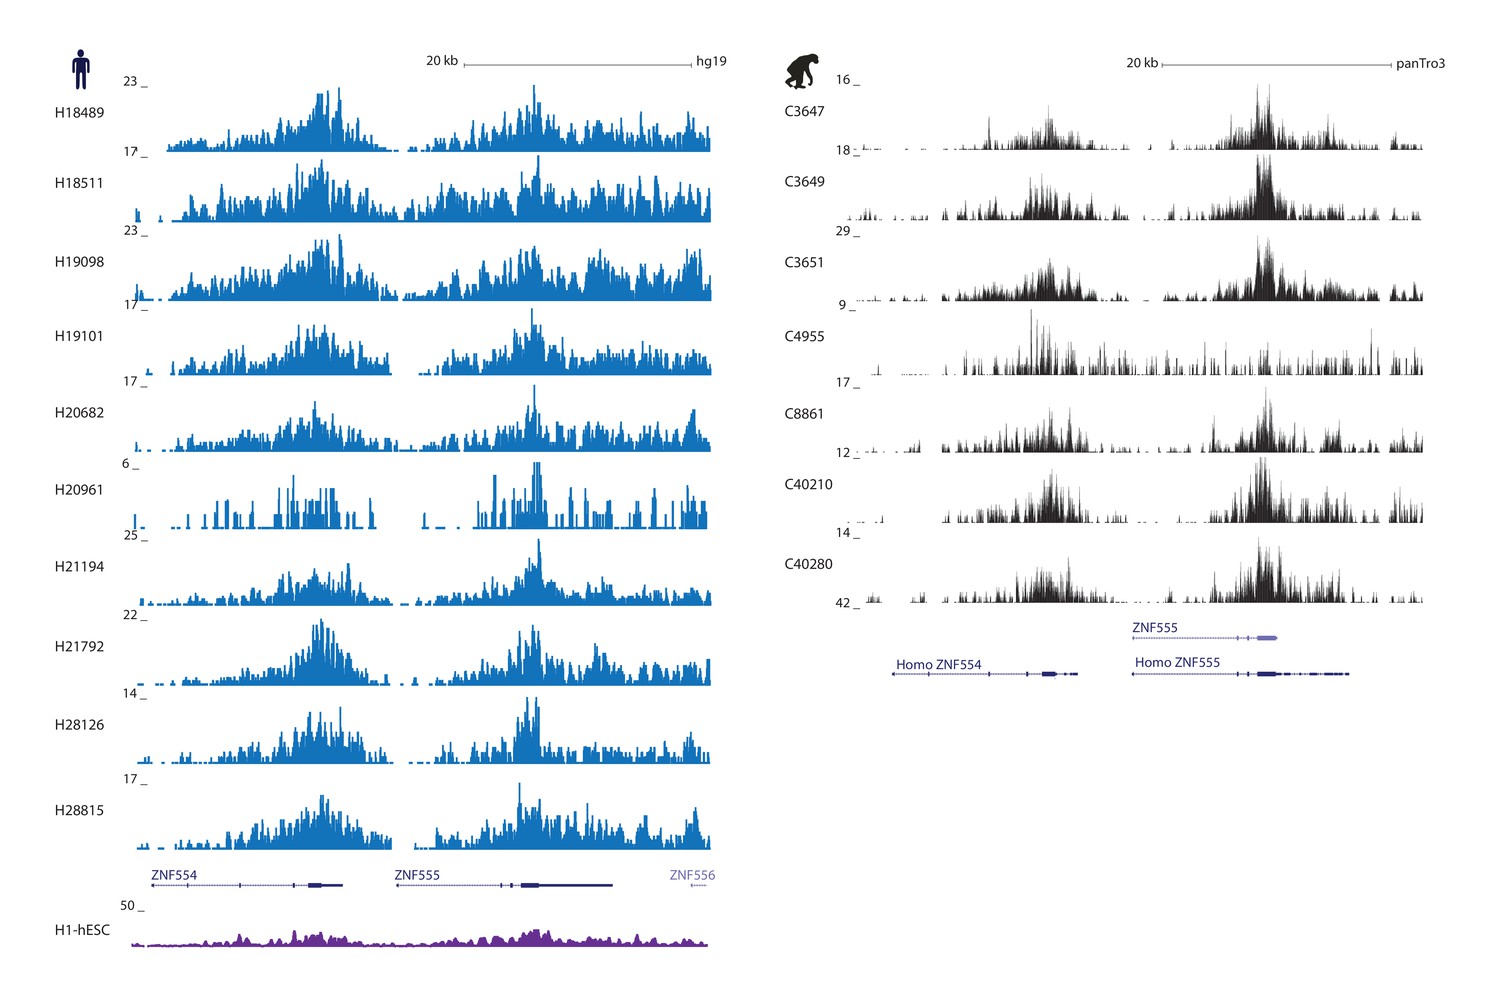
H3K9me3 ChIP-seq reads are enriched at ZNF genes in both species.
H3K9me3 ChIP-seq reads in 10 human iPSCs (blue), the H1 hESC line from ENCODE (purple), and 7 chimpanzees (black) at the ZNF554 and ZNF555 genes.
Figure 1—figure supplement 6

The number of ChIP-seq peaks is similar in human and chimpanzee.
Number of H3K9me3 ChIP-seq peaks identified in each individual at five different FDR thresholds.
Figure 1—figure supplement 7
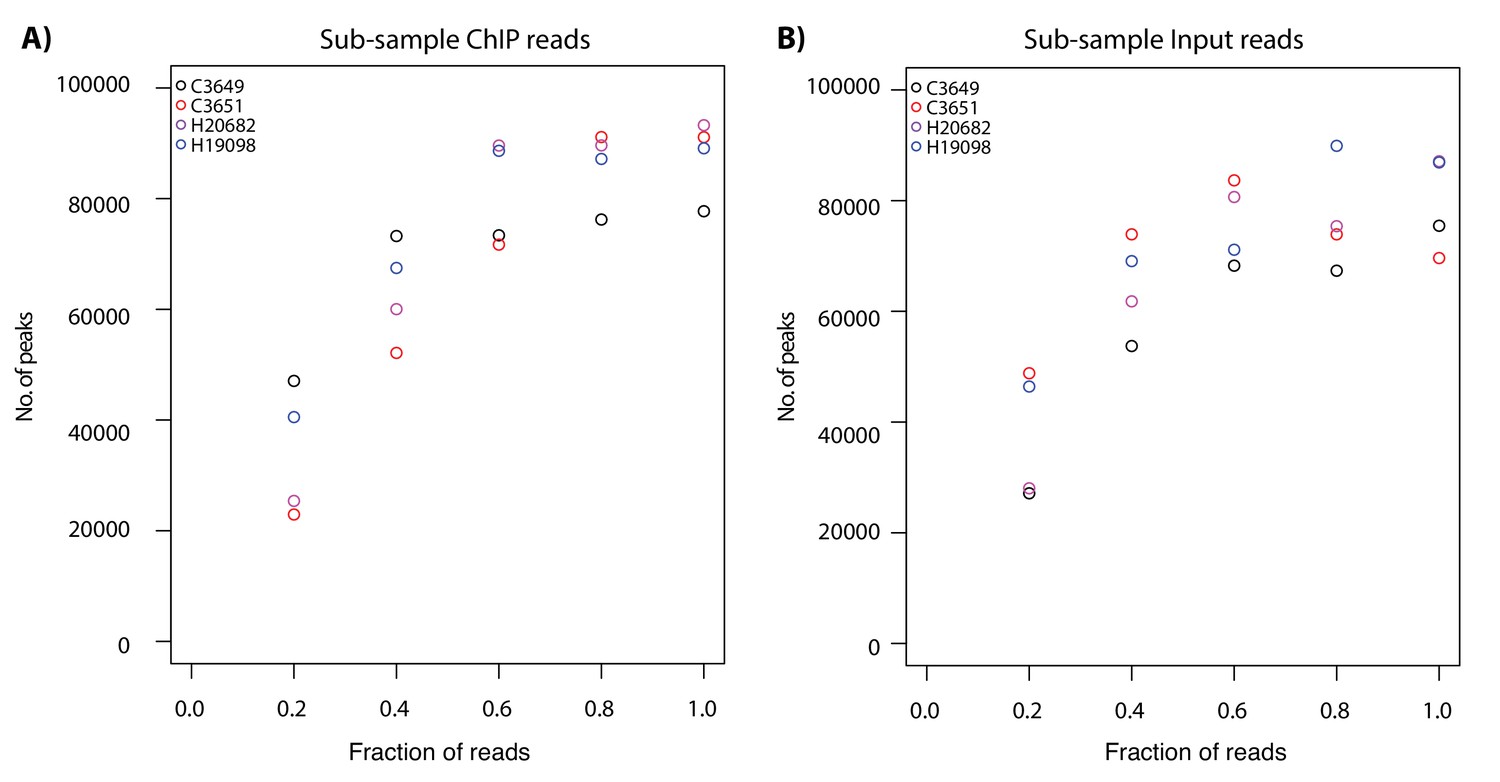
ChIP-seq peak numbers approach saturation with increasing read depth.
(A) Number of H3K9me3 ChIP-seq peaks called at a FDR of 10% while sub-sampling the number of ChIP-seq reads from C3651 (red) and H19098 (blue) (~15 million total reads), and C3649 (black) and H20682 (purple) (~9 million total reads). (B) Number of H3K9me3 ChIP-seq peaks called at a FDR of 10% while sub-sampling the number of Input reads from C3651 and H19098 (~35 million total reads), and C3649 and H20682 (~16 million total reads).
Figure 1—figure supplement 8
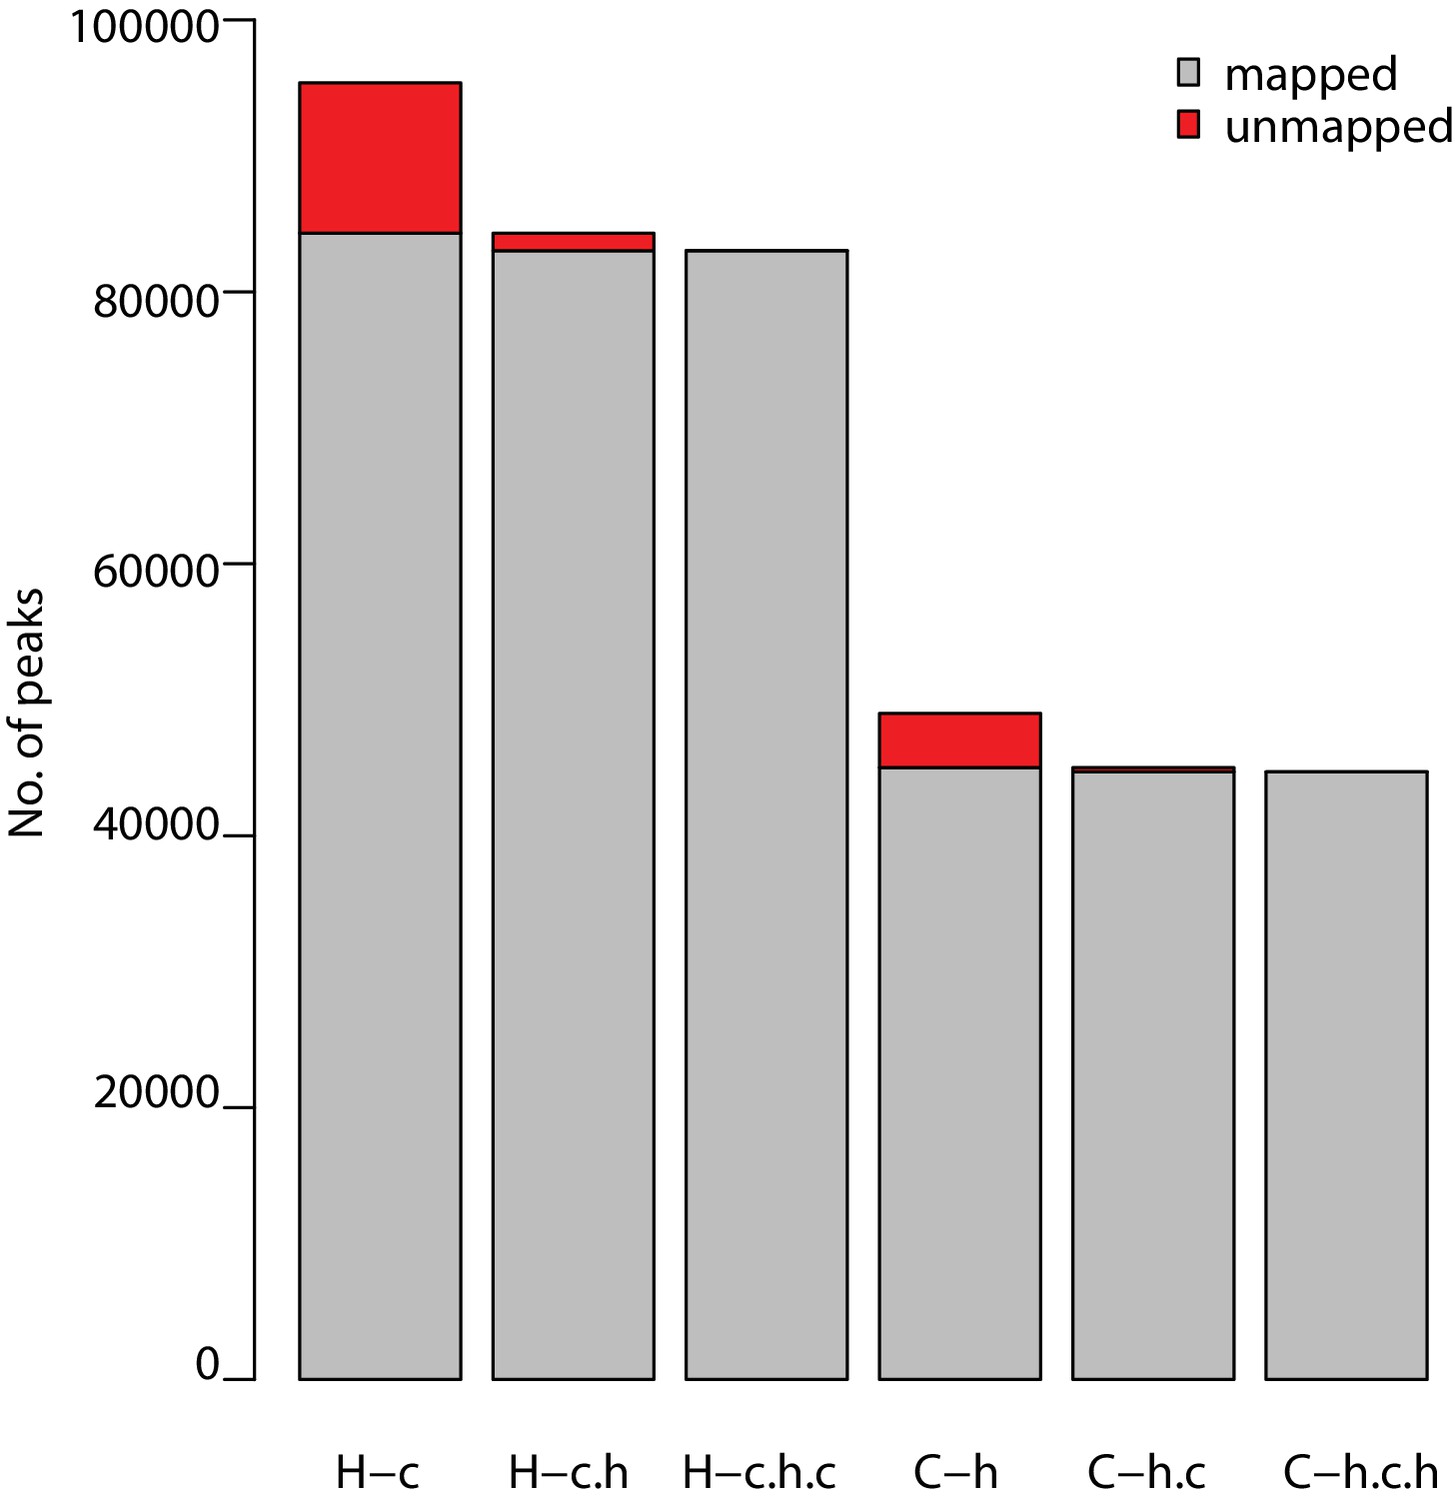
Reciprocal peak mapping retains ~90% of ChIP-seq peaks.
Number of H3K9me3 ChIP-seq peaks obtained in human (H) at a FDR of 10% that map to the chimpanzee genome (H–c), that map back to the human genome (H–c–h) and back to the chimpanzee genome (H–c–h–c). The same analysis was performed from the chimpanzee perspective (C).
Figure 1—figure supplement 9
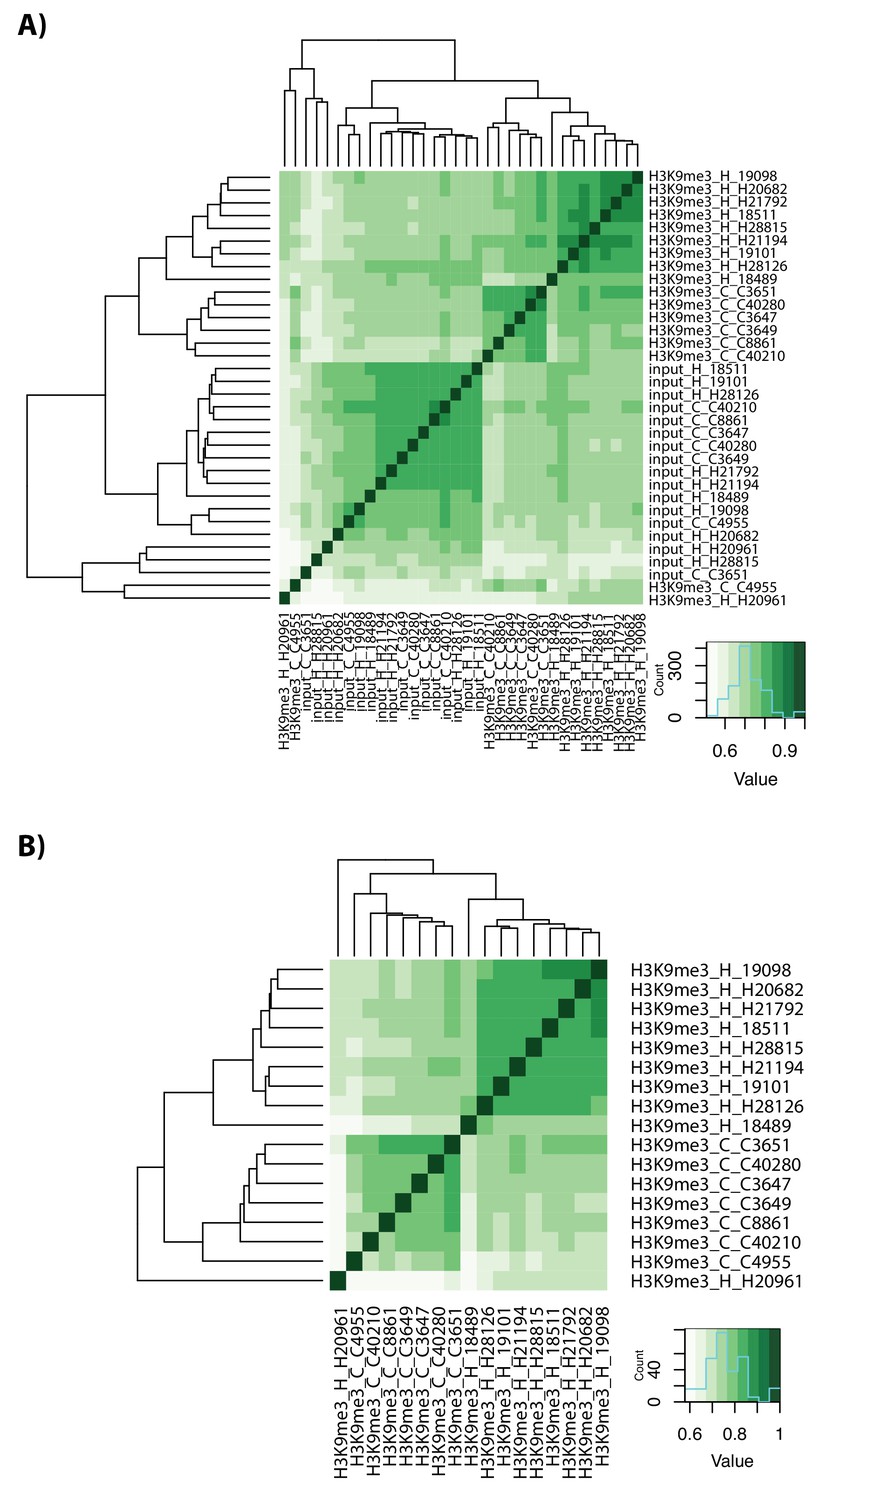
ChIP-seq data clusters by species.
(A) Spearman correlation of ChIP-seq read counts for H3K9me3 ChIP and Input samples from human (H) and chimpanzee (C) in 160,113 autosomal regions. (B) Spearman correlation of ChIP-seq read counts for H3K9me3 ChIP samples only in human and chimpanzee.
Figure 1—figure supplement 10

ChIP-seq data separates by species.
PCA analysis of H3K9me3 ChIP-seq read counts in 160,113 orthologous regions in humans from a Yoruba population (YRI: light blue), humans from a Caucasian population (CAU: dark blue), and chimpanzees (black). This plot was generated after removing the outlier, H20961, identified in Figure 1—figure supplement 9.
Figure 1—figure supplement 11
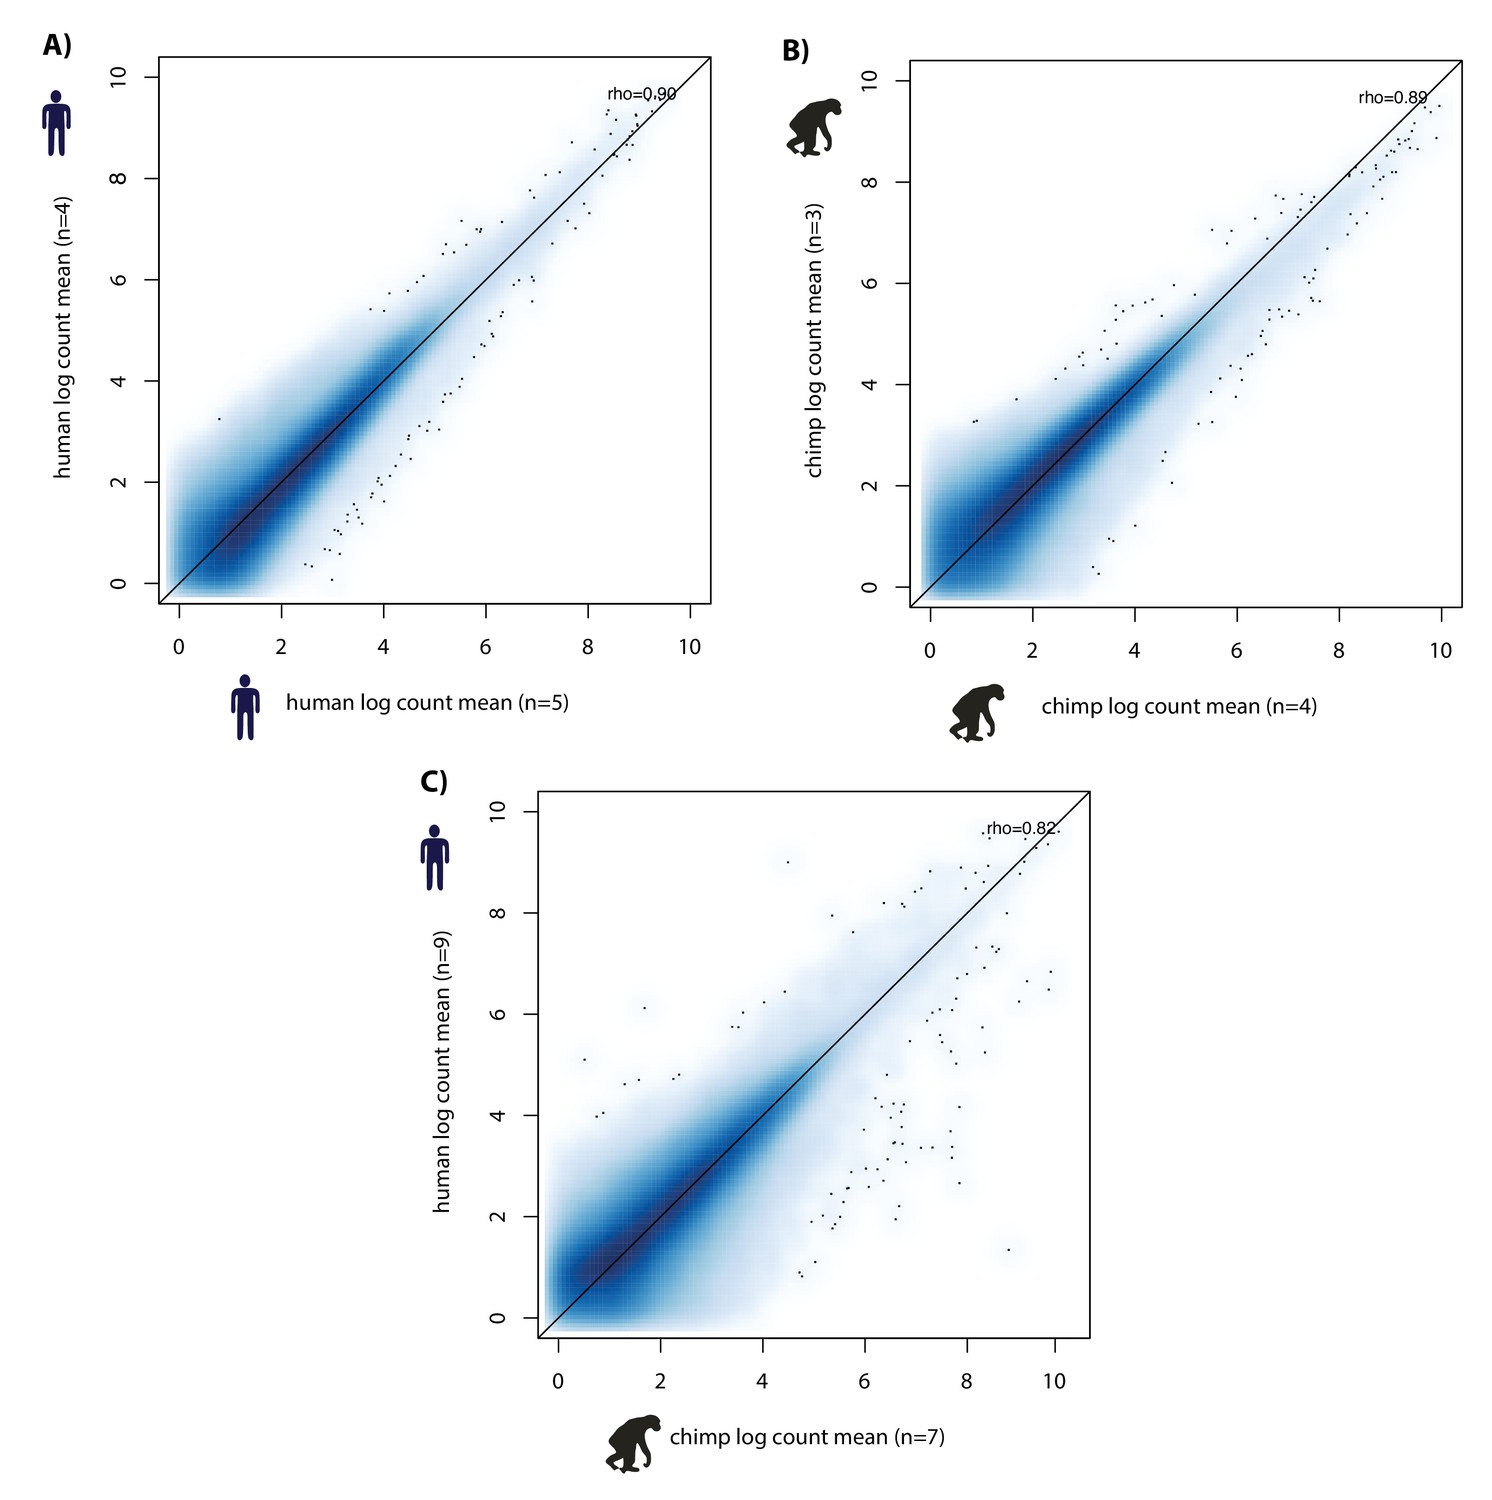
Inter-species variation is greater than intra-species variation.
H3K9me3 ChIP-seq normalized counts (divided by size factor) in 150,390 orthologous regions (counts > 0 in > 8 individuals). (A) Mean H3K9me3 counts in five humans versus mean counts in four humans. (B) Mean counts in three chimpanzees versus mean counts in four chimpanzees. (C) Mean human count (nine individuals) versus mean chimpanzee count (seven individuals).
Figure 1—figure supplement 12

Differential enrichment analysis identifies H3K9me3 regions enriched in each species.
(A) Distribution of p values from the DESeq2 differential enrichment analysis. (B) Example loci from each of the three categories determined by differential enrichment analysis. Normalized ChIP-seq counts in each individual from each species in each of the three identified categories: higher H3K9me3 enrichment in chimpanzee (Chimpanzee-enriched), similar enrichment in both species (Shared), and higher enrichment in human (Human-enriched).
Figure 1—figure supplement 13
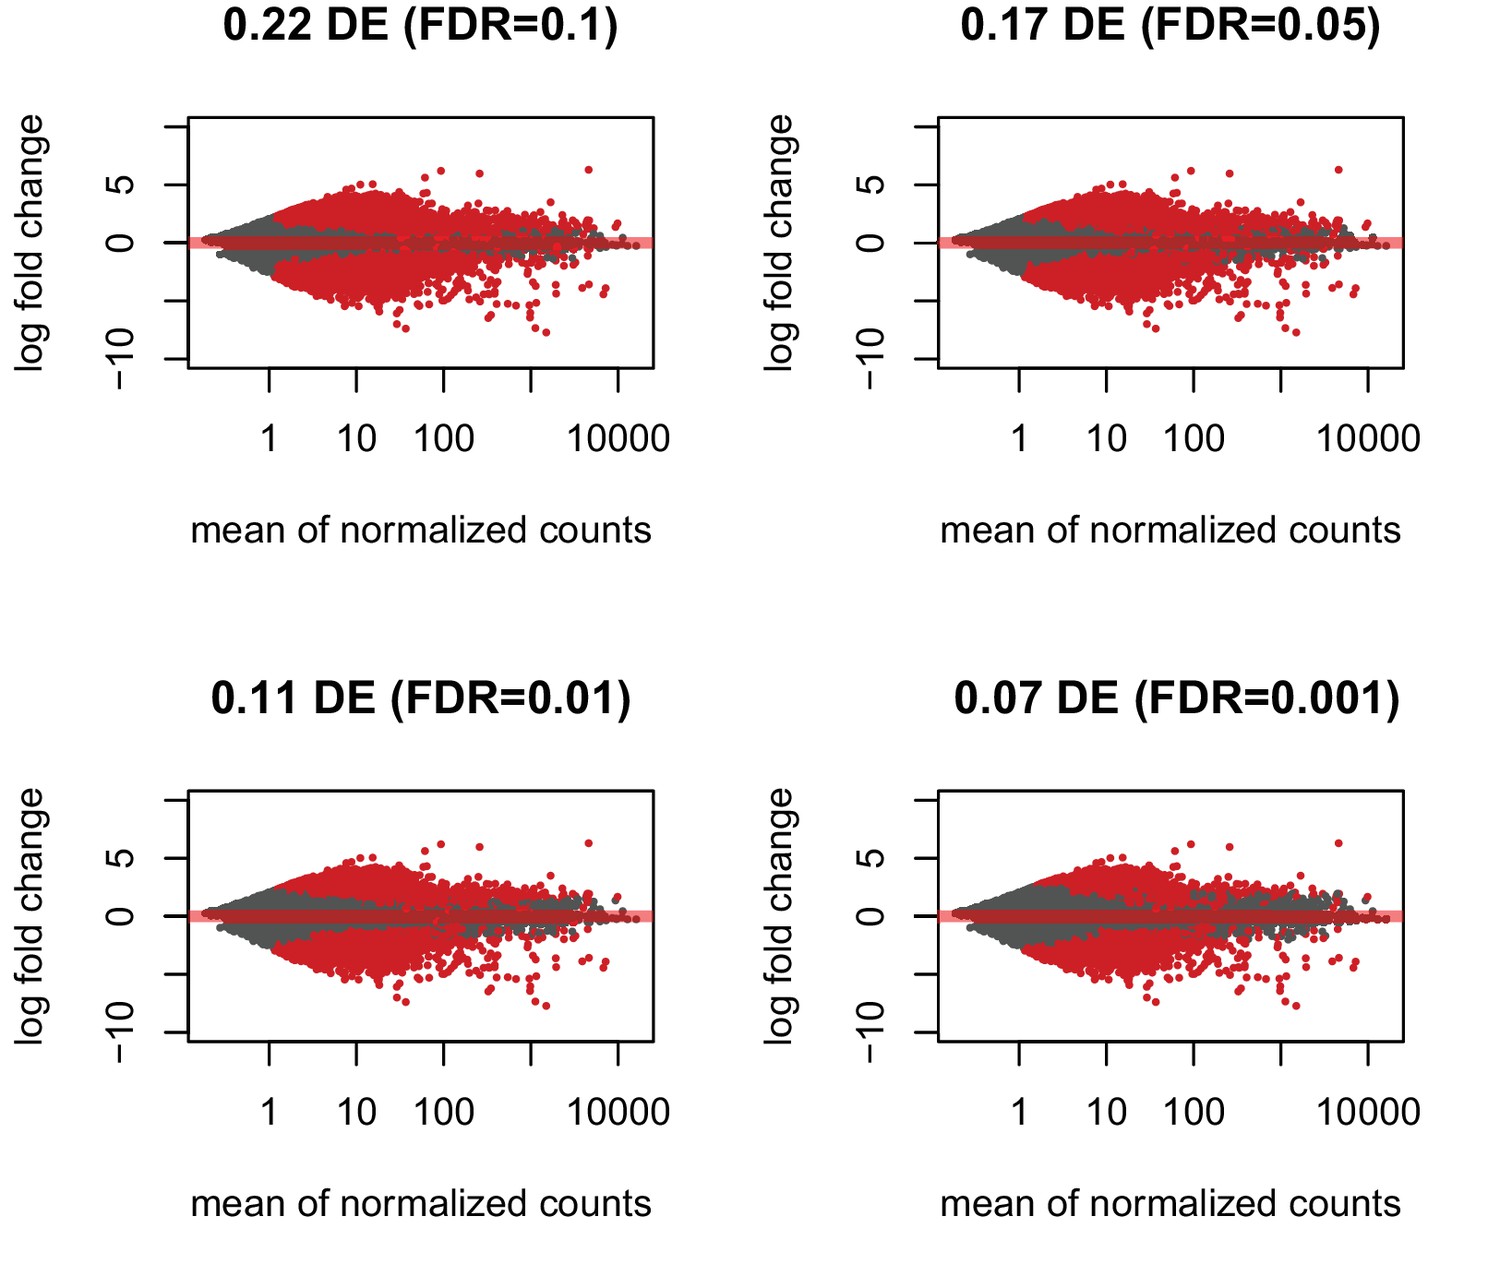
Proportion of regions differentially enriched between species is robust with respect to the filtering approach used.
Instead of requiring > 8 individuals across both species to have > 0 counts per region, a species-specific filtering step was used such that only regions with > 0 counts in > 4 chimpanzees and > 5 humans were included (greater than half of the total number of individuals in each species). MA plots at four different FDR thresholds (10, 5, 1, 0.1% FDR) with the proportion of differentially enriched regions are shown. At 1% FDR, 11% of genes are differentially enriched as in the species-independent filtering approach.
Figure 1—figure supplement 14

Majority of H3K9me3 regions differentially enriched between species have a small effect size.
The proportion of regions at each absolute log2 fold change identified between species estimated following adaptive shrinkage. 87% of H3K9me3 regions have an absolute log2 fold change between species of less than 1.
Figure 2 with 1 supplement

Transposable element silencing is associated with particular transposable element classes.
(A) Bioinformatic pipeline used to identify TEs that are orthologous between humans and chimpanzees using RepeatMasker (rmsk) tracks in each species. (B) The proportion of all TEs that overlap an orthologous H3K9me3 region (H3K9me3 peak identified in at least one individual of one species) (purple) compared to those that do not overlap an orthologous H3K9me3 region (magenta). (C) Each orthologous TE instance is further hierarchically classified into Class, Family and Type. The proportion of all orthologous TEs belonging to the five main TE classes (SINE: yellow, LINE: orange, DNA: peach, SVA: brown, LTR: red) that do not overlap an H3K9me3 region in either species, and the proportion of TEs that do overlap a H3K9me3 region. The small number of SVA elements means that this class is not visible in the pie chart. Also see Figure 2—figure supplement 1.
Figure 2—figure supplement 1
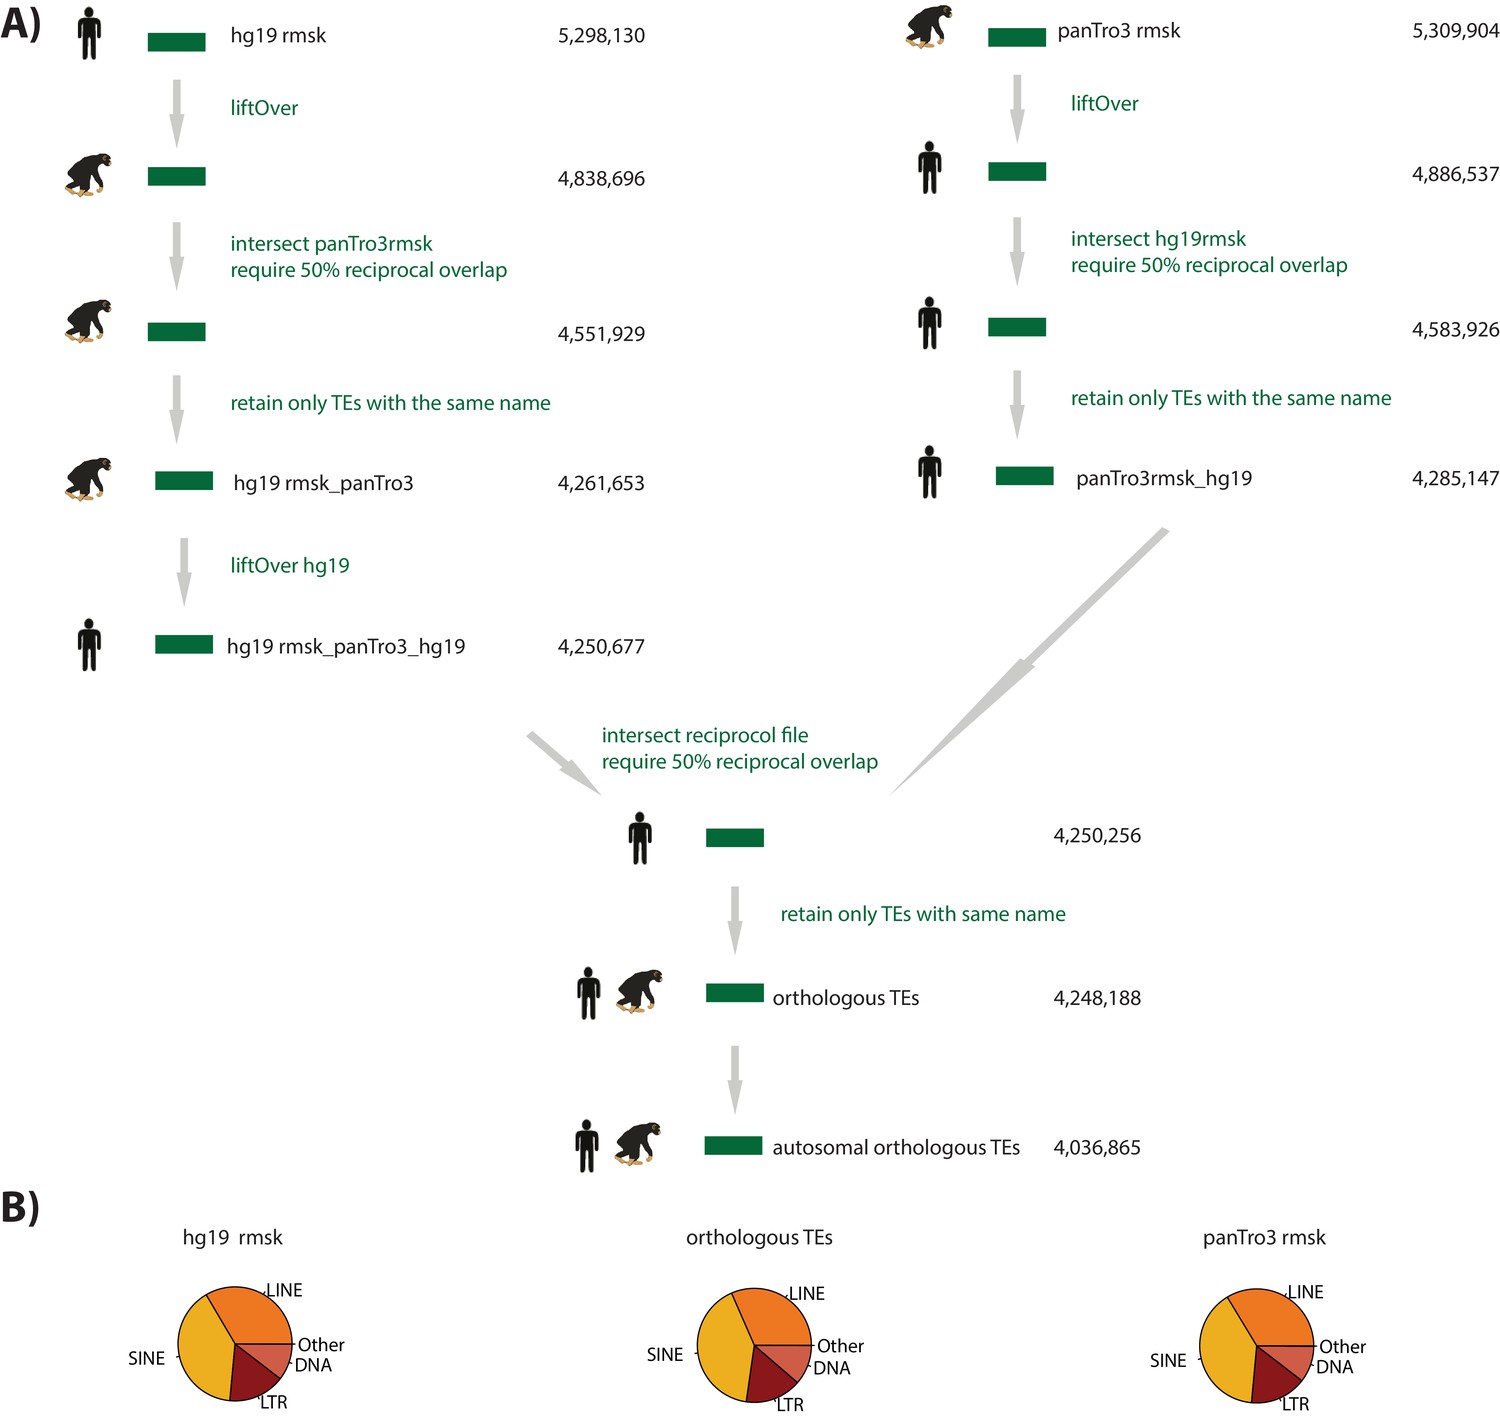
Orthologous TEs reflect the distribution of TE classes in the human and chimpanzee genome.
(A) Bioinformatic pipeline to generate orthologous TEs. (B) The proportion of each TE class in the human genome (hg19), chimpanzee genome (panTro3), and our orthologous TE set.
Figure 3 with 1 supplement
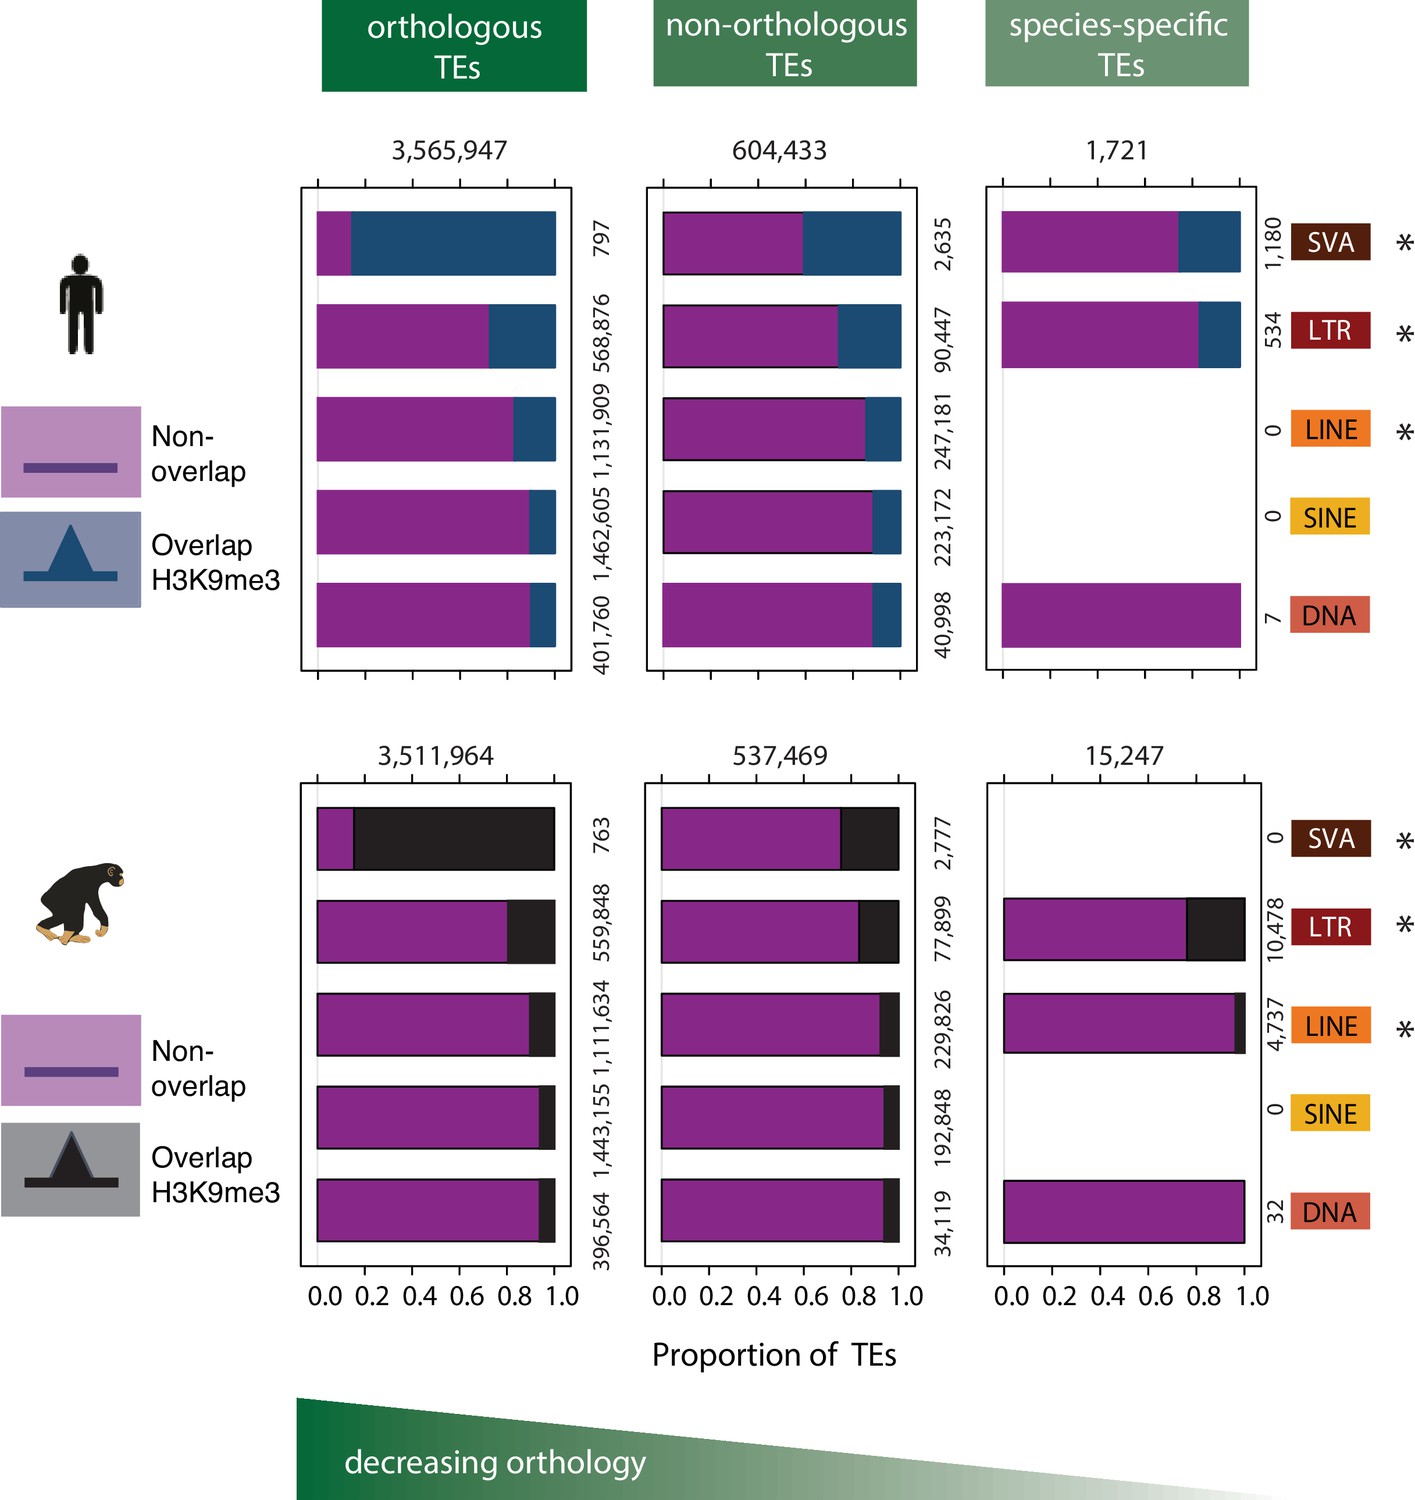
Patterns of preferential TE class-based silencing are maintained as orthology decreases.
Within-species analysis of the proportion of orthologous TEs (left panel), TEs that are not orthologous between the two species (middle panel), and TEs that are not orthologous and whose type is annotated in a single species (right panel), that overlap any H3K9me3-enriched region identified in that species. Magenta represents those TEs that do not overlap with any H3K9me3 region identified in that species, blue represents TEs that overlap any H3K9me3 regions in human, and black those TEs that overlap with H3K9me3 regions in chimpanzee. The absence of data in the species-specific category reflects that there are no species-specific annotations in these TE classes. Asterisk denotes when there is a significant difference between orthology categories (Pearson’s Chi-squared test; p<0.001). Also see Figure 3—figure supplement 1.
Figure 3—figure supplement 1
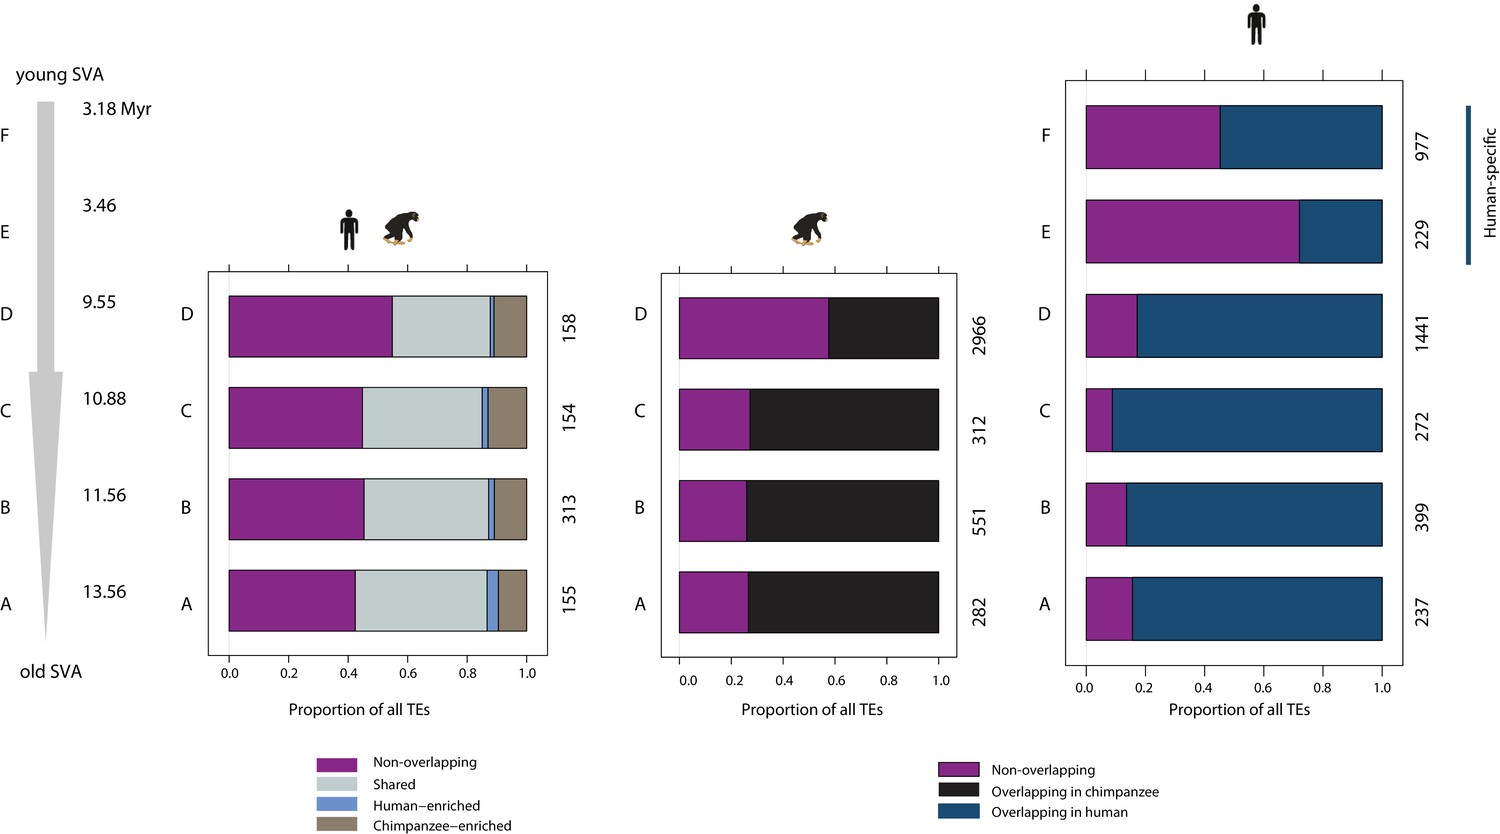
Species-specific SVA elements overlap H3K9me3 regions less frequently than orthologous SVAs.
Left panel: overlap of orthologous SVA elements by orthologous H3K9me3 regions. Middle panel: all SVA elements in the chimpanzee genome and the proportion that overlap all H3K9me3 regions identified in chimpanzee. Right panel: all SVA elements in the human genome and the proportion that overlap all H3K9me3 regions identified in human. The estimated age of each of the six SVA types is shown in millions of years (Myr)(Wang et al., 2005).
Figure 4 with 3 supplements
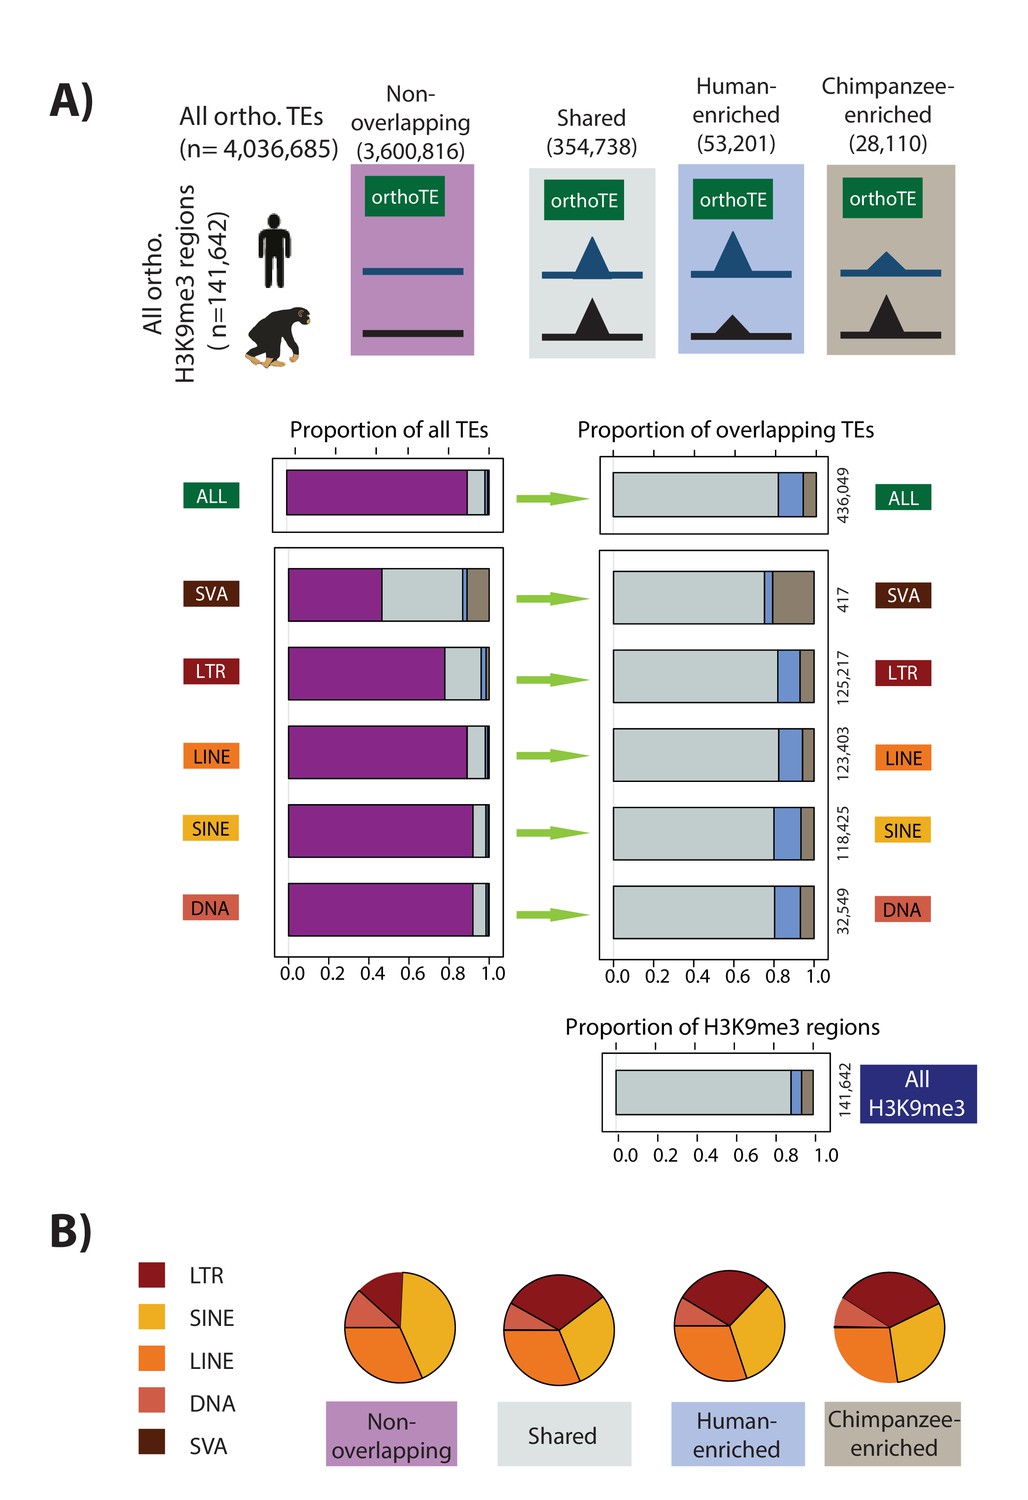
Majority of orthologous TEs may be similarly silenced in humans and chimpanzees.
(A) The proportion of orthologous TEs in each class that do not overlap an orthologous H3K9me3 region (magenta), show similar H3K9me3 enrichment in both species (grey: Shared), are enriched in human (blue), or are enriched in chimpanzee (brown) are shown. Of those orthologous TEs that overlap an orthologous H3K9me3 region, the distribution between those that are Shared, Human-enriched, or Chimpanzee-enriched is shown in the right panel. (B) The proportion of orthologous TE elements belonging to each class within each of the four H3K9me3 silencing categories (LINE: orange, SINE: yellow, LTR: red, SVA: brown, DNA: peach). The small number of SVA elements means that this class is not visible in the pie chart. Also see Figure 4—figure supplements 1–3.
Figure 4—figure supplement 1
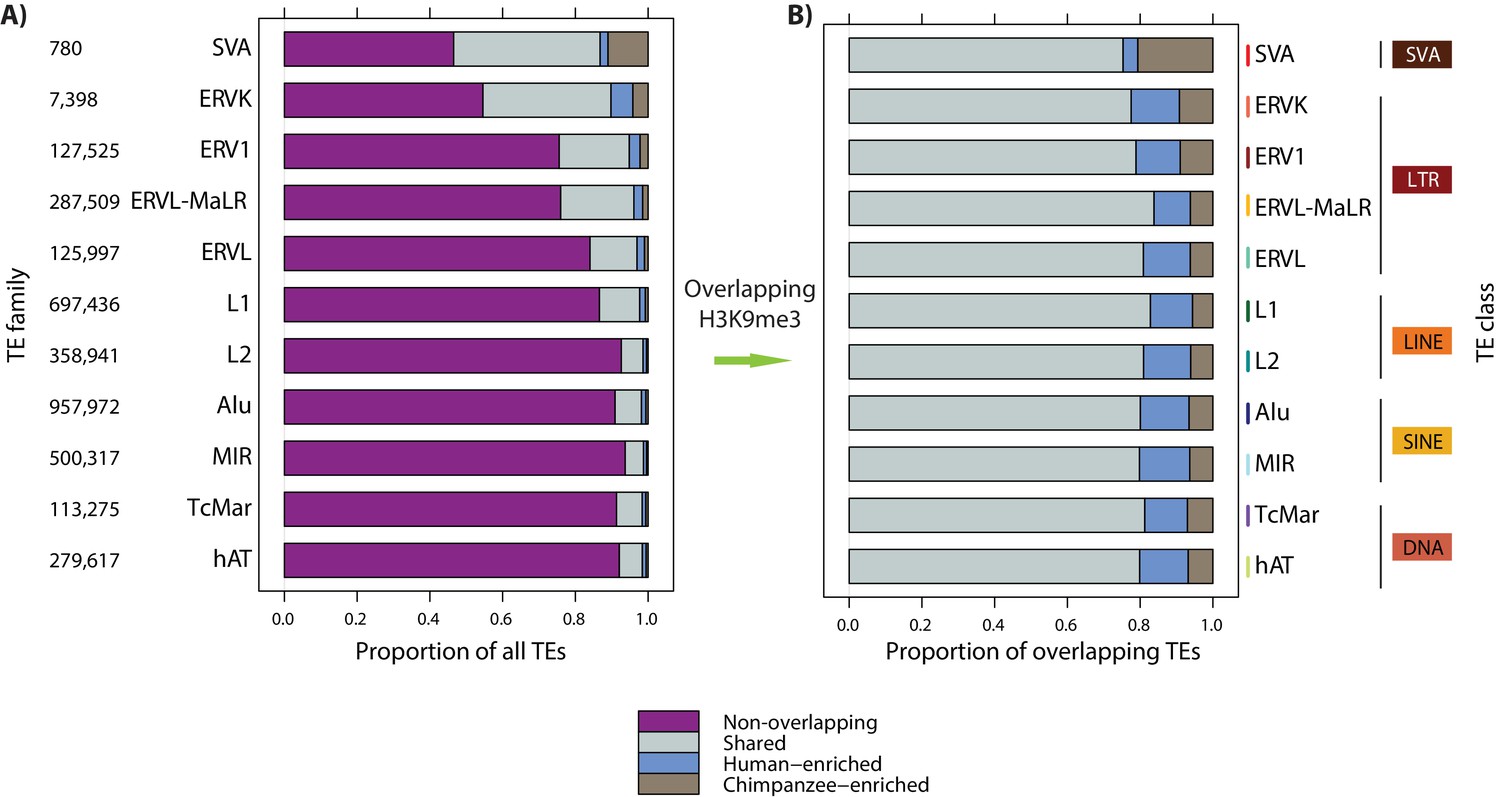
TEs across families have similar levels of H3K9me3 enrichment between species.
(A) The proportion of TEs in each family that do not overlap an orthologous H3K9me3 region (magenta), overlap an orthologous region and show similar H3K9me3 enrichment in both species (grey: Shared), are enriched in human (blue: Human-enriched), or are enriched in chimpanzee (brown: Chimpanzee-enriched) are shown. (B) The proportion of each TE family that overlaps an orthologous H3K9me3 region and is either Shared, Human-enriched or Chimpanzee-enriched. The total number of orthologous elements within each TE family is shown on the left.
Figure 4—figure supplement 2
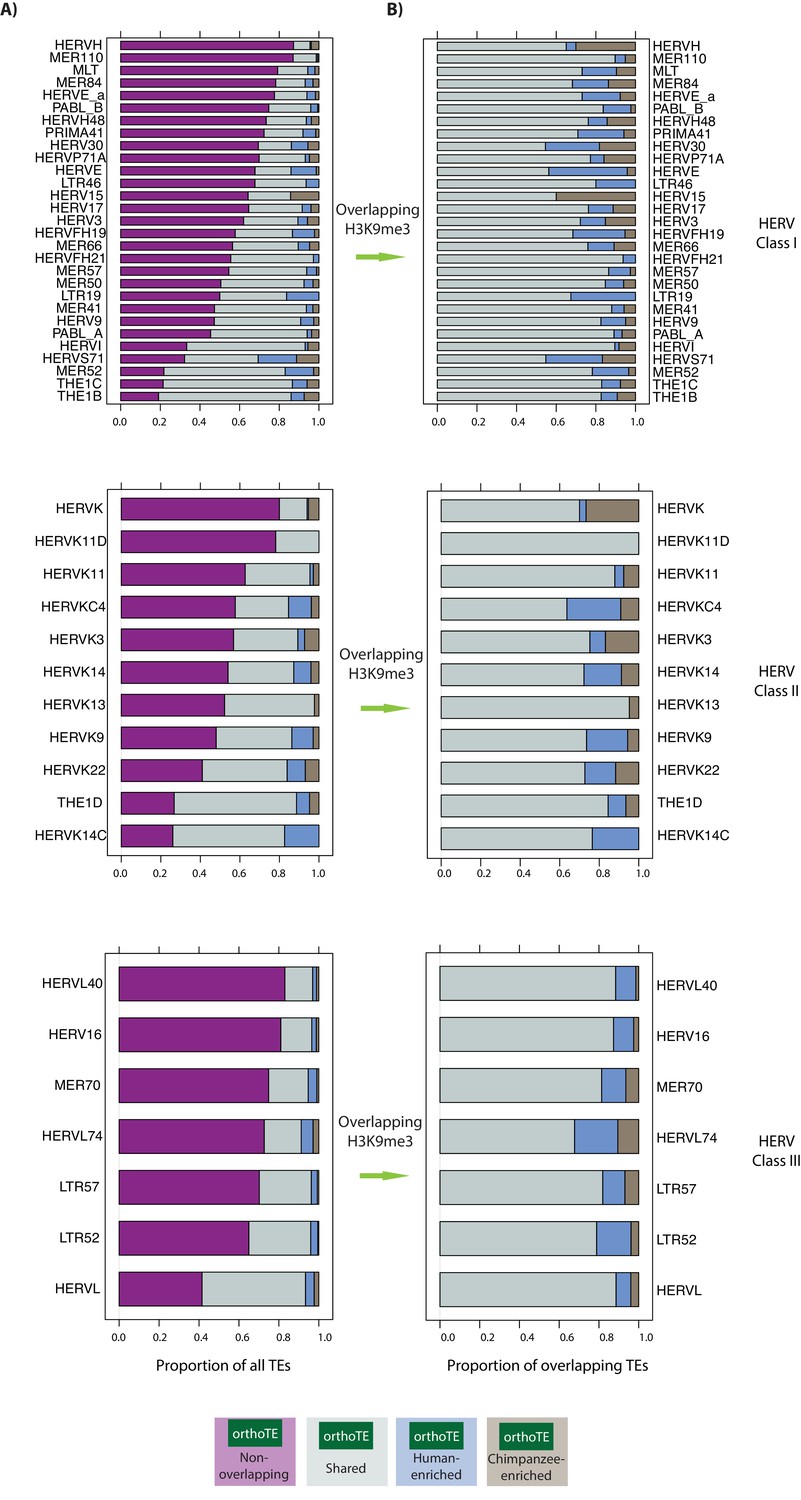
HERV TE types have variable overlap with orthologous H3K9me3 regions and variable inter-species enrichment.
(A) The proportion of HERV Class I, II and III types that do not overlap an orthologous H3K9me3 region (magenta), overlap an orthologous region and show similar H3K9me3 enrichment in both species (grey: Shared), are enriched in human (blue: Human-enriched), or are enriched in chimpanzee (brown: Chimpanzee-enriched) are shown. (B) The proportion of HERV types that overlap an orthologous H3K9me3 region and is either Shared, Human-enriched or Chimpanzee-enriched. Curated list of HERV elements from Turelli et al.
Figure 4—figure supplement 3
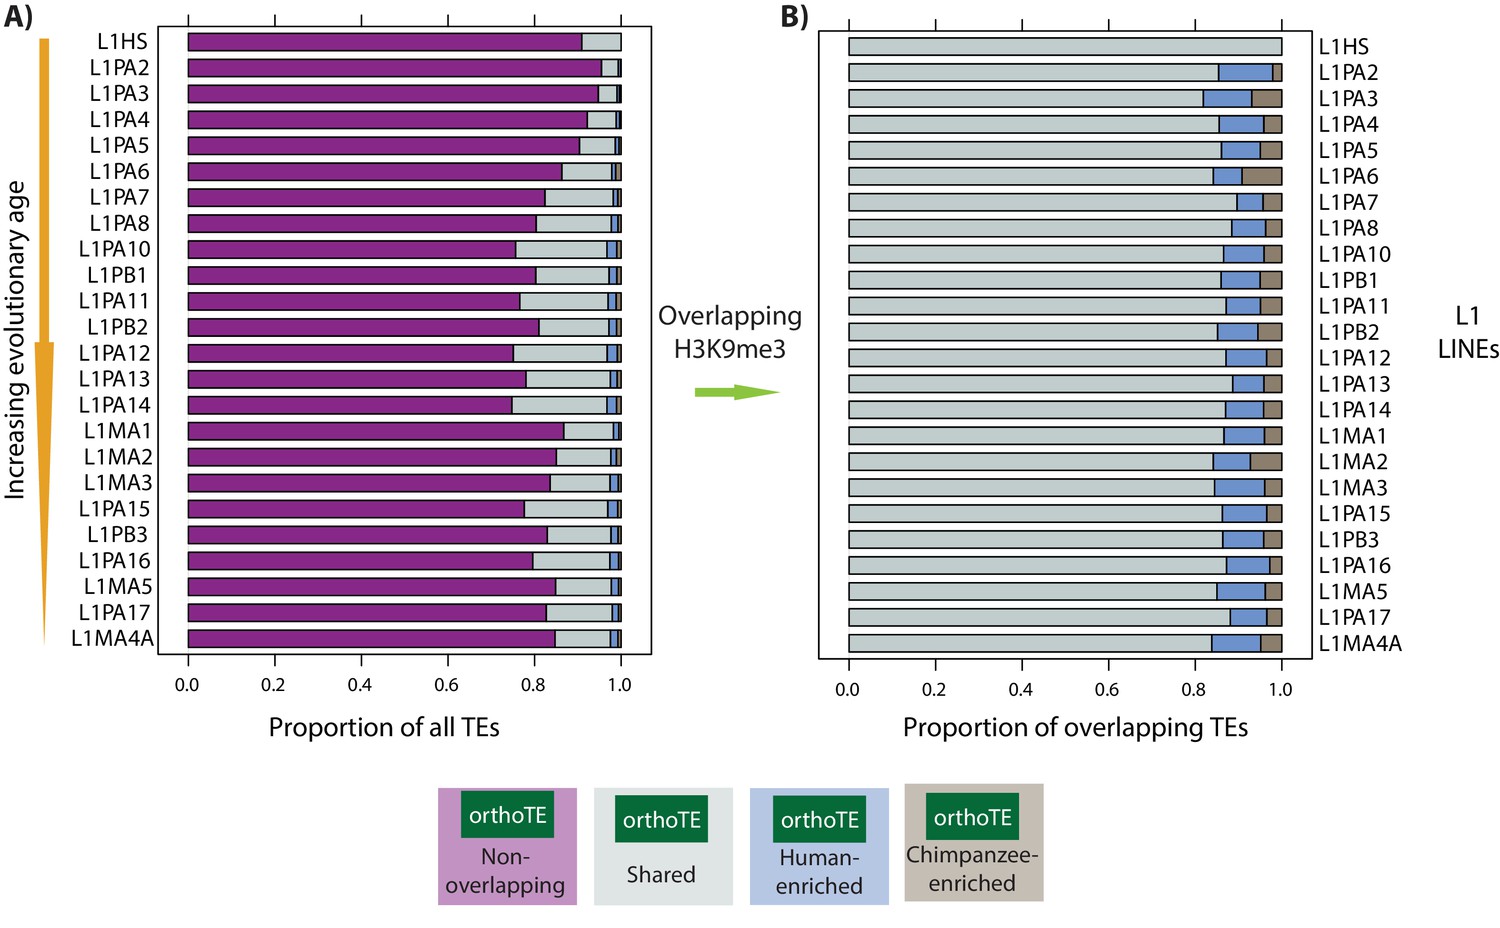
LINE-1 TE types are similarly enriched for H3K9me3 in humans and chimpanzees.
(A) The proportion of a subset of L1 types that do not overlap an orthologous H3K9me3 region (magenta), show similar H3K9me3 enrichment in both species (grey: Shared), are enriched in human (blue: Human-enriched), or are enriched in chimpanzee (brown: Chimpanzee-enriched) are shown. Elements are ordered from youngest to oldest. (B) The proportion of L1 types that overlap an orthologous H3K9me3 region and is either Shared, Human-enriched or Chimpanzee-enriched. Curated list of L1 elements from Castro-Diaz et al.
Figure 5 with 6 supplements

Majority of silenced orthologous TEs have similar properties in humans and chimpanzees.
(A) The length of all orthologous TE instances occurring within Shared, Human-enriched and Chimpanzee-enriched H3K9me3 silencing categories. (B) The length of all orthologous TEs stratified by inter-species divergence in effect size. (C) The sequence divergence from the consensus TE sequence of TEs categorized as in (A). (D) The sequence divergence of TEs categorized as in (B). (E) The distance between each TE and the closest orthologous TSS categorized as in (A). (F) The distance between each TE and the closest orthologous TSS categorized as in (B). Grey: Shared, blue: Human-enriched, brown: Chimpanzee-enriched, magenta: does not overlap an orthologous H3K9me3 region, light teal: log2 fold change less than two between species, dark teal: log2 fold change greater than two between species. (G) Orthologous TEs categorized by silencing status that overlap chromatin states annotated in the H1 hESC line. Asterisk denotes when there is a significant difference between the Shared and Non-overlapping, and high and low divergence categories (Wilcoxon-rank sum test; p<0.001). Also see Figure 5—figure supplements 1–6.
Figure 5—figure supplement 1
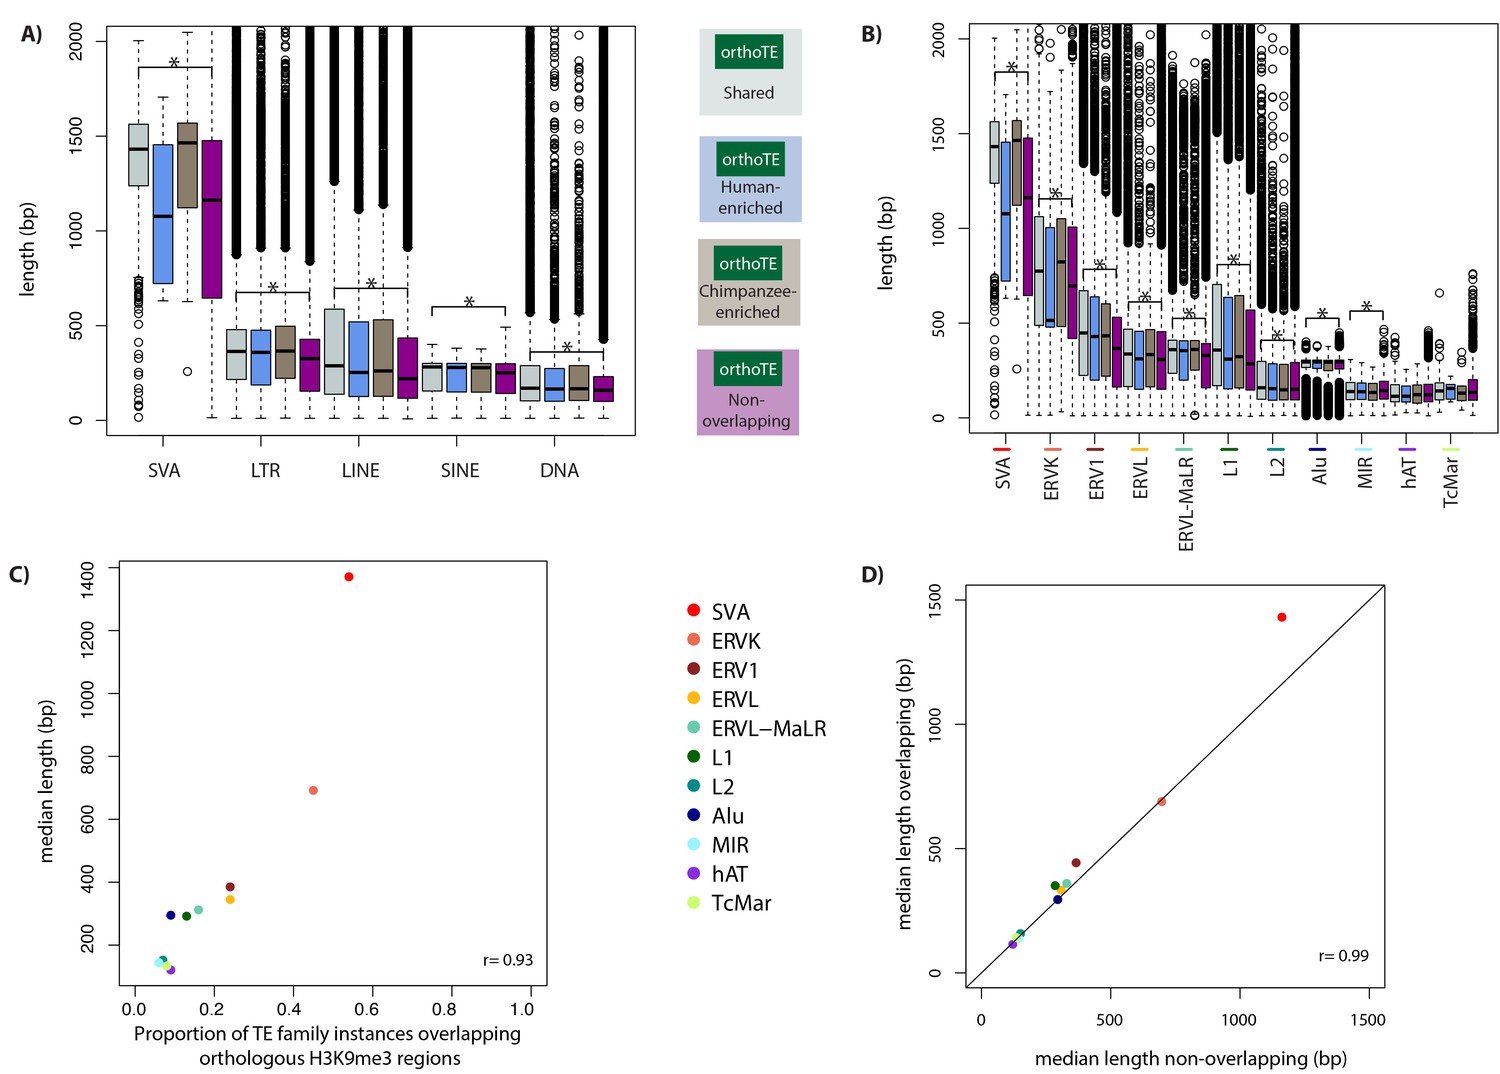
Longer TE families overlap with orthologous H3K9me3 regions more often than shorter families.
(A) The length of TEs in each of the TE classes stratified by H3K9me3 enrichment category. (B) The length of TEs in 11 major TE families ordered by the proportion of family members overlapping H3K9me3. (C) The proportion of TE family members that overlap an orthologous H3K9me3 region, and the median TE length in each TE family ordered by the proportion of TEs within a family overlapping H3K9me3 from highest to lowest. Pearson’s correlation coefficient is represented as r. (D) The median length of TEs not overlapping H3K9me3 regions and the median length of TEs that do overlap an H3K9me3 region. Asterisk denotes a significant difference between the Shared and Non-overlapping categories (Wilcoxon-rank sum test; *p<0.001).
Figure 5—figure supplement 2
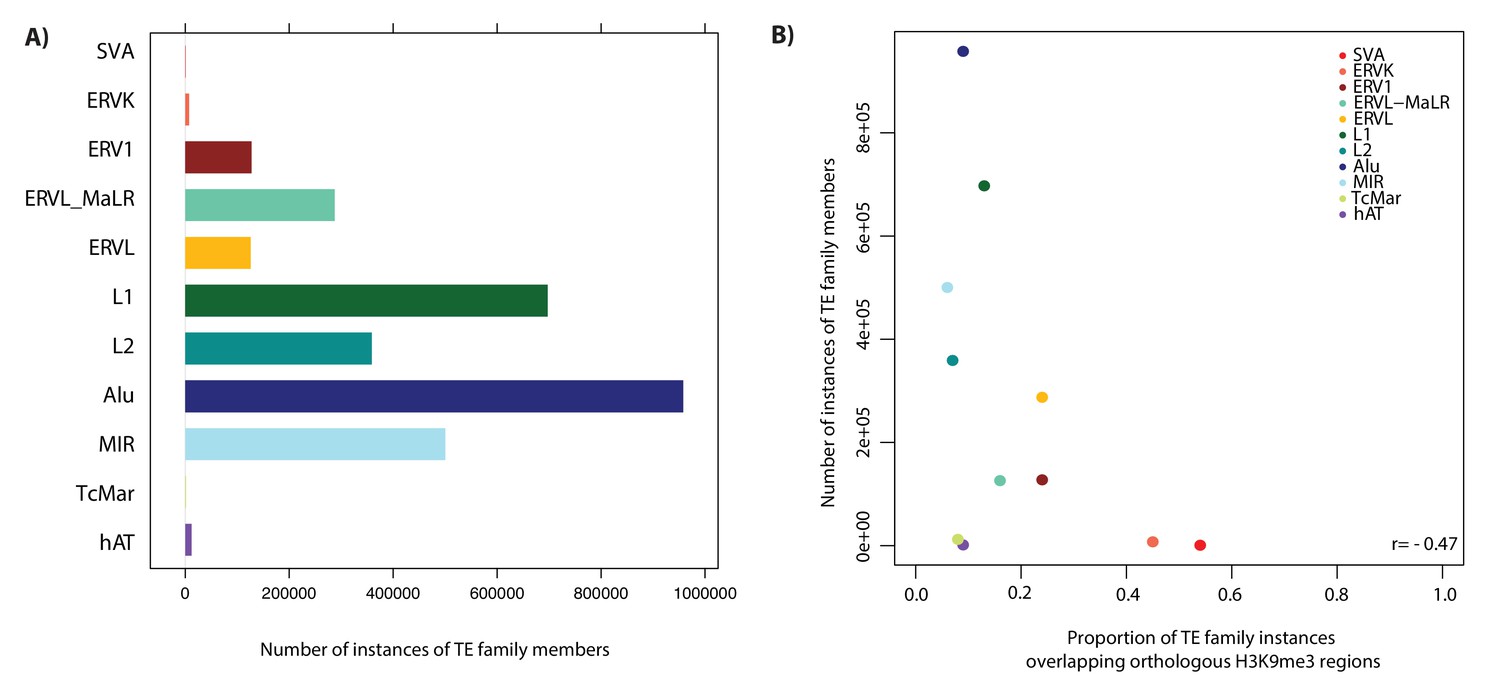
TE copy number is weakly anti-correlated with silencing by H3K9me3.
(A) The number of instances of all family members within a TE family. (B) The relationship between the proportion of TEs in each family that overlap an orthologous H3K9me3 region, and the number of instances of TE family members. Pearson’s correlation coefficient is represented as r.
Figure 5—figure supplement 3
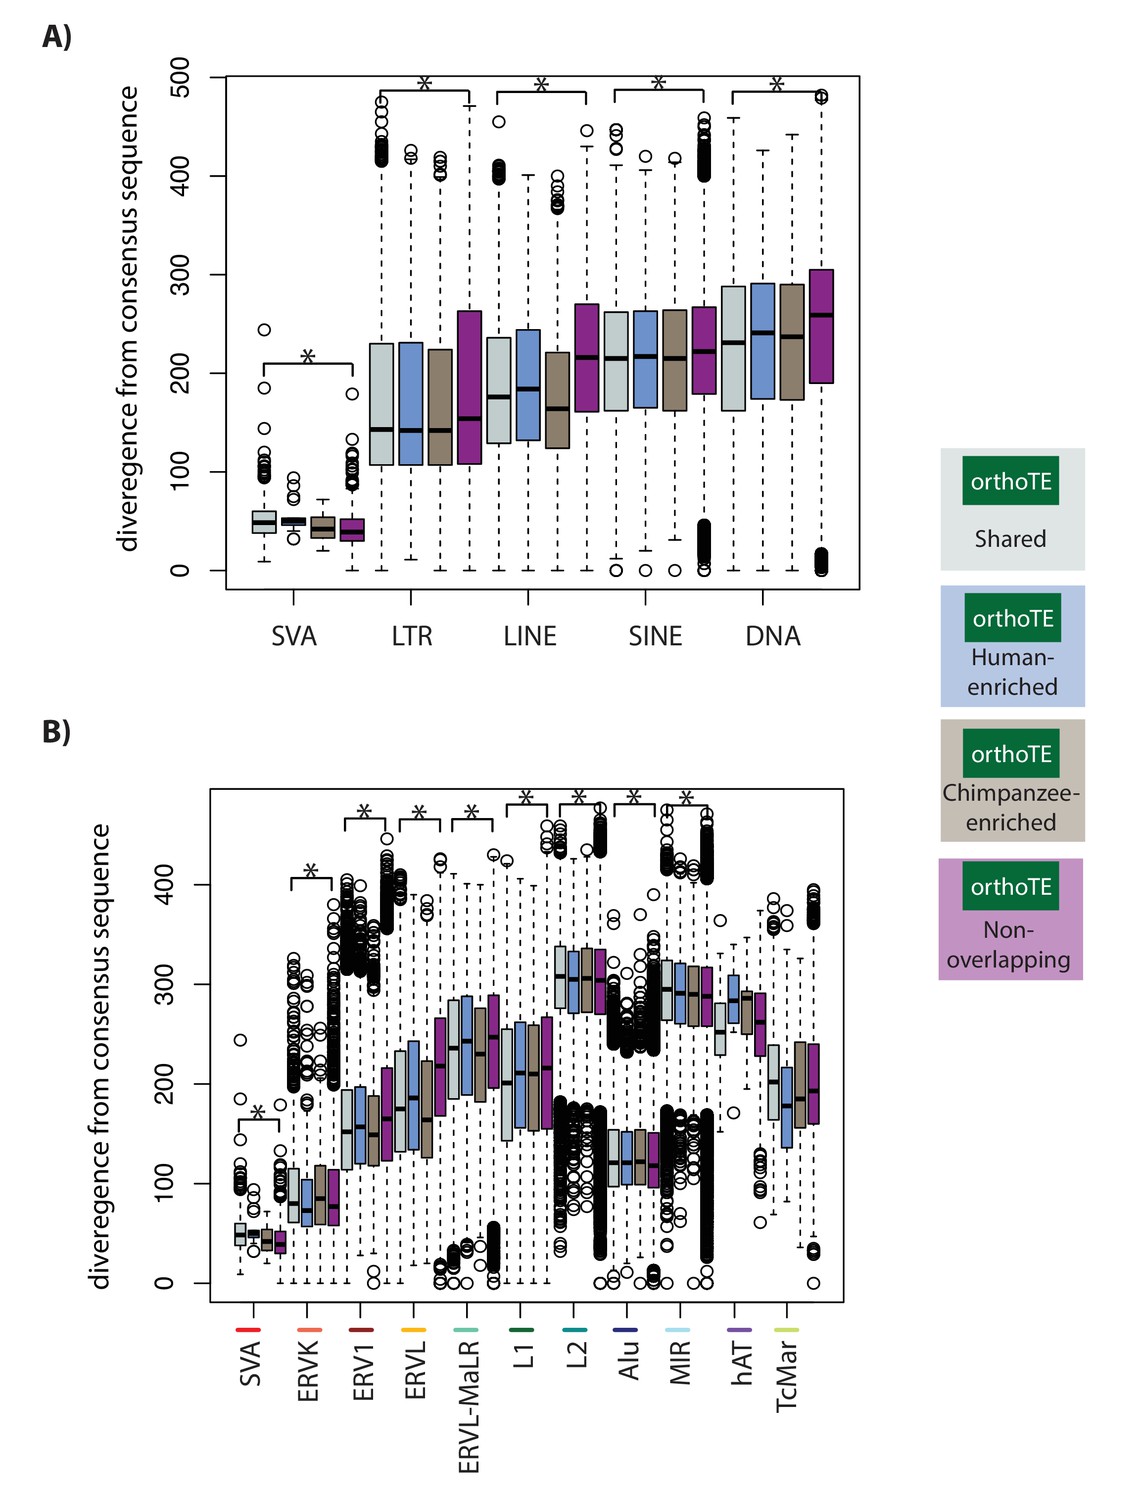
TEs, within a class, that are similarly enriched for H3K9me3 in both species tend to be less diverged from the consensus TE sequence than TEs that do not overlap H3K9me3 .
(A) The divergence from the consensus sequence of TEs in each of the TE classes. (B) The divergence from the consensus sequence of TEs in 11 major TE families. Families are ordered by the proportion of TE instances that overlap H3K9me3 regions (highest-to-lowest from left-to-right). Asterisk denotes a significant difference between the Shared and Non-overlapping categories (Wilcoxon-rank sum test; *p<0.001).
Figure 5—figure supplement 4
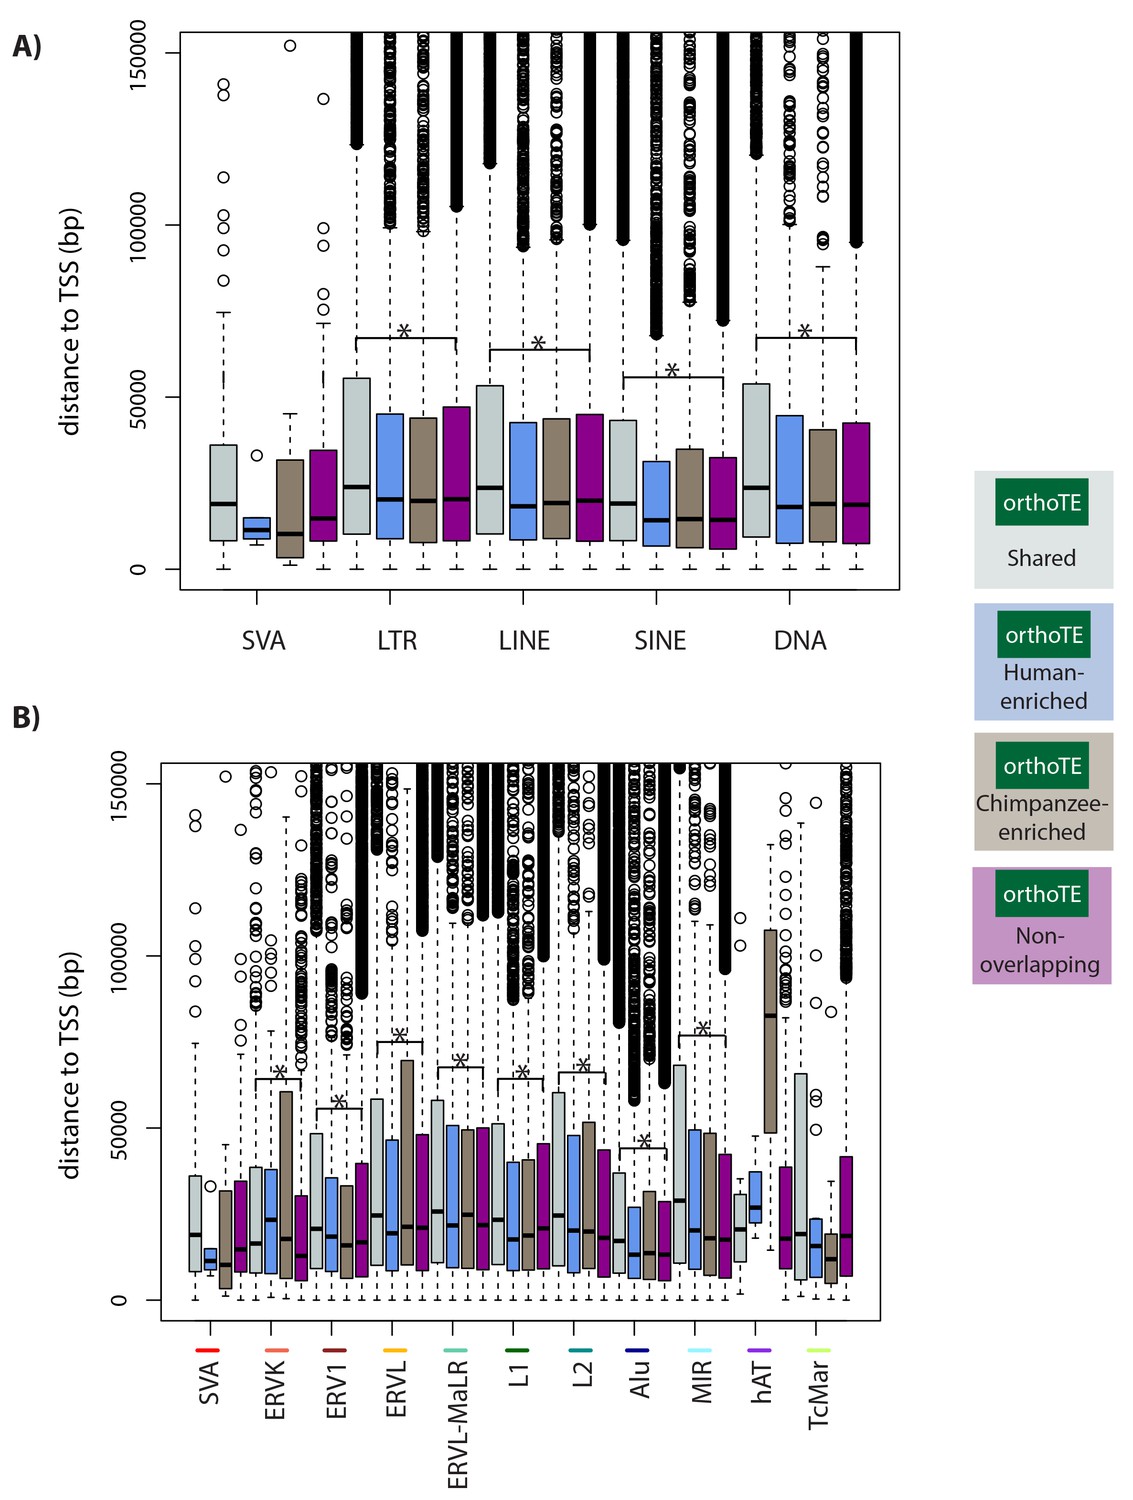
TEs, within a class, that are similarly enriched for H3K9me3 in both species tend to be further away from the nearest TSS than TEs that do not overlap H3K9me3 .
(A) The absolute distance between each TE in each of the TE classes and the nearest TSS. (B) The absolute distance between each TE in each of the TE families and the nearest TSS. Families are ordered by the proportion of TE instances that overlap H3K9me3 regions (highest-to-lowest from left-to-right). Asterisk denotes a significant difference between the Shared and Non-overlapping categories (Wilcoxon-rank sum test; *p<0.001).
Figure 5—figure supplement 5
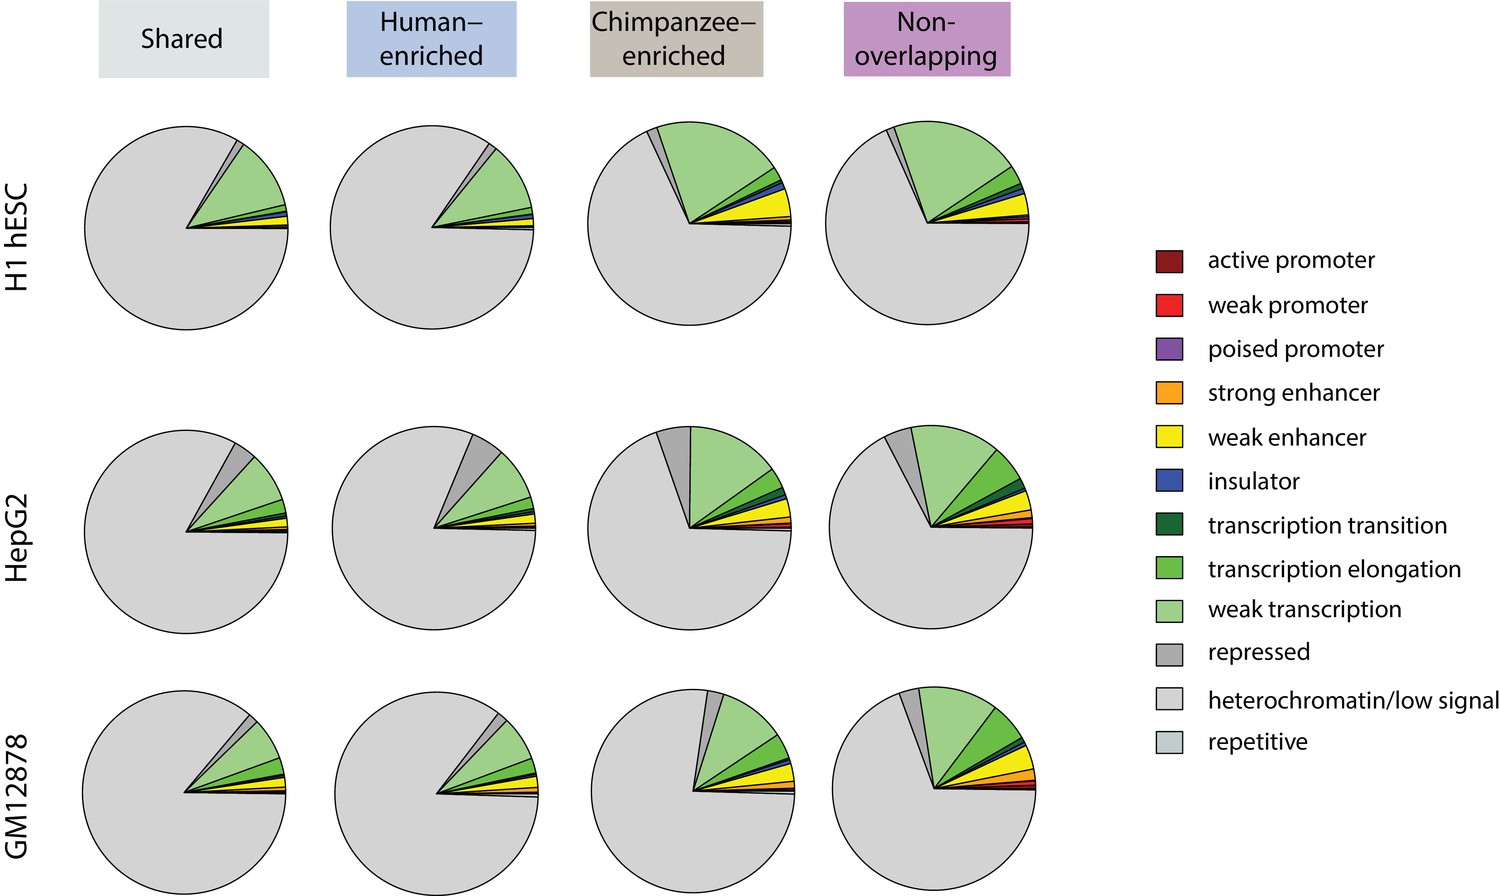
TEs preferentially silenced by H3K9me3 in human, are depleted for regions of active chromatin in human, relative to TEs preferentially silenced in chimpanzee.
Orthologous TEs categorized by H3K9me3 silencing category that overlap chromatin states as determined by the ChromHMM algorithm in the H1 hESC line, HepG2 liver cancer cell line, and GM12878 lymphoblastoid cell line.
Figure 5—figure supplement 6
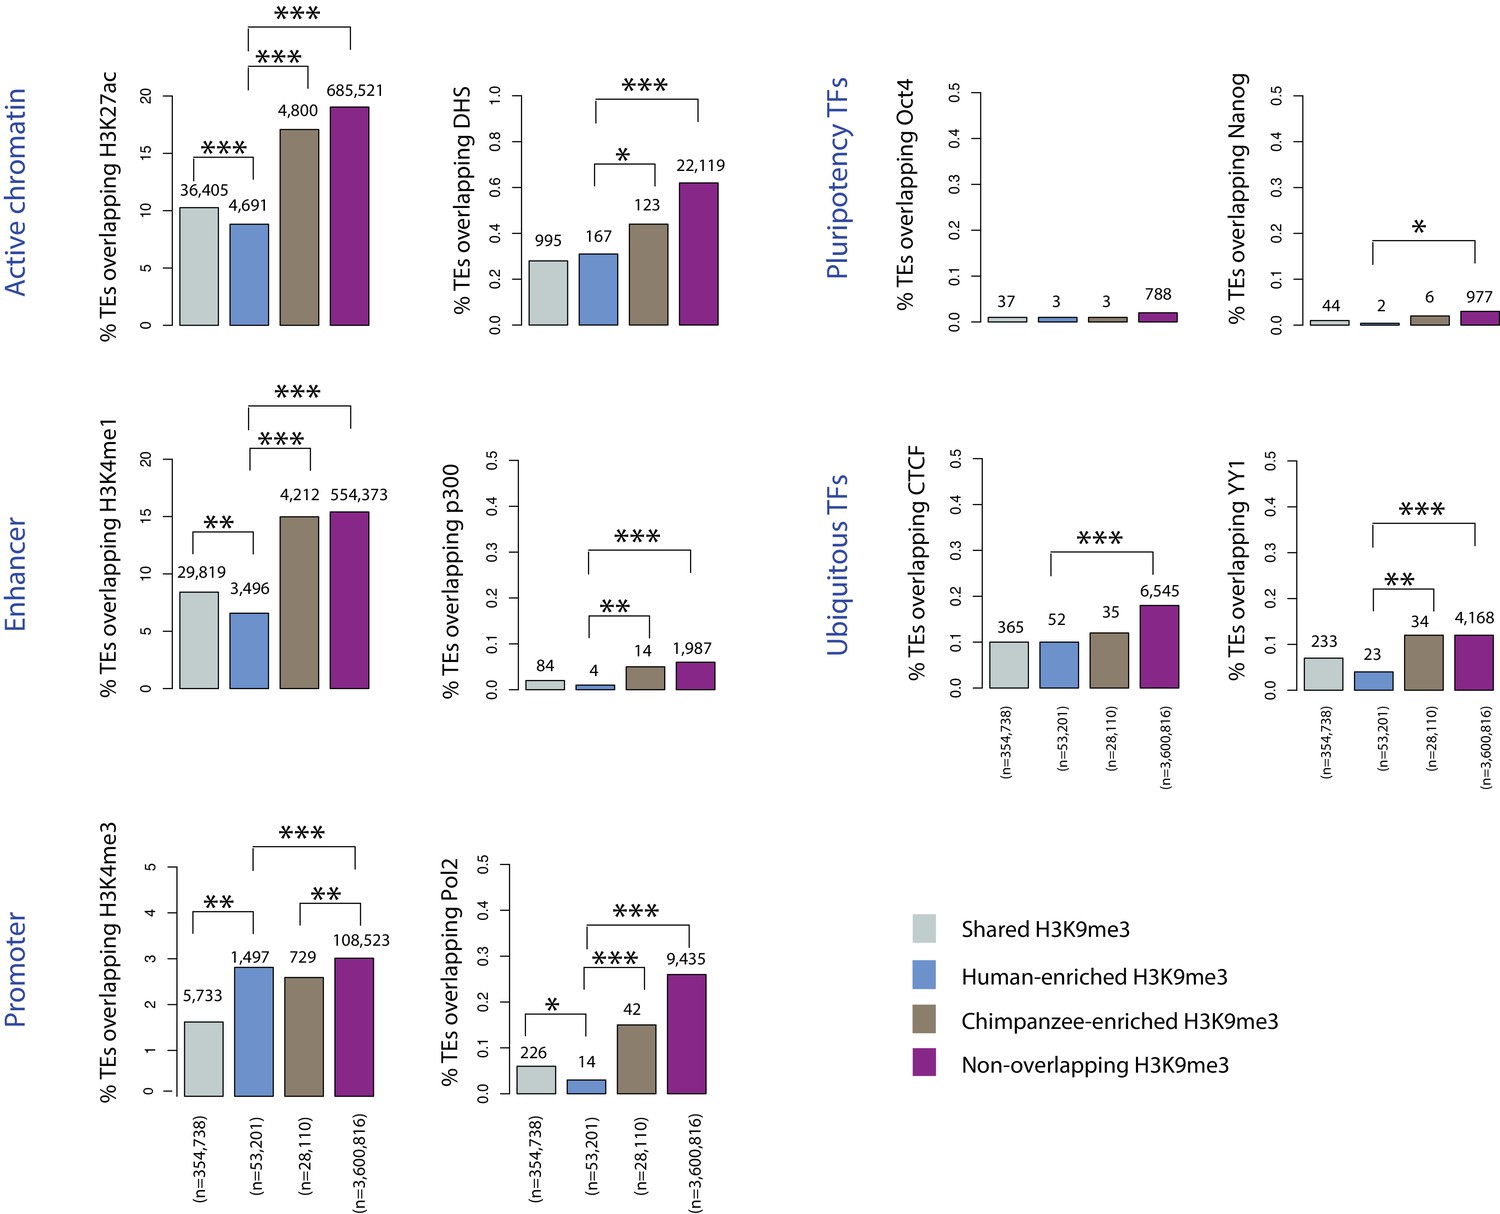
TEs preferentially silenced by H3K9me3 in human are depleted for regulatory regions in human relative to TEs preferentially silenced in chimpanzee.
The proportion of orthologous TEs within each of the four H3K9me3 silencing categories (Shared, Human-enriched, Chimpanzee-enriched and Non-overlapping) that overlap with human ChIP-seq and DNase I hypersensitivity data. Only a small subset of orthologous TEs overlap human regulatory regions, but plots are scaled so that differences between categories can be visualized. The number of instances in each category is indicated above each bar. Asterisk denotes a significant difference between categories (Pearson’s Chi-squared test; *p<0.01, **p<0.001, ***p<0.0001).
Figure 6 with 10 supplements
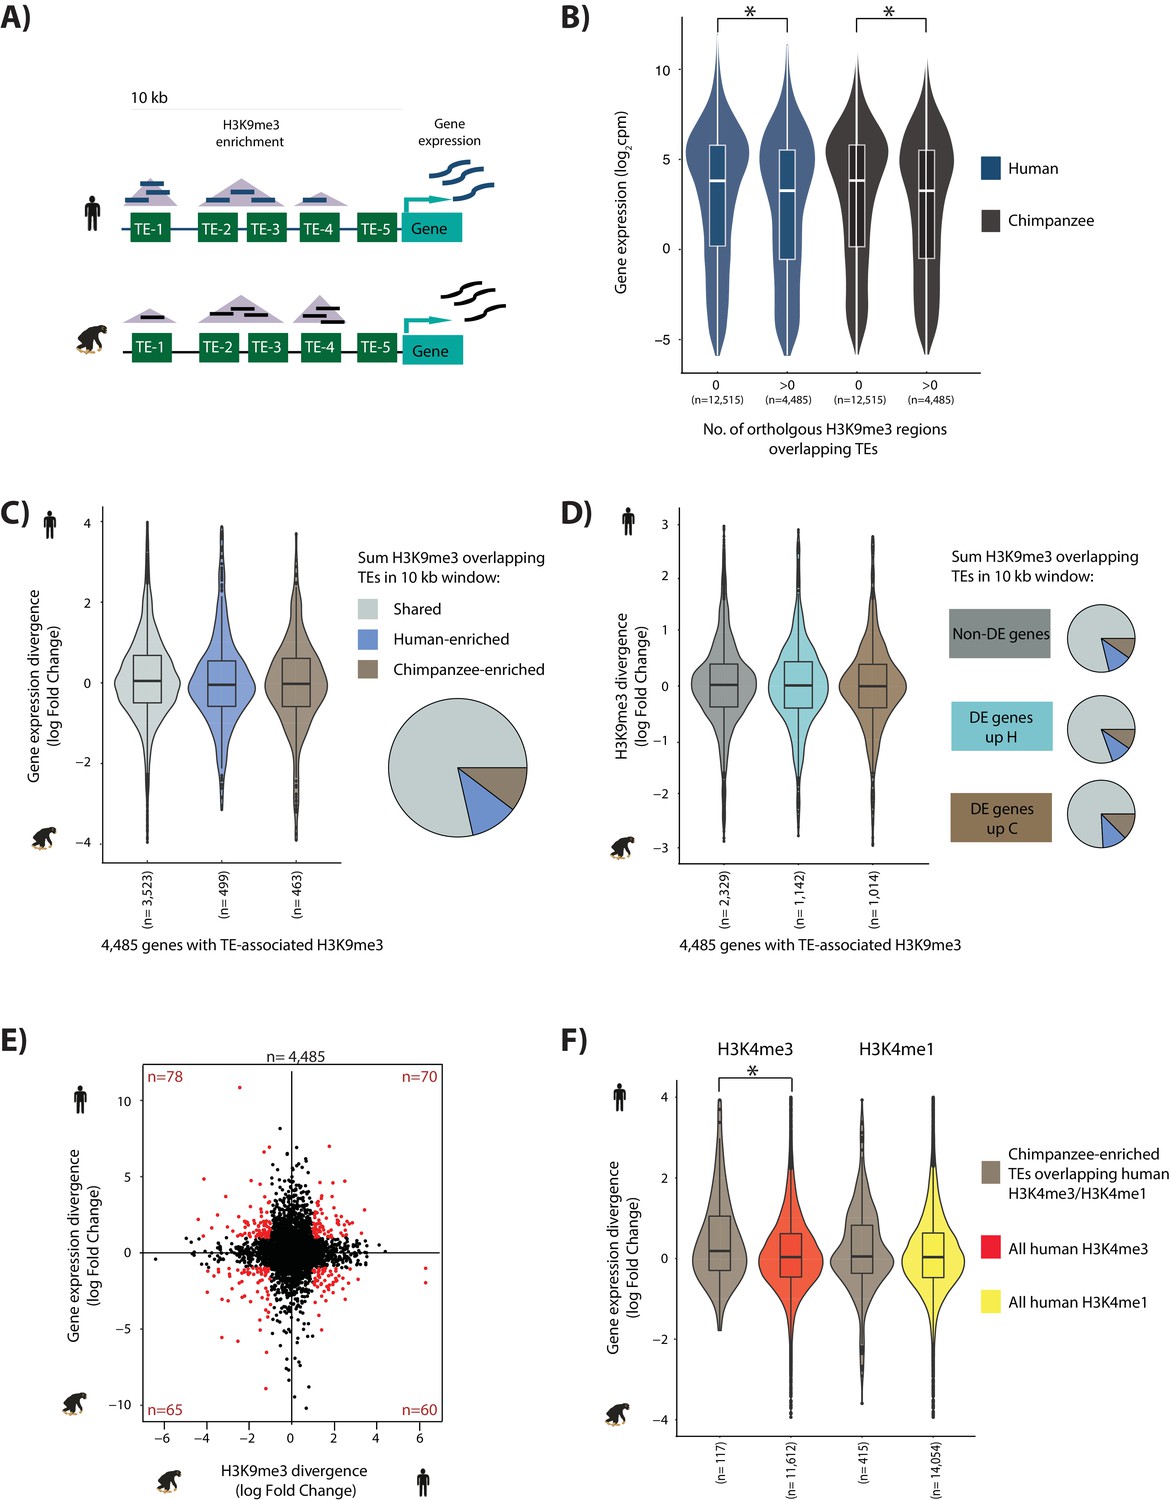
TE silencing divergence between species is not correlated with gene expression divergence.
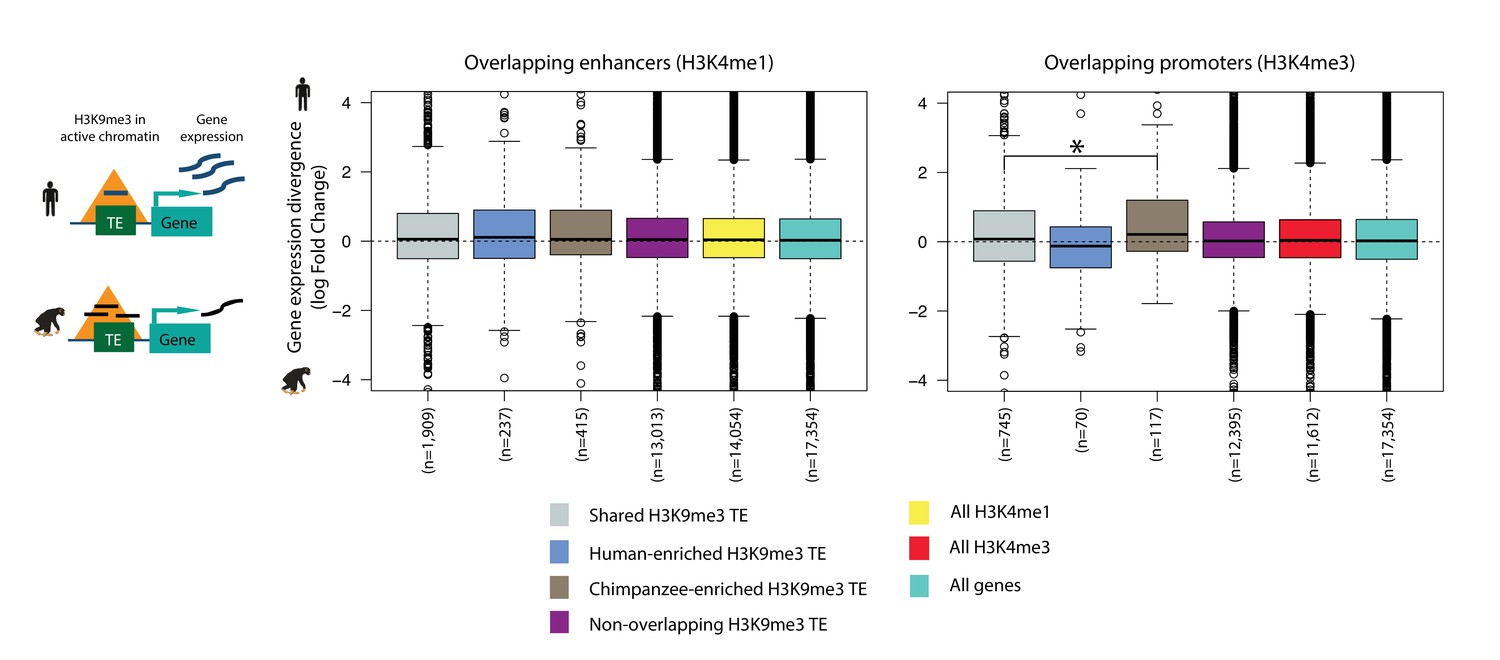
(A) Schematic representation of the experiment to determine how TE silencing affects nearby gene expression; orthologous TEs (green rectangles), orthologous H3K9me3 regions (purple triangles), human read counts (dark blue), and chimpanzee read counts (black). (B) Human and chimpanzee gene expression levels of orthologous genes with at least one TE present in a 10 kb window upstream of the TSS. Genes are categorized by the presence or absence of H3K9me3 regions overlapping TEs. (C) Gene expression divergence between human and chimpanzee at genes where TE silencing in the upstream 10 kb region is classified as Shared, Human-enriched or Chimpanzee-enriched. The proportion of genes associated with each TE silencing category is represented by the pie chart. (D) Stratification of genes based on differential expression status: genes that are similarly expressed in human and chimpanzee (dark grey), those that are up-regulated in human (turquoise), and those that are up-regulated in chimpanzee (dark brown) (FDR < 1%). The proportion of TEs marked by H3K9me3 in a 10 kb window upstream of the TSS in each gene category that are Shared, enriched in human, and enriched in chimpanzee are represented as pie charts. Box plots represent human-chimpanzee divergence of H3K9me3 enrichment overlapping TEs for each gene category. (E) Divergence in H3K9me3-mediated TE silencing between species versus neighboring gene expression divergence. Genes which have a H3K9me3 log fold divergence of >1 or <-1, and a gene expression divergence log fold change of >1 or <-1 are shown in red. (F) Inter-species gene expression divergence of orthologous genes closest to TEs overlapping H3K9me3 regions enriched in chimpanzee, and overlapping human H3K4me3/H3K4me1 regions identified in H1 hESCs. The closest orthologous genes to all human H3K4me3/H3K4me1 regions in H1 cells are used for comparison. Asterisk denotes a significant difference between categories (Wilcoxon-rank sum test; p<0.01). Also see Figure 6—figure supplements 1–10.
Figure 6—figure supplement 1
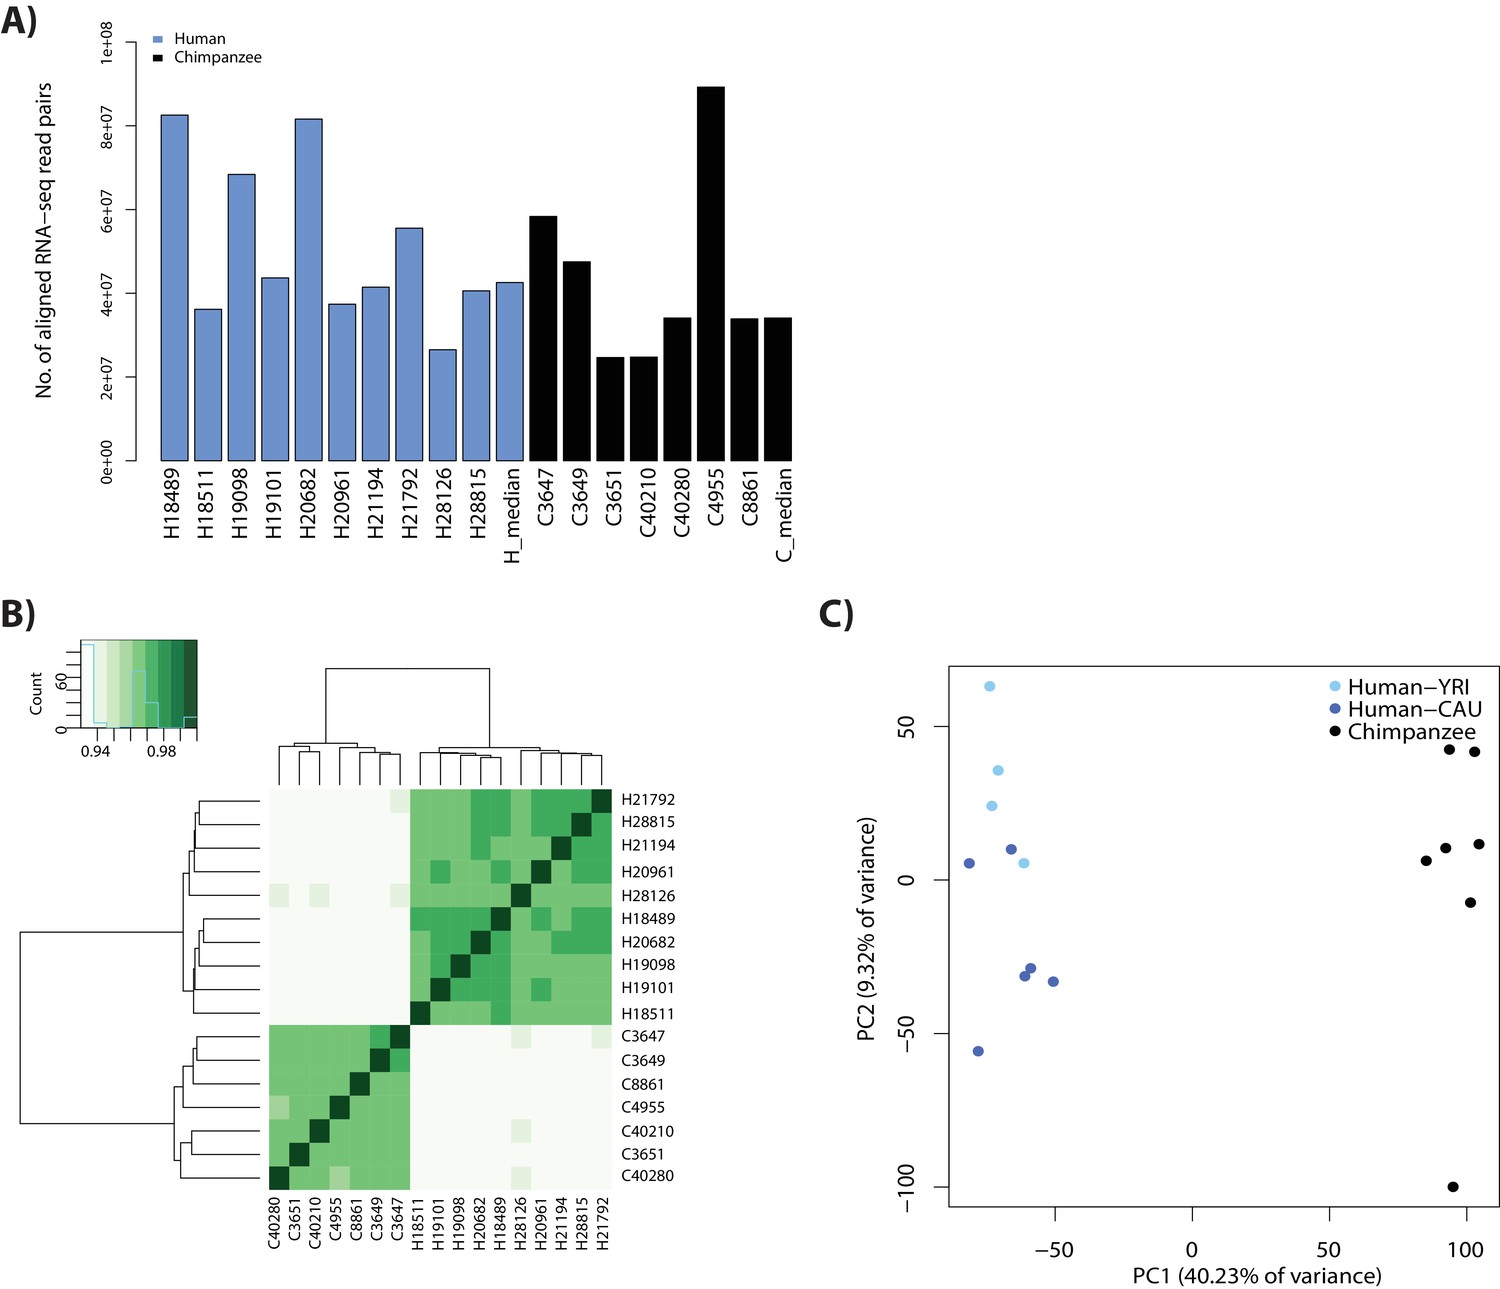
RNA-seq data clusters by species.
(A) The number of aligned RNA-seq read-pairs for each individual in each species. (B) Spearman correlation of read counts between individuals at orthologous autosomal genes. (C) PCA analysis of log2cpm values at 17,354 genes with > 0 counts in > 10 individuals for humans from a Yoruba population (YRI: light blue), humans from a Caucasian population (CAU: dark blue), and chimpanzees (black).
Figure 6—figure supplement 2
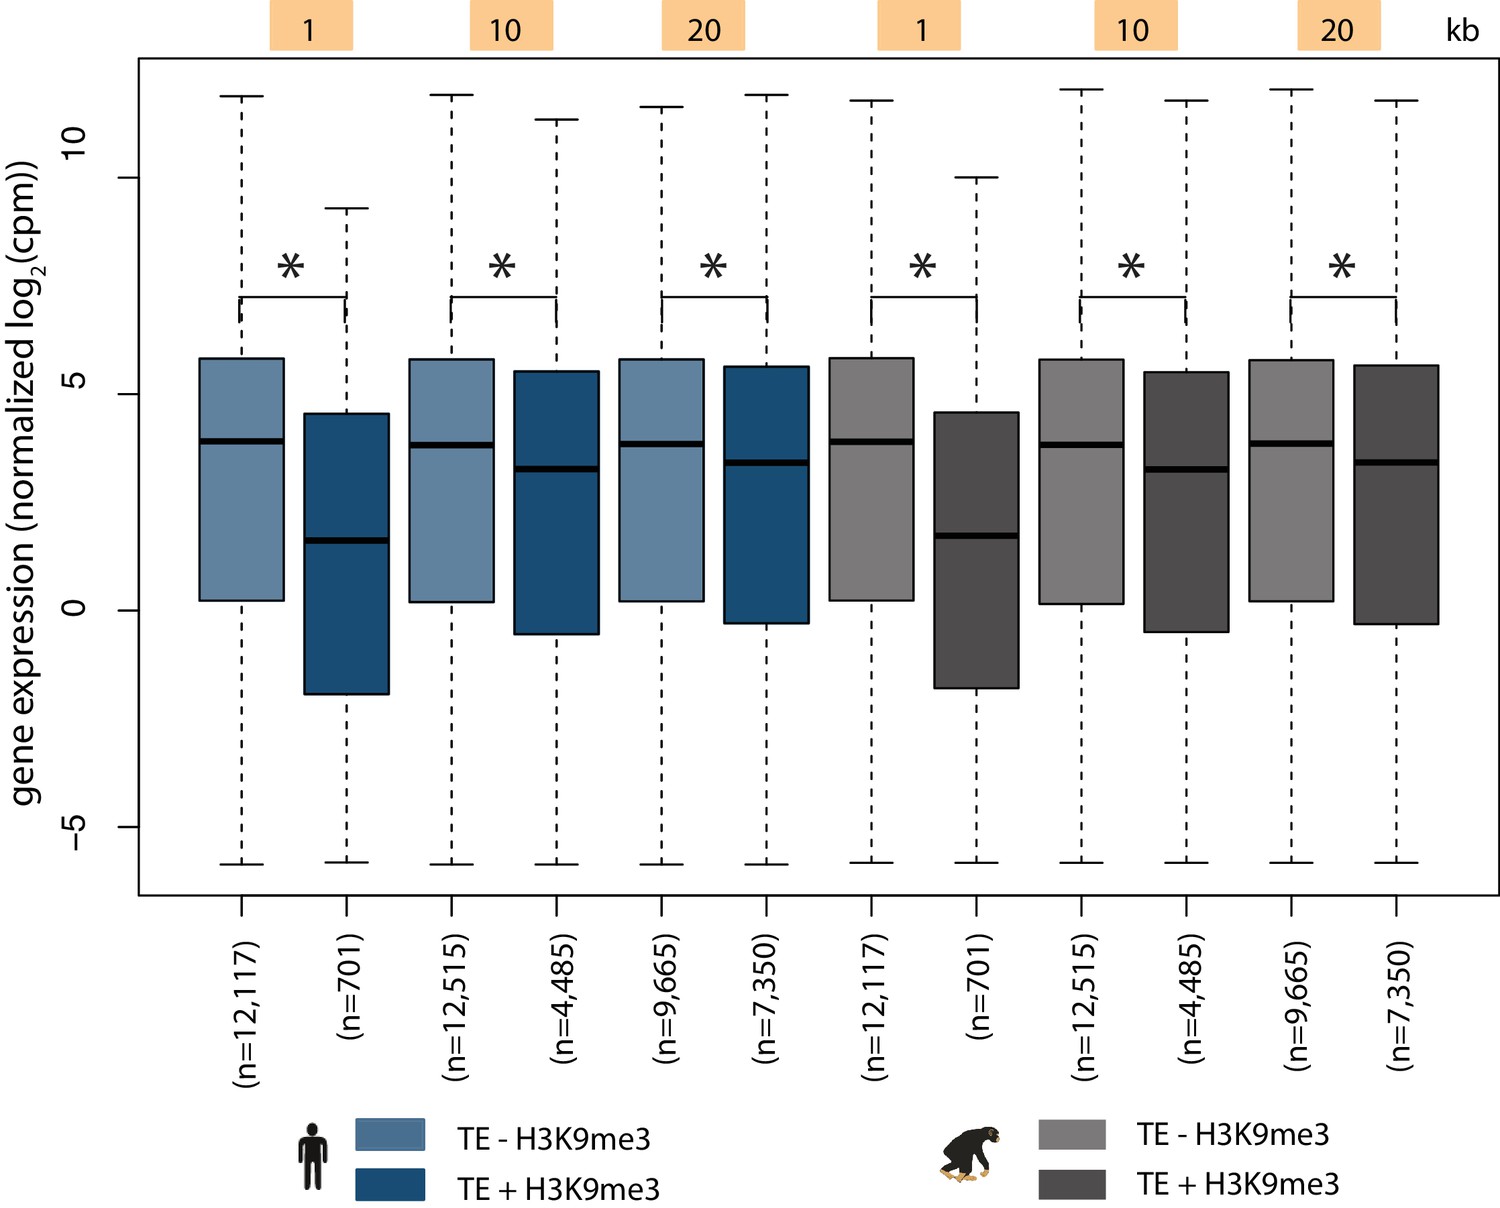
TEs overlapping H3K9me3 regions upstream of genes associate with decreased gene expression.
Quantile-normalized gene expression levels for genes with TEs within 1, 10 and 20 kb windows upstream of the TSS that do not overlap (TE - H3K9me3) or overlap (TE + H3K9me3) with at least one H3K9me3 region. Data is shown for human (blue) and chimpanzee (black). Asterisk denotes a significant difference between categories (Wilcoxon-rank sum test; p<0.001).
Figure 6—figure supplement 3
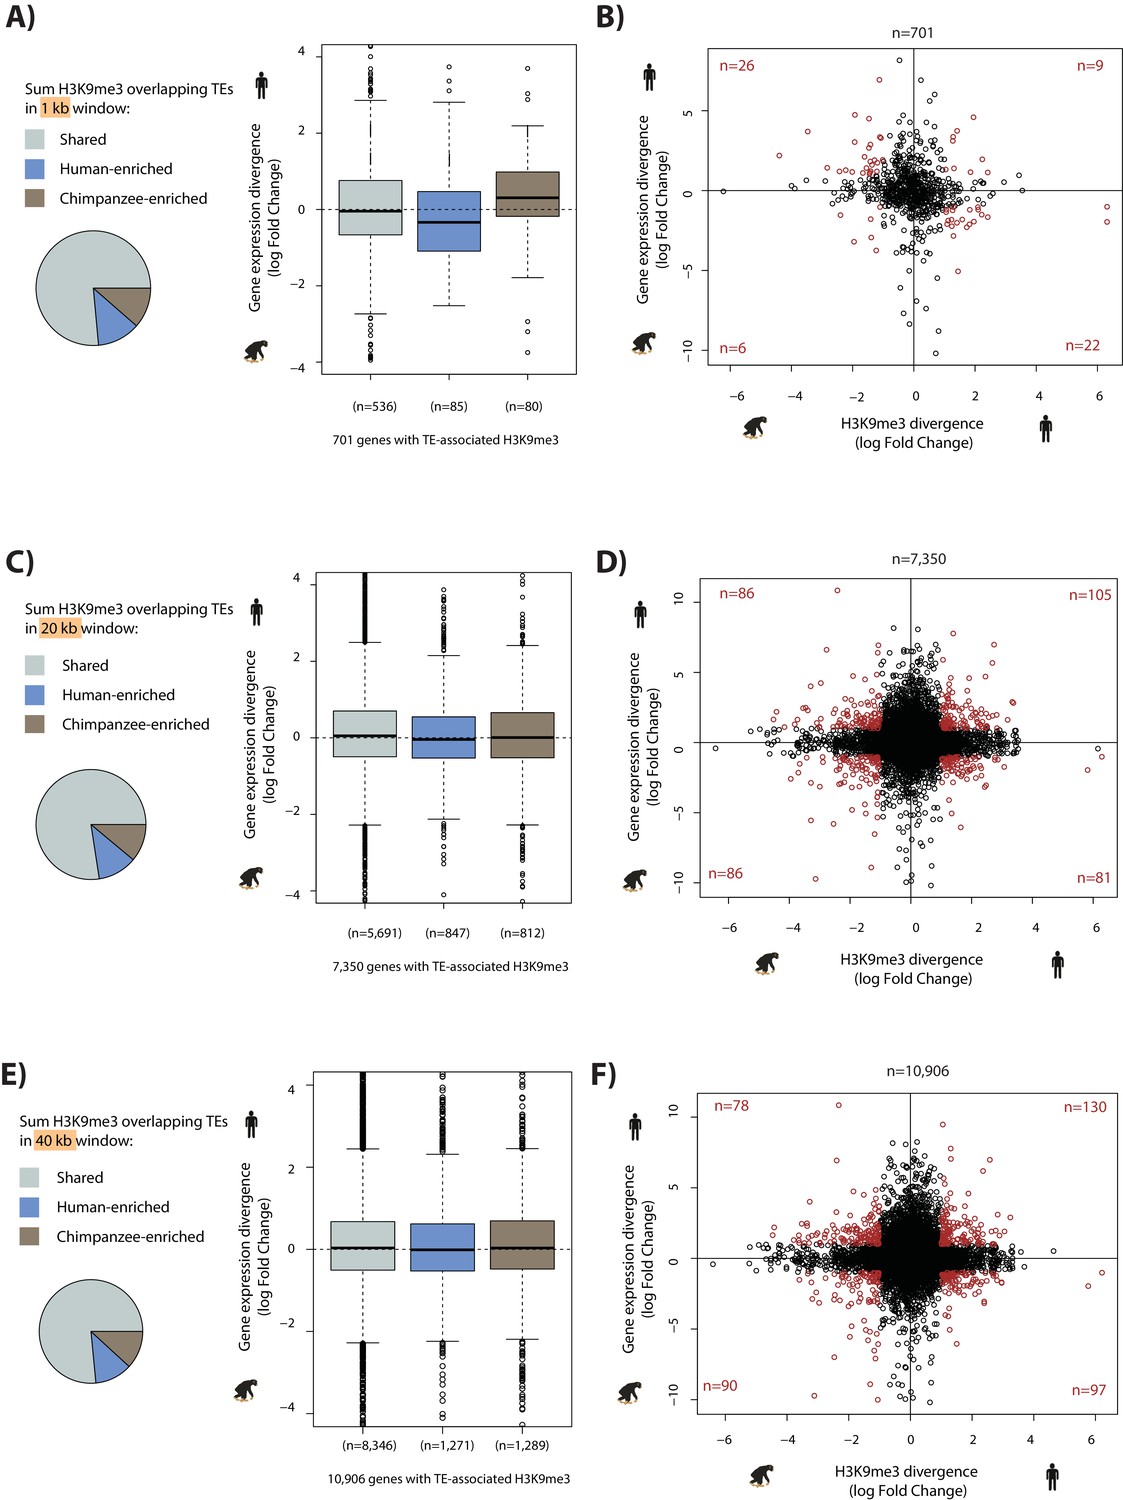
TEs preferentially enriched for H3K9me3 in one species only have a minimal effect on gene expression divergence at the TSS.
(A) Gene expression divergence between human and chimpanzee for genes with TEs overlapping H3K9me3 within 1 kb upstream of the TSS. Genes are categorized by H3K9me3 enrichment at FDR < 0.01. (B) Interspecies divergence in H3K9me3-mediated silencing of TEs in a 1 kb window upstream of the TSS versus gene expression divergence. Genes which have a H3K9me3 log fold divergence of >1 or <-1, and a gene expression divergence log fold change of >1 or <-1 are shown in red. (C) As in (A) except using a 20 kb window. (D) As in (B) except using a 20 kb window. (E) As in (A) except using a 40 kb window. (F) As in (B) except using a 40 kb window. There are no significant differences between categories.
Figure 6—figure supplement 4
H3K9me3 preferentially enriched in one species at the TSS associates with gene expression divergence.
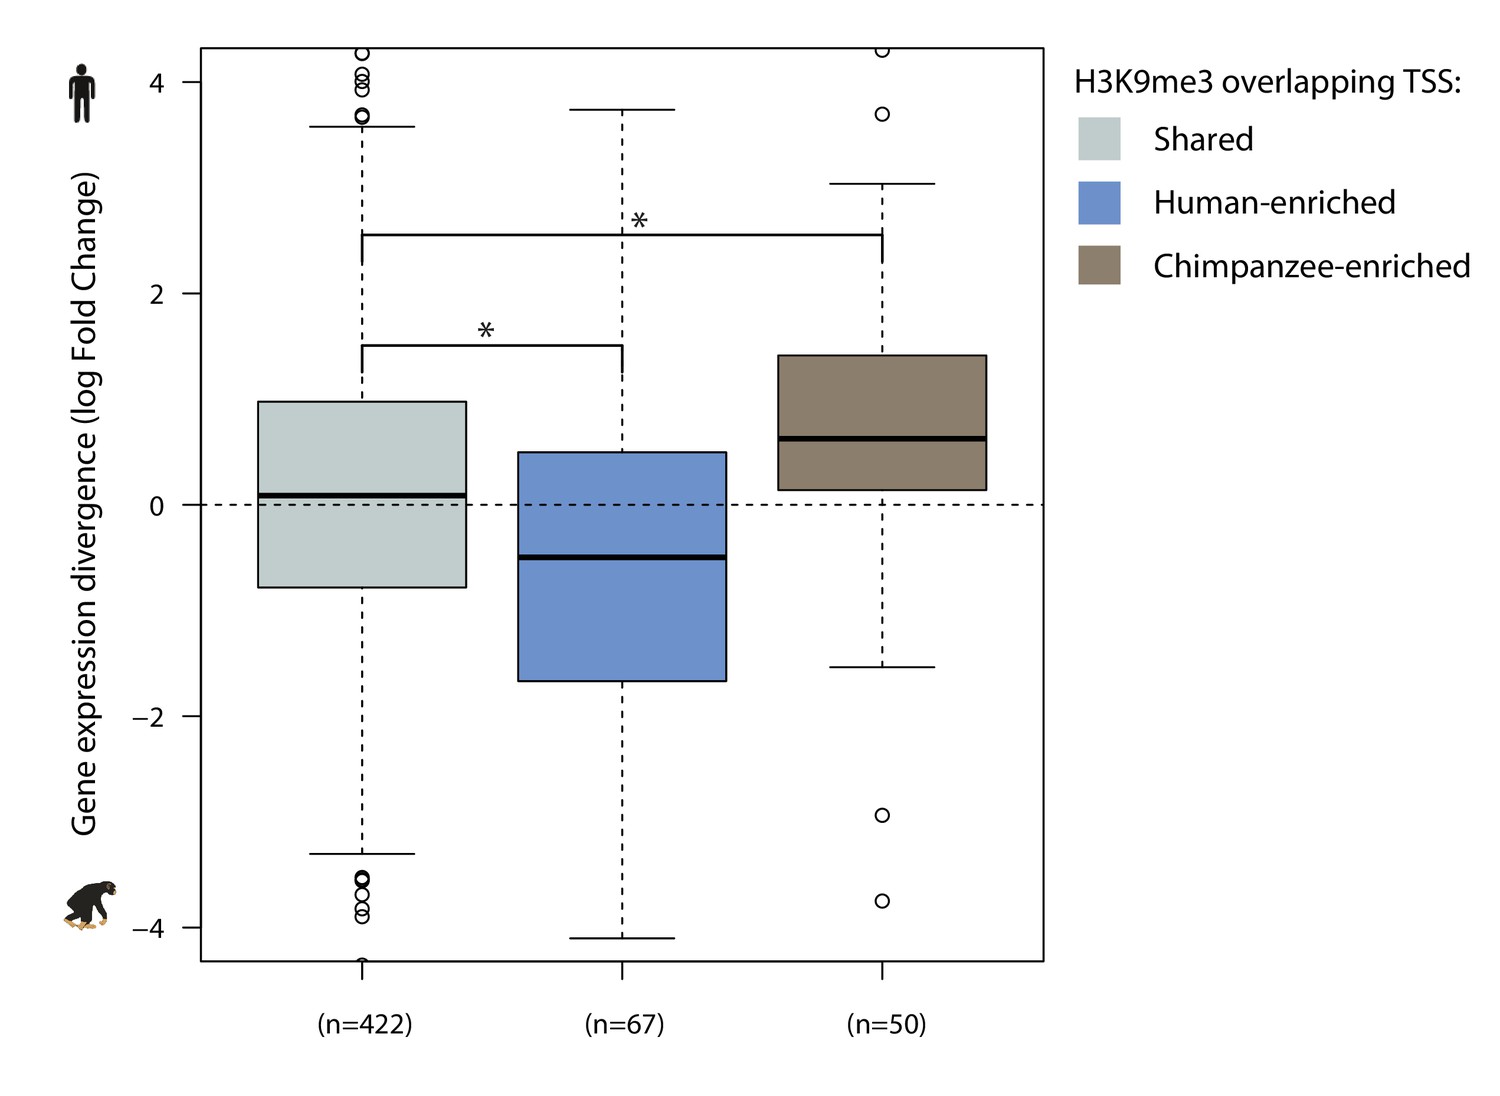
Gene expression divergence between human and chimpanzee at genes with H3K9me3 regions overlapping the TSS irrespective of the presence of a TE. Genes are categorized by the proportion of orthologous H3K9me3 regions that are enriched in each species (Shared, Human-enriched, Chimpanzee-enriched). Asterisk denotes a significant difference between categories (Wilcoxon-rank sum test; p<0.01).
Figure 6—figure supplement 5
Genes that are differentially expressed between human and chimpanzee are not associated with inter-species differences in H3K9me3 enrichment at TEs distal to the TSS.
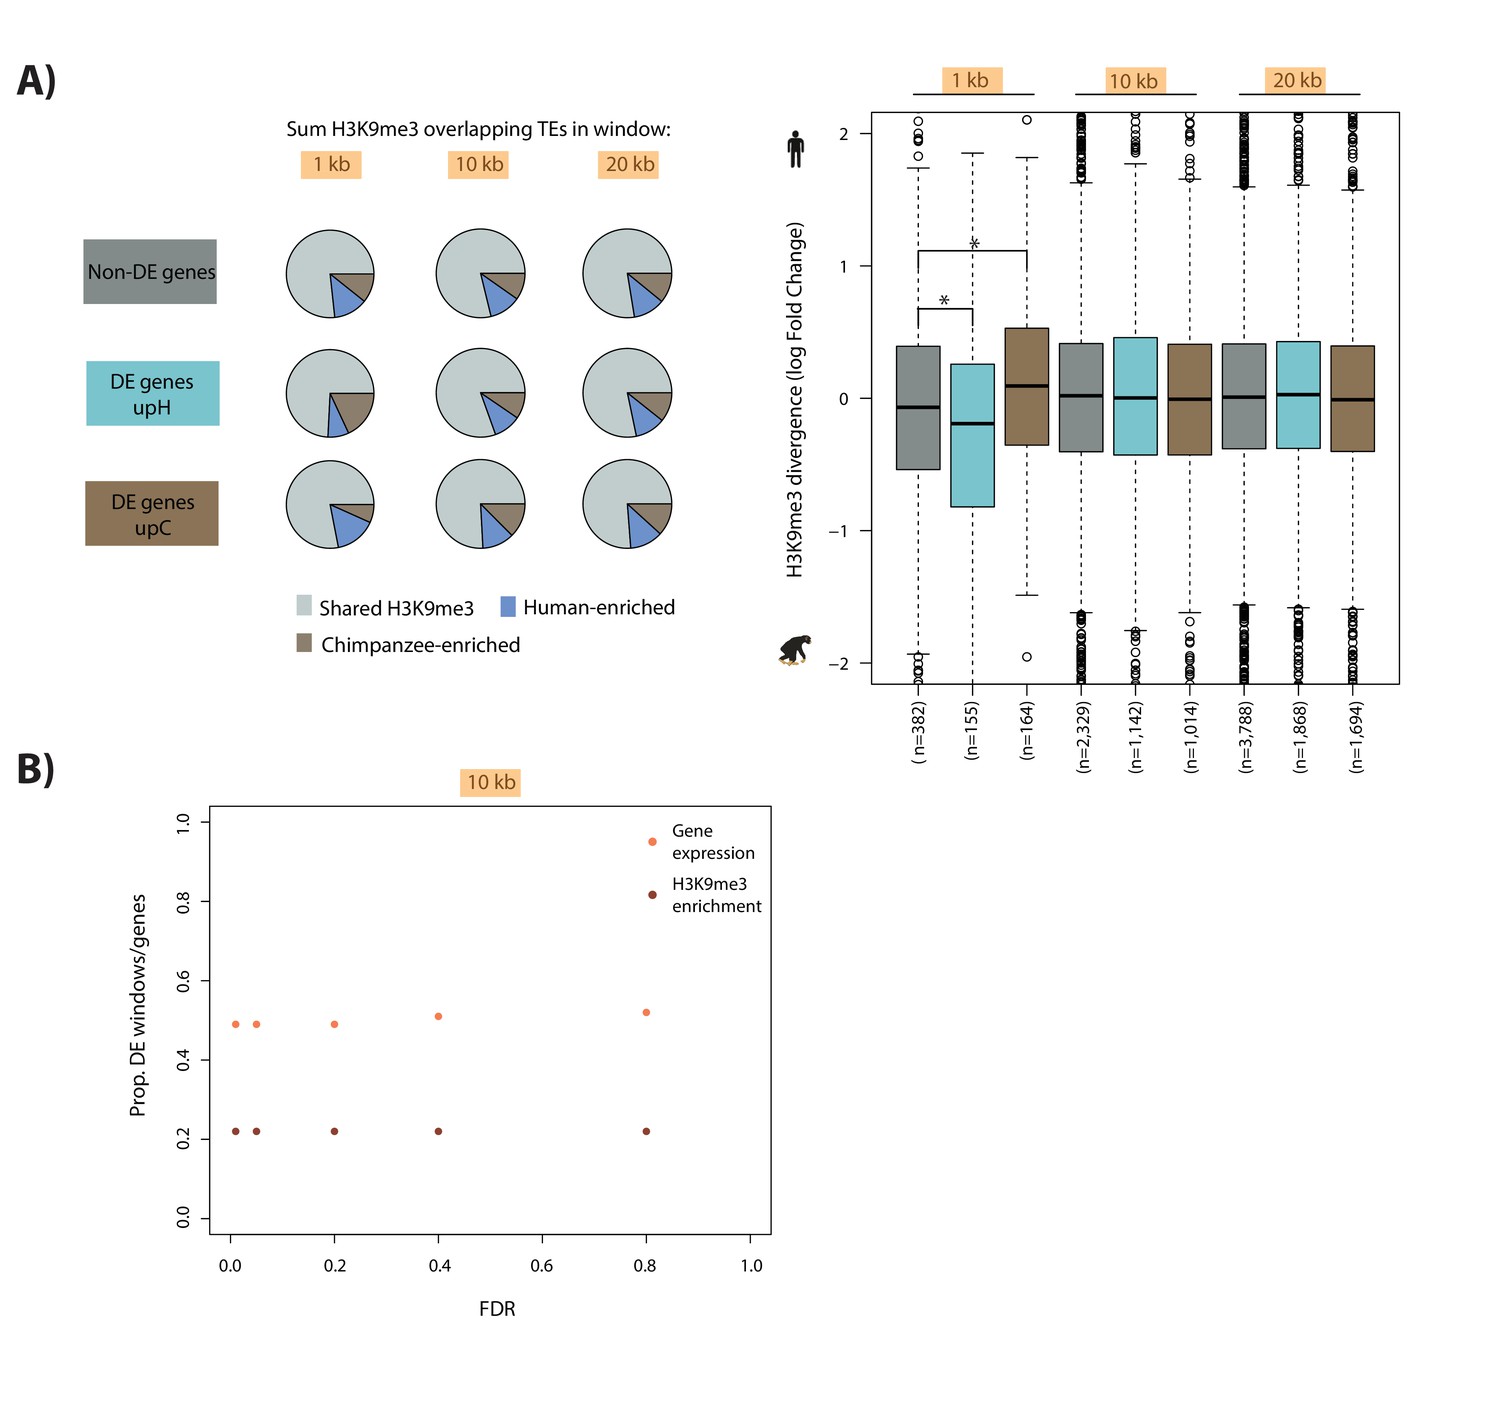
(A) Genes are stratified into three classes: those that are similarly expressed between humans and chimpanzees (dark grey), those that are up-regulated in human at FDR < 1% (turquoise), and those that are up-regulated in chimpanzee at FDR < 1% (dark brown). The proportion of TEs marked by H3K9me3 in 1, 10, 20 kb windows upstream of the TSS that are shared, enriched in human and enriched in chimpanzee are represented as pie charts. Box plots represent human-chimpanzee divergence of H3K9me3 enrichment overlapping TEs for each gene category in each window. (B) Proportion of genes that are differentially expressed between species when varying the FDR threshold to identify differentially enriched H3K9me3 windows 10 kb upstream of genes (orange). Proportion of H3K9me3 windows 10 kb upstream of genes that are differentially enriched between species when varying the threshold to identify differentially expressed genes (red). Asterisk denotes a significant difference between categories (Wilcoxon-rank sum test; p<0.01).
Figure 6—figure supplement 6
TEs in human enhancer regions do not associate with inter-species gene expression divergence.
Inter-species gene expression divergence of orthologous genes closest to TEs overlapping H3K9me3 regions, and overlapping human H3K4me1/H3K4me3 regions identified in H1 hESCs. The closest orthologous genes to all human H3K4me1/H3K4me3 regions in H1 cells are used for comparison. Asterisk denotes a significant difference between categories (Wilcoxon rank-sum test; p<0.01).
Figure 6—figure supplement 7

Non-orthologous TE silencing distal to the TSS does not consistently influence gene expression divergence between species.
(A) Schematic representation of the non-orthologous (n.o) TE analysis. (B) Gene expression divergence for orthologous genes with at least one non-orthologous TE in 1, 10, 20 kb windows upstream of the TSS. Genes are categorized as non-silent (at least one TE does not overlap H3K9me3) or silent (all TEs overlap H3K9me3). Asterisk denotes a significant difference between categories (Wilcoxon-rank sum test; p<0.01).
Figure 6—figure supplement 8
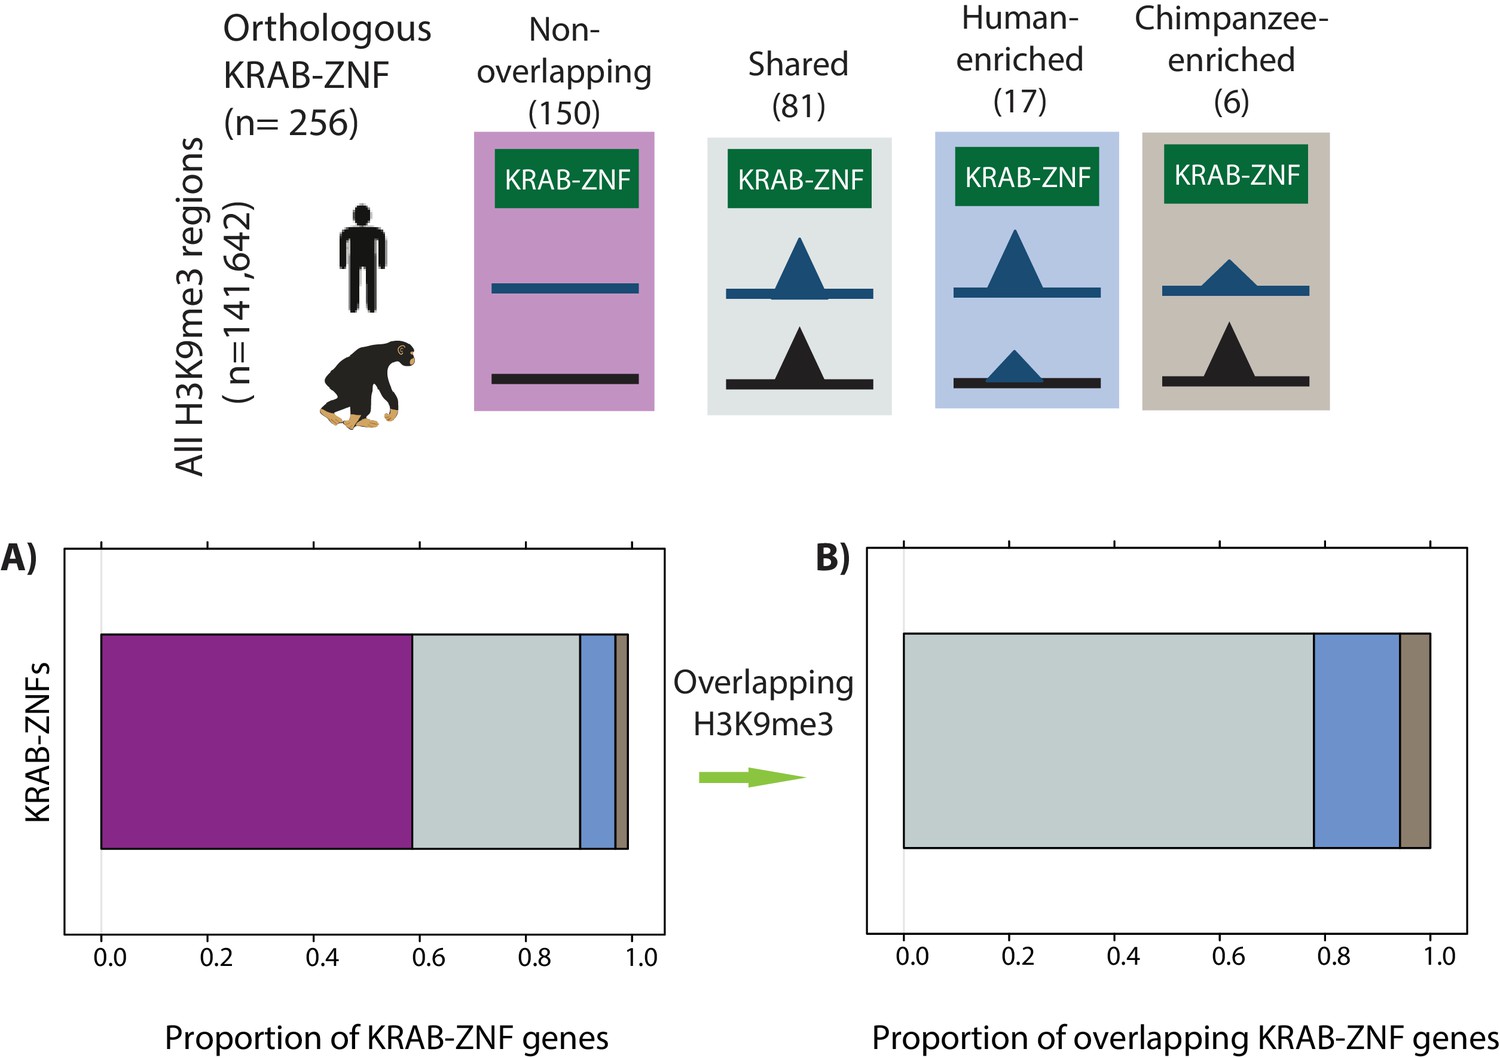
Orthologous KRAB-ZNF genes overlap with orthologous H3K9me3 regions.
The proportion of orthologous KRAB-ZNF genes curated by Kapopoulou et al. that do not overlap an orthologous H3K9me3 region (magenta), overlap an orthologous region and show similar H3K9me3 enrichment in both species (grey: Shared), are enriched in human (blue: Human-enriched), or are enriched in chimpanzee (brown: Chimpanzee-enriched) are shown. (B) The proportion of KRAB-ZNF genes that overlap an orthologous H3K9me3 region and is either Shared, Human-enriched or Chimpanzee-enriched.
Figure 6—figure supplement 9

KRAB-ZNF genes are no more likely to be differentially expressed between species than all genes.
(Ai) The expression of 256 orthologous KRAB-ZNF genes curated by Kapopoulou et al. Genes that are identified as being significantly differentially expressed at an FDR < 1% are represented in red (131/256 genes = 51%). (Aii) The expression of all orthologous genes (8,420/17,354 genes differentially expressed = 49%). (B) KRAB-ZNF gene expression divergence stratified by H3K9me3 enrichment at the TSS. Genes with higher expression in chimpanzee and significantly lower H3K9me3 in chimpanzee compared to human (blue box): ZNF582, ZNF471, ZNF585A, ZNF667, ZNF583. Genes with higher expression in human and significantly lower H3K9me3 in human compared to chimpanzee (brown box): ZFP82, ZNF662, ZNF429, ZNF100, ZNF43.
Figure 6—figure supplement 10
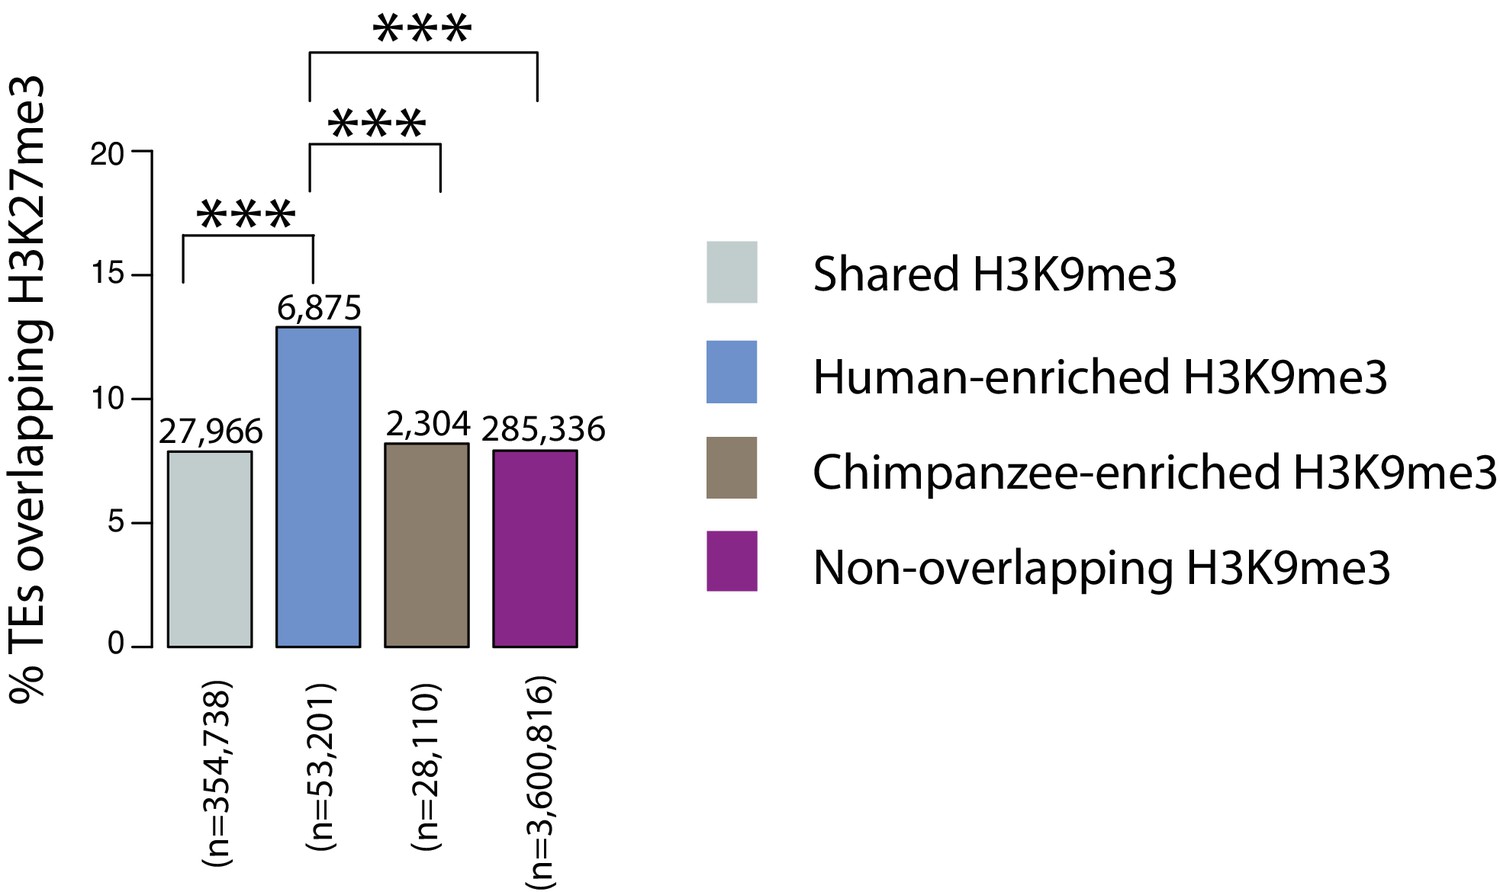
TEs preferentially silenced by H3K9me3 in chimpanzee are not more often associated with increased levels of H3K27me3 compared to TEs preferentially silenced by H3K9me3 in human.
The proportion of orthologous TEs within each of the four H3K9me3 silencing categories (Shared, Human-enriched, Chimpanzee-enriched and Non-overlapping) that overlap with human H3K27me3 ChIP-seq regions in H1 hESCs. The number of instances in each category is indicated above each bar. Asterisk denotes a significant difference between categories (Pearson’s Chi-squared test; ***p<0.0001).
Tables
Key resources table
| Reagent type (species) or resource | Designation | Source or reference | Identifiers | Additional information |
|---|---|---|---|---|
| Cell line (H. sapiens, Female) | H20682 iPSC | This paper | Age 23, Caucasian, fibroblast origin | |
| Cell line (H. sapiens, Male) | H20961 iPSC | 10.1371/journal.pgen.1005793 | ||
| Cell line (H. sapiens, Female) | H21194 iPSC | 10.1371/journal.pgen.1005793 | ||
| Cell line (H. sapiens, Female) | H21792 iPSC | This paper | Age 20, Caucasian, fibroblast origin | |
| Cell line (H. sapiens, Male) | H28126 iPSC | 10.1371/journal.pgen.1005793 | ||
| Cell line (H. sapiens, Male) | H28815 iPSC | This paper | Age 19, Caucasian, fibroblast origin | |
| Cell line (H. sapiens, Female) | H18489 iPSC | 10.1101/gr.224436.117 | ||
| Cell line (H. sapiens, Female) | H18511 iPSC | 10.1101/gr.224436.117 | ||
| Cell line (H. sapiens, Male) | H19098 iPSC | 10.1101/gr.224436.117 | ||
| Cell line (H. sapiens, Male) | H19101 iPSC | 10.1101/gr.224436.117 | ||
| Cell line (P. troglodytes, Female) | C3647 iPSC | 10.7554/eLife.07103 | ||
| Cell line (P. troglodytes, Male) | C3649 iPSC | 10.7554/eLife.07103 | ||
| Cell line (P. troglodytes, Female) | C3651 iPSC | 10.7554/eLife.07103 | ||
| Cell line (P. troglodytes, Female) | C40210 iPSC | 10.7554/eLife.07103 | ||
| Cell line (P. troglodytes, Female) | C40280 iPSC | 10.7554/eLife.07103 | ||
| Cell line (P. troglodytes, Male) | C4955 iPSC | 10.7554/eLife.07103 | ||
| Cell line (P. troglodytes, Male) | C8861 iPSC | 10.7554/eLife.07103 | ||
| Antibody | anti-Histone H3K9me3 (rabbit polyclonal) | Abcam | abcam:8898 | 5 ug |
Additional files
-
Supplementary file 1
Supplemental Tables 1-11.
- https://doi.org/10.7554/eLife.33084.043
-
Supplementary file 2
Table with 141,642 orthologous H3K9me3 regions, their ChIP-seq read counts, DESeq2 results (baseMean, log2FC, lfcSE, stat, pval, padj), and classifications as Shared, Human-enriched and Chimpanzee-enriched.
- https://doi.org/10.7554/eLife.33084.044
-
Supplementary file 3
Table with 4,242,188 orthologous TEs, their overlap with orthologous H3K9me3 regions, and classification as Shared, Human-enriched and Chimpanzee-enriched.
- https://doi.org/10.7554/eLife.33084.045
-
Transparent reporting form
- https://doi.org/10.7554/eLife.33084.046
Download links
A two-part list of links to download the article, or parts of the article, in various formats.
Downloads (link to download the article as PDF)
Open citations (links to open the citations from this article in various online reference manager services)
Cite this article (links to download the citations from this article in formats compatible with various reference manager tools)
Silencing of transposable elements may not be a major driver of regulatory evolution in primate iPSCs
eLife 7:e33084.
https://doi.org/10.7554/eLife.33084


