The role of Pitx2 and Pitx3 in muscle stem cells gives new insights into P38α MAP kinase and redox regulation of muscle regeneration
- Institut Pasteur, France
- Sorbonne Universités, Université Pierre et Marie Curie, France
- Universityof Padova, Italy
- Institut de Recherches Cliniques de Montréal, Canada
Figures
Figure 1 with 1 supplement
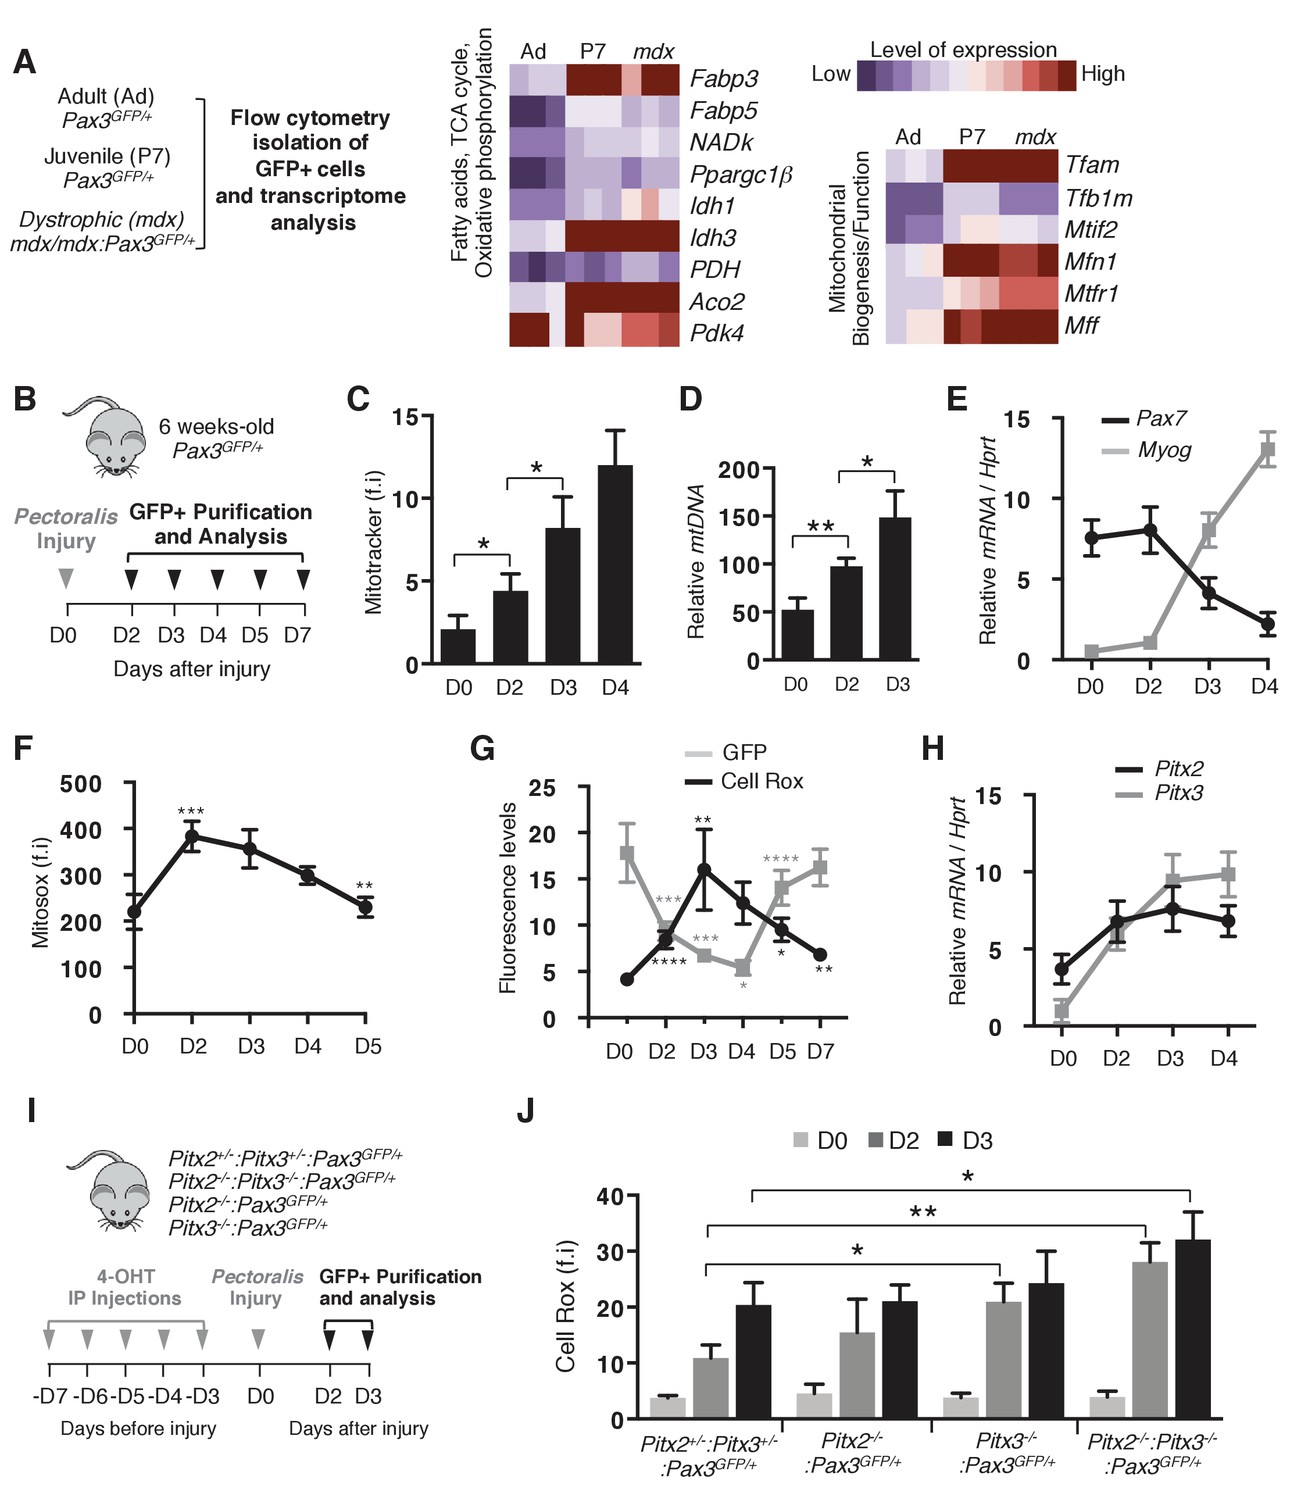
Activation of muscle stem cells during regeneration is accompanied by changes in their redox state.
(A) Quiescent (adult) and activated (P7 and mdx) satellite cells were purified respectively from adult Pax3GFP/+ (Ad, 98% quiescent), postnatal day 7 Pax3GFP/+ (P7, 80% activated) and adult dystrophic mdx:Pax3GFP/+ (mdx, 30% activated) mice. In each case, pectoralis, abdominal and diaphragm muscles were used for isolation by flow cytometry of Pax3(GFP)-positive satellite cells. After purification, RNA was isolated from Pax3(GFP)-positive cells for transcriptome analysis (Pallafacchina et al., 2010). (B) Experimental scheme used for the purification of quiescent and activated satellite cells during regeneration. (C–H) GFP-positive cells were isolated from the pectoralis muscles of adult Pax3GFP/+mice at different days (D) after notexin injection or from control muscles at D0. (C) GFP-positive cells isolated at D0 (quiescent) and D2 to D4 after notexin injury (activated) were immediately incubated with Mitotracker probe and analysed by flow cytometry to measure fluorescence intensity (f.i). (D) DNA samples prepared from Pax3(GFP)-positive cells were analysed by qPCR for the level of the mitochondrial COI gene relative to the level of the nuclear encoded NDUFV1 gene, expressed as a log ratio. (E) RNA samples prepared from Pax3(GFP)-positive cells were analysed by qPCR for transcripts of Pax7 and Myogenin relative to the level of Hprt transcripts, expressed as a log ratio. (F, G) Immediately after purification at D0-D5 (F) or D0-D7 (G), GFP-positive cells were incubated with Mitosox (F) or Cell Rox (G) probes and the relative fluorescence intensity (f.i) measured by flow cytometry. (H) RNA samples as in (E) were analysed by qPCR for Pitx2 and Pitx3 transcripts. (I) Double Pitx2/3 mutant Pitx2flox/flox:Pitx3flox/-:Pax3GFP/+:R26RCre-ERT2/+, single Pitx2 mutant Pitx2flox/flox:Pax3GFP/+:R26RCre-ERT2/+, single Pitx3 mutant Pitx3-/-:Pax3GFP/+, and control Pitx2flox/+:Pitx3+/-:Pax3GFP/+:R26RCre-ERT2/+ adult mice were obtained by 4-hydroxytamoxifen (4-OHT) intra-peritoneal (IP) injection on 5 consecutive days (D) and subjected to muscle injury by notexin injection into the pectoralis muscle (D0). (J) GFP-positive cells isolated as in (B) at D0, 2 and 3 after injury were incubated with Cell Rox probe and the relative fluorescence intensity (f.i.) measured by flow cytometry. Error bars (C–H, J) represent the mean ±s.d with n ≥ 6 independent animals (C, E–H, J) or 4 independent animals (D). Error bars represent the mean ± s.d, with *p<0.05, **p<0.01, ***p<0.001, ****p<0.001. Please see Figure 1—figure supplement 1 for additional data.
-
Figure 1—source data 1
Numerical data used to generate Figure 1.
- https://doi.org/10.7554/eLife.32991.005
Figure 1—figure supplement 1
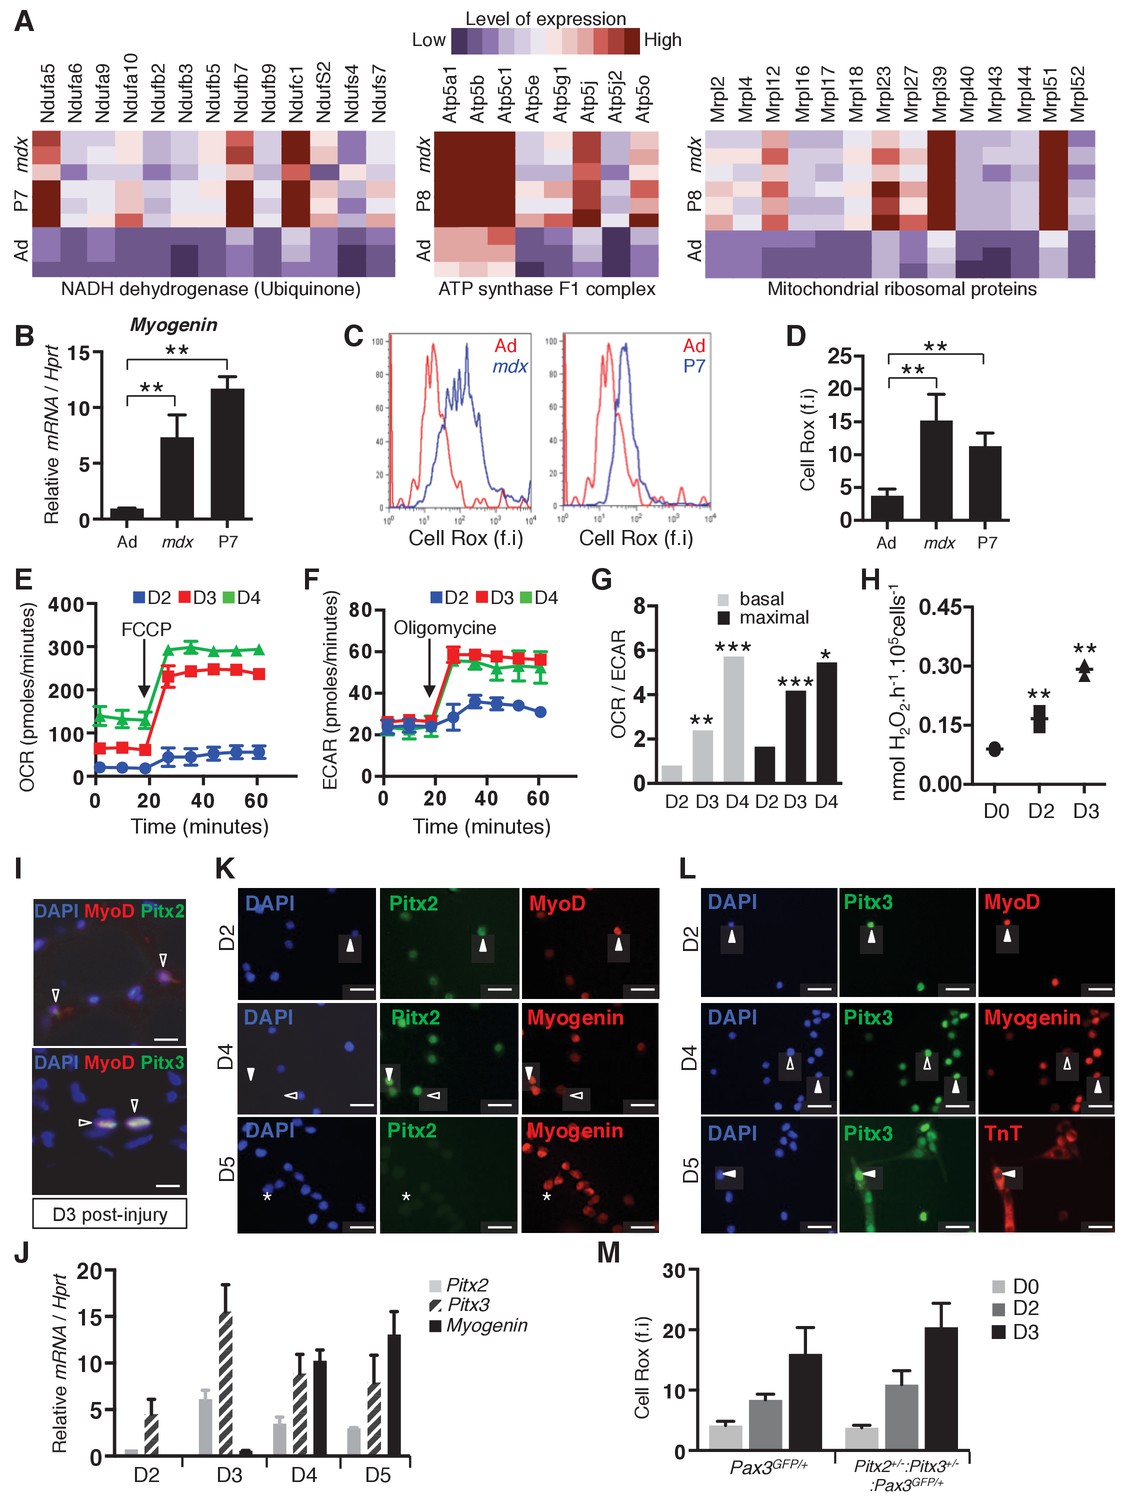
Activation of muscle stem cells is accompanied by mitochondrial activity.
(A) Pectoralis, abdominal and diaphragm muscles were dissected from adult Pax3GFP/+ (Ad), postnatal day 7 Pax3GFP/+ (P7) and adult mdx/mdx:Pax3GFP/+(mdx) mice and used for isolation by flow cytometry of Pax3(GFP)-positive satellite cells. After purification, adult, postnatal day 7 and mdx Pax3(GFP)-positive cells were used for RNA purification and transcriptome analysis (Pallafacchina et al., 2010). (B) RNA samples prepared from adult control (Ad), adult mdx (mdx) and P7 GFP-positive cells were analysed by qPCR for Myogenin transcripts relative to the level of Hprt transcripts, expressed as a log ratio. (C, D) Immediately after purification, adult control (Ad, quiescent, red), postnatal day 7 (P7, activated, blue) and adult mdx (mdx, activated, blue) GFP-positive cells were incubated with Cell Rox probe and analysed by flow cytometry to measure fluorescence intensity (f.i). (C) Representative results and (D) histogram quantification of Cell Rox fluorescence intensity (f.i.). (B, D) Error bars represent the mean ± s.d, with n = 3 independent animals (B) or n ≥ 6 independent animals (D), **p<0.01. (E–H) GFP-positive cells isolated by flow cytometry from the pectoralis, abdominal and diaphragm muscles of Pax3GFP/+ adult mice were cultured. (E–G) Mitochondrial respiration measured by oxygen consumption rate (OCR) in basal conditions and after addition of FCCP (maximal respiration) (E), and glycolysis measured by extracellular acidification rate (ECAR) in basal conditions and after addition of oligomycin (maximal glycolytic activity) (F) were simultaneously recorded on cells at D2-D4 of culture using the Seahorse XFe24 technology. (G) Histogram represents the OCR/ECAR ratio. (H) H2O2 production by freshly isolated (D0) and ex vivo activated satellite cells (D2–D3), was measured using amplex red technology. (E, F, H) Error bars represent the mean ±s.d, with n = 3 independent animals, *p<0.05, **p<0.01, ***p<0.001. (i) Tibialis Anterior (TA) muscles of wild-type adult mice were dissected 3 days after cardiotoxin injury. Cryo-sections were processed for immunofluorescence analysis with DAPI and antibodies directed against Pitx2 or Pitx3 (green) and MyoD (red). Scale bars, 20 μm. (J–L) GFP-positive cells isolated by flow cytometry from pectoralis, abdominal and diaphragm muscles of Pax3GFP/+ adult mice were cultured for the indicated days (D). (J) After 2, 3, 4 and 5 days of culture, cells were used for RNA extraction. Pitx2, Pitx3 and Myogenin transcripts were analysed by qPCR relative to the level of Hprt transcripts, expressed as a log ratio. (K, L) After 2, 4 and 5 days of culture, cells were used for immunofluorescence analysis with DAPI and antibodies directed against MyoD, Myogenin or Troponin T (TnT) (K), (L), red), and Pitx2 (K), green) or Pitx3 (L), green). White arrowheads indicate cells positive for Pitx and differentiation markers, arrowheads outlined in black indicate cells positive for Pitx2 or Pitx3 and negative for Myogenin, and stars indicate cells positive for Myogenin and negative for Pitx2. Scale bars, 20 μm. Representative images from at least 3 independent experiments are shown. (M) Pitx2flox/+:Pitx3+/-:Pax3GFP/+:R26RCre-ERT2/+ double heterozygote mice, obtained by 4-hydroxytamoxifen (4-OHT) intra-peritoneal (IP) injection on 5 consecutive days (D) and Pax3GFP/+ wild type mice were subjected to muscle injury by notexin injection into the pectoralis muscle. GFP-positive cells isolated from mice of both genotypes at D0, D2 and D3 after notexin injury were immediately incubated with Cell Rox probe and analysed by flow cytometry to measure fluorescence intensity (f.i). Histograms represent ROS quantification.
-
Figure 1—figure supplement 1—source data 1
Numerical data used to generate Figure 1—figure supplement 1.
- https://doi.org/10.7554/eLife.32991.004
Figure 2 with 1 supplement
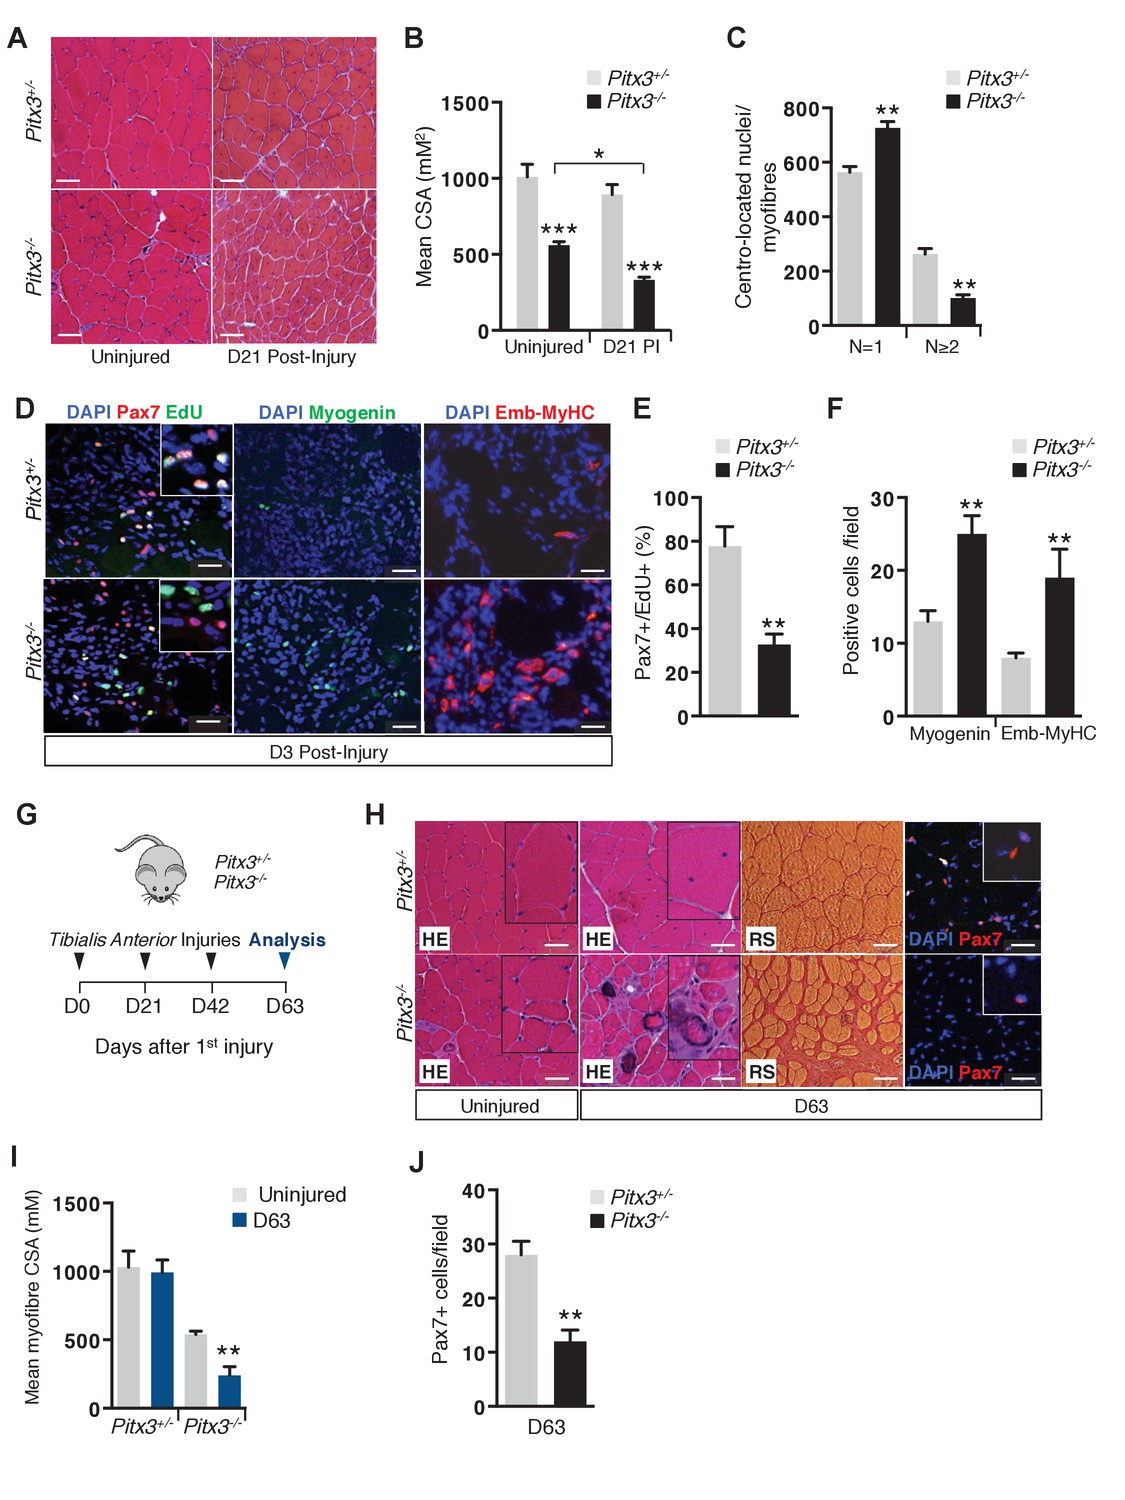
Absence of Pitx3 in adult muscle leads to hypoplasia of regenerated fibres by defective amplification and premature differentiation of mutant satellite cells.
Mutant Pitx3-/- and control Pitx3+/- adult mice were subjected to muscle injury by cardiotoxin injection into the Tibialis Anterior (TA) muscle. (A) Twenty-one days (D21) after injection, injured and contralateral uninjured TA muscles were dissected and cryo-sections were analysed by hematoxylin-eosin (HE) staining. (B) The cross-sectional area (CSA) of control and mutant fibres was measured in the absence of injury and 21 days (D21) post injury (PI) and represented as a mean value. (C) The number of fibres with one or two and more centro-located nuclei was counted on transverse sections of control and mutant muscle, and expressed per section. (D) Three days after injury, control and mutant animals were treated with EdU for 5 hr and muscles were dissected. Muscle cryo-sections were stained with DAPI (blue) and analysed by immunofluorescence with Pax7 (red), Myogenin (green) and Embryonic Myosin Heavy Chain (Emb-MyHC, red) antibodies and by the EdU reaction (green). (E) Pax7/EdU double positive-cells expressed as a percentage of Pax7-positive cells and (F) Myogenin-positive and Emb-MyHC-positive cells were counted per field. (G–J) Mutant Pitx3-/- and control Pitx3+/- mice were subjected to three successive muscle injuries (D0, D21 and D42) by cardiotoxin injection into the TA muscle. Three weeks after the third injection (D63), injured and contralateral uninjured muscles were dissected. (H) Cryo-sections were analysed by hematoxylin-eosin (HE) and red sirius (RS) staining and by immunofluorescence with a Pax7 (red) antibody on DAPI stained sections. (I) CSA of control and mutant fibres was measured in regenerated and contralateral uninjured TA muscles, and is represented as a mean value. (J) Pax7 positive-cells were counted and quantified per field. The experiments were performed with n ≥ 3 animals, and a representative image is shown. (B, C, E, F, I, J), error bars represent the mean ±s.d, with **p<0.01, ***p<0.001. (A, H) Scale bar, 100 μm, (D) Scale bar, 50 μm. Please see Figure 2—figure supplement 1 for additional data.
-
Figure 2—source data 1
Numerical data used to generate Figure 2.
- https://doi.org/10.7554/eLife.32991.009
Figure 2—figure supplement 1
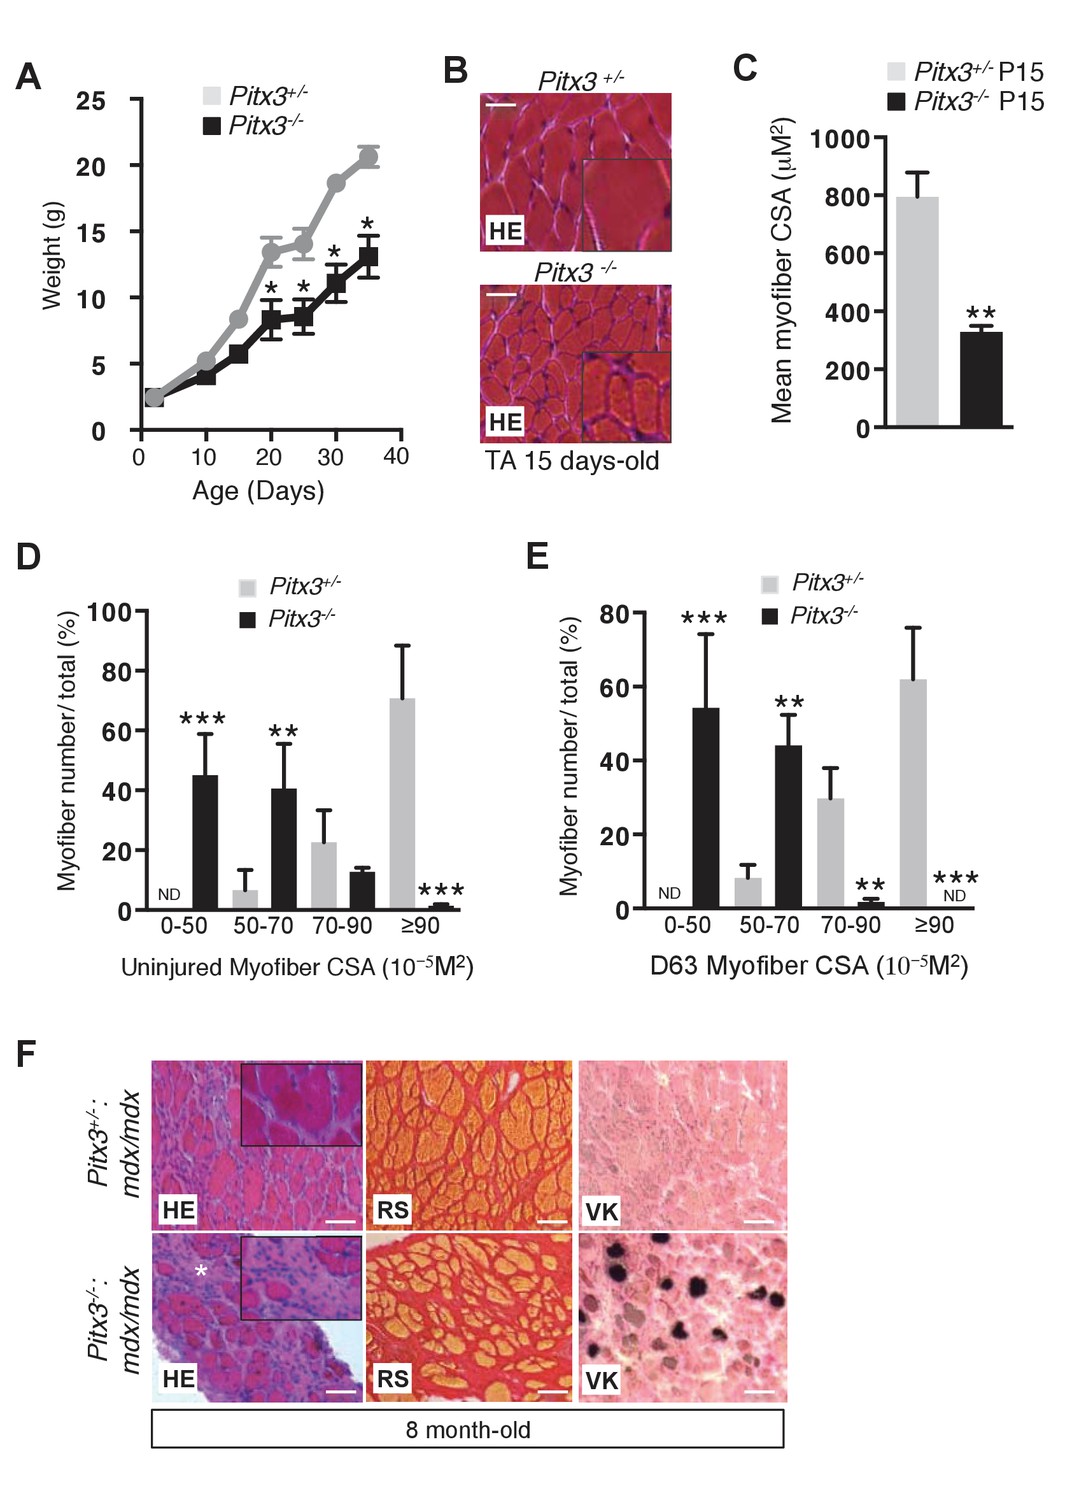
Pitx3 deletion leads to defective skeletal muscle growth and to aggravation of the mdx dystrophic phenotype.
(A) Mutant Pitx3-/- and control Pitx3+/- were weighed from birth (P0) to postnatal day 35, expressed in grams (g). (B) TA muscles of 15 day old mutant Pitx3-/- and control Pitx3+/- were dissected and cryo-sections analysed by hematoxylin-eosin staining (HE). Scale bar, 200 μM. (C) Cross-sectional area (CSA) of control and mutant fibres is represented as a mean value. (D, E) Control Pitx3+/- and mutant Pitx3-/- adult mice were subjected to three successive muscle injuries (D0, D21 and D42) by cardiotoxin injection into the TA muscle. Three weeks after the third injection (D63), injured and contralateral uninjured muscles were dissected and the CSA of control and mutant fibres was measured in contralateral uninjured (D) and regenerated (E) TA muscles. (F) Cryosections of the diaphragm of 8 months old double mutant Pitx3-/-:mdx and control Pitx3+/-:mdx mice were analysed by hematoxylin-eosin (HE), red Sirius (RS) and Von-Kossa (VK) staining. Scale bar, 100 μm. Error bars represent the mean ±s.d, with n = 3 animals (C, D, E), n = 6 animals (A) with *p<0.05, **p<0.01 and ***p<0.001. (B, F) The experiments were performed with n ≥ 3 animals, and a representative image is shown.
-
Figure 2—figure supplement 1—source data 1
Numerical data used to generate Figure 2—figure supplement 1.
- https://doi.org/10.7554/eLife.32991.008
Figure 3 with 2 supplements
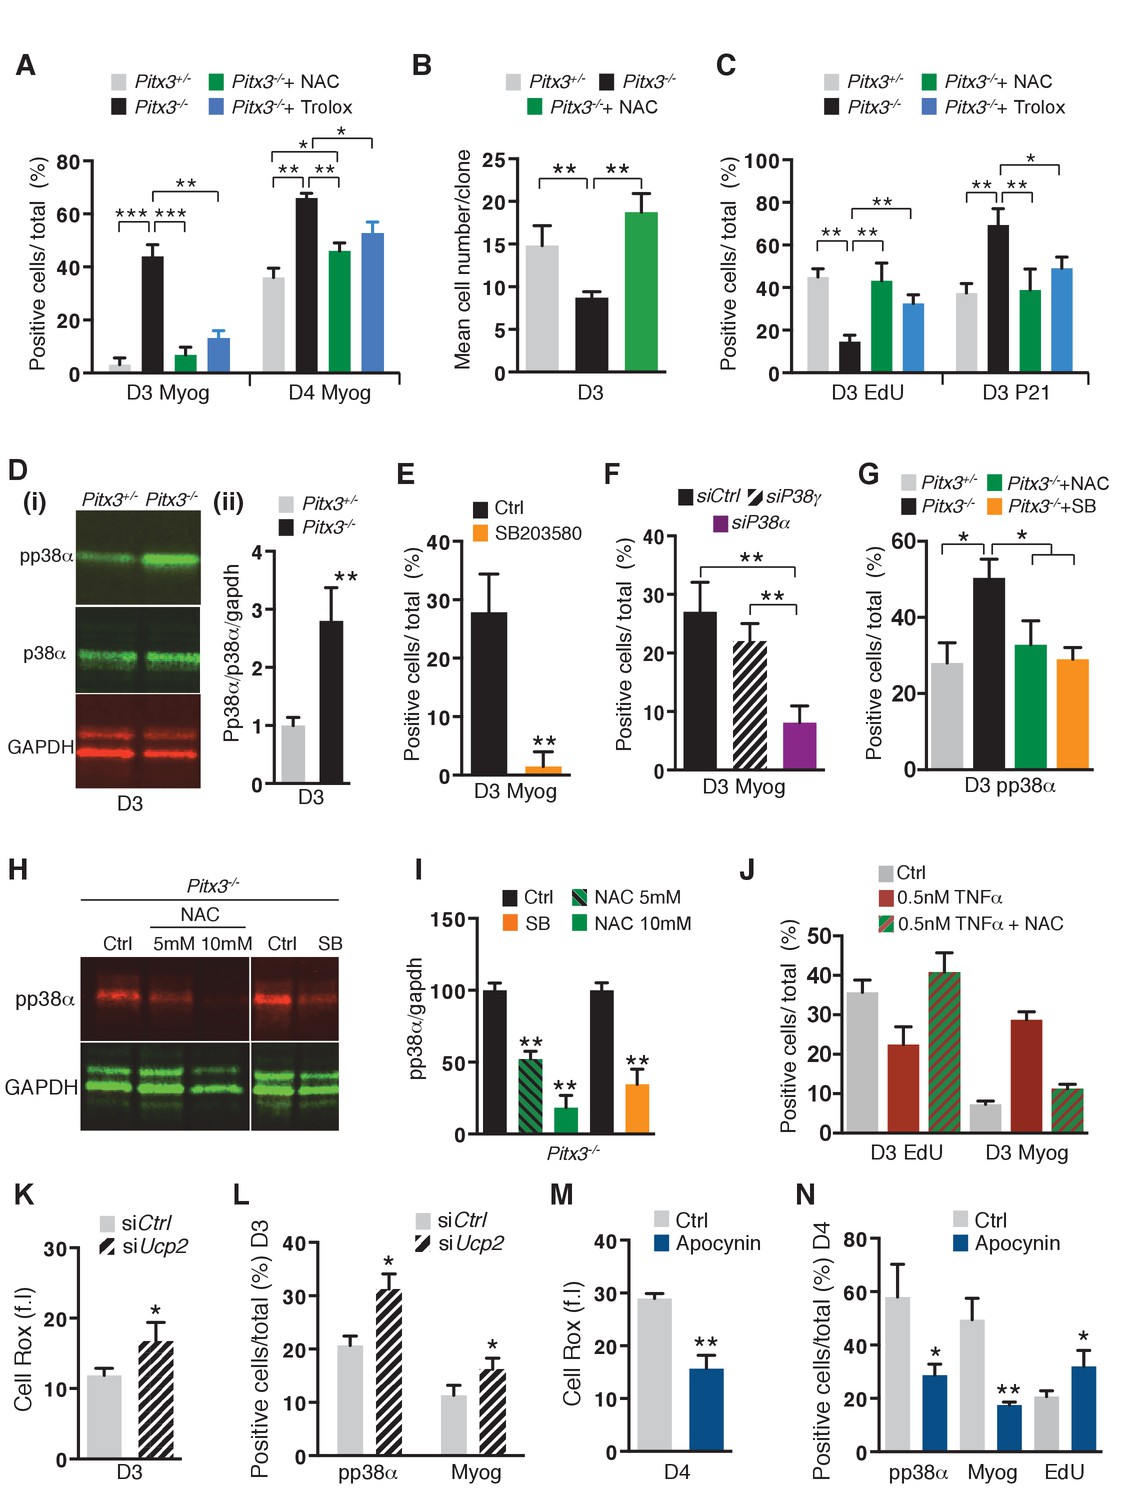
Premature differentiation of Pitx3 mutant satellite cells is mediated by activation of p38α MAP kinase and can be prevented by ROS scavenging or p38α MAP kinase inhibition.
In all experiments, GFP-positive cells were isolated by flow cytometry from the pectoralis, abdominal and diaphragm muscles of mutant Pitx3-/-:Pax3GFP/+ and control Pitx3+/-:Pax3GFP/+ adult mice. (A–C) Cells were cultured in the presence or absence of 10 mM N-Acetyl Cysteine (NAC) or of 10 μM Trolox. (A) After 3 and 4 days of culture, control and mutant cells were stained with DAPI and by immunofluorescence using a Myogenin antibody. Myogenin-positive cells (Myog) were counted and quantified as the percentage (%) of total cells. (B) After purification, control and mutant satellite cells were used for clonal analysis. Their proliferation capacity is expressed as the mean cell number per clone after 3 days of culture in the presence or absence of 10 mM NAC. (C) After 3 days of culture in the presence or absence of 10 mM NAC or of 10 μM Trolox, control and mutant GFP-positive cells were incubated with EdU. Cells were processed for detection of EdU incorporation and p21 expression by immunofluorescence using a p21 antibody. p21 and EdU-positive cells were counted and quantified as the percentage (%) of total cells. (D) GFP-positive cells isolated from mutant Pitx3-/-:Pax3GFP/+ mice and control Pitx3+/-:Pax3GFP/+adult mice were cultured for 3 days and proteins were extracted. Western-blot analysis indicated the level of pp38α, p38α and GADPH proteins (i). Quantification of western blots based on densitometry fluorescence scans for pp38α, p38α and GAPDH (ii). (E, F) GFP-positive cells isolated from Pitx3-/-:Pax3GFP/+ mice were purified and cultured. (E) Mutant Pitx3-/-:Pax3GFP/+ cells cultured for 3 days in the presence or absence of SB203580 were analysed by immunofluorescence using a Myogenin antibody. Myogenin-positive cells (Myog) were counted, and quantified as the percentage (%) of total cells. (F) Mutant Pitx3-/-:Pax3GFP cells transfected with siRNA directed against p38α and p38γ transcripts or siControl were analysed after 3 days of culture by immunofluorescence using a Myogenin antibody. Myogenin-positive cells (Myog) were counted, and quantified as the percentage (%) of total cells. (G) Control Pitx3+/-:Pax3GFP/+ and mutant Pitx3-/-:Pax3GFP/+ cells cultured for 3 days in the presence or absence of SB203580 or NAC were analysed by immunofluorescence using a pp38α antibody. pp38α-positive cells were counted, and quantified as the percentage (%) of total cells. (H) Mutant Pitx3-/-:Pax3GFP/+ cells were cultured in the presence or absence of SB203580 or 5 and 10 mM NAC. After 3 days of culture, proteins were extracted from treated and untreated control cells and processed for western-blot analyses, using antibodies directed against pp38α or GAPDH. (I) Quantification of western-blot analyses as in (D) based on densitometry fluorescence scans indicates the levels of pp38α relative to the GAPDH protein. (J–N) GFP-positive cells isolated by flow cytometry from the pectoralis, abdominal and diaphragm muscles of Pax3GFP/+ mice were cultured. (J) 48 hr after culture, GFP-positive cells were treated with 0.5 nM TNFα with and without 10 mM NAC. After 24 hr of treatment, cells were incubated with EdU and processed for detection of EdU incorporation by fluorescence and of myogenin expression by immunofluorescence. Myogenin and EdU-positive cells were counted and quantified as the percentage (%) of total cells. (K, L) GFP-positive cells were transfected 24 hr after plating with siRNA directed against Ucp2 transcripts, or with siControl (Ctrl). Two days after transfection, cells were processed for quantification of reactive oxygen species (ROS) with the Cell Rox probe (f.i. fluorescence intensity) (K) or for Myogenin (Myog) and phospho-p38α (pp38α) expression by immunofluorescence (L). pp38α- and Myogenin-positive cells were counted, and quantified as the percentage (%) of total cells (L). (M,N) GFP-positive cells were cultured in the presence or absence of Apocynin, the inhibitor of NADPH oxidases. (M) After 4 days in culture, cells were processed for quantification of ROS as in (K), or incubated with EdU and processed for EdU detection by fluorescence, and for Myogenin and pp38α expression by immunofluorescence. (N) pp38α-, Myogenin- and EdU-positive cells were counted and quantified as the percentage (%) of total cells. (A–G, I–N) The experiments were performed with n = 3 animals for each condition. Error bars represent the mean ±s.d, with *p<0.05, **p<0.01, ***p<0.001. Please see Figure 3—figure supplement 1 for additional data.
-
Figure 3—source data 1
Numerical data used to generate Figure 3.
- https://doi.org/10.7554/eLife.32991.015
Figure 3—figure supplement 1
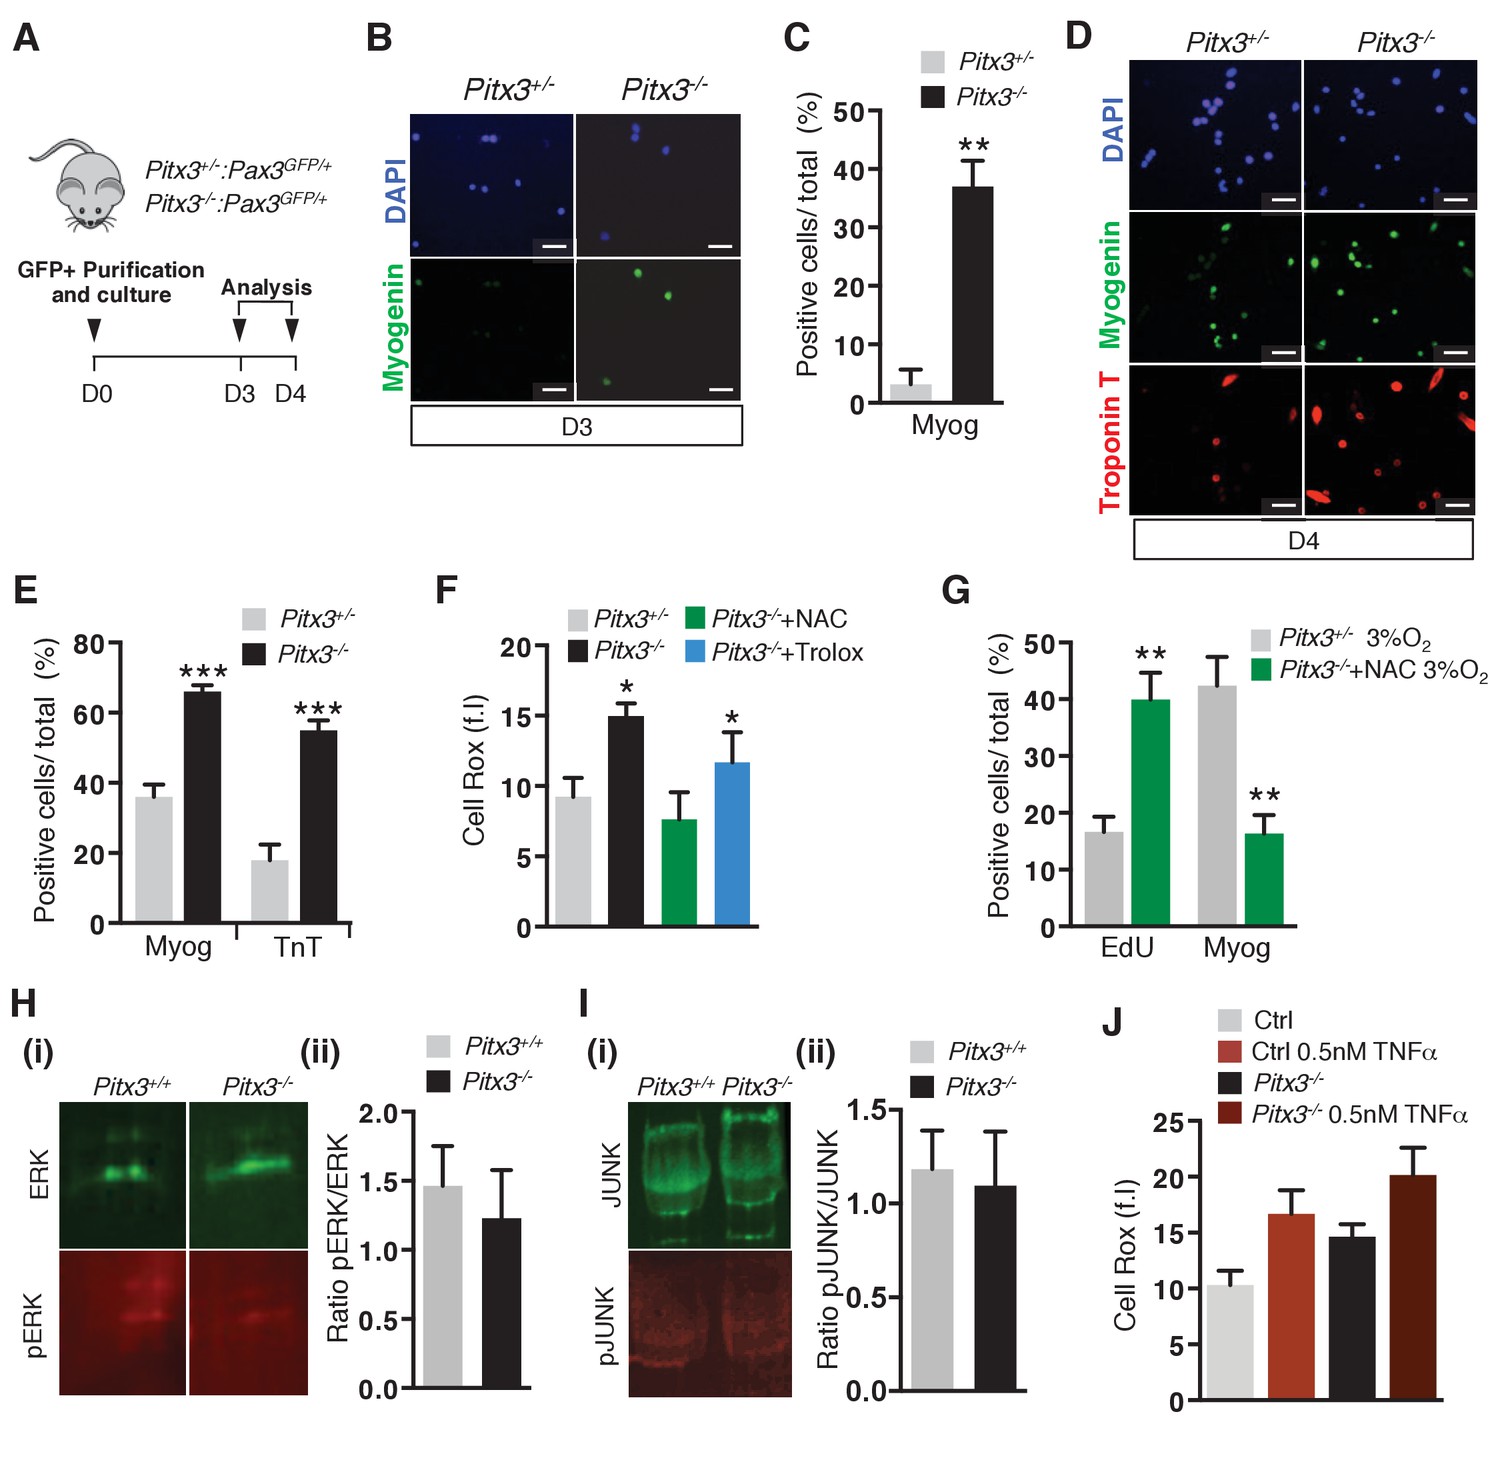
Pitx3 mutant satellite cells exhibit premature differentiation ex vivo.
(A–I) GFP-positive cells isolated by flow cytometry from the pectoralis and diaphragm muscles of mutant Pitx3-/-:Pax3GFP/+ and control Pitx3+/-:Pax3GFP/+ adult mice were cultured and analysed, as indicated in the schema (A). After 3 and 4 days (D) of culture, control and mutant cells were stained with DAPI (B, D), blue) and by immunofluorescence using Myogenin (B), (D), green) and Troponin T (D), red) antibodies. For each time point, the number of positive cells for each marker was counted and quantified as the percentage (%) of total cells, shown here for D3 (C) and D4 (E). (F) After 3 days of culture in the presence or absence of 10 mM NAC or of 10 μM Trolox, control and mutant GFP-positive cells were incubated with Cell Rox probe and the relative fluorescence intensity (f.i.) measured by flow cytometry. (G) GFP-positive cells isolated as in (A) were cultured in the absence or presence of 10 mM NAC under 3% O2. After three days of culture, cells were incubated with EdU and processed for EdU detection by fluorescence and for Myogenin detection by immunofluorescence. EdU- and Myogenin-positive cells were counted and quantified as the percentage (%) of total cells. (H–I) GFP-positive cells were isolated as in (A). After 3 days of culture, proteins were extracted and processed for western-blot analyses, using antibodies directed against ERK (green, H(i)) and pERK (red, H(i)), or JUNK (green, I(i)) and pJUNK (red, I(i)). Quantification of western-blot analyses based on densitometry fluorescence scans indicates the levels of pERK (H) (ii)) and pJUNK (I) (ii)) relative to total ERK (H) (ii)) and JUNK (I) (ii)) proteins. (J–M) GFP-positive cells isolated by flow cytometry from the pectoralis and diaphragm muscles of Pax3GFP/+mice were cultured. (J) After 48 hr of culture, cells from control and Pitx3-/- mutant mice were treated with 0.5 nM TNFα. After 24 hr of treatment, cells were incubated with Cell Rox probe and the relative fluorescence intensity (f.i.) measured by flow cytometry. All the experiments were performed with 3 independent cultures from 3 animals, and error bars represent the mean ±s.d, with *p<0.05, **p<0.01 and ***p<0.001. (B, D ) Scale bar, 20 μm.
-
Figure 3—figure supplement 1—source data 1
Numerical data used to generate Figure 3—figure supplement 1.
- https://doi.org/10.7554/eLife.32991.012
Figure 3—figure supplement 2
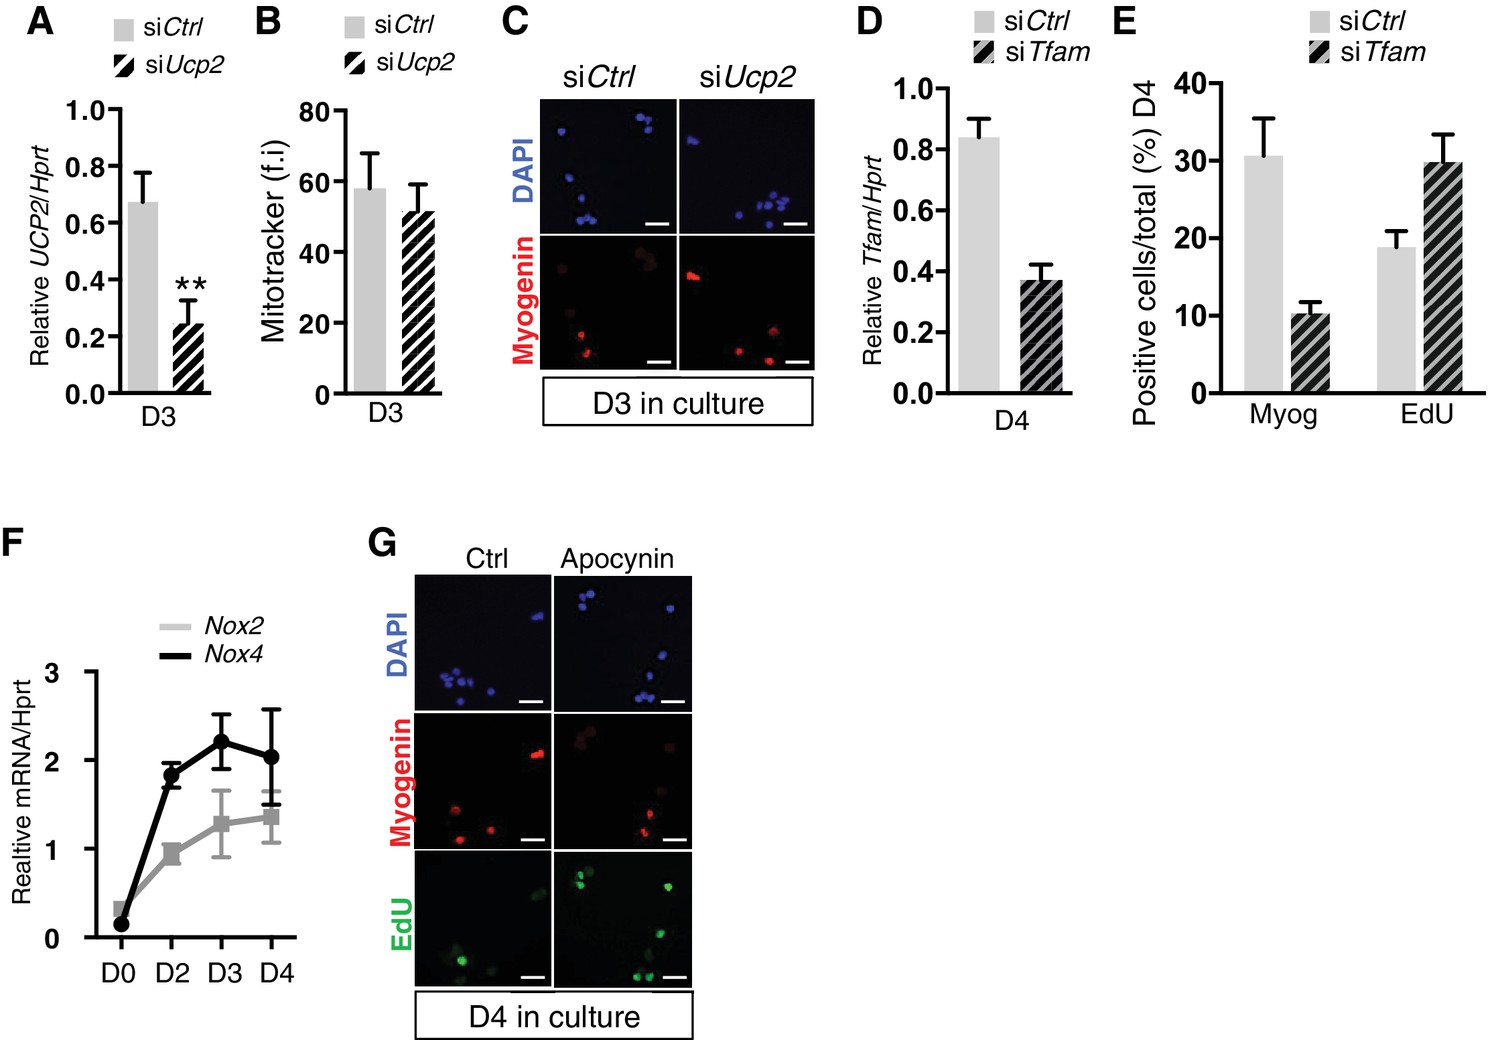
(A–C) GFP-positive cells isolated by flow cytometry from the pectoralis and diaphragm muscles of Pax3GFP/+ adult mice were cultured. 24 hr after plating, cells were transfected with siRNA directed against Ucp2 transcripts, or with siControl (Ctrl). (A) After 3 days of culture, cells wbere processed for mRNA extraction and Ucp2 transcripts were analysed by qPCR relative to the level of Hprt transcripts, expressed as a log ratio. (B, C) After 3 days of culture, cells were processed for quantification of mitochondrial content expressed as a relative level of fluorescence intensity (f.i) using Mitotracker probe (B), or for Myogenin expression by immunofluorescence using a Myogenin antibody (C). (D, E) GFP-positive cells isolated as in (A) were cultured. 24hr after plating, cells were transfected with siRNA directed against Tfam transcripts, or with siControl (Ctrl). (D) After 4 days of culture, cells wbere processed for mRNA extraction and Tfam transcripts were analysed by qPCR relative to the level of Hprt transcripts, expressed as a log ratio. (E) After 4 days in culture, cells were incubated with EdU and processed for detection of EdU incorporation and Myogenin expression. (F) GFP-positive cells isolated at D0 (quiescent) and D2-4 (activated) after notexin injury, were immediatly processed for mRNA extraction and Nox2 and Nox4 transcripts were analysed by qPCR relative to the level of Hprt transcripts, expressed as a log ratio. (G) GFP-positive cells isolated as in (A) were cultured in the presence of the inhibitor of NADPH oxidases, apocynin (10 mM). After 4 days in culture, cells were incubated with EdU and processed for detection of EdU incorporation and Myogenin expression. All the experiments were performed with 3 independent cultures from 3 animals, and error bars represent the mean ± s.d, with **p<0.01. (C, G) Scale bar, 20 μm.
-
Figure 3—figure supplement 2—source data 1
Numerical data used to generate Figure 3—figure supplement 2.
- https://doi.org/10.7554/eLife.32991.014
Figure 4 with 1 supplement
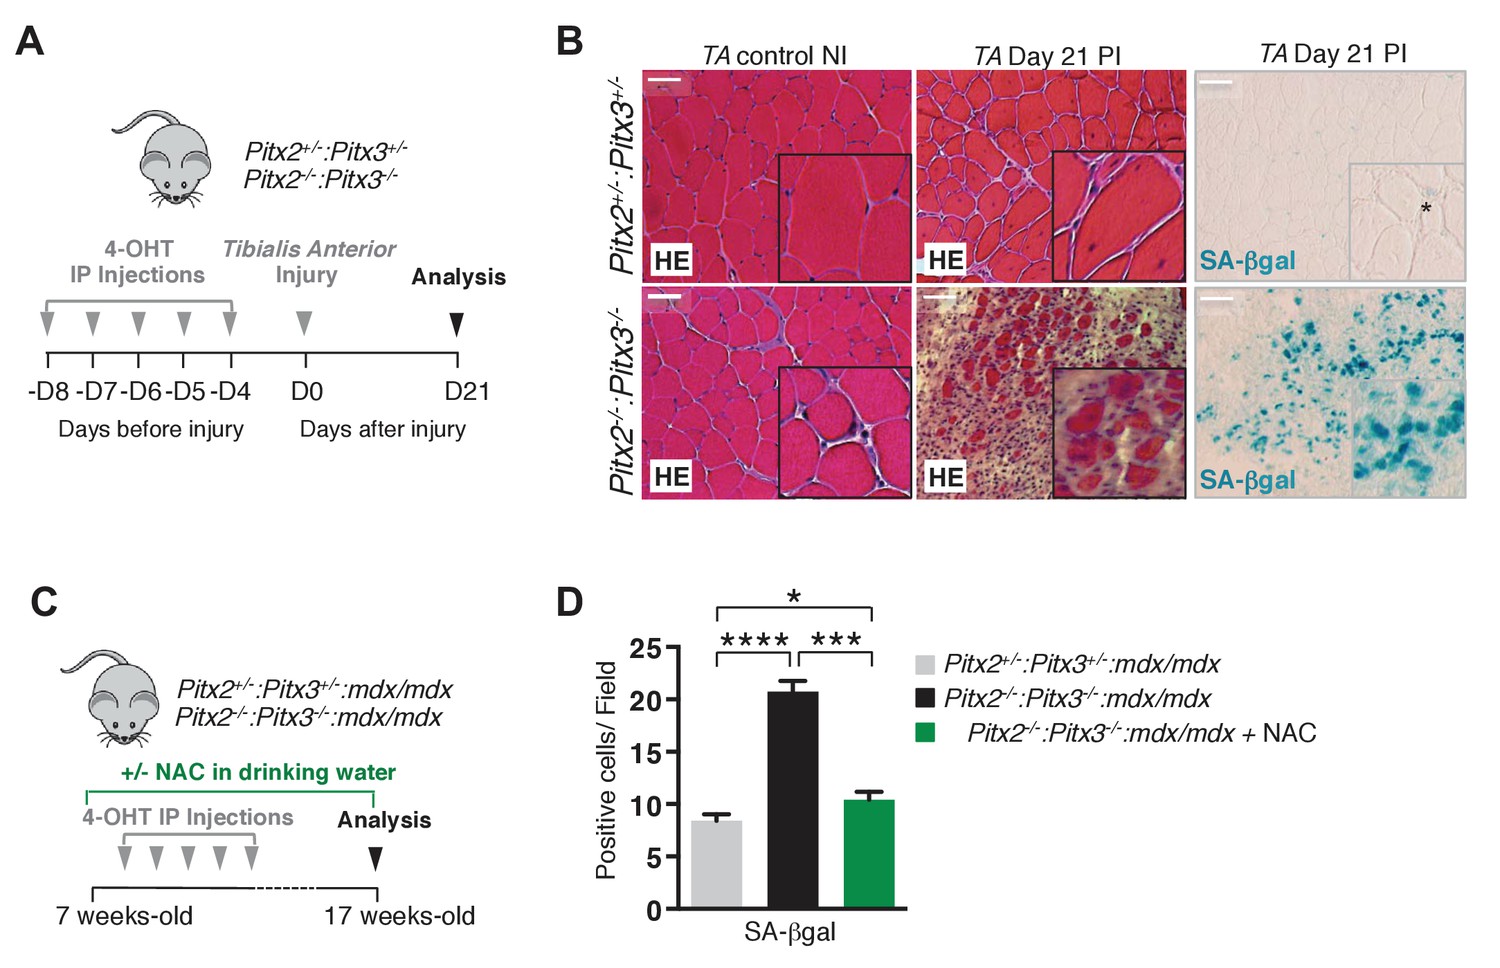
Mutation of Pitx2/3 in adult muscle satellite cells leads to impairment of muscle regeneration by deregulation of their redox state.
(A) Double mutant Pitx2flox/flox:Pitx3flox/-:Pax7Cre-ERT2/+ and control Pitx2flox/+:Pitx3+/-:Pax7Cre- ERT2/+ adult mice were obtained by 4-hydroxytamoxifen (4-OHT) intra-peritoneal (IP) injection on 5 consecutive days (D) and subjected to muscle injury by cardiotoxin injection into the Tibialis Anterior (TA) muscle. (B) Three weeks (D21) post injury (PI), injured and contralateral uninjured TA muscles were dissected. Muscle cryo-sections were analysed by hematoxylin-eosin (HE) and senescence-associated−β-galactosidase (SA-βgal) staining. Experiments were performed with n = 4 animals for each condition and representative images are shown, PI (Post Injury). Scale bars, 100 μm. (C) Double mutant Pitx2flox/flox:Pitx3flox/-:Pax7Cre-ERT2/+:mdx and control Pitx2flox/+:Pitx3+/-: Pax7Cre-ERT2/+:mdx adult mice obtained as in (A) were maintained during 10 weeks under standard life conditions. From 1 week before the start of the experiment, half of the double mutant Pitx2flox/flox:Pitx3flox/-:Pax7Cre-ERT2/+:mdx mice were treated with N-Acetyl-Cysteine (NAC) in the drinking water. (D) After 10 weeks, all mice were sacrificed and diaphragm muscles were dissected and analysed by SA-βgal staining. The number of SA-βgal positive cells per field was counted in diaphragm sections of control and double mutant animals. (D) Experiments were performed with n ≥ 5 animals for each condition and representative images are shown (B). Error bars represent the mean ± s.d, with *p<0.05, ***p<0.001, ****p<0.001. Please see Figure 4—figure supplement 1 for additional data.
-
Figure 4—source data 1
Numerical data used to generate Figure 4.
- https://doi.org/10.7554/eLife.32991.018
Figure 4—figure supplement 1
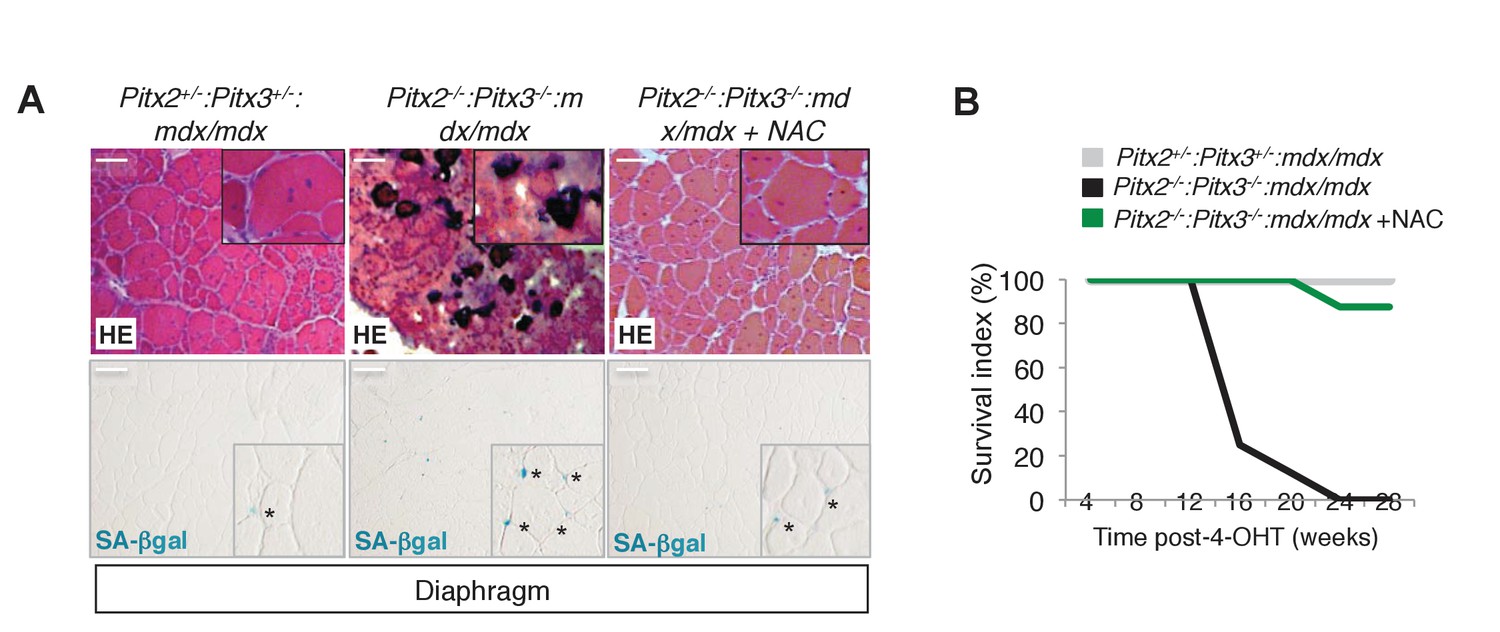
Deletion of Pitx2/3 in adult muscle satellite cells of mdx mice leads to aggravation of the dystrophic phenotype.
(A, B) Double Pitx2-/-:Pitx3-/-mutant mice were obtained by treating Pitx2flox/flox:Pitx3flox/-:Pax7Cre-ERT2/+:mdx and control Pitx2flox/+:Pitx3+/-:Pax7Cre-ERT2/+:mdx adults with 4-hydroxytamoxifen (4-OHT) intra-peritoneal injections on 5 consecutive days and then maintained for 10 weeks under normal conditions. During this period, half of the double mutant Pitx2flox/flox:Pitx3flox/-:Pax7Cre-ERT2/+:mdx mice were treated with N-Acetyl-Cysteine (NAC) in the drinking water. (A) Diaphragms were dissected and cryo-sections analysed by hematoxylin-eosin (HE) and Senescence Associated-β-galactosidase staining (SA-βgal). Scale bar, 100 μm. (B) The graph represents the survival of mice in the three groups. (A, B) Experiments were performed with n ≥ 5 animals for each condition and a representative image is shown (A).
Figure 5 with 1 supplement
Excessive ROS levels cause premature cell cycle exit, differentiation defects and senescence of Pitx2/3 double mutant satellite cells.
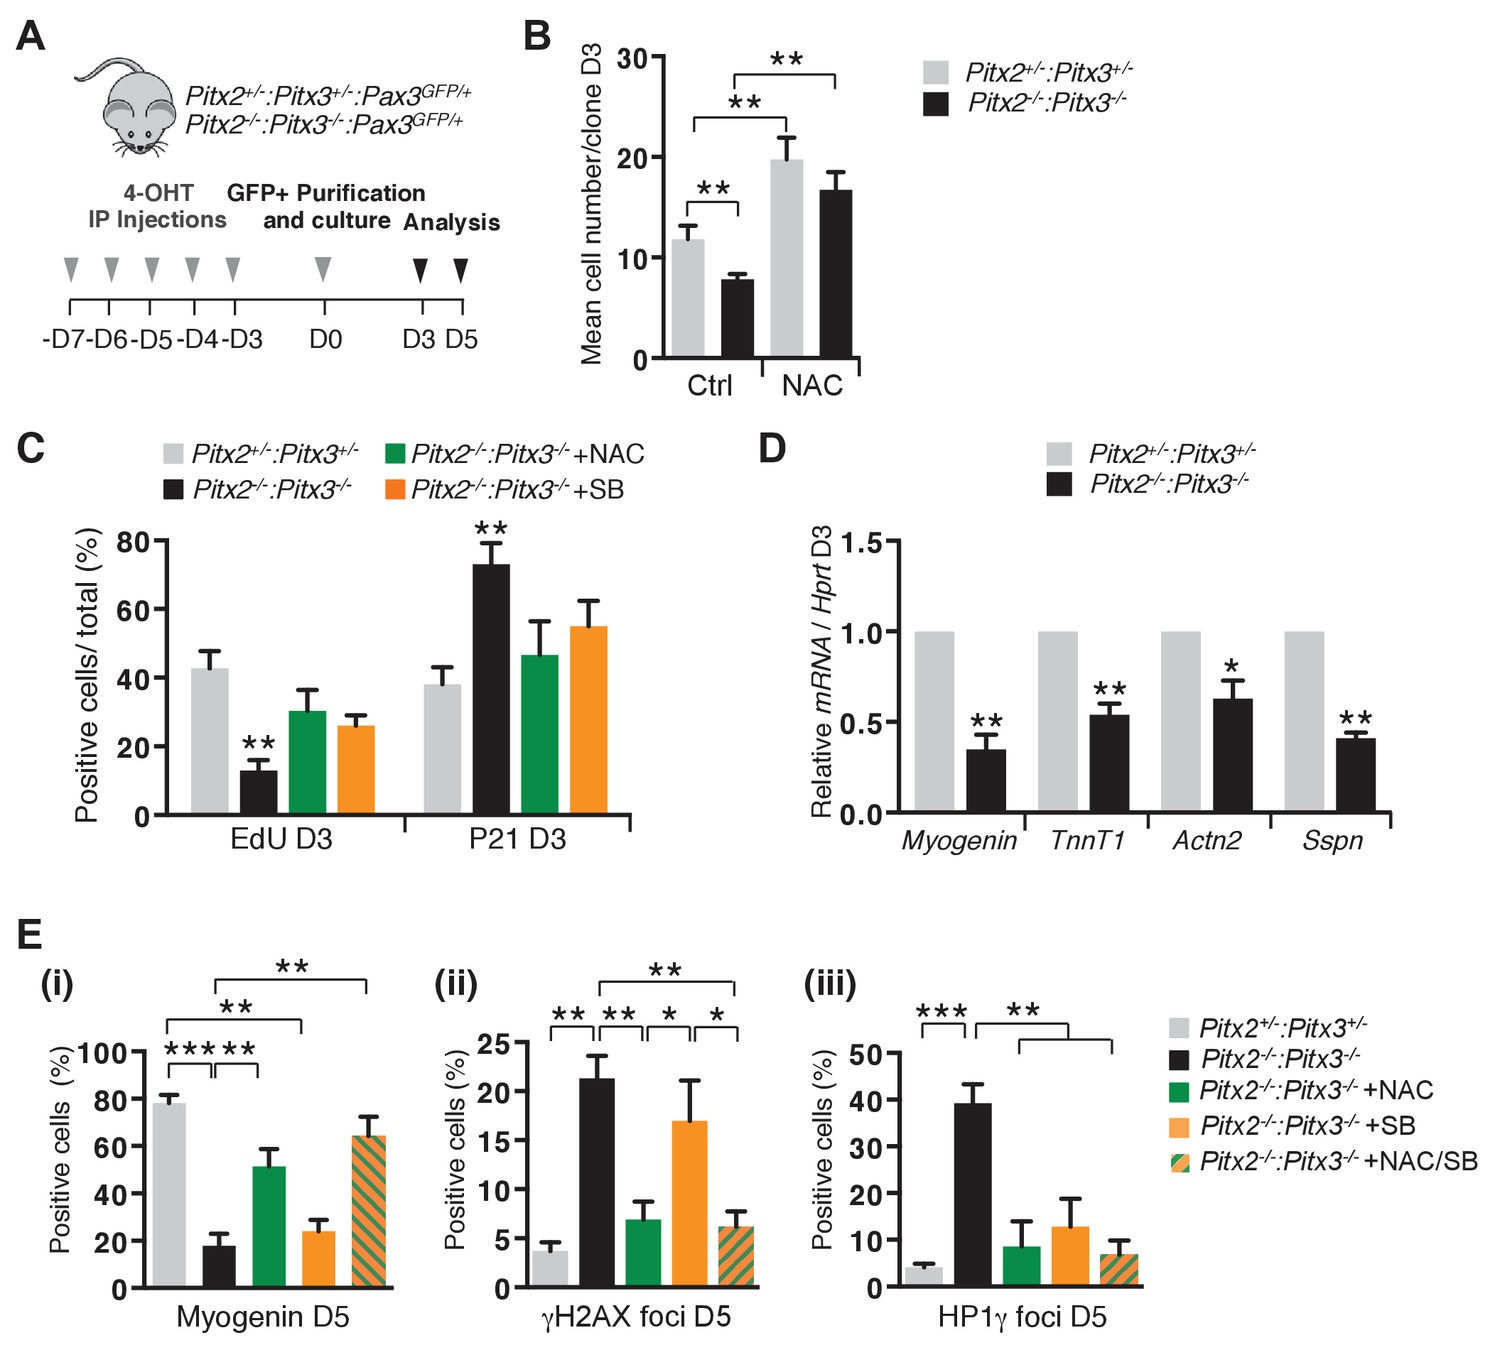
(A) Double mutant Pitx2flox/flox:Pitx3flox/-:Pax3GFP/+:R26RCre-ERT2/+, and control Pitx2flox/+:Pitx3+/-:Pax3GFP/+:R26RCre-ERT2/+ adult mice were obtained by 4-hydroxytamoxifen (4-OHT) intra-peritoneal (IP) injections for 5 consecutive days (D). Three days after the last injection, GFP-positive cells were isolated by flow cytometry from the pectoralis, abdominal and diaphragm muscles and analysed in culture. (B) control and mutant satellite cells were placed in culture and used for clonal analysis. Their proliferation capacity is expressed as the mean cell number per clone after 3 days of culture in the presence or absence of 10 mM N-Acetyl-Cysteine (NAC). (C) After 3 days of culture in the presence or absence of 10 mM NAC or 5 μM SB203580, cells were incubated with EdU and processed for detection of EdU incorporation and p21 expression. p21- and EdU-positive cells were counted, and quantified as the percentage (%) of total cells. (D) After 3 days of culture, total RNA samples were extracted from control and double mutant cells and analysed by qPCR for the expression of myogenic differentiation markers. Transcripts are shown relative to the level of Hprt transcripts, expressed as a log ratio. TnnT1, Troponin T1; Actn2, Actinin α2; Sspn, Sarcospan. (E) After 5 days of culture (D5) in the presence or absence of 10 mM NAC, 5 μM SB203580 or both NAC and SB203580, control and double mutant cells, marked by DAPI staining, were analysed by immunofluorescence with Myogenin, HP1γ and γΗ2ΑX antibodies. Myogenin-positive cells (i), γΗ2ΑX-foci (ii) and HP1γ foci-positive cells (iii), were counted, and quantified as the percentage (%) of total cells. (B–E) Error bars represent the mean ± s.d, with n = 3 animals for each genotype and each condition, *p<0.05, **p<0.01, ***p<0.001. Please see Figure 5—figure supplement 1 for additional data.
-
Figure 5—source data 1
Numerical data used to generate Figure 5.
- https://doi.org/10.7554/eLife.32991.022
Figure 5—figure supplement 1
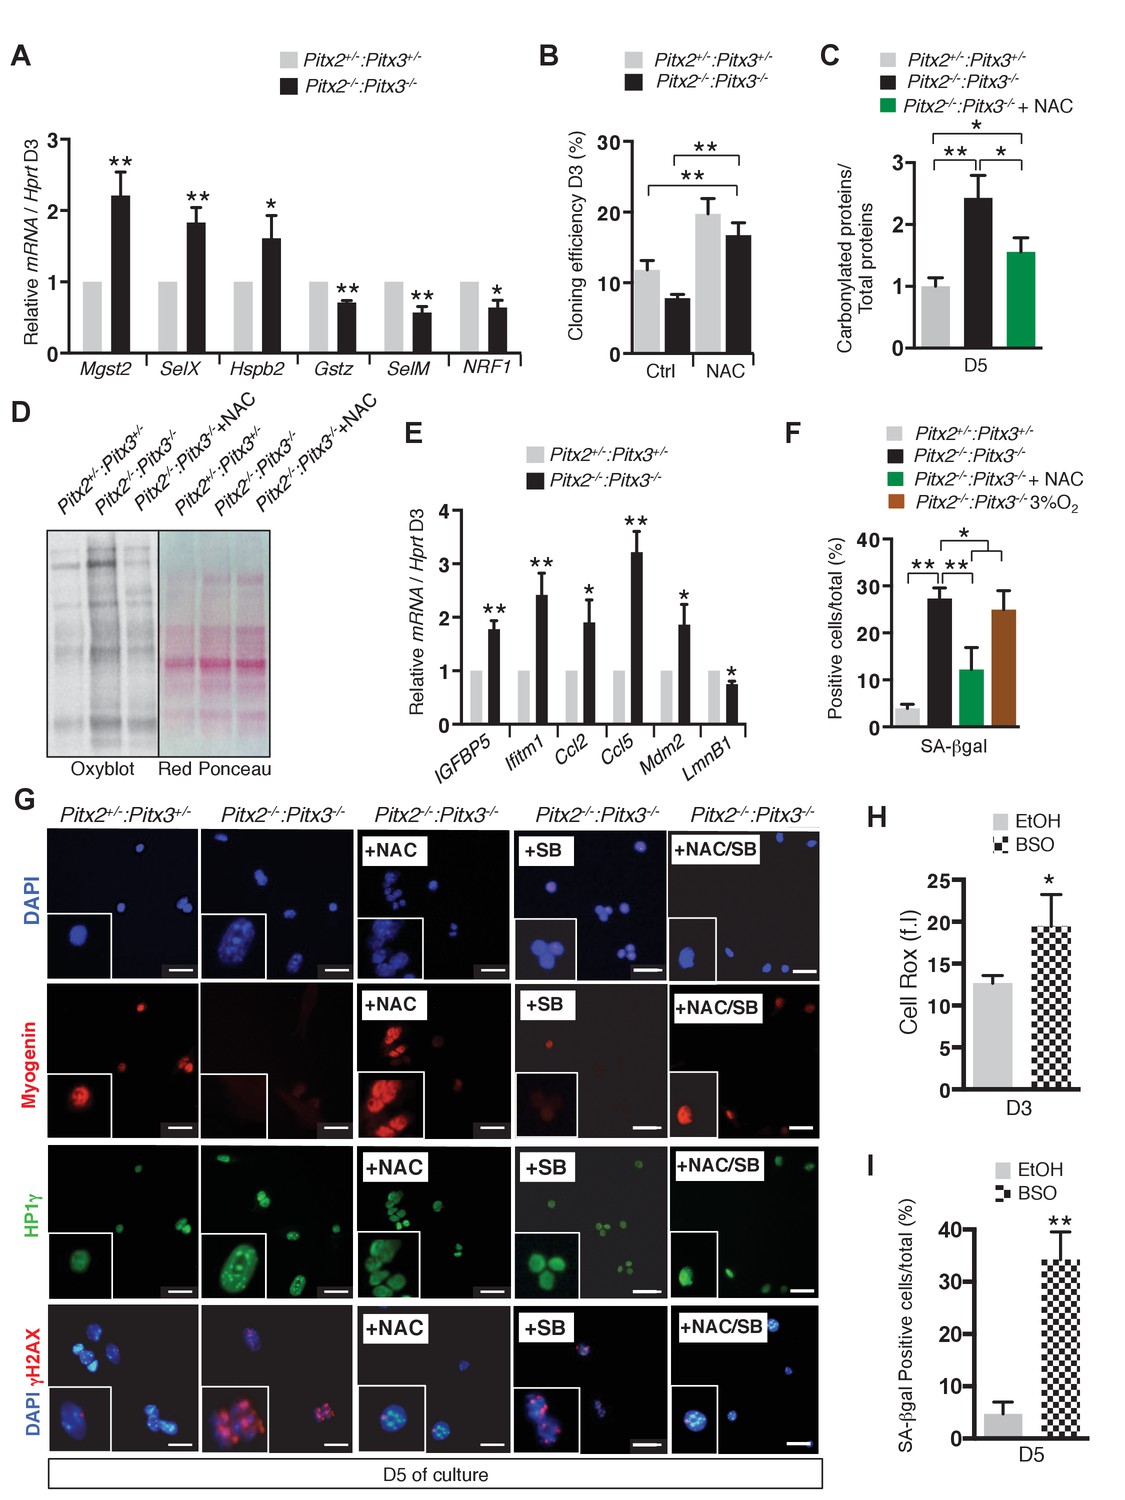
Deletion of Pitx2/3 in adult muscle satellite cells leads to altered expression of genes encoding antioxidant enzymes and accumulation of DNA damage.
(A) GFP-positive cells isolated from the pectoralis, abdominal and diaphragm muscles by flow cytometry from Pitx2flox/+:Pitx3+/-:Pax3GFP/+:R26RCre-ERT2/+ control (Pitx2+/-:Pitx3+/-) and Pitx2flox/flox:Pitx3flox/-:Pax3GFP/+:R26RCre-ERT2/+ double mutant mice (Pitx2-/-:Pitx3-/-), were cultured for 3 days and used for RNA purification. RNA samples were analysed by qPCR for expression of genes coding for antioxidant enzymes (Mgst2, SelX, Hspb2, Gstz, SelM) and NRF1 transcripts relative to the level of Hprt transcripts, expressed as a log ratio. (B) Control and double mutant cells obtained as in (A) were processed for clonal analysis by direct plating of flow cytometry isolated single cells. Cloning efficiency is expressed as the percentage of clones formed after 3 days of culture in the presence or absence of 10 mM NAC. (c) Control and double mutant cells obtained as in (A) were cultured in the presence or absence of 10 mM NAC. After 5 days of culture, proteins were extracted from control and mutant cells and analysed by Oxyblot-blot and Red Ponceau staining to detect carbonylated and total proteins, respectively. Quantification is represented in the histogram in (D). (E) Control and double mutant cells obtained as in (A) were cultured for 3 days and used for RNA purification. RNA samples were analysed by qPCR for transcripts of genes coding for senescence markers (Igfbp5, Ifitm1, Ccl2, Ccl5, Mdm2, LmnB1) relative to the level of Hprt transcripts, expressed as a log ratio. (F) Control and double mutant cells obtained as in (A) were cultured for 5 days in the presence or absence of 10 mM NAC, or under 3% O2 and analysed by Senescence Associated-β-galactosidase staining (SA-βgal). The number of SA-βgal positive cells per condition was counted and quantified as the percentage (%) of total cells. (G) Control and double mutant cells obtained as in (A) were cultured for 5 days in the presence or absence of 10 mM N-Acetyl-Cysteine (NAC), 5 μM SB203580 or both NAC and SB203580 and analysed by DAPI staining and by immunofluorescence with Myogenin, HP1γ and γΗ2ΑXantibodies. The experiments were performed with n = 3 animals, and a representative image is shown. Scale bars, 20 μm. (H, I) GFP-positive cells isolated by flow cytometry from the pectoralis and diaphragm muscles of Pax3GFP/+ adult mice were cultured for 3 and 5 days in the presence or absence of 10 μM buthionine sulfoximide (BSO) to induce glutathione depletion. EtOH alone provides a control. (H) After 3 days of culture, cells were incubated with Cell Rox probe and analysed by flow cytometry to measure fluorescence intensity (f.i). (i) After 5 days of culture, cells were analysed by SA-βgal staining. The number of SA-βgal-positive cells per condition was counted and quantified as the percentage (%) of total cells. (A–C, E, F, H, I) Error bars represent the mean ± s.d, with n = 3 animals for each genotype, with *p<0.05, **p<0.01.
-
Figure 5—figure supplement 1—source data 1
Numerical data used to generate Figure 5—figure supplement 1.
- https://doi.org/10.7554/eLife.32991.021
Figure 6 with 1 supplement
The transition of satellite cells from proliferation to differentiation is regulated by their redox state.
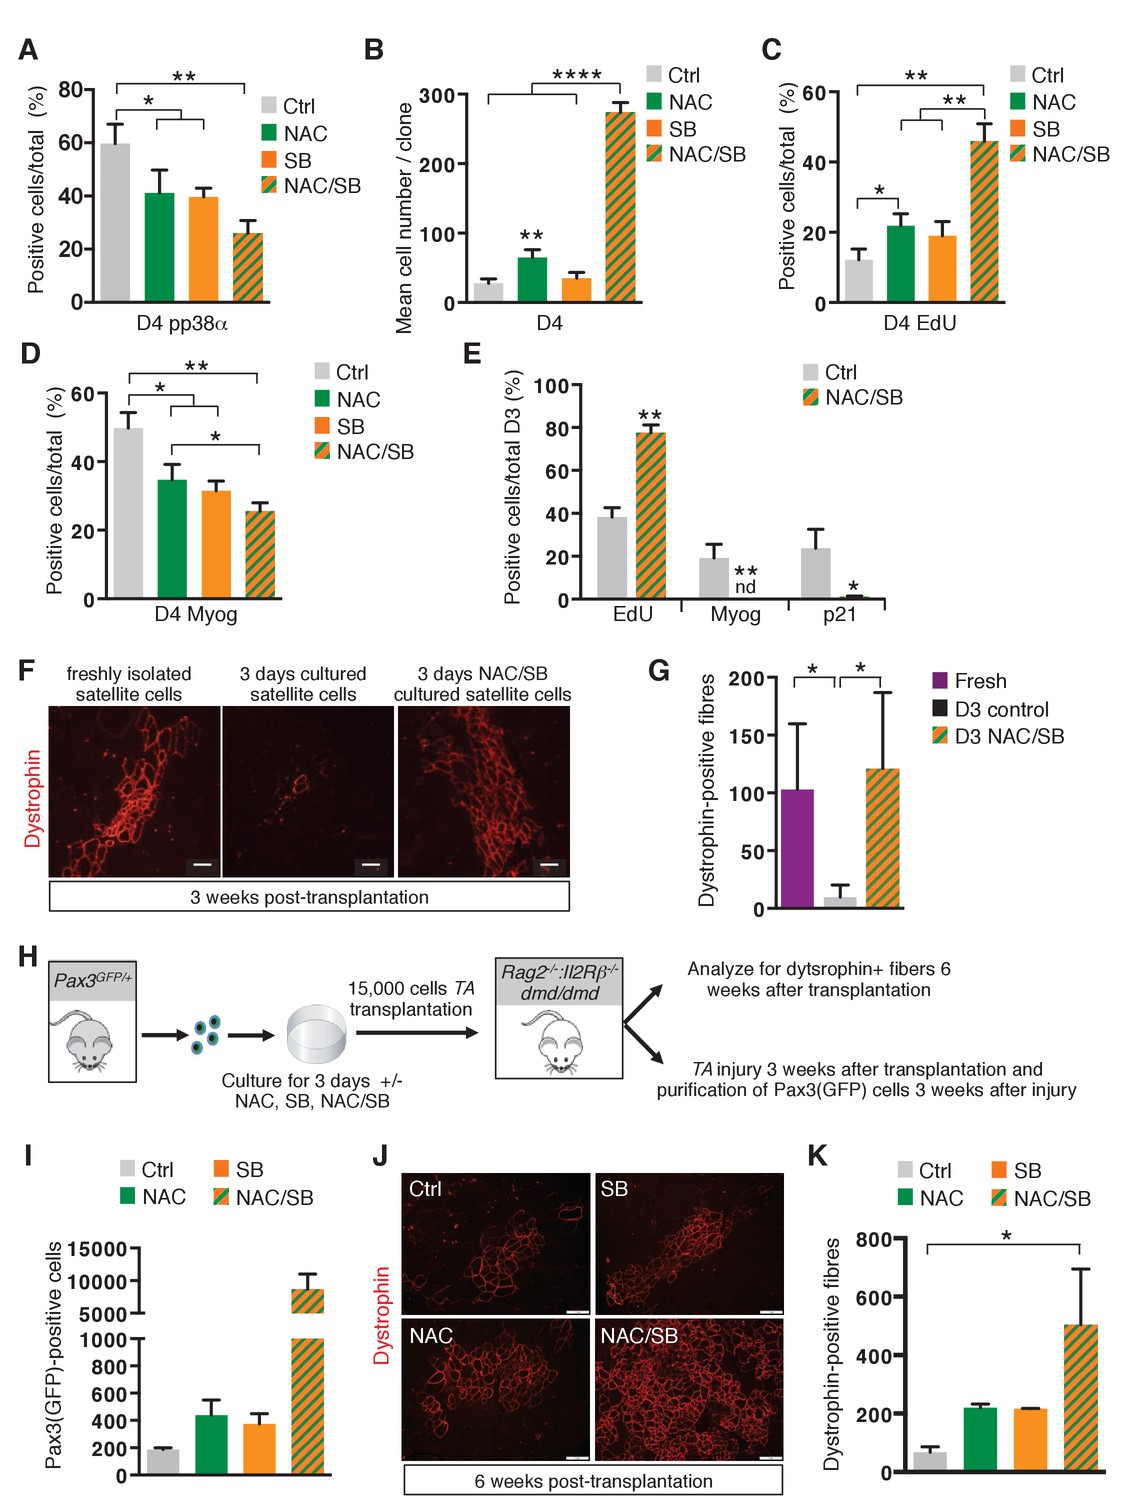
(A–E) GFP-positive cells isolated by flow cytometry from the pectoralis, abdominal and diaphragm muscles of Pax3GFP/+ mice were cultured for 4 days (D4) in the absence (ctrl) or in the presence of 10 mM N-Acetyl Cysteine (NAC), or 5 μM SB203580 (SB), or of both NAC and SB203580 (NAC/SB) in mass (A, C, D) or clonal conditions (B). (A) After 4 days in culture, cells were processed for phospho-p38α (pp38α) expression by immunofluorescence. pp38α-positive cells were counted, and quantified as the percentage (%) of total cells. (B) The cell proliferation capacity is expressed as the mean cell number per clone. (C, D) After 4 days in culture, cells were incubated with EdU and processed for EdU detection by fluorescence (C) or for Myogenin (Myog) detection by immunofluorescence (D). EdU-positive cells (C) and Myogenin-positive cells (D) were counted and quantified as the percentage (%) of total cells. (E) GFP-positive cells isolated as in (A) were cultured for 3 days (D3) in the absence (ctrl) or in the presence of both NAC and SB203580 (NAC/SB). Cells were incubated with EdU and processed for EdU detection by fluorescence, and for Myogenin or P21 detection by immunofluorescence. Myogenin, EdU and p21 positive cells were counted, and quantified as the percentage (%) of total cells. (A–E) The experiments were performed with n ≥ 3 animals for each condition. Error bars represent the mean +/- s.d, with *p<0.05, **p<0.01, ****p<0.001. (F–G) Tibialis Anterior (TA) muscles of Rag2-/-:Il2rβ-/-:dmd/dmd mice were irradiated and grafted with 15.000 cells freshly isolated from Pax3GFP/+mice (Fresh) or cultured for 3 days in the absence (D3) or in the presence of both NAC and SB203580 (D3 NAC/SB). Three weeks after grafting, TA muscles were dissected and cryo-sections analysed by immunofluorescence. (F) Immunofluorescence for Dystrophin and (G) the number of Dystrophin-positive fibres was counted for each condition. (F–G) The experiments were performed with n ≥ 3 grafted TAs for each condition, and a representative image is shown, scale bar, 200 μm (F). (H–K) Tibialis Anterior (TA) muscles of Rag2-/-:IlrRβ-/-:dmd/dmd mice were irradiated and grafted with 15.000 cells isolated from Pax3GFP/+ mice and cultured for 3 days in the absence (ctrl) or in the presence of NAC, SB203580 (SB), or both NAC and SB203580 (NAC/SB). Three weeks after grafting, for each mouse, one TA muscle was subjected to injury by cardiotoxin injection, and the contralateral muscle was used as a control. Six weeks after grafting, all TA muscles were dissected. (I) Injured TA muscles were used for Pax3(GFP)-positive cell purification by flow cytometry and the number of cells counted for each condition. Non-injured TA muscles were analysed by immunofluorescence on cryo-sections (J) and the number of Dystrophin-positive fibres was counted for each condition (K). (H–K) The experiments were performed with n ≥ 2 grafted TAs for each condition, and a representative image is shown, scale bar, 200 μm (J). Error bars in (G, I, K) represent the mean number of Dystrophin-positive fibres per section (G, K) or of Pax3(GFP)-positive cells per muscle (I) + s.d, with *p<0.05. Please see Figure 6—figure supplement 1 for additional data.
-
Figure 6—source data 1
Numerical data used to generate Figure 6.
- https://doi.org/10.7554/eLife.32991.026
Figure 6—figure supplement 1
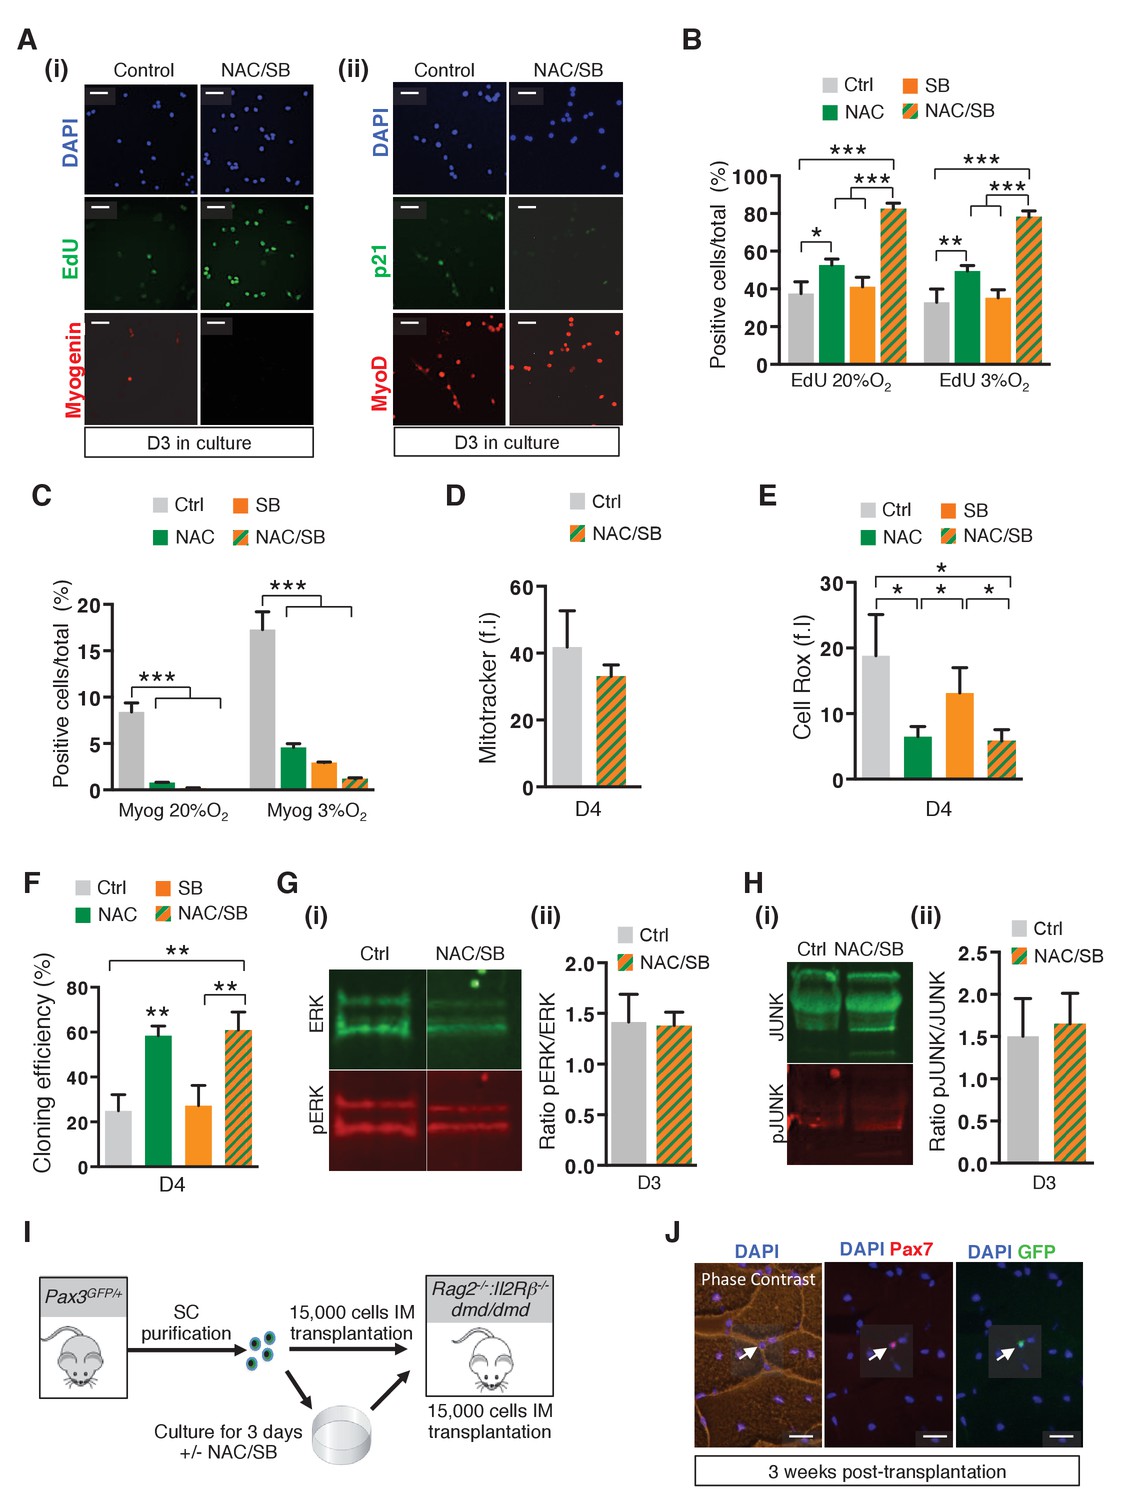
Alteration of the redox state of satellite cells modulates their survival and amplification in culture and their regenerative potential after grafting.
(A–H) GFP-positive cells isolated from the pectoralis, abdominal and diaphragm muscles by flow cytometry from Pax3GFP/+ adult mice were cultured for 3 to 4 days (D) in the absence (ctrl) or in the presence of 10 mM N-Acetyl Cysteine (NAC), or 5 μM SB203580 (SB), or in the presence of both NAC and SB (NAC/SB). (A) GFP-positive cells were cultured in the absence (control) or in the presence of both NAC and SB (NAC/SB). After 3 days of culture, cells were incubated with EdU, stained with DAPI (blue) and processed for EdU detection (green (i)) by fluorescence, or treated with antibodies to P21 (green (ii)) and Myogenin (red (i)) or MyoD (red (ii)) to detect protein expression by immunofluorescence. This experiment was performed with n ≥ 3 independent cultures, and a representative experiment is shown, Scale bar, 20 μm. (B, C) GFP-positive cells were cultured in the absence (ctrl) or in the presence of NAC, SB or both NAC and SB (NAC/SB) under 20% or 3% 02 conditions. After 3 days of culture, cells were incubated with EdU and processed for EdU detection by fluorescence (B), and for Myogenin detection by immunofluorescence (C). EdU (B) and Myogenin (Myog) (C) positive cells were counted, and quantified as the percentage (%) of total cells. (D, E) Cells were processed for quantification of mitochondrial content (D) and cytoplasmic ROS levels (E) expressed as fluorescence intensity (f.i) using Mitotracker (D) and Cell Rox (E) probes. (F) GFP-positive cells were cultured in clonal conditions and the cloning efficiency is expressed as the percentage of clones formed per initial number of cells. (B-F, G(ii), H(ii)) The experiments were performed with 3 independent cultures from 3 animals, and error bars represent the mean ± s.d, with *p<0.05 and **p<0.01. (G, H) GFP-positive cells isolated as in (A) were cultured in the absence (control) or in the presence of both NAC and SB (NAC/SB). After 3 days of culture, proteins were extracted from treated and untreated cells and processed for western-blot analyses, using antibodies directed against ERK (green, G(i)) and pERK (red, G(i)), or JUNK (green, H(i)) and pJUNK (red, H(i)). (G(ii), H(ii)) Quantification of western-blot analyses based on densitometry fluorescence scans indicates the levels of pERK (G(ii)) and pJUNK (H(ii)) relative to total ERK (G(ii)) and JUNK (H(ii)) proteins. (I) Scheme depicting grafting experiment shown in Figure 6F,G. Tibialis Anterior (TA) muscles of Rag2-/-:Il2rb -/-:dmd/dmd mice were irradiated and grafted with 15.000 cells freshly isolated from Pax3GFP/+mice or cultured for 3 days in the absence or in the presence of both NAC and SB203580 (NAC/SB). (J) Three weeks after grafting, cryosections were analysed by immunofluorescence using antibodies directed against Pax7 (red) and GFP (green). A representative experiment is shown here for cells treated with NAC and SB203580, Scale bar, 20 μm.
-
Figure 6—figure supplement 1—source data 1
Numerical data used to generate Figure 6—figure supplement 1.
- https://doi.org/10.7554/eLife.32991.025
Figure 7 with 1 supplement

Model for the regulation of proliferation and differentiation of muscle stem cells by their redox state.
This model represents redox regulation acting through p38α MAP kinase of a wild-type satellite cell as it progresses towards a differentiated myofibre. ROS levels, as indicated by effects observed for NAC but not SB, also probably impact the satellite cell, independently of p38α signalling. Please see Figure 7—figure supplement 1 for additional data.
Figure 7—figure supplement 1
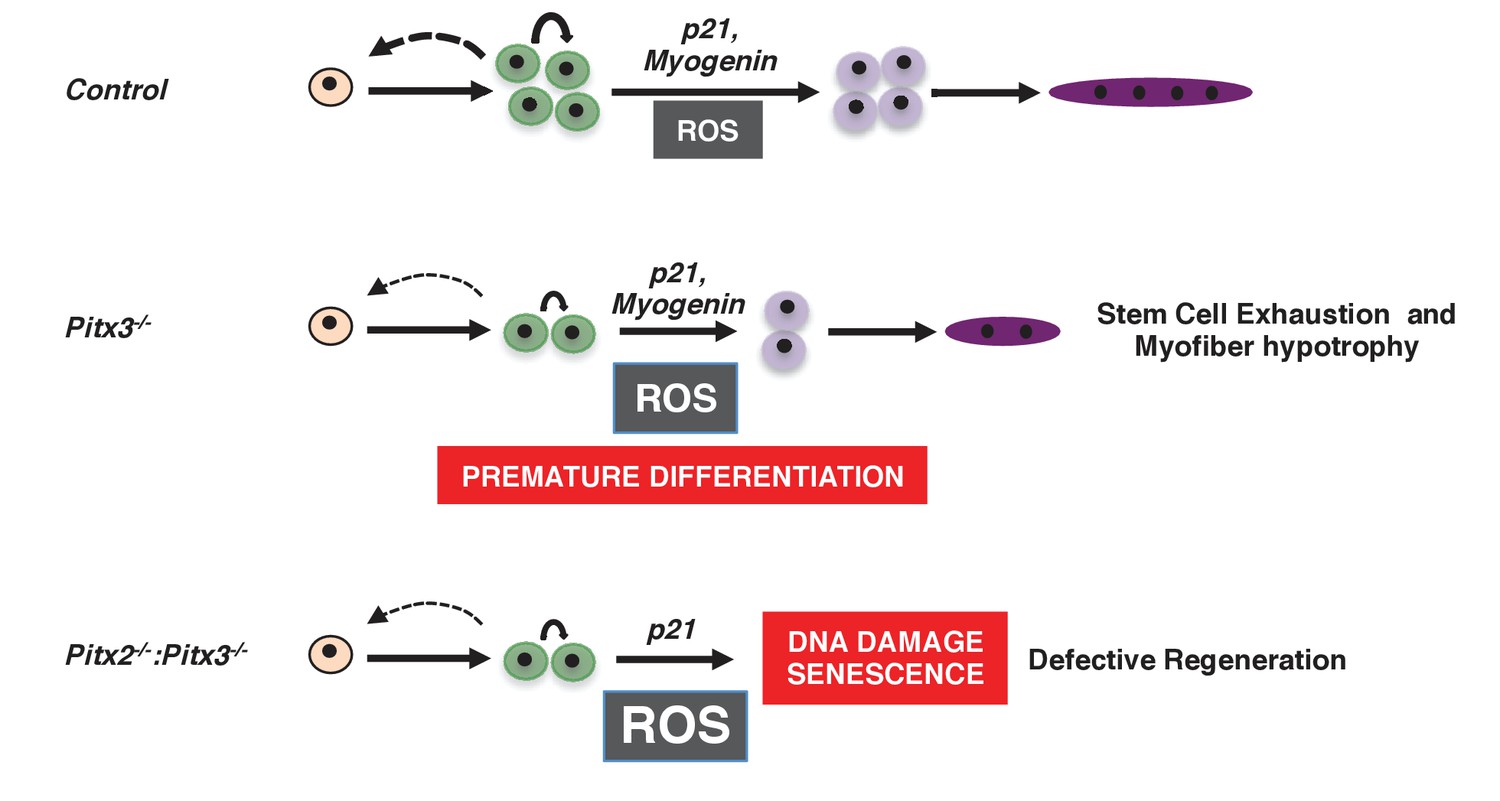
Consequences of altered ROS levels on satellite cell function during skeletal muscle regeneration.
These schemas show our proposed model for the progression of a satellite cell towards a differentiated myofibre during muscle regeneration in wild-type (Control), Pitx3 mutant (Pitx3-/-) and Pitx2/3 double mutant (Pitx2-/-:Pitx3-/-) mice. While a high ROS level in Pitx3 mutant satellite cells is responsible for their premature differentiation, very high ROS levels in the absence of both Pitx2 and Pitx3 lead to DNA damage, senescence and consequent defective differentiation and regeneration.
Additional files
-
Supplementary file 1
List of mouse lines and their use in the different experiments.
- https://doi.org/10.7554/eLife.32991.029
-
Supplementary file 2
List of mouse sequences used in qPCR.
Key Resource Table.
- https://doi.org/10.7554/eLife.32991.030
-
Transparent reporting form
- https://doi.org/10.7554/eLife.32991.031
Download links
A two-part list of links to download the article, or parts of the article, in various formats.
Downloads (link to download the article as PDF)
Open citations (links to open the citations from this article in various online reference manager services)
Cite this article (links to download the citations from this article in formats compatible with various reference manager tools)
The role of Pitx2 and Pitx3 in muscle stem cells gives new insights into P38α MAP kinase and redox regulation of muscle regeneration
eLife 7:e32991.
https://doi.org/10.7554/eLife.32991


